explaining china’s position in the global supply chain · explaining china’s position in the...
TRANSCRIPT
Please do not quote or cite
Explaining China’s Position in the Global Supply Chain
Judith M. Dean,* U.S. International Trade Commission K.C. Fung, University of California, Santa Cruz and USITC
Preliminary Draft: October 5, 2009
prepared for the Joint Symposium of U.S.-China Advanced Technology Trade
and Industrial Development
October 23-24, 2009 Tsinghua University
Beijing, China
We are grateful to Win Landrum for extensive work concording the data, and to Danielle Trachtenberg for superb assistance in concording, analyzing and assembling the final data, and producing tables and figures. *The views expressed in this paper are those of the authors alone. They do not necessarily reflect the views of the US International Trade Commission, or any of its individual Commissioners. Judith Dean, Office of Economics, USITC, 500 E St. SW, Washington, DC, 20436; Tel: 202-205-3051; Fax: 202-205-2340; [email protected]; http://works.bepress.com/judith_dean/. K. C. Fung, Dept. of Economics, UC Santa Cruz, Santa Cruz, CA, 95064; Tel: 831- 459-3273; Fax: 831-459-5077; [email protected]; http://people.ucsc.edu/~kcfung/

1. Introduction A large number of recent research papers on international trade focus on the
phenomenon of international production fragmentation, often also called the global supply
chain (Jones and Kierzkowski 2001, Deardorff 2005, Yi 2003). This form of global
production involves slicing the stages of production thinner and thinner and parceling out
each specialized stage to various geographic locations. Given the growing importance of
China as an emerging international trading powerhouse, there is now also a small but rapidly
evolving literature on the role of China in this global production chain (Athukorala and
Yamashita 2006, 2009; Dean, Fung and Wang, 2009; 1 Dean, Lovely and Mora, forthcoming;
Koopman, Wang and Wei, 2008; Wang and Wei, forthcoming; Xu and Lu, forthcoming).
A very useful concept in empirically gauging the importance of supply chain-related
trade for an economy is the notion of vertical specialization shares (Hummels, Ishii and Yi
2001). The use of vertical specialization shares (VS shares) for measuring the extent of
China’s participation in the global supply chain is particularly meaningful since China has an
unusually large proportion of trade in the form of processing trade: the policy regime
whereby inputs can be imported duty free as long as they are used for further assembly and
then exported. Two recent papers, Dean, Fung and Wang (DFW) (2009) and Koopman,
Wang and Wei (KWW) (2008) utilize this concept of VS shares to study the characteristics of
Chinese exports. These papers find IT related products, such as electronic computers,
telecommunication equipment, cultural and office equipment, telecommunication equipment,
and computer peripheral equipment, to be among China’s most vertically specialized exports.
Sectoral VS shares give us some indication of how far up China is along the global
value chain for various industries. A high VS share indicates that a substantial amount of the
content comes from abroad, suggesting that China is mainly engaged in final stages of
assembly. A low VS share indicates that a larger degree of the production process is being
done within China. This could mean some technological constraint on the degree of
1 Dean, Fung and Wang (2009) is a revised version of the earlier working paper, Judith M. Dean, K.C. Fung and Zhi Wang, “How Vertically Specialized is Chinese Trade?” USITC Working Paper No. 2008-09-D. (2008). http://www.usitc.gov/research_and_analysis/staff_products.htm#2008.
fragmentation in the industry, or that China is producing more of the stages of production
than simply final assembly. The evidence shown in DFW indicates that VS shares vary
extensively across Chinese industries.
But what explains China’s position in the global supply chain across these industries?
Antras (2005) posits that when a firm considers offshoring part of its production, two industry
characteristics play important roles in the decision: research and development (R &D)
spending and relative wages. If the product is new, and research and development (R&D)
accounts for a large share of the costs of production, then due to contract incompleteness,
transnational offshoring may not take place. Savings through offshoring the low-tech stages
of production are likely to be outweighed by the risk of low-quality, low-tech inputs. As the
product matures, and more stages of production are standardized, this risk diminishes
compared to the cost-savings from relatively cheaper labor inputs abroad. The ability to
reduce risk by producing offshore in an affiliate firm increases the likelihood of offshoring.
In this paper we make use of Antras’ theoretical model and the DFW estimates of
industrial VS shares to explain China’s position in the global supply chain. We adapt the
Antras model to a cross-section of industries at a single point in time, and econometrically
test the role of R&D intensity and relative wages in determining VS share. A cursory
examination of the data reveals patterns quite contrary to Antras’ predictions. However,
using a simple two-stage econometric model, we find strong evidence that in relatively R&D-
intensive industries, there is less offshoring to China, and very high foreign content in
Chinese processing exports. As R & D intensity falls, Chinese industries undertake more
processing trade, and that processing trade has lower foreign content, suggesting that more of
the stages of production take place in China. We also find that offshoring increases, for all
R&D intensities, if Chinese processing trade is conducted by foreign-invested firms (FIEs).
The rest of the paper will be organized as follows: in the next section, we discuss
several papers that are relevant to our analysis.. We examine the model by Antras (2005) in
more detail in section 3, and use it to explore the VS share data in section 4. Section 5
2

presents the econometric analysis and results, with extensions in section VI. The last section
concludes.
2. Literature and Background
Vertical specialization refers to the proportion of imported intermediate goods
contained in an economy’s exports. Imported intermediate goods are used in successive
rounds of production in an economy, often in combination with other domestically produced
inputs. Measuring the extent of production fragmentation requires the use of the economy’s
input-output tables, to capture the uses of imported intermediates in various rounds of
production--the “cumulative use” of imported inputs.2 It also requires accurate identification
of imported intermediates under both types of processing trade: “processing and assembly,”
under which inputs are imported but remain under the foreign party’s control; “processing
with imported inputs,” under which the ownership of the inputs is given to the producers in
China.
DFW (2009) combine the use of processing import and export data with the use of
input-output tables to measure the VS shares of Chinese trade for two years, 1997 and 2002.3
To capture the additional complications arising from different intensities of imported inputs in
processing and non-processing trade, the DFW study also measures VS shares using the
separate inferred input-output tables for processing and non-processing trade developed in the
KWW study.4 Figures 1 and 2 reproduce a sample of DFW’s VS share estimates using both
methods (denoted non-split and split, respectively) for Chinese merchandise exports in 2002.5
As shown in figure 1, the highest VS shares, under either method, are largely in IT-
related products: electronic computers, cultural and office equipment, telecommunications
equipment, computer peripheral equipment, electronic elements and devices, radio, TV and
other communications equipment. High VS shares indicate very little Chinese content, and
2 Specifically, we use the Leontief inverse matrix to capture the total, cumulative use of imported intermediates in the production of exports. 3 1997 and 2002 are the two latest years when the benchmark Chinese input-output tables were available. 4 Koopman, Wang and Wei (2008) use an algorithm to split the official input-output tables into two tables, one for processing trade and one for non-processing trade. 5 Figure 1 and 2 are taken from Figures 5a and 5b from Dean, Fung and Wang (2008).
3

suggest that China is actually at the low-tech assembly end of the supply chain. But there are
large differences in the positions of the supply chain across sectors. Over all industries
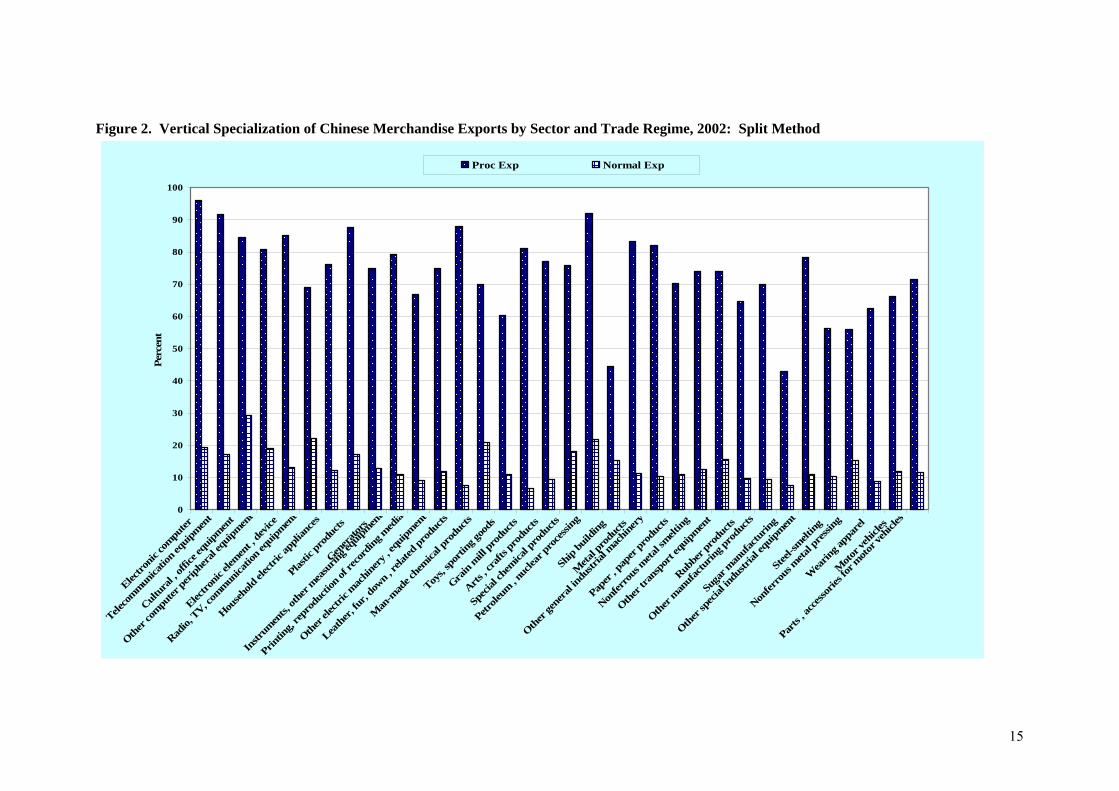
exporting merchandise, DFW find split VS shares ranging from 4.3% to 95.4%. In Figure 2,
DFW highlight the distinction between VS shares for processing and normal exports. They
find a correlation of 0.89 between an industry’s VS share and the share of processing exports
in that industry’s total exports. Thus, industries heavily involved in processing exports
typically have very high foreign content in their exports.
Evidence on the firm’s choice to offshore production is found in Feenstra and Hanson
(2005). They present a rich model that tests some of the elements of property rights theory as
well as the Chinese incentive system framework. In their model, a multinational firm has
already decided to set up an export-processing plant in a relatively low-wage country. The
firm faces the problem of reducing costs by offshoring vs. providing sufficient incentives to
the processing plant to produce a high quality input. The multinational has two tools at
her/his disposal to maximize the joint surplus from the supply-chain arrangement: control
over the inputs and ownership of the firm. Feenstra and Hanson apply this model to China,
using the share of processing trade accounted for by each possible factory control/input
control pair to represent the probability that a particular contractual arrangement is chosen.
Comparing these shares in China’s total processing exports over the period 1997–2002, they
found that multinational firms tended to split ownership of the factories and input control.
The most common arrangement was to have the foreigner own the factory (an affiliate firm)
and the Chinese control the inputs (processing with imported inputs).
Some additional evidence on contractual arrangements in global supply chains is
found in Dean, Lovely and Mora (2009). These authors apply the Feenstra-Hanson analysis
to US-China and Japan-China processing trade. They found that in 1996, the two most
common arrangements for processing exports to the U.S. were foreign-owned factories with
Chinese control over inputs (66%) and Chinese owned factories with foreign control over
inputs (25%). For Japan, these figures were 56.% and 17.8% , respectively. By 2007 the
foreign factory control/Chinese input control arrangement accounted for almost 75% of the
4
processing exports from China to the US and China to Japan. There was also a growing share
of foreign factory control/foreign input control (processing and assembly). Delving deeper,
Dean, Lovely and Mora found that the choice of foreign factory ownership was also
important. For processing exports to both the US and Japan, more than 50% came from
wholly-owned foreign factories with Chinese control over the inputs. However, processing
exports to Japan were somewhat more likely to come from wholly-owned foreign factories
with foreign control over the inputs, than those to the US.
3. Product Cycle of Offshoring
Antras (2005) proposes a theory of international offshoring that will motivate our
econometric work. In this model, a product is produced by combining a high-tech input and a
low-tech input. The high-tech input is produced in the North (e.g., the US), which has a
comparative advantage in R&D intensive goods. The low-tech input can either be produced
in the North or the South (e.g., China). With relatively lower wages in China, the low-tech
input would normally be produced in China. However, Antras introduces contractual
incompleteness, which limits the initial degree of production fragmentation. With increased
standardization of the product, the production of low-tech input will then be shifted to the
South. As will be discussed below, relative wages and the characteristics of the industries at
the moment of the decision are among the factors that determine the extent of international
production sharing. Foreign direct investment is also important, since foreign control over the
factory can ameliorate the risk generated by incomplete contracts.
Antras makes the standard assumption that there is only contract incompleteness
when the North chooses to locate the production of the low-tech input in China. Contract
incompleteness occurs because the northern research center cannot guarantee that the
southern manufacturing center will produce a good quality intermediate good. This results in
underinvestment in both inputs. If the product is new, and thus uses the high-tech input
intensively, this distortion becomes more severe if the research and development center has
lower bargaining power over the joint surplus. Conversely, if the product uses the low-tech
input intensively, then the distortion is more severe if the southern manufacturing plant has
5
lower bargaining power. As the product becomes more standardized, it becomes more
intensive in the use of the low-tech input. There is a critical level of this intensity such that
the relative wage advantage of the South overcomes the risk of a low-quality input. Thus,
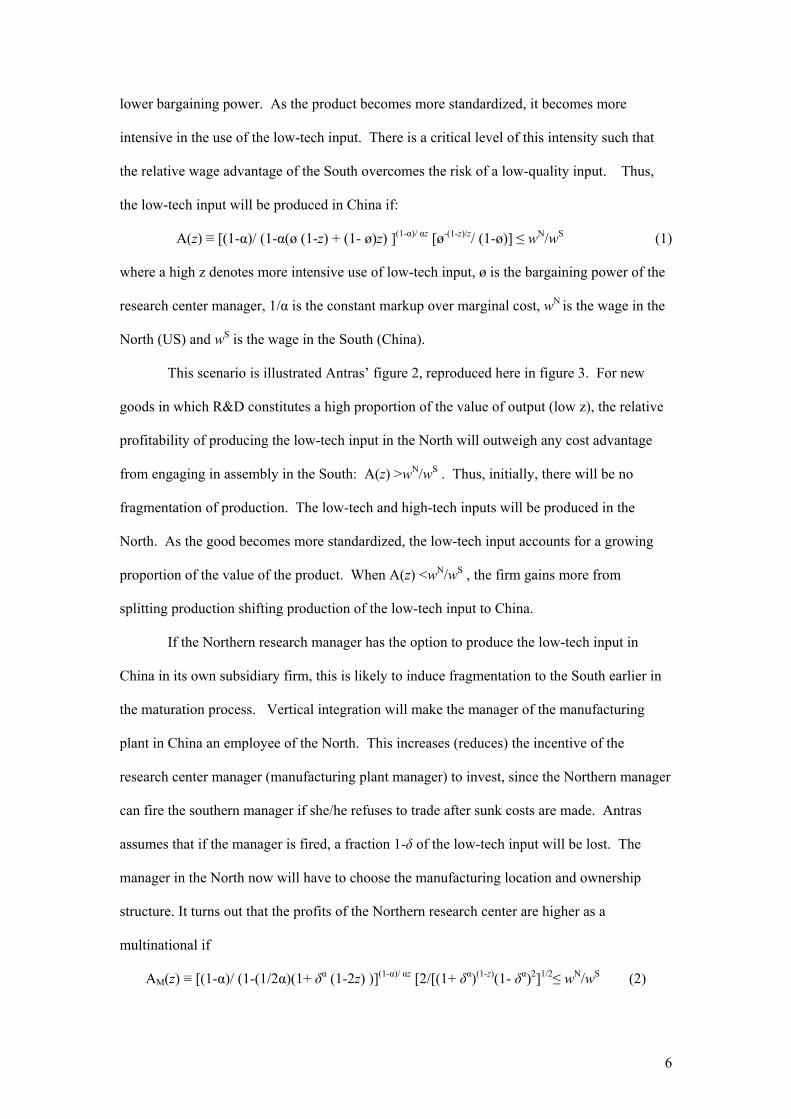
the low-tech input will be produced in China if:
A(z) ≡ [(1-α)/ (1-α(ø (1-z) + (1- ø)z) ](1-α)/ αz [ø-(1-z)/z/ (1-ø)] ≤ wN/wS (1)
where a high z denotes more intensive use of low-tech input, ø is the bargaining power of the
research center manager, 1/α is the constant markup over marginal cost, wN is the wage in the
North (US) and wS is the wage in the South (China).
This scenario is illustrated Antras’ figure 2, reproduced here in figure 3. For new
goods in which R&D constitutes a high proportion of the value of output (low z), the relative
profitability of producing the low-tech input in the North will outweigh any cost advantage
from engaging in assembly in the South: A(z) >wN/wS . Thus, initially, there will be no
fragmentation of production. The low-tech and high-tech inputs will be produced in the
North. As the good becomes more standardized, the low-tech input accounts for a growing
proportion of the value of the product. When A(z) <wN/wS , the firm gains more from
splitting production shifting production of the low-tech input to China.
If the Northern research manager has the option to produce the low-tech input in
China in its own subsidiary firm, this is likely to induce fragmentation to the South earlier in
the maturation process. Vertical integration will make the manager of the manufacturing
plant in China an employee of the North. This increases (reduces) the incentive of the
research center manager (manufacturing plant manager) to invest, since the Northern manager
can fire the southern manager if she/he refuses to trade after sunk costs are made. Antras
assumes that if the manager is fired, a fraction 1-δ of the low-tech input will be lost. The
manager in the North now will have to choose the manufacturing location and ownership
structure. It turns out that the profits of the Northern research center are higher as a
multinational if
AM(z) ≡ [(1-α)/ (1-(1/2α)(1+ δα (1-2z) )](1-α)/ αz [2/[(1+ δα)(1-z)(1- δα)2]1/2≤ wN/wS (2)
6
where the other parameters are the same as in (1). With (2), the North would prefer to
offshore to China in the form of a multinational. There is a further choice for the Northern
research center, i.e. to have China produce the low-tech input either via an integrated firm
(multinational) or via an independent assembler in China. If AM(z) < A(z) , assembly will be
done by U.S. affiliate. If AM(z) > A(z), the low-tech input will be produced by an independent
firm in China instead.
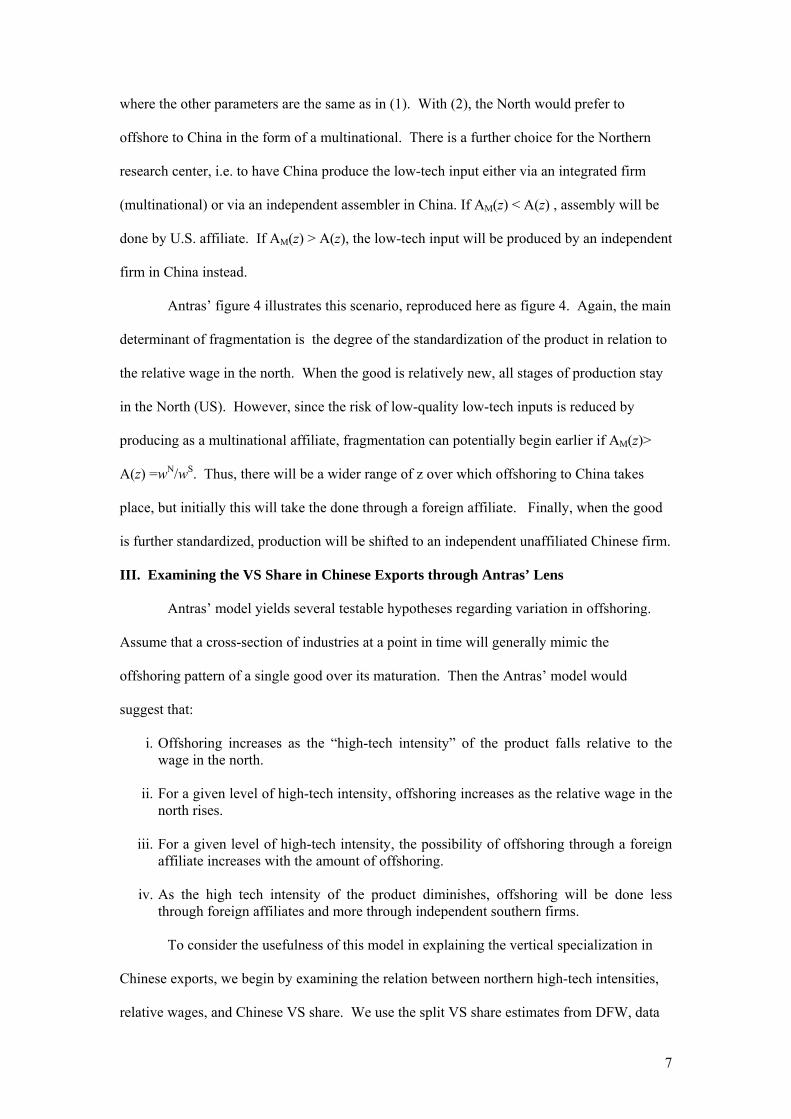
Antras’ figure 4 illustrates this scenario, reproduced here as figure 4. Again, the main
determinant of fragmentation is the degree of the standardization of the product in relation to
the relative wage in the north. When the good is relatively new, all stages of production stay
in the North (US). However, since the risk of low-quality low-tech inputs is reduced by
producing as a multinational affiliate, fragmentation can potentially begin earlier if AM(z)>
A(z) =wN/wS. Thus, there will be a wider range of z over which offshoring to China takes
place, but initially this will take the done through a foreign affiliate. Finally, when the good
is further standardized, production will be shifted to an independent unaffiliated Chinese firm.
III. Examining the VS Share in Chinese Exports through Antras’ Lens
Antras’ model yields several testable hypotheses regarding variation in offshoring.
Assume that a cross-section of industries at a point in time will generally mimic the
offshoring pattern of a single good over its maturation. Then the Antras’ model would
suggest that:
i. Offshoring increases as the “high-tech intensity” of the product falls relative to the wage in the north.
ii. For a given level of high-tech intensity, offshoring increases as the relative wage in the
north rises.
iii. For a given level of high-tech intensity, the possibility of offshoring through a foreign affiliate increases with the amount of offshoring.
iv. As the high tech intensity of the product diminishes, offshoring will be done less
through foreign affiliates and more through independent southern firms. To consider the usefulness of this model in explaining the vertical specialization in
Chinese exports, we begin by examining the relation between northern high-tech intensities,
relative wages, and Chinese VS share. We use the split VS share estimates from DFW, data
7
on Chinese industry characteristics, such as employment and wages, from the NBS Industrial
Enterprise Survey, and trade data from China Customs. These data are then concorded to
ISIC Revision 3 at the 4-digit level.6 To proxy the high-tech intensity of northern industries,
we use US 2002 R & D expenditures as a percent of output (current value) in each sector,
from the OECD.7
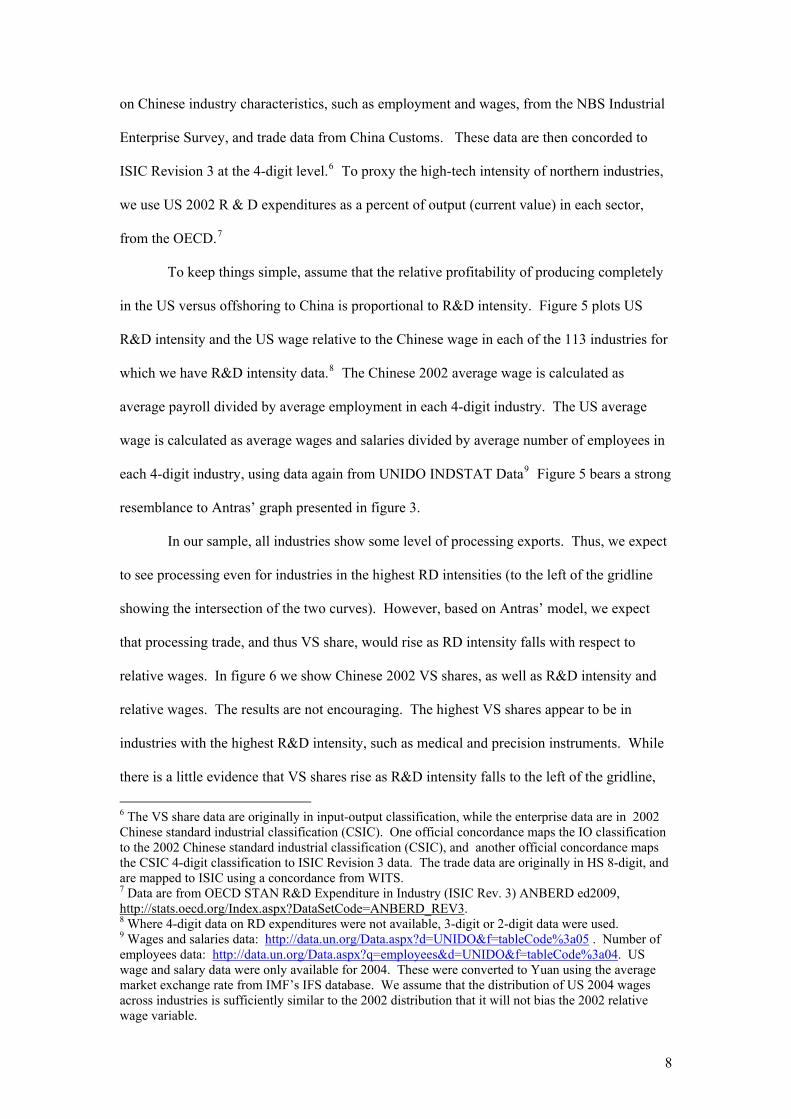
To keep things simple, assume that the relative profitability of producing completely
in the US versus offshoring to China is proportional to R&D intensity. Figure 5 plots US
R&D intensity and the US wage relative to the Chinese wage in each of the 113 industries for
which we have R&D intensity data.8 The Chinese 2002 average wage is calculated as
average payroll divided by average employment in each 4-digit industry. The US average
wage is calculated as average wages and salaries divided by average number of employees in
each 4-digit industry, using data again from UNIDO INDSTAT Data9 Figure 5 bears a
resemblance to Antras’ graph presented in figure 3.
strong
In our sample, all industries show some level of processing exports. Thus, we expect
to see processing even for industries in the highest RD intensities (to the left of the gridline
showing the intersection of the two curves). However, based on Antras’ model, we expect
that processing trade, and thus VS share, would rise as RD intensity falls with respect to
relative wages. In figure 6 we show Chinese 2002 VS shares, as well as R&D intensity and
relative wages. The results are not encouraging. The highest VS shares appear to be in
industries with the highest R&D intensity, such as medical and precision instruments. While
there is a little evidence that VS shares rise as R&D intensity falls to the left of the gridline,
6 The VS share data are originally in input-output classification, while the enterprise data are in 2002 Chinese standard industrial classification (CSIC). One official concordance maps the IO classification to the 2002 Chinese standard industrial classification (CSIC), and another official concordance maps the CSIC 4-digit classification to ISIC Revision 3 data. The trade data are originally in HS 8-digit, and are mapped to ISIC using a concordance from WITS. 7 Data are from OECD STAN R&D Expenditure in Industry (ISIC Rev. 3) ANBERD ed2009, http://stats.oecd.org/Index.aspx?DataSetCode=ANBERD_REV3. 8 Where 4-digit data on RD expenditures were not available, 3-digit or 2-digit data were used. 9 Wages and salaries data: http://data.un.org/Data.aspx?d=UNIDO&f=tableCode%3a05 . Number of employees data: http://data.un.org/Data.aspx?q=employees&d=UNIDO&f=tableCode%3a04. US wage and salary data were only available for 2004. These were converted to Yuan using the average market exchange rate from IMF’s IFS database. We assume that the distribution of US 2004 wages across industries is sufficiently similar to the 2002 distribution that it will not bias the 2002 relative wage variable.
8
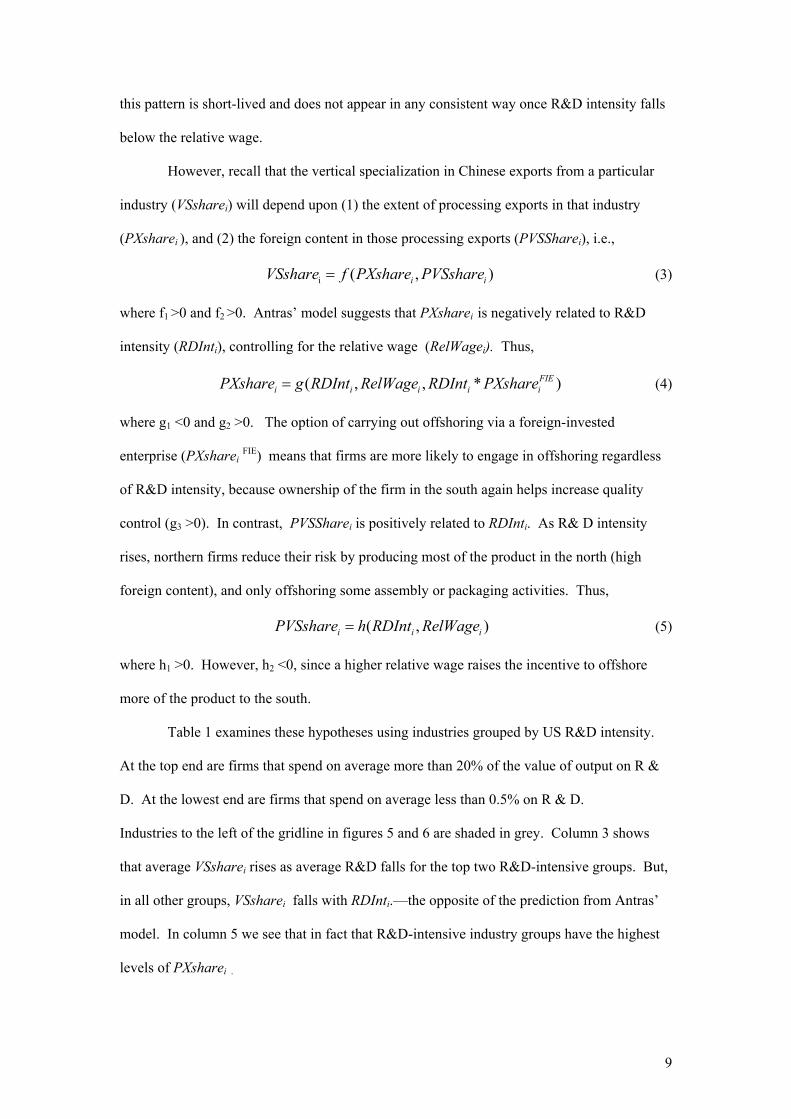
this pattern is short-lived and does not appear in any consistent way once R&D intensity falls
below the relative wage.
However, recall that the vertical specialization in Chinese exports from a particular
industry (VSsharei) will depend upon (1) the extent of processing exports in that industry
(PXsharei ), and (2) the foreign content in those processing exports (PVSSharei), i.e.,
i ( ,iVSshare f PXshare PVSshare= )i
)i
)i
(3)
where f1 >0 and f2 >0. Antras’ model suggests that PXsharei is negatively related to R&D
intensity (RDInti), controlling for the relative wage (RelWagei). Thus,
( , , * FIEi i i iPXshare g RDInt RelWage RDInt PXshare= (4)
where g1 <0 and g2 >0. The option of carrying out offshoring via a foreign-invested
enterprise (PXsharei FIE) means that firms are more likely to engage in offshoring regardless
of R&D intensity, because ownership of the firm in the south again helps increase quality
control (g3 >0). In contrast, PVSSharei is positively related to RDInti. As R& D intensity
rises, northern firms reduce their risk by producing most of the product in the north (high
foreign content), and only offshoring some assembly or packaging activities. Thus,
( ,i iPVSshare h RDInt RelWage= (5)
where h1 >0. However, h2 <0, since a higher relative wage raises the incentive to offshore
more of the product to the south.
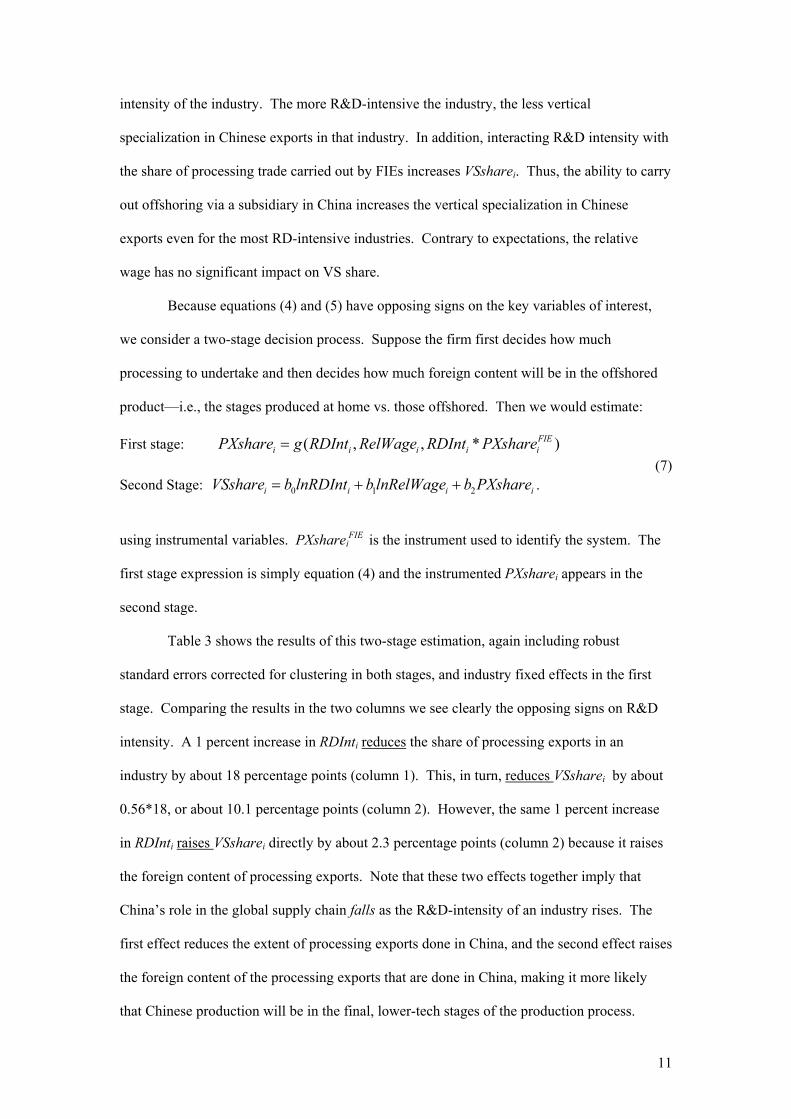
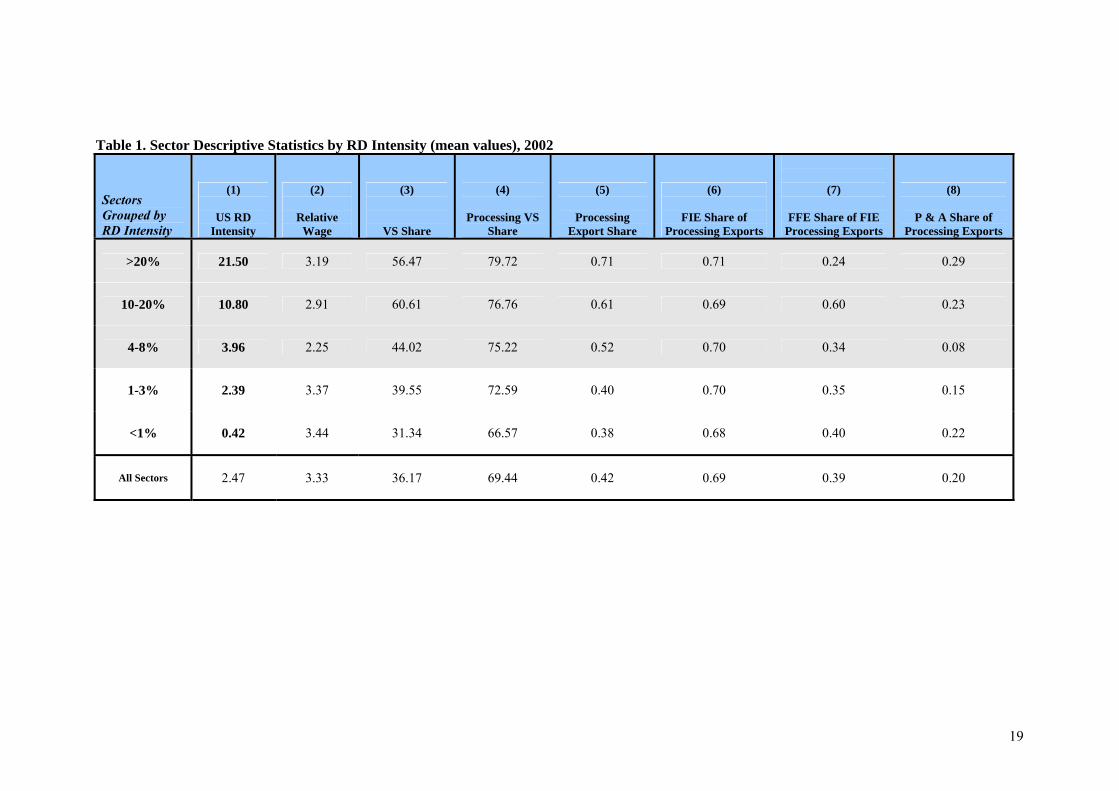
Table 1 examines these hypotheses using industries grouped by US R&D intensity.
At the top end are firms that spend on average more than 20% of the value of output on R &
D. At the lowest end are firms that spend on average less than 0.5% on R & D.
Industries to the left of the gridline in figures 5 and 6 are shaded in grey. Column 3 shows
that average VSsharei rises as average R&D falls for the top two R&D-intensive groups. But,
in all other groups, VSsharei falls with RDInti.—the opposite of the prediction from Antras’
model. In column 5 we see that in fact that R&D-intensive industry groups have the highest
levels of PXsharei .
9

The predictions that the most R&D-intensive industries will have the highest
PVSSharei. (the highest foreign content) is evident in column 4 of table 3. China produces
only the last link in the global chain in these industries--a small portion of the value of the
product. There is little evidence that the R&D-intensive industries conduct more processing
through FIEs (column 6), nor that they choose a wholly-owned subsidiary (“fully-funded
enterprise,” or FFE) more often than the other industry groups (column 7). But column 8
does show some evidence that R&D-intensive firms preserve control over their offshored
inputs by relying more on the “processing and assembly” customs regime than other industry
groups.
IV. An econometric investigation
If we treat the decision to engage in offshoring and the decision regarding how much
of the product to produce offshore as a simultaneous one, we can insert equations (4) and (5)
into (3) to yield:
0 1 2 * FIEi i i iVSshare a lnRDInt a lnRelWage a lnRDInt PXshare= + + i
(6)
where ln indicates natural log and PXshareiFIE is measured as the proportion of processing
exports conducted by FIEs in China.10 Since the signs on lnRDInti and on lnRelWagei are
opposite in equations (4) and (5), the net result is not predictable a priori. We first estimate
(6) using GLS, including industry fixed effects (defined at the two-digit level) and robust
standard errors corrected for industry clustering.
The first column in table 2 shows results for equation (3), confirming our expectation
that VS Share is a positive function both of PXsharei .and PVSSharei. These results suggest
that the VSsharei in Chinese exports responds much more to an increase in the foreign content
of processing exports than to an increase in the share of processing exports in an industry.
The second column in table 2 shows the results for equation (6). Here we find strong
evidence supporting Antras’ predictions. VSsharei is strongly negatively related to the R&D
10 Chinese customs data do not report the parent firm’s country of origin. Thus, we cannot measure the share of an industry’s processing exports by US FIEs, but only the share of an industry’s processing exports by FIEs from all source countries.
10
intensity of the industry. The more R&D-intensive the industry, the less vertical
specialization in Chinese exports in that industry. In addition, interacting R&D intensity with
the share of processing trade carried out by FIEs increases VSsharei. Thus, the ability to carry
out offshoring via a subsidiary in China increases the vertical specialization in Chinese
exports even for the most RD-intensive industries. Contrary to expectations, the relative
wage has no significant impact on VS share.
Because equations (4) and (5) have opposing signs on the key variables of interest,
we consider a two-stage decision process. Suppose the firm first decides how much
processing to undertake and then decides how much foreign content will be in the offshored
product—i.e., the stages produced at home vs. those offshored. Then we would estimate:
First stage: ( , , * FIEi i i iPXshare g RDInt RelWage RDInt PXshare= )i
i
(7) Second Stage: . 0 1 2i i iVSshare b lnRDInt b lnRelWage b PXshare= + +
using instrumental variables. PXshareiFIE
is the instrument used to identify the system. The
first stage expression is simply equation (4) and the instrumented PXsharei appears in the
second stage.
Table 3 shows the results of this two-stage estimation, again including robust
standard errors corrected for clustering in both stages, and industry fixed effects in the first
stage. Comparing the results in the two columns we see clearly the opposing signs on R&D
intensity. A 1 percent increase in RDInti reduces the share of processing exports in an
industry by about 18 percentage points (column 1). This, in turn, reduces VSsharei by about
0.56*18, or about 10.1 percentage points (column 2). However, the same 1 percent increase
in RDInti raises VSsharei directly by about 2.3 percentage points (column 2) because it raises
the foreign content of processing exports. Note that these two effects together imply that
China’s role in the global supply chain falls as the R&D-intensity of an industry rises. The
first effect reduces the extent of processing exports done in China, and the second effect raises
the foreign content of the processing exports that are done in China, making it more likely
that Chinese production will be in the final, lower-tech stages of the production process.
11
12
The results for the relative wage in both columns of table 3 are the opposite of what
we would have expected given our model. This may be due to the fact that the wage itself is
endogenous, and is a function of both R&D intensity and the ownership of the firm doing the
offshoring. In addition, as we noted earlier, there are in reality several ways in which
northern firms can reduce the risk of offshoring. We have yet to incorporate the firms’ ability
to retain control over the inputs via choosing the Chinese processing and assembly customs
regime. Nor have we incorporated the firms’ ability to choose offshoring via a wholly-owned
subsidiary, joint venture, or an independent Chinese firm. These extensions will be explored
next.
V. Extensions (to be completed)
VI. Conclusions (to be completed)
References Antras, P. “Incomplete Contracts and the Product Cycle,” American Economic Review, 2005. Athukorala, P. and Y. N. Yamashita, 2006, “Production Fragmentation and Trade Integration: East Asia in a Global Context,” North American Journal of Economics and Finance, 17:233-256. Athukorala, P., 2009. “China’s Impact on Foreign Trade and Investment in Other Asian Countries,” ANU, RSPAS Working Paper No. 2009/04. Dean, J. M., K.C. Fung and Z.Wang, 2009, “Measuring Vertical Specialization: the Case of China,” revision of USITC Working Paper No. 2008-09-D. Dean, J. M., M. E. Lovely and J. Mora, “Decomposing China-Japan-U.S. Trade: Vertical Specialization, Ownership and Organization Form,” Journal of Asian Economics, forthcoming (online 2009). Deardorff, A. 2005, “Gains from Trade and Fragmentation,” mimeo, University of Michigan, Ann Arbor. Hummels, D., J. Isshii and K. Yi, 2001, “The Nature and growth of Vertical Specialization in World Trade, “ Journal of International Economics, 54:75:96. Jones, R. and H. Kierzkowski, 2001, “A Framework for Fragmentation,” in S. Arndt and H. Kierzkowski, eds. Fragmentation, Oxford, Oxford University Press. Koopman, R., Z. Wang and S.Wei, 2008, “How Much of Chinese Exports is Really Made in China? Assessing Foreign and Domestic Value Added in Gross Exports,” USITC Working Paper No. 2008-03-B. Wang, Z. and S. Wei, forthcoming. “What Accounts for the Rising Sophistication of China’s Exports?” in Feenstra, R. and S. Wei (eds.), China's Growing Role in World Trade, University of Chicago Press. Yi, K., 2003, “Can Vertical Specialization Explain the Growth of World Trade?” Journal of Political Economy, vol. 111,1:52-102. Xu, B. and J. Lu, forthcoming. “Foreign Direct Investment, Processing Trade, and the Sophistication of China's Exports,” China Economic Review (online Feb. 2009).
13
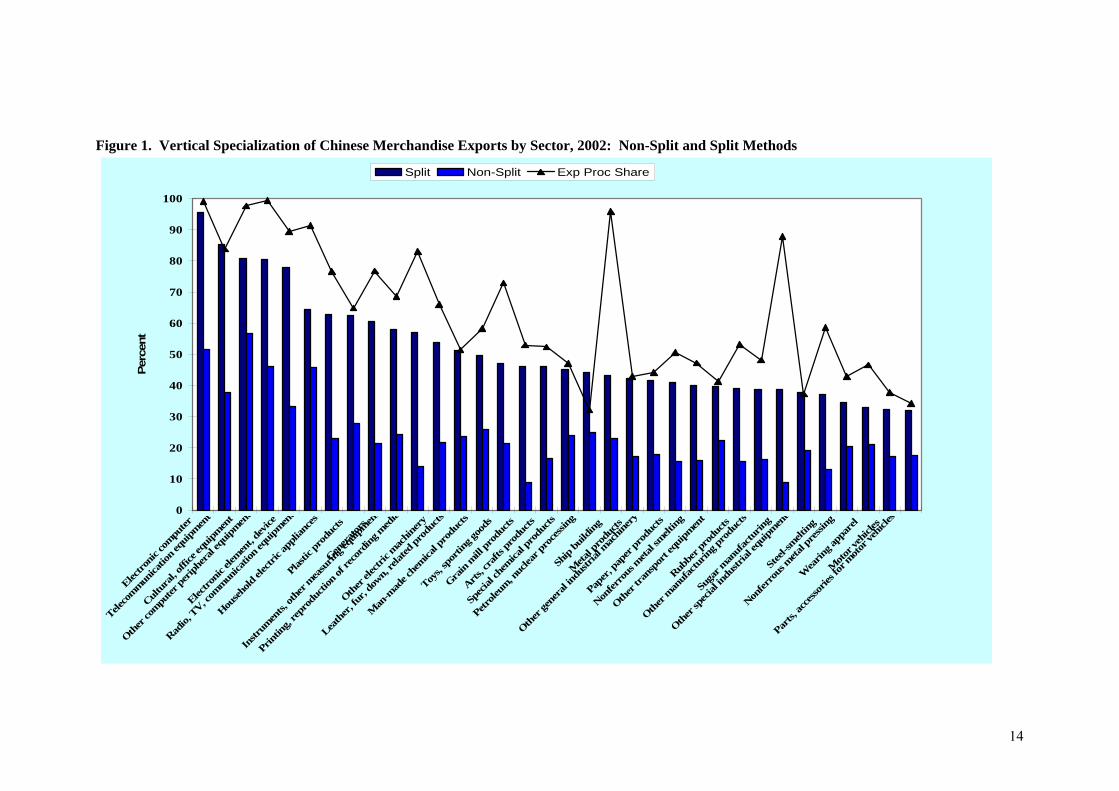
Figure 1. Vertical Specialization of Chinese Merchandise Exports by Sector, 2002: Non-Split and Split Methods
0
10
20
30
40
50
60
70
80
90
100
Electro
nic co
mputer
Teleco
mmunica
tion e
quipm
ent
Cultur
al, of
fice e
quipm
ent
Other
compu
ter pe
riphe
ral e
quipm
ent
Electro
nic el
emen
t, dev
ice
Radio,
TV, c
ommun
icatio
n equ
ipmen
t
Househ
old el
ectri
c app
lianc
es
Plastic
prod
ucts
Gener
ators
Instr
umen
ts, ot
her m
easu
ring e
quipm
ent
Printin
g, re
prod
uctio
n of r
ecor
ding m
edia
Other
elec
tric m
achin
ery
Leath
er, fu
r, do
wn, re
lated
prod
ucts
Man
-mad
e che
mical p
rodu
cts
Toys,
spor
ting g
oods
Grain
mill pr
oduc
ts
Arts, c
rafts
prod
ucts
Spec
ial ch
emica
l pro
ducts
Petrole
um, n
uclea
r pro
cessi
ngSh
ip bu
ilding
Meta
l pro
ducts
Other
gene
ral in
dustr
ial m
achin
ery
Paper
, pap
er pr
oduc
ts
Nonfer
rous
meta
l smelt
ing
Other
tran
spor
t equ
ipmen
t
Rubbe
r pro
ducts
Other
man
ufac
turin
g pro
ducts
Suga
r man
ufac
turin
g
Other
spec
ial in
dustr
ial eq
uipmen
tSt
eel-s
melting
Nonfer
rous
meta
l pre
ssing
Wea
ring a
ppar
el
Moto
r veh
icles
Parts,
acce
ssorie
s for
moto
r veh
icles
Perc
ent
Split Non-Split Exp Proc Share
14
15
Figure 2. Vertical Specialization of Chinese Merchandise Exports by Sector and Trade Regime, 2002: Split Method
0
10
20
30
40
50
60
70
80
90
100
Electro
nic co
mputer
Teleco
mmunica
tion e
quipm
ent
Cultur
al , o
ffice
equip
ment
Other
compu
ter pe
riphe
ral e
quipm
ent
Electro
nic el
emen
t , de
vice
Radio,
TV, c
ommun
icatio
n equ
ipmen
t
Househ
old el
ectri
c app
lianc
es
Plastic
prod
ucts
Gener
ators
Instr
umen
ts, ot
her m
easu
ring e
quipm
ent
Printin
g, re
prod
uctio
n of r
ecor
ding m
edia
Other
elec
tric m
achin
ery ,
equip
ment
Leath
er, fu
r, do
wn , re
lated
prod
ucts
Man
-mad
e che
mical p
rodu
cts
Toys,
spor
ting g
oods
Grain
mill pr
oduc
ts
Arts , c
rafts
prod
ucts
Spec
ial ch
emica
l pro
ducts
Petrole
um , n
uclea
r pro
cessi
ngSh
ip bu
ilding
Meta
l pro
ducts
Other
gene
ral in
dustr
ial m
achin
ery
Paper
, pap
er pr
oduc
ts
Nonfer
rous
meta
l smelt
ing
Other
tran
spor
t equ
ipmen
t
Rubbe
r pro
ducts
Other
man
ufac
turin
g pro
ducts
Suga
r man
ufac
turin
g
Other
spec
ial in
dustr
ial eq
uipmen
t
Stee
l-smelt
ing
Nonfer
rous
meta
l pre
ssing
Wea
ring a
ppar
el
Moto
r veh
icles
Parts
, acc
essor
ies fo
r moto
r veh
icles
Perc
ent
Proc Exp Normal Exp
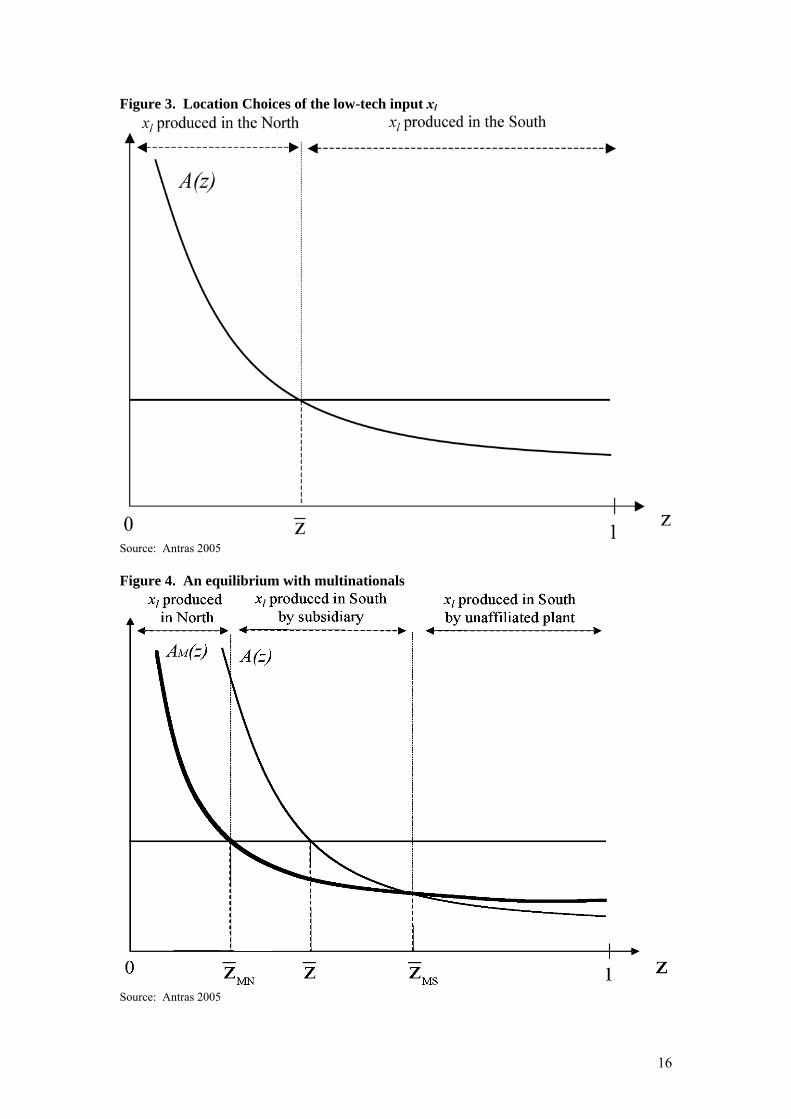
Figure 3. Location Choices of the low-tech input xl
Source: Antras 2005 Figure 4. An equilibrium with multinationals
Source: Antras 2005
16

Figure 5: US R&D Intensity and US-China Relative Wages, 2002
0
2
4
6
8
10
12
14
16
18
20
22
24
3313
3330
3312
3230
2423
3520
3420
3410
2919
2922
2926
2927
2911
2914
2921
2430
2424
2411
2429
3150
3190
3130
2511
2520
3691
3694
3692
2102
2221
2310
2813
2811
2893
1514
1520
1600
1544
1513
1554
1542
1552
1532
2693
2692
2696
2694
1810
1920
1911
1723
1729
1722
1912
3599
3512
3591
2720
1712
2891
1820
RD
Inte
nsity
in p
erce
nt
0
4
8
12
16
20
24
US W
age (yuan)/Chinese w
age (yuan)
USRDint RelWage02
17

Figure 6: VS Share in Chinese Exports by Sector, 2002
0
10
20
30
40
50
60
70
80
90
100
3313
3330
3312
3230
2423
3520
3420
3410
2919
2922
2926
2927
2911
2914
2921
2430
2424
2411
2429
3150
3190
3130
2511
2520
3691
3694
3692
2102
2221
2310
2813
2811
2893
1514
1520
1600
1544
1513
1554
1542
1552
1532
2693
2692
2696
2694
1810
1920
1911
1723
1729
1722
1912
3599
3512
3591
2720
1712
2891
1820
RD
Inte
nsity
and
VS
Shar
e in
per
cent
0
5
10
15
20
25
US w
age (yuan)/Chinese w
age (yuan)
VS Share US RD Intensity Rel Wage
18
19
Table 1. Sector Descriptive Statistics by RD Intensity (mean values), 2002
Sectors Grouped by RD Intensity
(1)
US RD Intensity
(2)
Relative Wage
(3)
VS Share
(4)
Processing VS
Share
(5)
Processing Export Share
(6)
FIE Share of Processing Exports
(7)
FFE Share of FIE Processing Exports
(8)
P & A Share of Processing Exports
>20% 21.50 3.19 56.47 79.72 0.71 0.71 0.24 0.29
10-20% 10.80 2.91 60.61 76.76 0.61 0.69 0.60 0.23
4-8% 3.96 2.25 44.02 75.22 0.52 0.70 0.34 0.08
1-3% 2.39 3.37 39.55 72.59 0.40 0.70 0.35 0.15
<1% 0.42 3.44 31.34 66.57 0.38 0.68 0.40 0.22
All Sectors 2.47 3.33 36.17 69.44 0.42 0.69 0.39 0.20

Table 2. The Determinants of VS Share in Chinese 2002 Exports, by Sector
Equation (3) Equation (6) Dependent var: VS Share GLS GLS
Processing VS Share 0.21** (4.72)
Processing Export Share 0.44** (4.38)
ln US R&D Intensity -8.26** (-3.61)
ln Relative Wage -3.96 (-0.54)
ln US RD Intensity * FIE Share of Processing Exports 9.28**
(2.87)
Constant -11.75 (-1.65)
28.67** (3.10)
Industry effects yes yes
Clustering yes yes
Obs 112 100 R2 0.87 0.80
Root MSE 6.75 8.39 ** and * indicate significance at the 1% and 5% levels, respectively.
20

21
Table 3. The Determinants of VS Share in Chinese 2002 Exports: Two Stage Decision
(6) (6)
IV First Stage (t-statistics)
IV Second Stage (z-statistics)
Dependent Variable Processing Export Share VS Share
ln US R&D Intensity -18.21** (-4.49)
2.32* (2.36)
ln Relative Wage -31.44** (-3.09)
3.46 (0.56)
ln US RD Intensity * FIE Share of
Processing Exports
26.38* (2.47) -
Instrument: Processing Export
Share - 0.56**
(7.68)
Constant 0.70** (4.97)
9.46 (1.00)
Industry Effects Clustering
Obs 100 100 R2 0.67 0.48
F-statistic 27.22** - Root MSE 0.17 11.77 Wald Χ2 - 118.60**
** and * indicate significance at the 1% and 5% levels, respectively.