exploitation of fishing resources in …evidentacercetare.univ-danubius.ro/surse/set_007/d1...ate...
TRANSCRIPT

909
Arch. Biol. Sci., Belgrade, 67(3), 909-920, 2015 DOI:10.2298/ABS140307052B
INTRODUCTION
Fish farming and aquaculture in the European Union is one of the food production sectors that has devel-oped at a rapid pace, supplying almost half of the fish and seafood quantities consumed worldwide (EC, 2013a). On a European level, aquaculture accounts for almost 20% of fish production, standing out in terms of quality and sustainable development, as well as in terms of the strict safety standards imposed (Churchill and Owen, 2010; OECD, 2013). European aquacul-ture provides high quality products, complying with environmental sustainability, animal health and con-sumer protection standards (EC, 2013b). However, production in this sector has come to a standstill lately, contrasting with the rapid development being recorded in other regions of the world. Under these circumstances, the objectives of the European Com-mission for fish farming include the requirement that both activities are sustainable from an environmental, economic and social standpoint and that they provide
healthy choices for EU citizens, as well as the fact that this is a dynamic sector whose development will cre-ate jobs and decent standards of living for fishermen (EC, 2013a). The efforts of the European Commission have targeted a radical change in this sector (Dam-anaki, 2014), encouraging EU member states to de-velop multi-annual plans for promoting aquaculture through the exchange of best practices.
As world population continues to rise in the fol-lowing decades and the global standards of living are increasingly higher, fish demand will equally aug-ment. Since global harvests of wild fish are already being exploited to their maximum sustainable level, much of this demand will have to be provided for from aquaculture. The aquaculture sector of the EU plays a significant part, with a turnover of about € 3 bil-lion, providing around 65000 jobs in 2005 (EC, 2009), while in 2010, aquaculture production amounted to € 3.1 billion and the output level has remained constant in the subsequent years. From a financial standpoint,
EXPLOITATION OF FISHING RESOURCES IN SUCEAVA COUNTY: PROFITABILITY ANALYSIS (RB/T) OF SPECIALIZED FARMS IN A MOUNTAINOUS REGION
Ionel Bostan1,*, Dorel Mates2, Elena Hlaciuc1, Veronica Grosu1, Marian Socoliuc1, Bogdan Andronic3, Marius Ciubotariu1, Anisoara Apetri1, Gheorghe Morosan1 and Camelia Mihalciuc1
1 Doctoral School of Economics, Stefan cel Mare University, Suceava, Romania 2 Doctoral School of Economics, West University, Timișoara, Romania 3 Faculty of Economic Sciences, Danubius University, Galati, Romania
*Corresponding author: [email protected]
Abstract: Aquaculture is an economic sector that has rapidly grown in recent years, due to European programs and the support provided for this activity. Given this accelerated development and the attention this sector receives on an interna-tional level, this paper focuses on identifying the growth factors in the sector and highlighting certain general aspects of its development in Romania, followed by an analysis of the available data on the exploitation of fishing resources in Suceava County in terms of performance.
Key words: aquaculture; fishing; environment/ecology; European policies/instruments; profitability; assets; investments.
Received March 7, 2014; Accepted July 1, 2014

910 Bostan et al.
the European Fisheries Fund (EC, 2013c) provides aid for the fishing industry and for coastal communities, enabling them to adjust to the constantly changing circumstances and to consolidate their economic po-sition and environmental sustainability.
The EFF has projected a budget of € 4.3 billion for 2007-2013 (Table 1), available for all branches of this sector. Among these, aquaculture, fish processing and marketing, sea and inland fishing (for more eco-friendly production methods) and common interest measures (for improving product traceability and la-beling) are being considered. At present, the fishing sector of the EU accounts for 25% of the fish market of the European Union, while 65% comes from im-ports and 10% is accounted for by the EU aquaculture sector (EC, 2011). The total possible consumption of fishing and aquaculture products in the EU has reached approximately 13.2 million tons (according to the data published on EUROSTAT). Based on the current labor productivity, each percentage point of the present total consumption in the EU is account-ed for from the domestic production of aquaculture and would lead to the provision of about 3000-4000 full-time jobs (CSTEP/STECF-OWP-12-03 (EC, 2013b)). This number confirms the fact that, even though aquaculture is a relatively small part of the EU economy, it could stimulate economic growth and
employment in the coastal and inland regions of the union. A close relationship with the processing sector would considerably improve the provision of new jobs and competitiveness in both sectors. Aquaculture is one of the EU strategy pillars in terms of “blue” (EC, 2012a) growth and its development could contribute to the implementation of the Europe 2020 strategy.
MATERIALS AND METHODS
Based on the data/information provided by EU-ROSTAT, INSSE, MEF, MARD, etc., we will try to identify, as accurately as possible, the parameters of fishing exploitation in Romania, subsequently ex-tending our investigation to the fishing sector in the Suceava County. The available research on this topic is relatively scarce, whether it approaches the subject directly or incidentally like Tahvonen (2009), Wilen (2000), Holland (2003), Dasgupta and Heal (1979), Eswaran et al. (1983), Haddon (2001), Walters (1969) and Moxnes (2005). Clearly, as the title of the paper suggests, we will mostly focus on the profitability ra-tios of certain mountainous/sub-mountainous farms, Suceava County. Since turnover (T) provides clues on the economic performance of fishery farms, be-ing used as a criterion for classification, in our study
Fig. 1. Categories of fish aquaculture (MARD, 2013a).

FISHING RESOURCES IN SUCEAVA COUNTY 911
we use the T indicator that accurately reflects the in-come/revenues from its activity in a period of time (at market prices).
RESULTS
Exploitation of fishing resources in Romania
At the national level, there is a strategy directed at the fishing sector for the time span 2014-2020 (MARD, 2013a), which is aligned with European policies and with the open dialogue process with the interested partners, as set out by the Ministry of European Funds as coordinator of the programming of Europe-an funds granted during 2014-2020. The Work Group for Fishing and Aquaculture (WGFA, 2014) has been created at the Ministry of Agriculture and Rural De-velopment (MARD) for a better coordination of this sector. WGFA includes important players in the fish-ing sector, local government structure representatives, fisheries associations, fishers and processors, as well as specific non-governmental organizations.
General presentation of the fishing sector from a geographical, economic and social standpoint
The sustainable and lasting development of fish-ing and aquaculture is an average-term social and economic need that entails the following objectives (MARD, 2013a):
• promoting competitive fisheries and aquaculture, supporting manufacturing organizations and fishing farms that are viable from an economic, sustainable, social and environmental standpoint;
• promoting policies that encourage the balanced inclusion and development of fishing areas, im-proving sustainable management and exploita-tion of live aquatic resources;
• encouraging the development and enforcement of EU integrated maritime policies, alongside the co-hesion and common policies in the fishing sector;
Table 1. Allocation of the EFF aid (2007-2013) (EC, 2012b).
Member State Convergence (€)
Non convergence
(€)
Total (€)
Belgium 26261648 26261648Bulgaria 80009708 – 80009708Czech republic 27106675 – 27106675Danemark – 133675169 133675169Germany 96861240 59004169 155865417Estonia 84568039 – 84568039Ireland – 42266603 42266603Greece 176836728 30995509 207832237Spain 945692445 186198467 1131890912France 34250343 181802741 216053084Italy 318281864 106060990 424342854Cyprus – 19724418 19724418Latvia 125015563 – 125015563Lithuania 54713408 – 54713408Hungary 34291357 559503 34850860Malta 8372329 – 8372329Netherlandes – 48578417 48578417Austria 187326 5071992 5259318Poland 734092574 – 734092574Portugal 223943059 22542190 246485249Romania 230714207 – 230714207Slovenia 21640283 – 21640283Slovakia 12681459 1007069 13688528Finland – 39448827 39448827Sweden – 54664803 54664803United Kingdom 43150701 94677188 137827889TOTAL 3252409308 1052539711 4304949019
• promoting the role of traditional fishing in fish-ing farms as an activity that generates oppor-tunities for the development of the local econ-omy (the provision of jobs in rural areas, the capitalization of less productive land), as well as environmental benefits or services (wet areas, biodiversity, microclimate).
The hydrographical network of Romania covers 843710 ha, accounting for 3.5% of the total surface of
912 Bostan et al.
the country. Fishing and aquaculture, alongside fish and fish-product processing and marketing, are activities developed throughout the country. There were about 100025 fisheries in Romania in 2005 (WGFA, 2014), structured as follows: 84500 fish farms (84%), 15500 fish hatcheries (15%) and 25 ha of salmon farms (cca. 1%).
The statistical data of the National Agency for Fishing and Aquaculture (NAFA, 2012) for 2011 showed that there were aquaculture licenses for a surface of 98233 ha, of which 8618 ha were for fish hatcheries (9%) and 89 615 ha for farms (91%). The projects financed through the Operational Program for Fishing during 2007-2013 have enabled the collec-tion of funds for increasing the production capacity to over 9200 tons (new and upgraded units).
If only 25 ha of salmon farms existed in 2005, their surface increased to about 70 ha in 2013. The fish species farmed in Romania before 2005 most-ly consisted of Cyprinidae, both local and Asian, representing 85% of the total, while the remaining 25% was comprised of trout, zander, pike, bass, cat-fish and sturgeon. The structure of the major catego-ries of fish aquaculture in 2011 is presented in Fig. 1.
Fisheries and fish farming have always been one of the country’s main natural resources and have played an important part among other economic sectors, ac-counting for 0.0086 of Gross Domestic Product (GDP) in 2008 (MARD, 2013a). Even though the fishing sec-tor hasn’t contributed much to the national economy
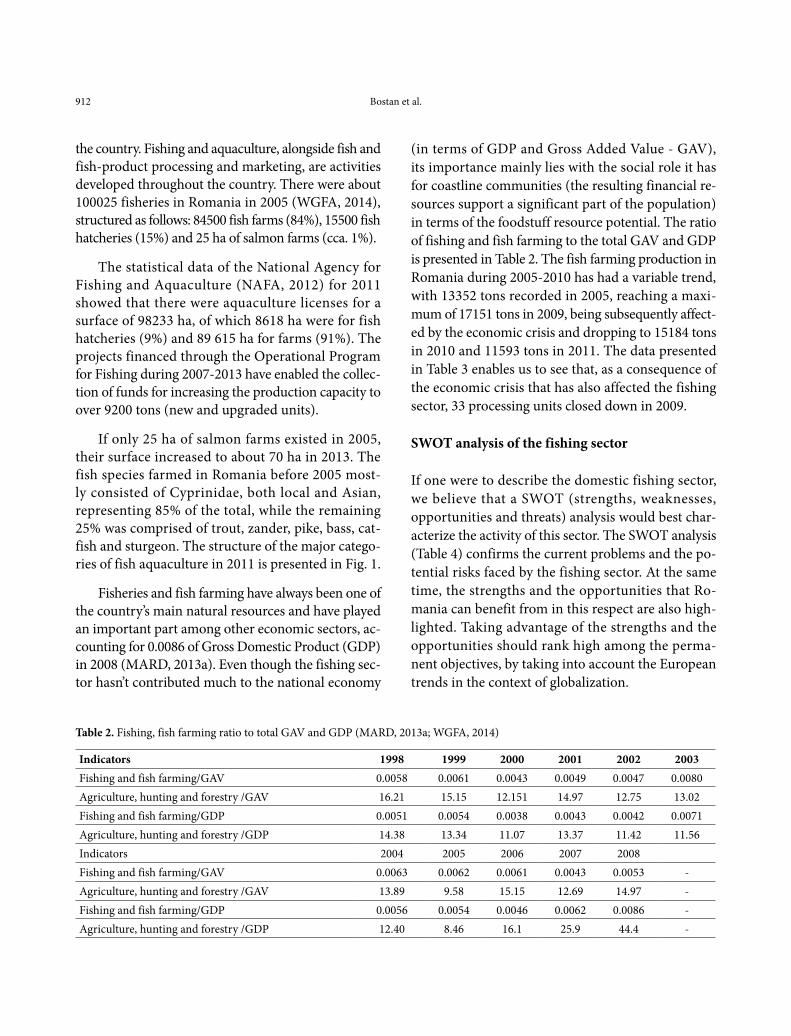
(in terms of GDP and Gross Added Value - GAV), its importance mainly lies with the social role it has for coastline communities (the resulting financial re-sources support a significant part of the population) in terms of the foodstuff resource potential. The ratio of fishing and fish farming to the total GAV and GDP is presented in Table 2. The fish farming production in Romania during 2005-2010 has had a variable trend, with 13352 tons recorded in 2005, reaching a maxi-mum of 17151 tons in 2009, being subsequently affect-ed by the economic crisis and dropping to 15184 tons in 2010 and 11593 tons in 2011. The data presented in Table 3 enables us to see that, as a consequence of the economic crisis that has also affected the fishing sector, 33 processing units closed down in 2009.
SWOT analysis of the fishing sector
If one were to describe the domestic fishing sector, we believe that a SWOT (strengths, weaknesses, opportunities and threats) analysis would best char-acterize the activity of this sector. The SWOT analysis (Table 4) confirms the current problems and the po-tential risks faced by the fishing sector. At the same time, the strengths and the opportunities that Ro-mania can benefit from in this respect are also high-lighted. Taking advantage of the strengths and the opportunities should rank high among the perma-nent objectives, by taking into account the European trends in the context of globalization.
Table 2. Fishing, fish farming ratio to total GAV and GDP (MARD, 2013a; WGFA, 2014)
Indicators 1998 1999 2000 2001 2002 2003Fishing and fish farming/GAV 0.0058 0.0061 0.0043 0.0049 0.0047 0.0080Agriculture, hunting and forestry /GAV 16.21 15.15 12.151 14.97 12.75 13.02Fishing and fish farming/GDP 0.0051 0.0054 0.0038 0.0043 0.0042 0.0071Agriculture, hunting and forestry /GDP 14.38 13.34 11.07 13.37 11.42 11.56Indicators 2004 2005 2006 2007 2008Fishing and fish farming/GAV 0.0063 0.0062 0.0061 0.0043 0.0053 -Agriculture, hunting and forestry /GAV 13.89 9.58 15.15 12.69 14.97 -Fishing and fish farming/GDP 0.0056 0.0054 0.0046 0.0062 0.0086 -Agriculture, hunting and forestry /GDP 12.40 8.46 16.1 25.9 44.4 -

FISHING RESOURCES IN SUCEAVA COUNTY 913
Analysis of the fishing sector of Suceava County in terms of profitability ratios of mountainous/sub-mountainous farms
Geographical setting
Suceava County stretches over surface of 8553.3 km2 (accounting for 3.6% of the total surface of Roma-nia), and is situated in the northeast of the country, in a natural landscape with central and northeast-ern European bioclimatic elements that create an interesting scenic harmony (SCC, 2013). As far as the hydrographical network of Suceava County is concerned, it stretches for a total of 3092 km, and its density is of 0.361 km river/km2 of territory, by far exceeding that of other regions in the country. All the rivers in the county flow into the Siret River, due to the landscape features. The highest quantities of water flow in the rivers whose reception basins are
situated in mountainous regions. The Moldova River has the largest hydrographical basin whose influents drain over 33% of the county’s surface. The second largest is the Bistrita River (30%) and the Suceava River. Still waters consist of small-sized natural and anthropic lakes, specifically designed for various purposes: industrial and drinkable water, protection against floods, fish farming.
Elements of the analysis
The objective of this analysis is to analyze the profitabil-ity of the fishing farms in the Suceava County, one of the relatively rich areas of Romania (Table 5) in terms of the type of resource that is the subject of our research. It is very important to trace the evolution of the economic and financial results of these farms for the past three years, alongside the economic context and the sustain-ability of the existing resources in the area.
Fig. 2. Evolution of net sales during 2010-2012 at the fishing farms in Suceava County.
Fig. 3. Evolution of total income during 2010-2012 at the fishing farms in Suceava County (Lei).

914 Bostan et al.
Table 3. Number of fish processing units in Romania (2008-2011) (MARD, 2013a).
No. Year Number of processing units1 2008 762 2009 433 2010 444 2011 42
Even though the lakes stretch over large surfaces in the county, with relatively small reed-covered ar-eas, the activities developed on fishing farms have a serious anthropic impact, particularly in the Falticeni area. Some of the basins are drained in autumn in order to extract the fish, thus compromising the habi-tat of the bird population in the area. On the other hand, the other lakes under consideration have large stretches of water with extended reed-covered sur-faces and a reduced anthropic impact.
According to the data published by the National Authority for Fishing and Aquaculture in the registry of aquaculture units in Suceava County, fishing farms account for a total administered surface of 874.6 ha. As concerns the organization of aquaculture farms in the hydrographical Siret basin in Suceava County, all the units are private companies, there are no state-owned units and the species being farmed are carp, crucian carp and freshwater fish.
In Suceava County, the European Fishing Fund is a complementary fund that finances the measures en-suring the continuity of fishing activities and planned exploitation, as well as fishing resource protection, development of viable business units in the fishing sector, development and improvement of the quality of life in the areas that are highly dependent on fish-ing activities.
The North-East Development Region, that also comprises Suceava County, was allocated more than € 3 million through the Regional Center for Payments for Rural Development and Fishing. Out of all the counties included in the region, Suceava benefits from 4 projects, amounting to almost € 1 million, half of which is European funding, followed by Iasi County
with projects amounting to more than € 600000 (EU funds accounting for half of the subsidy), while the other counties, Neamt and Botosani have 2 projects each. The last two counties on a regional level are Ba-cau and Vaslui, each benefiting from a single project.
There are six privately owned fishing farms in Suceava County, and the remaining 14 are still public-ly owned. Our financial analysis focuses on the profit-ability of privately-owned fishing farms, in order to identify the causes and economic or social factors that lead to increased performance or, on the contrary, to the liquidation and bankruptcy of these entities, fac-tors that may encourage or drive away investors in this important sector of agriculture.
Based on the data presented in the Profit and Loss account completed on December 31st for the period 2010-2012, we have analyzed the structure of the turnover (T), total income (Ti) and total expenses (Te), and of the net profit (Pr) or losses (l) arrived at during each accounting period, all the while at-tempting to calculate certain ratios that define the relationship between various elements related to rev-enues and expenses.
In order to protect the image and privacy of the companies whose economic and financial data were used, they will be given the generic name of Fishery 1, 2, etc. and the name of the place where they are located, while the monetary value of the analyzed elements will be in lei, the national currency (men-tion must be made that the conversion ratio Euro (€)/Lei (RON) is 1 EURO = 4.4749 Lei (RON) and USD ($)/Lei (RON) is 1 USD = 3.2533 Lei (RON)), according to the data provided by the website of the National Bank of Romania on 18 March 2014. Thus, the structure of the elements described above and recorded by the companies under consideration in our research can be summarized as follows (Table 6). The table presents the value of net sales, an indi-cator measuring the financial results for each entity and referring to the amount of earnings from their own activities during a certain period of time and in agreement with market prices. The net sales actually stand for the total earnings from current commer-

FISHING RESOURCES IN SUCEAVA COUNTY 915
cial activities. It allows one to ascertain a company’s position on the market, provides information on the activity dynamics, on the chances to expand the business or the importance of the enterprise within the sector (see the progress made by each company under analysis in Figs. 2-5).
Since NS (net sales) measures the companies’ economic performance and is used as a criterion in their ranking according to economic importance, one can note that during 2010-2012, all fishing farms in Suceava recorded a significant decline in their NS as a result of the financial crisis that started in our country in 2008, accompanied by a decline in the purchas-ing power of the population. As can be noted, there
have been companies that have had no NS records, as they have only made losses. Thus, the fishing sector market sent a negative message to all those that may have been interested in investing or starting a busi-ness in this particular sector.
An analysis of the total income – as its name sug-gests – measures all the revenues earned by a com-pany in each quarter: revenues from current activi-ties, financial revenues (dividends, interest, positive exchange rate spread, etc.) or exceptional revenues (asset sales, subsidies, annulled provisions, etc.).
As can be noted, there is an inverse ratio of T and total income for some of the fishing farms, meaning that if T was high in 2010 as compared to the other
Table 4. SWOT analysis of the fishing sector (MARD, 2013b).
StrengthsProduction capacity;Water sources for aquaculture; Available land for building new fisheries; Providing the necessary feed for carp farming form domestic resources; Exploitable fishing resources; Available workforce, with an acceptable level of education Valuable species from autochthonous fish fauna;The possibility to extent farming species to aquaculture; Significant water surfaces; Research organizations in the field; Tradition in this sector;Diversity of aquatic ecosystems.
WeaknessesInsufficient equipment; Decreased management capacity;Low competitiveness in the field;Relatively low added value of the fishing products; Inadequate specific infrastructure; Reduced diversity of fishing products;Reduced research funding;Lack of market studies.
OpportunitiesDomestic market with a high absorption potential;Financial support;Introduction of new species in fish farms;Increased standard of living in economically disadvantaged areas;Potential for ecotourism and other related activities; Protection of fishing resources;Protected natural areas for fish breeding and feeding;Potential for the development of ecological aquaculture; Sustainability of semi-intensive and extensive aquaculture;Development of the intensive systems of fish farming (salmon farming, sturgeon farming); Introduction of new species in Romanian aquaculture;Market niches;Specialised higher education;Environment friendly fish farming technologies.
Risks/ ThreatsOverexploitation of the resources;Fierce EU market competition with specific products;Consumer preference for other products;Increased production costs;Limited access to bank loans and difficult fund accessing procedures;Excessive bureaucracy;Environment pollution;Lack of interest for the processing of autochthonous products;Migration of the population towards more economically developed areas;Abusive enforcement of environment related regulations;Uncertain legal status of the land where fishing farms are located;Administrative and legislative instability in the fishing sector;Lack of continuity in promoting fishing policies;Insufficient personnel and equipment in the monitoring and control systems in the fishing sector.

916 Bostan et al.
years (2011 and 2012), the total income that has had lower values in 2010 was boosted in 2012. Moreover, it is worth mentioning the case of the companies that, even though their T amounted to 0 in 2010, 2011 and 2012, recorded revenues in 2011 and 2012, but note that these revenues were not generated by the opera-tions of the company.
However, in order to analyze the profit, one should also look at the total expenses of the com-panies under consideration, since these costs have actually diminished the financial benefits recorded throughout the accounting periods, as decreases in the value of assets or increased liabilities, thus result-ing in a decline of the shareholders’ equity (as com-pared to the distribution of this equity to shareholders or partners).
To analyze the expenses related to total income, one can use the total expense rate. The formula that shows the efficiency ratio of total expenses (expenses to 1000 lei total income) is:
1001000/
1000/∑ ×
= iiVt
cgC
t (1)
where Ct is total expenses, Vt – total income, ig = ratio of company income for each of the three cat-egories (operational, financial or non-recurring) and
1000/ic = level of expenses for 1000 lei income of each of the three categories (operational, financial or non-recurring), or efficiency ratio of the expenses for each of the three categories.
Fig. 4. Evolution of total expenses during 2010-2012 at the fishing farms in Suceava County (Lei).
Fig. 5. Evolution of expense efficiency during 2010-2012 at the fishing farms in Suceava County.

FISHING RESOURCES IN SUCEAVA COUNTY 917
However, since the structure of the total income reported by means of the profit and loss account or the amount of total expenses are not available to the public, analysis of the efficiency rate of the expenses for each category was not possible. However, the mea-surement and analysis of the efficiency of the total expenses for 100 lei total income is possible, which is an important indicator in measuring the efficiency of investments, expended costs or the depreciation in value of the various assets of fishing farms.
Ect = Ct/Vt*100 (2)
where Ect = efficiency of the total expenses for 100 lei gained income, Ct = value of the total expenses and Vt = value of the total income.
As can be seen from Fig. 6, it is difficult to ascer-tain any expense efficiency in almost all fishing farms in Suceava County. Only three entities are approach-ing a recovery of the expended costs and investments, while the cost inefficiency in the other three entities is obvious. Therefore, the shareholders or partners in these entities will not only risk not receiving any kind of dividends or other financial benefits, but will also run the risk of not recovering their invested capital. At the end of this analysis, it is very important to high-light the main measures to be taken in order to reduce the total expenses and to increase revenues, with di-rect effects on an increased level of net sales and total profit. Thus, one of the following would be necessary:
• sale prices and the amounts required for the products provided by fishing farms or for the
Fig. 6. Evolution of the gross financial result during 2010-2012 at the fishing farms in Suceava County (Lei).
Fig. 7. Evolution of the return on sales during 2010-2012 at the fishing farms in Suceava County.

918 Bostan et al.
services supplied should cover the expenses and ensure the acquisition of a good profit;
• adjustment of optimum funding means for the business inputs;
• high capitalization of fixed assets and the timely meeting of obligations to customers and to the state budget.
Starting from the identified total income and total expenses, we will subsequently focus on the fi-nancial result of each fishing farm and the related profitability rate.
The formula used to calculate the financial result, which can be either profit or loss, either gross or at its book value, is:
Gross financial result = Total income - Total expenses
The assessment of company performance entails the analysis of two categories of indicators, i.e. ex-penses and revenues. In our case, revenues and ex-penses are elements that are directly related to mea-
suring the profit; as can be noted, all the companies, except for one that made a profit throughout the en-tire period, had serious losses in at least one account-ing period, if not in all 3 years.
Either this decline in the financial benefits re-corded throughout the period under analysis is caused by the disposal or depreciation of assets or to increased liabilities which, in turn, result in de-creased equity capital other than the equity distrib-uted to shareholders or partners. These expenses are recognized at the same time as increased liabilities or decreased assets (for instance, accrued salaries or the amortization of fixed assets).
High-quality company management is confirmed by the appreciation of their products on the market, a condition that is best reflected by their turnover. The ratio between the financial result and the turnover is the return on sales rate.
Rc = Rb/T*100 (4)
where Rc = return on sales, Rb = gross result (gross profit or losses) and T = Turnover.
Table 5. Fish farming capacity in Suceava County (2009) (CARHF, 2012).
No. Name of fishing farm
Farms(Ha)
Trout farms(Ha)
Exploitations(Ha)
Structure per species
1 Mountain lakes - - - -2 Crujana - - - -3 Mountain rivers - - - -4 V. Putnei - 2.4 - 2-year-old trout5 Brodina - 2.1 - 1-year-old trout6 Toplite 3.7 - - 4-year-old hatchers
Total 3.7 4.5 -
Table 6. Value of the turnover during 2010-2012 of the fishing farms in Suceava County (Lei).
Private fisheries 2010 2011 2012Fishery 1 Suceava 2147696 1554045 147617Fishery 2 Frumosu 618907 853210 391810Fishery 3 Vicovu de Sus 185580 416118 2512033Fishery 4 Suceava 376828 389633 296386Fishery 5 Campulung Moldovenesc 24061 - -Fishery 6 Campulung Moldovenesc - - -

FISHING RESOURCES IN SUCEAVA COUNTY 919
As can be seen in Fig. 7, only three fishing farms in the county had a favorable operating profit margin, while the other three recorded losses either through-out the period under analysis or during a single year. This indicator could not be analyzed.
The results of the research we have conducted in-dicate that the situation of fishing farming in Suceava County is not at all encouraging. Financial indicators have reached rather insignificant levels throughout the period under analysis.
However, in our opinion, things could get bet-ter if new investments are made in the area we have referred to.
CONCLUSIONS
If the wild fish captures are already being exploited at the most sustainable level, much of the fish demand will have to be met by the aquaculture sector. This sit-uation is currently true both on a national and on an international/European Union level. Even though the European Fishing Fund (EFF) provides funding for aquaculture, fish processing and marketing, for the common interest measures (improving the traceabil-ity or product labeling) etc., the human and financial resources involved until now still do not ensure the development of the sector above an acceptable level.
The economic development, both on a national and at county level, reveals the presence of consider-able resources that have yet to be explored. Moreover, the situation has also been influenced by the financial crisis that was mostly felt during 2009 to 2012, and investors are just now trying to reorient themselves towards this specific sector in Suceava County.
Acknowledgments: We would like to thank the two re-viewers for their insightful comments and suggestions.
REFERENCES
EC (2013a). European Commission. The New Common Fish-eries Policy: http//:ec.europa.eu/fisherie/cfp/aquaculture/index_ro.htm
Churchill, R. and D. Owen (2010). The EC Common Fisheries Policy. University Press, Oxford EC Law Library, pp.571-575.
OECD (2013). Organisation for Economic Cooperation and Development. Review of Fisheries policies and summary statistics, pp. 213-215.
EC (2013b). Communication of the European Commission to the European Parliament, the Council, the European Economic and Social Committee and the Committee of the Regions - Strategic guidelines for the sustainable development of EU aquaculture. European Commission, Brussels, Apr. 29.
Damanaki, M. (2014). Reform in Europe is possible - The lesson of EU fisheries. Pan European Conference for EU reform, European Commission - Speech 14/26, Jan. 15, London.
EC (2009). European Commission - Common fisheries policy - user guidelines. Luxembourg, Publications Office of the European Union.
EC (2013c). European Commission - Overview of the Euro-pean Fishing Fund: http://ec.europa.eu/fisheries/cfp/eff/index_en.htm
EC (2011). Impact assessment - Accompanying the document Proposal for a Regulation of the European Parliament and of the Council on the common organisation of the markets in fishery and aquaculture products. Brussels, July 13.
EC (2012a). Communication of the European Commission to the European Parliament, the Council, the European Economic and Social Committee and the Committee of the Regions - Blue Growth opportunities for marine and maritime sustainable growth European Commission, Brussels.
EC (2012b). European Fisheries Fund (Brief Introduction): http://ec.europa.eu/fisheries/documentation/publications/cfp_factsheets/european_fisheries_fund_en.pdf
Tahvonen, O. (2009). Optimal Harvesting of Age-structured Fish Populations. Marine Res. Econ. 24(2):147-169: http://www.bioone.org/doi/abs/10.5950/0738-1360-24.2.147
Wilen, J.E. (2000). Renewable Resource Economists and Policy: What Differences Have We Made? J. Environ. Econ. Man-agement. 39, 306-27.
Holland, S.P (2003). Set-up costs and the existence of competitive equilibrium when extraction capacity is limited. J. Environ. Econ. Management. 46, 539-556.

920 Bostan et al.
Dasgupta, P.S. and G.M. Heal (1979). Economic theory and exhaust-ible resources, Cambridge, Cambridge University Press.
Eswaran, M., T.R. Lewis, and T. Heaps (1983). On the non-exis-tence of market equilibria in exhaustible resources with decreasing costs. J. Pol. Econ. 91, 154-167.
Haddon, M. (2001). Modelling and Quantitative Methods in Fish-eries. Boca Raton, FL: Chapman & Hall/CRC.
Walters, C.J. (1969). A Generalized Computer Simulation Model for Fish Population Studies. Transac. Am. Fish. Soc. 98, 505-12.
Moxnes, E. (2005). Policy Sensitivity Analysis. Simple versus Complex Fishery Models. Systems Dyn. Rev. 21(2), 123-45.
MARD (2013a). Ministry of Agriculture and Rural Development, The National strategy for the fishing sector 2014-2020, Bucharest.
WGFA (2014). Work Group for Fishing and Aquaculture, Mate-riale support, Bucharest: http://www.madr.ro/ro/program-are-2014-2020-pop/documente-de-programare.html
NAFA (2012). National Agency for Fishing and Aquaculture, Stat-istici/Programe, Bucharest: http://www.anpa.ro/national-control-action-programme/
MARD (2013b). Ministry of Agriculture and Rural Development. Analiza SWOT a sectorului pescaresc in Romania, Bucha-rest: http://old.madr.ro/pages/fep/programare/analiza-socio-economica-a-sectorului-piscicol-detaliat.pdf
SCC (2013). Suceava County Council. The economic and social development strategy of the Suceava County for 2011-2020 (Project funded by the European social fund through the operational programme for administrative capacity devel-opment): http://www.cjsuceava.ro/index.php/en
CARHF (2012). County Agency for Recreational Hunting and Fishing, Bucharest: http://www.cjsuceava.ro/documente-nou/strategie/Strategie%20interior.pdf