exploration of ground water using - ethesisethesis.nitrkl.ac.in/2655/1/ashvin_thesis-1.pdf ·...
TRANSCRIPT

1
EXPLORATION OF GROUND WATER USING
ELECTRICAL RESISTIVITY METHOD
A Thesis submitted to the
National Institute of Technology, Rourkela
In partial fulfilment of the requirements
of
Bachelor of Technology (Civil Engineering)
ASHVIN KUMAR MEENA
Roll No. 10601035
Under the guidance of
PROF. J.K PANI
PROF. A.K PRADHAN
DEPARTMENT OF CIVIL ENGINEERING
NATIONAL INSTITUTE OF TECHNOLOGY, ROURKELA, ORISSA -769 008
2011

2
National Institute of Technology
Rourkela
CERTIFICATE
This is to certify that the thesis entitled, “Exploration of ground water using electrical
resistivity method” submitted by ASHVIN KUMAR MEENA (10601035) in partial
fulfillment of the requirements for the award of Bachelor of Technology Degree in Civil
Engineering at the National Institute of Technology, Rourkela (Deemed University) is an
authentic work carried out by him under my supervision and guidance.
To the best of my knowledge, the matter embodied in the thesis has not been submitted to any
other University/ Institute for the award of any Degree.
Prof J.K Pani
&
Prof A.K Pradhan
Date-15/05/11 Department of Civil Engineering,
National Institute of Technology,
Rourkela- 769008

3
National Institute of Technology
Rourkela
ACKNOWLEDGEMENT
I want to convey hearty indebtedness and deep reverence for my guide Prof J.K. Pani &
Prof. A.K. Pradhan, Department of Civil Engineering for their valuable guidance and
constant encouragement at every step.
I am very thankful to Department of Civil Engineering NIT Rourkela for providing me all
facilities required for the experimental work.
Ashvin kumar Meena
Roll no: 10601035
Department of civil engineering
National Institute of Technology
Rourkela

4
Abstract
As times going on, our demand of water for domestic and various
other purposes is increasing day by day. Therefore for in this project
mainly deals with the tapping of Ground water in NIT Rourkela by
doing a survey work for fulfilment of needs. Based on results
measurement of discharge was done by carrying out drilling
operations at proposed point incorporating Rotary percussion method.
Whole of the survey work has been done with Ashida electrical
resistivity method and coherency is found between the survey work
done and actual findings which was done through drilling operations.
5
Table of contents
1. Abstract …………………………………………………………4
1.1 Introduction.
1.2 Ground water ……………………………………………… 5
1.3 Aquifier …………………………………………………… 8
1.4 Surface investigation ……………………………………… 10
2. Electrical resistivity method.
3.1 Soil resistivity meter……………………………………… 11
3.2 Principle……………………………………………………12
3.3 Know your Instrument…………………………………… 14
4. Survey method employed……………………………………… 23
5. Ground water exploration
5.1 Two Pin Method………………………………………… 25
5.2 Four Pin Method………………………………………… 26
6. Conclusions…………………………………………………… 34
7. Recommendations……………………………………………… 36
8. References ……………………………………………………… 38

6
CHAPTER 1
1.1 Ground water
Groundwater is water that occurs under the ground surface of Soil pore spaces and in the
fractures of rock formations also called (Lithologic formation) and an usable quantity of
water is yielded from a unit of rock called Aquifer. It gets completely saturated with voids of
rock at the depth of soil pores spaces or fractures and forms water table. Ground water
recharge or deep drainage is hydrologic process where water moves downward from surface
water to groundwater. Natural discharge occurs at spring and can form an isolated area of
vegetation in desert called Oases. Water is one of the natures five element and used in our
day to day life such as agriculture, municipal and industrial use by constructing and operating
extraction wells The area of geology that deals with the distribution and movement of
groundwater in soil and rocks of earths crust is called Hydrogeology. Groundwater is re-
occured naturally by rain, snow and to a smaller exten by surface water (rivers and lakes).
Typically, groundwater is thought of as liquid flowing through shallow aquifers and frozen
soil.

7
Groundwater is about twenty percent of the world's fresh water supply, which is about 0.61%
of entire world's water, including the oceans and permanent ice. Global groundwater storage
is roughly equal to the total amount of freshwater stored in the snow and ice pack, including
the north and south poles. This makes it an important resource which can act as a natural
storage that can buffer against shortages of surface water, as in during times of drought.
Groundwater is naturally replenished by surface water from precipitation, streams, and rivers
when this recharge reaches the water table.
Groundwater can be a long-term 'reservoir' of the natural water cycle (with residence times
from days to millennia), as opposed to short-term water reservoirs like the atmosphere and
fresh surface water (which have residence times from minutes to years). The figure shows
how deep groundwater (which is quite isolated from the surface recharge) can take a very
long time to complete its natural cycle.

8
1.2 Aquifer
An aquifer is a layer of relatively porous substrate that contains and transmits
groundwater. When water can flow directly between the surface and saturated zone of
an aquifer then the aquifer is unconfined. The deep parts of unconfined aquifers are generally
more saturated since gravity causes the water to flow downwards. The upper levels of this
saturated layer of an unconfined aquifer is known as the water table or phreatic surface.
Below the water table, where generally all the pore spaces are saturated with water is called
the phreatic zone .Substrate with relatively low porosity that permits limited transmission
of groundwater is called an aquitard. An aquiclude is a substrate with porosity which
is so low it is virtually impermeable to the groundwater. A confined aquifer is that
aquifer which is overlain by a relatively impermeable layer of a rock or a substrate such as an
aquiclude or aquitard. If a confined aquifer is following a downward grade from its
recharge zone then the groundwater can become pressurized as it flows. This usually creates
artesian wells which flow freely without the need of any pump and rise to a higher level than
the static water table at the above unconfined aquifer. The properties of aquifers vary with the
geology and the structure of the substrate and the topography in which they occur. Usually,
the more productive aquifers are found in the sedimentary geologic formations. Relatively,
the weathered and the fractured crystalline rocks yield smaller amount of groundwater in
most of the environments. Unconsolidated poor cemented alluvial materials that have
aggregated as valley-filling sediments in the major river valleys and the geologically
subsiding structural basins are included among the most productive sources of
groundwater .Also, the high specific heat capacity of water and the insulating effect of
soil and rock can lessen the effects of climate and maintain groundwater at a relatively
constant temperature. In some places where the groundwater temperatures are maintained by
this phenomena at about 50°F/10°C, groundwater can be used for controlling temperature

9
inside the structures at the surface. For example, during hot weather relatively cool
groundwater can be pumped through the radiators in a home and then returned to the ground
in some other well. During the cold seasons, because it is warmer, the water can be used in
the same way as a source of heat for the heat pumps that is much more efficient than using
air. The relatively constant temperature of the groundwater can also be used for heat pumps.

10
1.3Surface investigation
Even though groundwater can’t be seen above the earth surface, a scope of techniques can be
supply in sequence of concerning its happening with certain conditions even its properties.
Surface investigations allow us in deciding the information about type, porosity, water
content and the density of subsurface creation. It is usually done with the help of electrical
and seismic characteristics of the earth and without any drilling on the ground. The data
supplied by this technique are partly reliable and it is less expensive. It give only indirect
sign of groundwater so that the underground hydrologic records must be inferred from the
surface investigations. Right interpretation requires additional data from the sub surface
investigations to confirm surface findings. It is generally achieve by geophysical method viz,
electrical resistivity & seismic refraction method.

11
Chapter-2
Soil resistivity meter
2.1 Principle
• Groundwater contains various dissolved salts and it is ironically conductive, this enables
electric currents to flow into ground. As a result, by calculating the ground resistivity it gives
the possibility to the availability of water, taking in consideration the following properties:

12
• A hard rock with no pores or fracture and a dry sand devoid of the water or clay are
extremely resistive: several tens thousands ohm.m .
• A porous or fractured rock containing free water has a resistivity that depends on resistivity
of the water and on the porosity of rock , several tens to several thousands ohm.m
• An impermeable clay layer, containing bound water, has low resistivity: several units to
several tens ohm.m
• Mineral ore bodies such as iron, sulphide etc have very low resistivity because of their
electric conduction : usually less or much less than 1 ohm.m .
2.2 Resistivity of various types of water
Types of Water
Resistivity in ohm-meter
Meteoric water (derived from
precipitation)
30-1000
Surface water (in districts of sedimentary rocks)
10-100
Ground water(in areas of igneous rock)
30-150
Sea water
0.20
Ground water(in areas of sedimentary rock)
More than 1
Both porous and non porous rocks act as the insulators until they are in dry condition.

13
Resistance decrease with the increase in pore water. Unconsolidated objects have more
resistance than the compacted objects of same composition. Sedimentary rock has good
conductance i.e. smaller resistance than the igneous rocks. Clay has high conductivity than
sand because of occurrence of iron cluster on the surface of clay. Based on this information
from resistivity survey it is easy to distinguish between the major rock group and the
water bearing zones.
2.3 ELECTRICAL RESISTIVITY OF SOME COMMON
MATTER
COMPOSITION Resistivity (ohm-m)
Top soil 5-50
Pea and clay 8-50
Clay sand and gravel mixture 90-250
Saturated sand and gravel 40-100
Moist to dry sand and gravel 100-3000
Mud stone and shale 8-100
Sand stone and lime stone 100-1000
Crystalline rock 200-10000
Quart 100
Calcite 500
Dense granite 1000000
metamorphic rock 100-10000000
Unconsolidated sedimentary rock 10-10000
Gavel and sand with water 100

14
Fresh water 100
Shale and clay 10
Brine
0.05
2.4 Know your Instrument
The main instrument is opened with a lid hinged out at the left side .We can observe
following controls.
Current Indicator
Near the left Top Edge is the Red Push Button marked as CURRENT. Although
operating the instrument while the button is pressed the meter indicates the current.
That is being penetrated in the ground (Between P1 and P4 circuit). If the meter
indicates say 20 that means the Actual current flowing is 50 milliamps .
Fig current indicator
Voltage selector:
This switch is placed below the current push button. The output AC voltage (50/100/200/400
V AC) is selected with this selector switch, at various different stages.

15
Fig Voltage indicator
Range selector:
The range selector switch is positioned below the voltage selector switch. There are 5
different ranges that can be selected through X1, X10, X100, X1000,X10000 in the first
range i.e. X1 the resistance less than 1 ohm can measured. In the second range(X10),
resistance up to 10 ohm can be measured. Thus for X100 up to 100 ohm and for X1000 up to
1000 ohm and for X10000 up to 10000 ohm

16
Terminals
At the lower end there are 4 terminals marked as P1,P2 ,P3 and P4. Terminals P1 and P4 are
of red colour whereas P2 and P3 are of black colour .P1 and P4 are connected to the extreme
2 probes (current probes) through which the current is injected in the ground. P2 and P3 are
connected to the middle 2 probes that are called as potential probes and measure the potential
created by injecting the current through the current probes
Fig Terminals
ON/OFF switches
With this toggle switch the main battery supply to instrument is disconnected. This switch is
to be kept OFF when instrument is not in exercise. “CAL” knob: The calibration of the
instrument is done with this knob .once the instrument is calibrated for a particular range this
knob should not be disturbed till the required set of the reading is obtained for that range.

17
Meter : The meter can be used for three different functions
1.Current indication : when the probes are connected to the instrument and the
instrument is switched ON and now when the CURRENT push button is pressed ,the meter
indicates the milli –Amp (mA) current which flows through the ground. The full scale
deflection (100) indicates 250 mA
2. Battery indication : The push button marked “BATTERY” is pressed , meter shows
the battery input voltage ,along with proper connection (polarity) .When the pointer is in the
green area (7A) of the meter scale ( 4.5 to 7 V DC) which indicates battery voltage is
sufficient to operate the instrument correctly. If the signal is less then the battery need to be
charging & if the pointer moves in other direction ( below 0) that means the battery is
connected in the wrong polarity hence exchange the connections.
3.NULL BALANCING: This is the principle use of meter. The genuine readings of the
ground survey are taken when there is NULL balance i.e. The pointer deflect towards the
maximum left side towards zero .

18
Neon indicator : After switching the instrument ON the neon red lamp on the top of
the meter glows ,which indicate that the ac voltage is produced.
Battery check push buttons:
On the right hand corner there is a push button pointed battery .when battery button is pressed
,the pointer deflection shows the battery status(voltage).for suitable results ,the battery
voltage should be within the green zone (7 A) of meter .the battery voltage indication may
differ when the instrument is in OFF or ON condition . But in any case the battery voltage
should certainly not drop lower than 4.5 V DC.

19
Sensitivity :
The black knob is situated at the right hand side ,below the battery push button ,when this
knob is rotated in the clockwise direction the sensitivity increases ie. The deflection is more
and null balancing can be done specifically Ten turn potentiometer knob : the “R” knob is
palced right beneath the sensitivity knob .it computes the resistance accurately .the least
count of knob is 0.0001 ohm and after calculating 10 turns it measures 1.0000 ohm. Thus it
will evaluate
0 ohm to 1 ohm on X1 range ,
0 ohm to 10 ohm on X10 range
0 ohm to 100 ohm on X100 range
0 to 10000 ohm on X1000 range
Fig sensitivity
0 to 10000 ohm on X10000 range
In short the reading obtain on ten turn pot is to be multiply with selected range ,to get the
authentic reading.
The adaptor :
The adaptor is to be attached with the main instrument .the P1, P2, P3 and the P4 pins are to
be inserted into the respective terminals of the main instrument .there is a band switch (or a

20
series of 5 push buttons) below the terminals of the adaptor .each push button is pressed to
select a particular range .Any press button when pressed separately connect a standard
resistor of known value across the instrument. The value of standard resistor is noted below
the push button
Fig Adaptor
Winches
There are four winches .Each winch has a wire winded on it which has a different colour. The
open end of wires has a pin connected to it which in turn is to be attached to the respective
probes. The other end of the wires is concluded on the banana socket located at the reverse
side of handle of the winch.

21
Probes: 4 Stainless steel probes are of the appropriate size and they are supplied along
with. Each probe has a pointed end. This facilitates to hammer the probe in ground. The
probes are hammered in the ground in such a way that the firm electrical contact is
established.
Fig Probes
Battery:
The battery given with the instrument is a safeguarding free battery of 6 V 10 AH rating. It
has to be charged only with identical charger provided along with it. When it is connected
to the instrument with power button in OFF position and the battery switch pressed the
meter shows the battery charge available .Even after nonstop charging for 10 to 12 hours
the meter’s pointer never go above 4.5 volt then it means the battery has gone weak and
needs replacement. Caution: Never connect the battery and the instrument at the same time
.neither connect the charger to the instrument straight.
Always remember to remove the battery from the instrument, whenever the instrument is
not in use for more than one hour. Make sure that the instrument is OFF before removing

22
the battery .
Battery charger:
The input to the charger is our normal household supply of 230 V AC ,50 Hz .the charger
has 2 indicating bulbs .the AC ON bulb indicates healthiness of the AC input circuit. The DC
ON bulb shows the physical condition of the DC output circuit. If any of the bulbs doesn’t
glow first check the relevant fuse with mains OFF. Never short the DC output terminals, even
for a moment because this will permanently damage the charger .The charger is for indoor
purpose only.
Fig Battery charger

23
Chapter 3
Survey method:
1. First set the instrument horizontally on ground. Unlock the cover and rest it on the stopper
on left hand side.
2. Take the pair of battery connecting wires, which have a banana pin at one end and a small
crocodile pin on the other end. Locate the battery connection banana sockets (red +black) on
the left hand side of the instrument .insert the appropriate wires in the sockets .connect the
other side of the wires to the terminals of a fully charged battery.
3. Without putting the instrument on press the battery push button on the instrument and
confirm the battery voltage .the pointer on the meter must be within the green zone (7A) only,
not more or not less.
4. Hook the adaptor to the edge of the instrument box .make one to one connections from the
adaptor side P1, P2, P3 and P4 to the instrument side .Ensure that the wires are not cross
connected.
5. Press the “X 10” button on the adaptor .note the resistance value given below this button
(say 6.66 ohm)
6.Adjust the value on the “R” knob .turn it clockwise till the digit 6 appears in the mail scale
window .then turn this knob further so that sixty sixth divisions of the circular coincides with
the marking .
7. Set the range selector switch on the instrument to “X10” position.
8. Set the voltage selector switch to 50 V AC position.
9. Set the sensitivity knob to maximum position (clockwise)
10. Similarly .rotate the “CAL” knob clockwise to its maximum position.
11. Now after the ensuring all the above settings, switch ON the instrument. The red neon

24
indicator just above the meter will glow indicating the developing AC voltage
12. The pointer of the meter will gradually move towards right hand side and at times may
also move beyond 100. Rotate the sensitivity knob in the anticlockwise direction to keep the
pointer between 60 to 100 of the meter.
13. Now slowly rotate the “CAL” knob in the anticlockwise direction .with this side i.e. from
100 towards 0.at a certain place ,the pointer will stop moving towards 0and will start moving
back .the maximum deflection towards the left (0) is the point of null balance and this method
is called as NULL BALANCING METHOD
14. At this particular point, from where the pointer starts moving back, stop rotating the cal
knob .now this instrument is said to be calibrated for that particular range in this case for
X10 range.
15. Counter check the calibration by rotating the “R” knob .the pointer moves in the opposite
direction for the “R” knob rotating direction
16. Thus when the instrument is properly calibrated for a particular range, i.e. The position of
the “CAL” knob is set properly, then the instrument will precisely measure the soil resistance
within that particular range, this is how the instrument is calibrated on site and the possibility
of taking wrong reading is eliminated.
17. Once calibrated for a particular range, the “CAL” knob is not to b disturbed until all the
readings in that range are properly taken. The “R” knob is once again brought to its full 0
position and the Range switch is kept at X10 position the X10 calibration holds good for
X1.X10, X100 ranges also.
18. The adaptor button disconnects the adaptor from the main instrument and the instrument
can now actually measure the soil resistance

25
Chapter-4
Methods of operation
1. Two Pin Method
2. Four Pin Method
4.1 Two Pin Method: experimental readings:
Sl. No. Range of
instrument
Readings R ohms
1 X 1000 .017 17
2 X 1000 .019 19
3 X 1000 .022 22
4 X 1000 .023 23
5 X 1000 .013 13
6 X 1000 .018 18
7 X 1000 .012 12
8 X 1000 .015 15
9 X 1000 .004 04
10 X 1000 .015 15
11 X 1000 .033 33
12 X 1000 .021 21
13 X 1000 .009 09
14 X 1000 .014 14
15 X 1000 .017 17
16 X 1000 .008 08
17 X 1000 .030 30
18 X 1000 .019 19
19 X 1000 .030 30
20 X 1000 .034 34
21 X 1000 .025 25
22 X 1000 .029 29
23 X 1000 .037 37
24 X 1000 .035 35
25 X 1000 .044 44
26 X 1000 .041 41
27 X 1000 .035 35
28 X 1000 .026 26
26
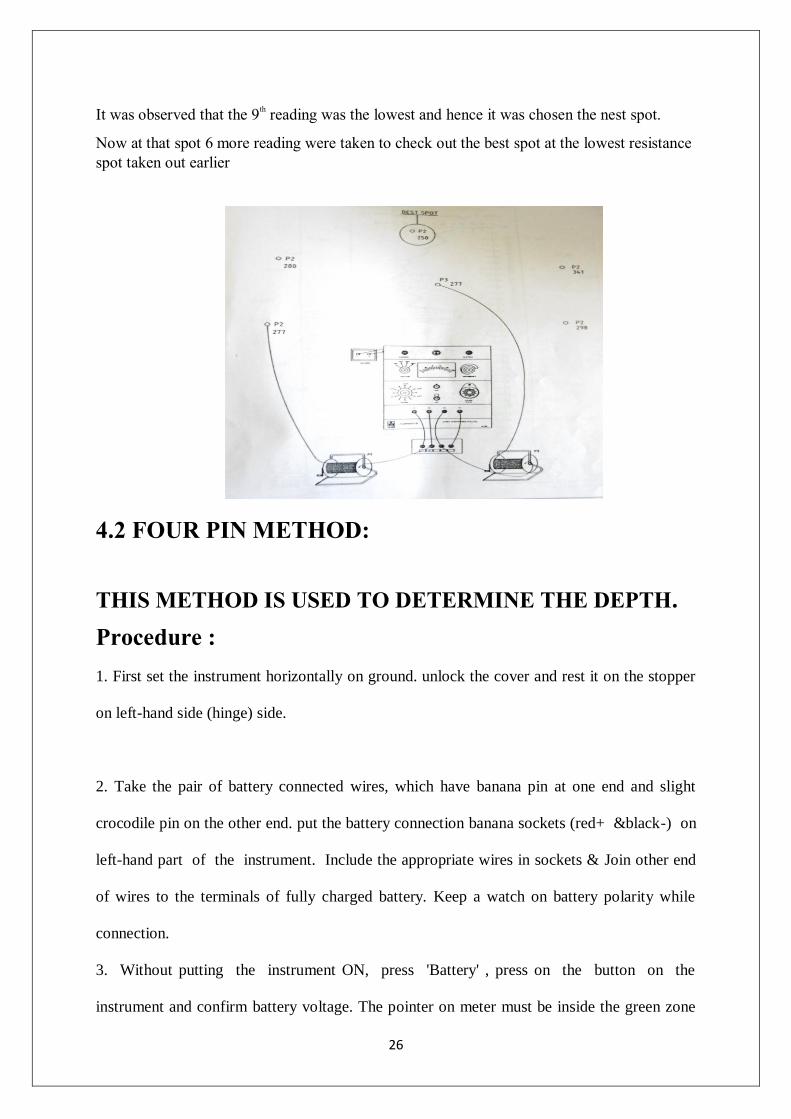
It was observed that the 9th reading was the lowest and hence it was chosen the nest spot.
Now at that spot 6 more reading were taken to check out the best spot at the lowest resistance
spot taken out earlier
4.2 FOUR PIN METHOD:
THIS METHOD IS USED TO DETERMINE THE DEPTH.
Procedure :
1. First set the instrument horizontally on ground. unlock the cover and rest it on the stopper
on left-hand side (hinge) side.
2. Take the pair of battery connected wires, which have banana pin at one end and slight
crocodile pin on the other end. put the battery connection banana sockets (red+ &black-) on
left-hand part of the instrument. Include the appropriate wires in sockets & Join other end
of wires to the terminals of fully charged battery. Keep a watch on battery polarity while
connection.
3. Without putting the instrument ON, press 'Battery' , press on the button on the
instrument and confirm battery voltage. The pointer on meter must be inside the green zone

27
(7A) only.
4. Hook the adapter to the frame of the instrument box. Make one to one connection for the
adaptor side P1, P2,P3&P4 to instrument side Ensure that the wires were not cross-
connected.
5. Push the 'X10' button on the adaptor .Note down the resistance value given under this
button.(say 6.66)
6. Adjust that value on the 'R' knobs. Rotate it clockwise till the number 6 appears in Main-
scale window. After that , turn the knob more so that the sixty-sixth division of circular scale
coincide with the marking point.
7. Place the Range Selector switch on instrument to 'X10' point.
8. Situate the Voltage Selector switch to 50VAC point.
9. Set the Sensitivity Knob to maximum arrangement (clock wise).
10. Likewise, turn the 'CAL' knob clockwise to its highest position
11. Now after checking all the upper settings, switch ON the instrument .The blue
neon just above the meter will glow showing the developing AC
voltage.
12. Pointer of the meter will progressively move towards left hand side and at
Times it may also move beyond 100. Turn the Sensitivity Knob in anti clock wise path to
keep the pointer between 60 to 100.
13. Now slowly turn the 'CAL' knob in opposite direction , due to which the pointer of the
meter would also start moving from right side that is from 100 towards 0. At certain
place , pointer will stop moving toward 0 & it will begin moving back. The maximum
deflection towards left (0) is the point of null balance and this technique is called as NULL
BALNCING METHOD.
14. At this particular place , from where pointer start moving back ,stop rotating 'CAL' knob

28
. This instrument is said to be calibrated for any particular range.
15. Counter check the calibration by moving the 'R' knob. The pointer moves in
opposite way of the 'R' knob revolving direction.
16. Thus when the instrument is properly calibrated for a particular range,i.e the
position of the 'CAL' knob is set properly , then the instrument will precisely measure
the soil resistance ,within that particular range. This is how the instrument can be calibrated
on-site & the possibility of taking wrong reading is eliminated.
17. Once calibrated for a particular range, the 'CAL' knob is not to be disturbed
until all the reading in that range are properly taken. The 'R' knob is once again
brought to its full 0 position .The X10 calibration holds good for X1 ,X10 &X10^2 ranges
also.
18. Unpressing the adaptor button disconnects the adaptor from the main
instrument and the instrument can now actually measure the soil resistance.
19.Arrange the probes at equal distance from each other say 1 meter .This horizontal
distance between the probes is called as 'a' , in this case a=1 meter.
20. The probes supplied have a standard length of 50 cms. For the WENNER
configuration of 1 meter , the probe arrangement is made as follows.
21. First of all mark the spot of interest on the ground i.e the spot at which the survey is
to be conducted.
22. Measure 1 probe distance (50cms) on either side of the spot , and hammer the probes here
.Thus the distance between the probes will naturally be 100 cms i.e 1 meter.
23. From these hammered probes , measure a distance of 1-probe length on the either
side. Hammer the two remaining probes at these position .Thus the distance between the two
adjacent probes is 1 meter .See to it that all the four probes are in one horizontal line.
24. For the simplicity of operation & understanding , note that always the probes on the left

29
side of the spot under observation are called P1&P2 & the probes on the right side are called
as P3&P4. The instrument in generally kept in the close vicinity of the spot.
25. Keep the winches near the main instrument & keep the wires sufficiently unwind so
that the crocodile clips reach the probes that are hammered in the ground .Keep the
P1&P2 winches on the left side of the instrument &P3&P4 on the right.
26. See that your position in the field is like this:-
P1-P2-Spot-P3-P4 i.e
Probe P1 on LHS at 3 probe distance (150cms) from the spot.
Probe P2 on LHS at 1 probe distance (50cms) from the spot.
Probe P3 on RHS at 1 probe distance (50 cms) from the spot.
Probe P4 on RHS at 3 probe distance (150 cms)from the spot.
Thus the probes are hammered equidistant & the distance is 1 meter.
27. The wire are connected to the probes by the crocodile pins &the winches are connected
to the adaptor by the iwres having banana pins at both the ends strictly observe that the
probes are connected to the respective terminals on the adaptor i.e probe P1 is connected to
P1 terminal on the adaptor and so on.
28. The adaptor must be also connected to the main instrument's terminal & all the switches
of the adaptor must be in upressed condition(all up).
29. Note that the calibration of the instrument must be done first,before connecting the
probes to the instrument .Also while taking the actual reading of the soil the adaptor
must be disconnected simply by ensuring that all the press buttons are unpressed.
30.The sensitivity knob is at maximum position .Next , ensure that all the
connection are tight & secure & there are no lose connection .Also make sure that all the
connection are are not broken or damaged anywhere .Now , the instrument can be said to be
set for the field operation & actual survey can be conducted.

30
i. The instrument is now switched ON.
ii. The neon lamp glows & the pointer of the meter starts moving 0 to
100.Sometimes it ay go beyond 100.In that case , bring the pointer within the
scale by rotating the sensitivity knob anti-clockwise so that the pointer also
remains steady.
iii. Press the push button marked 'Current' The meter will show the current inmilliamps (mA)
that is being penetrated in the ground .The minimum requirement is 100mA.The full-scale
indication of the meter is equal to 250mA.Thus the current should be never less than 4
division. More the current, sharper will be the reading &more the voltage ,lesser will be
the current flow. Thus to get the best reading start with lower voltage ,say 50VAC.For
dry &hard terrain select 100 or 200VAC. In case of very dry, sandy surface where the
current is likely to get diffused, 400VAC is to be used (Note that 400VAC range should be
used only if required as it consumes lot of power &discharge the battery soon).
iv. Now slowly & steadily rotate the 'R' knob in clockwise direction (the initial position
of this knob was 0.00).The pointer will start moving from RHS to LHS .Continue rotating
the 'R' knob .At a certain position,the pointer will stop moving in the forward direction
&will start moving back. Observe minutely, this division on the meter back .Let this position
be say 33RD division on the meter.
v. Rotate the 'R' knob so as to bring the pointer to the 33RD division(maximum
deflection towards left).
vi. Switch OFF the instrument.
vii. Note the reading on the 'R' knob .If it is 0 on the main scale &54 division on the circular
(vernier ) scale , then it is interpreted as 0.054.This reading is to be multiplied by the range on
which this reading is taken i.e X10 as in this case. Thus the 'R' value comes to 0.54 . Another
examples of X10 ranges are as follows.

31
a. 0 on main scale & 5 divisions (after 0) on the circular scale gives 0.05.
b. 0 on main scale & 55 divisions on circular scale give 0.55.
c. 5 on main scale &55 division on circular scale gives 5.55.In our first example we
got R=0.54 .This value substituted in the formulae p=2aR where p(spelled as rohe)= The
apparent resistivity.(The unit is ohmmeter.)
2 = constant ,whose value is 6.28
a = The horizontal distance between the two probes (Mtrs).
R = Resistance value obtained as above ().
Thus in our example p=6.28*.1*0.54=3.39 ohmmeter.
31. The second reading in now taken as follows
i. The instrument is already in OFF position , after taking the 1st reading
ii. Bring back the 'R' knob to 0.00 position.
iii. Unclip the probe P1 , remove it from the ground and firmly hammer 3
probes distance (1.5 mtrs) from its previous position .Clip back the crocodile pin to it.
iv. Fix the probe P2 in a new position ,1 probe distance away fron its previous position
v. Similarly move probe P4 3 probes distance from its previous position
& probe P3 1 probe distance away from its previous position.
4 .3 Pin method readings:
Sl.
No.
“a”
Depth in
meters
Range of
instrument
Readings R ohms “P”
Ohm meters
2*3.14*a*R
1 1 X10 .092 .92 5.778
2 2 X10 .057 .57 7.160

32
3 3 X10 .096 .96 18.086
4 4 X10 .052 .52 13.062
5 6 X10 .073 .73 27.506
6 8 X10 .043 .43 21.603
7 10 X10 .046 .46 28.888
8 13 X10 .021 .21 17.144
9 16 X10 .025 .25 25.120
10 20 X10 .012 .12 15.072
11 24 X10 .015 .15 22.608
12 30 X10 .014 .14 28.26
13 35 X10 .013 .13 28.574
14 40 X10 .010 .10 25.12
15 45 X10 .009 .09 25.434
16 50 X10 .008 .08 25.12
17 55 X10 .008 .08 27.632
18 60 X10 .005 .05 18.84
19 65 X10 .007 .07 28.574

33
Looking at the graph above it can be clearly known that the probability of finding ground
water is high in this region give additional tension at depths 15 m and 20m. But it belongs to
unconfined aquifers what we are looking for is confined aquifers which from the graph can
be predicted to be at 60 m.
0
10
20
30
40
50
60
70
0 10 20 30 40
De
pth
in m
Apparent Resistivity in ohm-m
Water Bearing Zone
Top Soil LayerMurum
rockHard rock
Water Bearing Zone
Top Soil LayerMurum
rockHard rock
Soft rock
Hard rock
Water Bearing Zone

34
Chapter-5
Conclusions

35
Conclusions
The NIT Rourkela topography and its surrounding receive an average rainfall of
around 130 cm and thus there is a great need of recharge of ground water.
But due to diversity in types of deposits or formations quality of ground water is not
for all time satisfactory.
Also because of urbanization and growth of industry, there is always a risk of water
pollution inside the ground water basin.
For this reason it becomes important to correctly investigate the quality of the ground
water before making them for use.
In prospect of the discharge obtained from surveyed point it is originate that the point
is highly potential for utilization of ground water .If all points will be collectively
taken into consideration for exploitation the water necessity of the campus and the
halls together with academic areas can be meet adequately .
Ground water can also be exploited through large diameter water table dug wells in
the valley from the unconfined acquifers. On the other hand water from these wells
have to be treated before making them for domestic and other uses.

36
Chapter-6
Recommendations

37
Recommendations
Groundwater is limited so a careful use of groundwater needs to be done with a
suitable planning.
The ground water basin wants to be replenish with some recharge method in the area.
Recharge structures like nala bunds and water harvesting arrangement should be
constructed at suitable points.
Plantation may be taken up to the waste lands to increase ground water recharge.
Concentration of trace metals requirements to be determined by analysing samples of
groundwater from different sites by the help of atomic absorption spectrophotometer
and former modern systems.

38
Chapter-7
References

39
References
Pradhan, A.K., Mohapatra, S., Chand, S.K., Panda, A.P., Kumar, A., Sarangi, B.,
Qualitative Aspects of Groundwater in the Area of Regional Engineering College,
National Seminar, Rourkela, India, Feb.,1988.
Todd, D.K., Groundwater Hydrology, 2nd
ed., John Wiley & Sons, New Delhi, India,
2006.
Operating Manual for ASHIDA Soil Resistivity Meter-ASRM1S, ASHIDA
Electronics Pvt. Ltd. Thane, India, 2007.
Hydraulics and Fluid mechanics by P.N MODI