exploration of the involvement of lncrna in hiv-associated encephalitis ... · introduction...
TRANSCRIPT

Submitted 27 April 2018Accepted 5 September 2018Published 12 October 2018
Corresponding authorsMeiling Jin, [email protected] Liu,[email protected]
Academic editorRavi Tandon
Additional Information andDeclarations can be found onpage 19
DOI 10.7717/peerj.5721
Copyright2018 Li et al.
Distributed underCreative Commons CC-BY 4.0
OPEN ACCESS
Exploration of the involvement ofLncRNA in HIV-associated encephalitisusing bioinformaticsDiangeng Li1,*, Pengtao Bao1,3,*, Zhiwei Yin4, Lei Sun5, Jin Feng6, Zheng He7,Meiling Jin2 and Changting Liu1
1Chinese PLA General Hospital, Nanlou Respiratory Diseases Department, Beijing, China2Beijing Chao-yang Hospital, Department of Nephrology, Beijing, China3Department of Respiratory Medicine, The 309th Hospital of People’s Liberation Army, Beijing, China4Chinese PLA General Hospital, Department of Nephrology, Beijing, China5Chinese PLA General Hospital, Editorial Office of Chinese Journal of Otology, Beijing, China6Chinese PLA General Hospital, Department of stomotology, Beijing, China7Chinese PLA General Hospital, Department of Clinical Laboratory, Beijing, China*These authors contributed equally to this work.
ABSTRACTBackground. HIV-associated encephalitis (HIVE) is one of the common complicationsof HIV infection, and the pathogenesis of HIVE remains unclear, while lncRNA mightbe involved it. In this study, we made re-annotation on the expression profiling fromthe HIVE study in the public database, identified the lncRNA that might be involvedin HIVE, and explored the possible mechanism.Methods. In the GEO public database, the microarray expression profile (GSE35864)of three regions of brain tissues (white matter, frontal cortex and basal gangliabrain tissues) was chosen, updated annotation was performed to construct the non-cording-RNA (ncRNA)microarray data. Morpheus was used to identify the differentialexpressed ncRNA, and Genbank of NCBI was used to identify lncRNAs. The StarBase,PITA and miRDB databases were used to predict the target miRNAs of lncRNA. TheTargetScan, PicTar and MiRanda databases were used to predict the target genes ofmiRNAs. The GO and KEGG pathway analysis were used to make function analysis onthe targets genes.Results. Seventeen differentially expressed lncRNAs were observed in the white matterof brain tissues, for which 352 targetmiRNAs and 6,659 target geneswere predicted. TheGO function analysis indicated that the lncRNAs were mainly involved in the nucleartranscription and translation processes. The KEGG pathway analysis showed that thetarget genes were significantly enriched in 33 signal pathways, of which 11 were clearlyrelated to the nervous system function.Discussion. The brand-new and different microarray results can be obtained throughthe updated annotation of the chips, and it is feasible to identify lncRNAs fromordinary chips. The results suggest that lncRNA may be involved in the occurrenceand development of HIVE, which provides a new direction for further research on thediagnosis and treatment of HIVE.
Subjects Bioinformatics, HIVKeywords HIVE, lncRNA, Bioinformatics
How to cite this article Li et al. (2018), Exploration of the involvement of LncRNA in HIV-associated encephalitis using bioinformatics.PeerJ 6:e5721; DOI 10.7717/peerj.5721

INTRODUCTIONCognitive impairment is one of the challenges that HIV patients may face (Clifford &Ances, 2013). HIV-1 enters the central nervous system through the blood–brain barrier atthe initial infection stage, and a virus replicating area isolated from the body is formedin the central nervous system (Stam et al., 2013). Before the introduction of highly activeanti-retroviral therapy (HAART), many HIV patients would soon suffer severe cognitiveimpairment, which is called HIV associated dementia (HAD), patients with HAD usuallysuffer from HIV-associated encephalitis (HIVE) (Masliah et al., 2000). Although HAARTis very effective at present, HIV-induced brain inflammation has been frequently noticedin autopsy, and neurocognitive test results are abnormal in most HIV patients (Clifford &Ances, 2013). Currently, HIV cannot be radically eradicated by any HIV therapy, and theanti-retroviral viruses can hardly pass the blood–brain barrier, so the central nervous systemmay become a virus repository that might promote the occurrence and development ofHIVE (Kumar et al., 2007). At present, the pathogenesis of HIVE is not very clear. Studyingthemolecular signaling pathways invovled inHIVEwould be significance for the preventionand treatment of HIVE.
In the human genome, more than 70% of the genes are transcribed into RNAs, butless than 2% of them are protein coding genes, and most of them are noncoding RNAs(Costa, 2010). Non-coding RNAs (ncRNAs) regulate the expression of targeted genesthrough various pathways, and thus participate in various life processes of cells, tissues andorganisms. According to the length, ncRNAs can be divided into small ncRNAs (<200 bp)and long ncRNAs (lncRNAs) (>200 bp). In recent years, studies have found that thereare interactions between RNAs of different lengths, especially the relationship betweenlncRNA,miRNA andmRNA, which form a regulatory network of lncRNA-miRNA-mRNA.LncRNAs could be the ‘‘molecular sponges’’ of miRNAs, that is, lncRNAs could bind totarget miRNAs leading to the ‘‘silencing effect’’ attenuation of miRNAs on target genes,thereby regulating the target genes of miRNAs (Salmena et al., 2011). This study is aimingto identify the lncRNA might be involved in HIVE from expression profile, and explorethe possible mechanisms.
In recent years, expression microarray technology has played an important role in theresearch on the disease occurrence and development, and many research results can bereviewed anddownloaded in the public database. Because updated annotation ofmicroarrayresults has always been continuing, new results and novel revelation can be accomplishedthrough the re-annotation and analysis of published studies on microarray results. Inthis study, we retrieved the HIVE study related microarray data from the GEO database,re-annotated and analyzed these data, identified the lncRNAs that might be involved in thepathogenesis of HIVE, and performed the correlation analysis (the work flow was shownin Fig. 1), aiming to verify the feasibility of identifying lncRNAs from expression profilefrom public database and to explore the possible mechanisms of lncRNAs participating inpathogenesis of HIVE.
Li et al. (2018), PeerJ, DOI 10.7717/peerj.5721 2/22
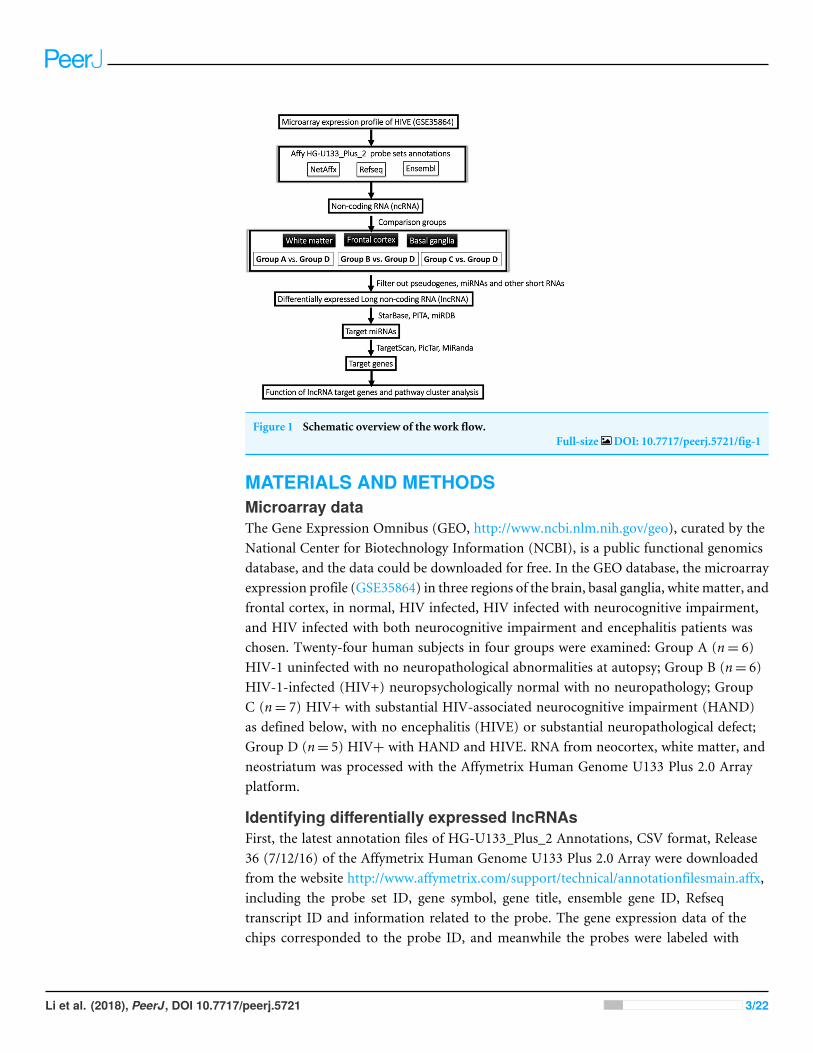
Figure 1 Schematic overview of the work flow.Full-size DOI: 10.7717/peerj.5721/fig-1
MATERIALS AND METHODSMicroarray dataThe Gene Expression Omnibus (GEO, http://www.ncbi.nlm.nih.gov/geo), curated by theNational Center for Biotechnology Information (NCBI), is a public functional genomicsdatabase, and the data could be downloaded for free. In the GEO database, the microarrayexpression profile (GSE35864) in three regions of the brain, basal ganglia, white matter, andfrontal cortex, in normal, HIV infected, HIV infected with neurocognitive impairment,and HIV infected with both neurocognitive impairment and encephalitis patients waschosen. Twenty-four human subjects in four groups were examined: Group A (n= 6)HIV-1 uninfected with no neuropathological abnormalities at autopsy; Group B (n= 6)HIV-1-infected (HIV+) neuropsychologically normal with no neuropathology; GroupC (n= 7) HIV+ with substantial HIV-associated neurocognitive impairment (HAND)as defined below, with no encephalitis (HIVE) or substantial neuropathological defect;Group D (n= 5) HIV+ with HAND and HIVE. RNA from neocortex, white matter, andneostriatum was processed with the Affymetrix Human Genome U133 Plus 2.0 Arrayplatform.
Identifying differentially expressed lncRNAsFirst, the latest annotation files of HG-U133_Plus_2 Annotations, CSV format, Release36 (7/12/16) of the Affymetrix Human Genome U133 Plus 2.0 Array were downloadedfrom the website http://www.affymetrix.com/support/technical/annotationfilesmain.affx,including the probe set ID, gene symbol, gene title, ensemble gene ID, Refseqtranscript ID and information related to the probe. The gene expression data of thechips corresponded to the probe ID, and meanwhile the probes were labeled with
Li et al. (2018), PeerJ, DOI 10.7717/peerj.5721 3/22

Refseq transcript ID through the NetAffx annotation. The probes with the ‘‘NR_’’logo were identified in Refseq ID (NR representing nonencoding RNA). Morpheus(https://software.broadinstitute.org/morpheus/) was used to analyze online and identifythe differential expressed ‘‘NR_’’ between the groups (Group A vs. Group D, Group B vs.Group D and Group C vs. Group D) of each region tissue (white matter, frontal cortex andbasal ganglia brain tissues). This analysis was based on the t -test and adjusted according tothe characteristic that the noise of microarray data was correlated with the peak value ofexpression data. We considered that p-value <0.01 was statistically significant. The numberof upregulation and downregulation was 100). The Wayne map was drawn based on theintersection of the above results to select differential ‘‘NR_’’ participating in the occurrenceand development of HIVE. The pseudogenes, rRNAs, microRNAs and other short RNAs(including tRNAs, snRNAs and snoRNAs) were filtered out through Genbank from NCBIdatabase. The final remainder was the differential expressed lncRNAs.
Prediction of target miRNAs of LncRNAs and target genesThe sequences of lncRNAs were retrieved through NBCI Nucleotide (https://www.ncbi.nlm.nih.gov/nucleotide), which were then input into StarBase (http://starbase.sysu.edu.cn/), PITA (https://genie.weizmann.ac.il/pubs/mir07/mir07_data.html) and miRDB(http://www.mirdb.org/), to predict the target miRNAs of the lncRNAs. The miRNAs wereinput into TargetScan (http://www.targetscan.org/vert_71/), PicTar (http://pictar.mdc-berlin.de/) and MiRanda (http://www.microrna.org/microrna/home.do) to predict thecorresponding target genes.
Function of lncRNA target genes and pathway cluster analysisThe Database for Annotation, Visualization and Integrated Discovery (DAVID,http://david.abcc.ncifcrf.gov/) is an online program that provides a comprehensive setof functional annotation tools for researchers to understand biological meaning behindmany genes. Gene Ontology (GO) and the Kyoto Encyclopedia of Genes and Genomes(KEGG) pathway enrichment analysis were performed for the identified DEGs using theDAVID database. After GO functional enrichment analysis, we considered the biologyprocess terms with p-value <0.05 was statistically significant. For KEGG analysis, weconsidered the subpathway with p-value <0.05 was statistically significant.
RESULTSIdentifying differentially expressed lncRNAsWe re-annotated the GSE35864 and preliminarily retained 15,901 probes only with the‘‘NR_’’ logo in the Refseq transcript ID. The Morpheus online tool was used to analyzeand identify the differentially expressed probes with the ‘‘NR_’’ logo between the groups(Group A vs. Group D, Group B vs. Group D and Group C vs. Group D) of each regiontissue (white matter, frontal cortex and basal ganglia brain tissues). As shown in Fig. 2A,there were differentially expressed probes with the ‘‘NR_’’ logo between different groupsin the white matter, among which those that may be involved in the occurrence anddevelopment of HIVE were identified, and a total of 63 ncRNAs were identified. As
Li et al. (2018), PeerJ, DOI 10.7717/peerj.5721 4/22

Figure 2 Differentially expressed ncRNAs probe sets among Group A, Group B, Group C, Group D inwhite matter, frontal cortex and basal ganglia. (A) White matter; (B) frontal cortex; (C) basal ganglia.Group A: HIV-1 uninfected with no neuropathological abnormalities at autopsy; Group B: HIV 1-infected(HIV+) neuropsychologically normal with no neuropathology; Group C: HIV+ with substantial HIV-associated neurocognitive impairment (HAND) as defined below, with no encephalitis (HIVE) or sub-stantial neuropathological defect; Group D: HIV+ with HAND and HIVE.
Full-size DOI: 10.7717/peerj.5721/fig-2
shown in Fig. 2B, there were differentially expressed probes with the ‘‘NR_’’ logo betweendifferent groups in the frontal cortex, and the intersection was selected from each group.There was only 1 probe labeled with ‘‘NR_’’ intersected. As shown in Fig. 2C, there weredifferentially expressed probes with the ‘‘NR_’’ logo between different groups in thebasal ganglia, and the intersection was selected from each group. There were 12 commonprobes labeled with ‘‘NR_’’ intersected. All the differential expressed ncRNAs with the‘‘NR_’’ logo were searched in the GenBank, and 17 lncRNAs were identified in the whitematter, without any differentially expressed lncRNAs in the frontal cortex and basalganglia. These 17 lncRNAs were LINC00308, LOC100507387, SCOC-AS1, ALMS1-IT1,LINC00639, LOC101928847, LOC100134368, ZNF670-ZNF695, SHANK2-AS3, MEG9,SNHG7, TMEM44-AS1, LRRC8C-DT, MASP1, MAPT-AS1, TBX5-AS1, LINC01770. Asshown in Fig. 3, the expression of LINC00308, LOC100507387, SHANK2-AS3, SNHG7,MAPT-AS1 were significantly increasing in Group D, and the others were significantlydecreasing.
Li et al. (2018), PeerJ, DOI 10.7717/peerj.5721 5/22

Figure 3 Heat map of 17 differentially expressed lncRNAs among Group A, Group B, Group C, GroupD in white matter.Group A: HIV-1 uninfected with no neuropathological abnormalities at autopsy;Group B: HIV-1-infected (HIV+) neuropsychologically normal with no neuropathology; Group C:HIV+ with substantial HIV-associated neurocognitive impairment (HAND) as defined below, with noencephalitis (HIVE) or substantial neuropathological defect; Group D: HIV+ with HAND and HIVE.
Full-size DOI: 10.7717/peerj.5721/fig-3
Prediction of target miRNAs of lncRNAs and target genesThe target micRNAs of the lncRNAs were identified from the database, and a total of352 target miRNAs were predicted in 17 differentially expressed lncRNAs (Table 1). The6,659 corresponding target genes of miRNAs were predicted by TargetScan, PicTar andMiRanda.
GO cluster analysis of target genesThe 6,659 target genes were uploaded to the DAVID software, and the significant GOclassification and KEGG pathway were selected. GO cell component (CC) analysis showedthat the target genes were obviously clustered in the nucleus, cytoplasm, Golgi apparatus,lysosome, plasma membrane, etc. (Fig. 4A, Table 2). GO molecular function (MF) analysisrevealed that the target genes were remarkably clustered in transcription factor activity,protein serine/threonine kinase activity, transcription regulator activity, ubiquitin-specificprotease activity, etc. (Fig. 4B, Table 2). GO biological process (BP) analysis revealedthat the target genes were significantly clustered in regulation of nucleobase, nucleoside,nucleotide and nucleic acidmetabolism, signal transduction, cell communication, transportetc. (Fig. 4C, Table 2).
KEGG pathway analysis of target genesTable 3 showed that 33 pathways were significantly enriched with target genes (p < 0.05),which were obtained through KEGG analysis, includingmucin type O-Glycan biosynthesis,proteoglycans in cancer, pathways in cancer, glutamatergic synapse, long-term depression
Li et al. (2018), PeerJ, DOI 10.7717/peerj.5721 6/22

Table 1 Differentially expressed lncRNAs in white matter and their target miRNAs.
No. Probe Official Symbol Target miRNAs predicted
Upregulated lncRNAs1 NR_038400 LINC00308 hsa-miR-1185-2-3p; hsa-miR-1185-1-3p; hsa-miR-6833-3p; hsa-miR-4768-
5p; hsa-miR-3127-5p; hsa-let-7f-2-3p; hsa-miR-5187-5p; hsa-miR-5002-3p;hsa-miR-4741; hsa-miR-4675; hsa-miR-3653-3p
2 NR_038402 /// XR_941286 ///XR_941287 /// XR_941288 ///XR_941289 /// XR_941290 ///XR_941291 /// XR_941292 ///XR_941293
LOC100507387 hsa-miR-6876-5p; hsa-miR-4476; hsa-miR-6865-5p; hsa-miR-6815-5p;hsa-miR-6806-5p; hsa-miR-6739-5p; hsa-miR-6733-5p; hsa-miR-3153;hsa-miR-6878-3p; hsa-miR-4779; hsa-miR-8063; hsa-miR-4738-3p; hsa-miR-5584-5p; hsa-miR-4288; hsa-miR-3688-5p; hsa-miR-1206; hsa-miR-6797-5p;hsa-miR-3978; hsa-miR-1249-5p
3 NR_073536 SHANK2-AS3 hsa-miR-4447; hsa-miR-4713-3p; hsa-miR-516b-5p; hsa-miR-1229-3p;hsa-miR-6832-3p; hsa-miR-504-3p; hsa-miR-1275; hsa-miR-324-5p; hsa-miR-6736-3p; hsa-miR-4443; hsa-miR-676-5p; hsa-miR-4483; hsa-miR-296-5p;hsa-miR-1224-3p; hsa-miR-96-5p; hsa-miR-1271-5p
4 NR_003672 /// NR_024542 ///NR_024543
SNHG7 hsa-miR-6887-5p; hsa-miR-6795-5p; hsa-miR-3201; hsa-miR-4793-5p;hsa-miR-6887-5p; hsa-miR-6795-5p; hsa-miR-3201; hsa-miR-4793-5p;hsa-miR-6836-5p; hsa-miR-6132; hsa-miR-5095; hsa-miR-4267; hsa-miR-6778-3p; hsa-miR-504-3p; hsa-miR-4262; hsa-miR-6890-5p; hsa-miR-425-5p;hsa-miR-378a-5p; hsa-miR-7151-3p
5 NR_024559 MAPT-AS1 hsa-miR-6772-5p; hsa-miR-4463; hsa-miR-511-5p; hsa-miR-3175; hsa-miR-532-5p; hsa-miR-4441; hsa-miR-340-5p; hsa-miR-223-5p; hsa-miR-6895-3p
Downregulated lncRNAs1 NR_033939 SCOC-AS1 hsa-miR-1205; hsa-miR-4508; hsa-miR-3194-5p; hsa-miR-4441; hsa-miR-
6510-5p; hsa-miR-6836-5p; hsa-miR-6132; hsa-miR-4516; hsa-miR-135b-5p;hsa-miR-135a-5p; hsa-miR-3192-5p; hsa-miR-8081; hsa-miR-6876-5p; hsa-miR-4756-5p; hsa-miR-4739; hsa-miR-1321; hsa-miR-3145-5p; hsa-miR-4427; hsa-miR-4748; hsa-miR-4464; hsa-miR-651-3p; hsa-miR-4524b-3p;hsa-miR-513a-5p; hsa-miR-6794-5p; hsa-miR-4716-3p; hsa-miR-3613-3p;hsa-miR-4668-5p; hsa-miR-6867-5p; hsa-miR-6753-5p; hsa-miR-450a-1-3p;hsa-miR-4752; hsa-miR-6794-3p; hsa-miR-3188; hsa-miR-937-5p; hsa-miR-6882-3p; hsa-miR-4328; hsa-miR-4476; hsa-miR-6727-5p; hsa-miR-5003-5p; hsa-miR-4268; hsa-miR-376c-5p; hsa-miR-376b-5p; hsa-miR-1252-5p;hsa-miR-608; hsa-miR-5581-3p; hsa-miR-4651; hsa-miR-4533
2 NR_046762 ALMS1-IT1 hsa-miR-4499; hsa-miR-888-5p; hsa-miR-616-5p; hsa-miR-373-5p; hsa-miR-371b-5p; hsa-miR-1285-3p; hsa-miR-539-3p; hsa-miR-485-3p; hsa-miR-3685;hsa-miR-2052; hsa-miR-3143; hsa-miR-9-3p; hsa-miR-1303; hsa-miR-548c-3p; hsa-miR-6867-3p; hsa-miR-381-3p; hsa-miR-300; hsa-miR-4801; hsa-miR-4731-3p; hsa-miR-6515-3p; hsa-miR-7844-5p; hsa-miR-506-5p; hsa-miR-5680;hsa-miR-4297; hsa-miR-155-3p; hsa-miR-660-3p; hsa-miR-6847-3p; hsa-miR-200a-3p; hsa-miR-141-3p; hsa-miR-6834-5p; hsa-miR-493-5p; hsa-miR-3911;hsa-miR-6073; hsa-miR-758-5p; hsa-miR-4426; hsa-miR-151a-3p; hsa-miR-323a-3p; hsa-miR-939-3p; hsa-miR-4262; hsa-miR-181b-5p; hsa-miR-181a-5p;hsa-miR-3653-3p; hsa-miR-7108-5p; hsa-miR-4742-5p
(continued on next page)
Lietal.(2018),PeerJ,DOI10.7717/peerj.5721
7/22

Table 1 (continued)
No. Probe Official Symbol Target miRNAs predicted
3 NR_039982 LINC00639 hsa-miR-6845-5p; hsa-miR-1227-5p; hsa-miR-1914-5p; hsa-miR-5088-3p;hsa-miR-6090; hsa-miR-631; hsa-miR-6762-5p; hsa-miR-4441; hsa-miR-3123;hsa-miR-6764-5p; hsa-miR-766-3p; hsa-miR-4690-5p; hsa-miR-532-3p; hsa-miR-4297; hsa-miR-4456; hsa-miR-550b-2-5p; hsa-miR-4283; hsa-miR-4281;hsa-miR-4742-5p; hsa-miR-4311; hsa-miR-330-3p; hsa-miR-8089; hsa-miR-4700-5p; hsa-miR-4667-5p
4 NR_120563 LOC101928847 hsa-miR-645; hsa-miR-134-3p; hsa-miR-3651; hsa-miR-5089-3p; hsa-miR-4486; hsa-miR-890; hsa-miR-6512-5p; hsa-miR-6780b-5p; hsa-miR-4725-3p;hsa-miR-4271; hsa-miR-1296-3p; hsa-miR-653-5p; hsa-miR-302f; hsa-miR-491-5p; hsa-miR-6855-5p; hsa-miR-3170; hsa-miR-1236-3p; hsa-miR-93-3p;hsa-miR-663b; hsa-miR-4769-5p; hsa-miR-4654; hsa-miR-548aw; hsa-miR-548d-5p; hsa-miR-548b-5p; hsa-miR-548ay-5p; hsa-miR-548aE−5p; hsa-miR-548ad-5p; hsa-miR-548ab; hsa-miR-548c-3p; hsa-miR-1263; hsa-miR-6071;hsa-miR-5572; hsa-miR-4665-5p; hsa-miR-1275; hsa-miR-4478; hsa-miR-518c-5p; hsa-miR-3120-3p
5 NR_024453 LOC100134368 hsa-miR-6742-5p; hsa-miR-663a; hsa-miR-8060; hsa-miR-1827; hsa-miR-107;hsa-miR-103a-3p; hsa-miR-4441; hsa-miR-4456; hsa-miR-6134; hsa-miR-3911;hsa-miR-4478; hsa-miR-654-5p; hsa-miR-541-3p; hsa-miR-4764-5p; hsa-miR-548x-5p; hsa-miR-548g-5p; hsa-miR-548f-5p; hsa-miR-548aj-5p; hsa-miR-4311; hsa-miR-3907; hsa-miR-4284; hsa-miR-744-5p; hsa-miR-6796-5p
6 NR_037894 ZNF670-ZNF695 hsa-miR-5584-5p; hsa-miR-6780a-5p; hsa-miR-4668-5p; hsa-miR-548t-3p;hsa-miR-548ap-3p; hsa-miR-548aa; hsa-miR-134-3p; hsa-miR-4306; hsa-miR-6764-5p; hsa-miR-1915-3p; hsa-miR-605-3p; hsa-miR-627-3p; hsa-miR-6779-5p; hsa-miR-3689c; hsa-miR-3689b-3p; hsa-miR-3689a-3p; hsa-miR-30b-3p;hsa-miR-1273h-5p; hsa-miR-4482-3p; hsa-miR-3128; hsa-miR-4497; hsa-miR-4297; hsa-miR-548z; hsa-miR-548h-3p; hsa-miR-548d-3p; hsa-miR-548bb-3p;hsa-miR-548ac; hsa-miR-3653-3p
7 NR_047664 MEG9 hsa-miR-4535; hsa-miR-4319; hsa-miR-7107-3p; hsa-miR-6753-3p; hsa-miR-4447; hsa-miR-6722-3p; hsa-miR-6069; hsa-miR-4426; hsa-miR-6721-5p;hsa-miR-7150; hsa-miR-1275; hsa-miR-7111-5p; hsa-miR-6870-5p; hsa-miR-5698; hsa-miR-4723-5p; hsa-miR-7-5p; hsa-miR-6165; hsa-miR-6502-5p;hsa-miR-1301-5p; hsa-miR-125b-5p; hsa-miR-125a-5p; hsa-miR-1226-5p;hsa-miR-4329; hsa-miR-4692; hsa-miR-4306; hsa-miR-4463; hsa-miR-4483;hsa-miR-205-3p; hsa-miR-8085; hsa-miR-6731-5p; hsa-miR-4283; hsa-miR-6794-5p; hsa-miR-4716-3p; hsa-miR-5010-5p; hsa-miR-4525; hsa-miR-4726-5p; hsa-miR-4640-5p
(continued on next page)
Lietal.(2018),PeerJ,DOI10.7717/peerj.5721
8/22

Table 1 (continued)
No. Probe Official Symbol Target miRNAs predicted
8 NR_047573 /// NR_047574 ///NR_047575
TMEM44-AS1 hsa-miR-4468; hsa-miR-659-3p; hsa-miR-1304-5p; hsa-miR-4478; hsa-miR-4291; hsa-miR-661; hsa-miR-6801-5p; hsa-miR-6742-3p; hsa-miR-653-3p;hsa-miR-6813-5p; hsa-miR-6085; hsa-miR-3922-5p; hsa-miR-4650-5p; hsa-miR-4717-5p; hsa-miR-3119; hsa-miR-597-3p; hsa-miR-7975; hsa-miR-296-5p; hsa-miR-2110; hsa-miR-4468; hsa-miR-659-3p; hsa-miR-1304-5p; hsa-miR-4478; hsa-miR-4291; hsa-miR-661; hsa-miR-653-3p; hsa-miR-6823-3p; hsa-miR-2114-3p; hsa-miR-6801-5p; hsa-miR-6742-3p; hsa-miR-4261; hsa-miR-6813-5p; hsa-miR-6085; hsa-miR-3922-5p; hsa-miR-4650-5p; hsa-miR-4717-5p; hsa-miR-3119; hsa-miR-597-3p; hsa-miR-7975; hsa-miR-2110; hsa-miR-4468; hsa-miR-659-3p; hsa-miR-1304-5p; hsa-miR-4478; hsa-miR-4291; hsa-miR-653-3p; hsa-miR-661; hsa-miR-6823-3p; hsa-miR-2114-3p; hsa-miR-6801-5p; hsa-miR-6742-3p; hsa-miR-4261; hsa-miR-6813-5p; hsa-miR-6085; hsa-miR-3922-5p; hsa-miR-4650-5p; hsa-miR-4717-5p; hsa-miR-3119; hsa-miR-597-3p; hsa-miR-7975
9 NR_033981 LRRC8C-DT hsa-miR-3914; hsa-miR-194-3p; hsa-miR-937-3p; hsa-miR-608; hsa-miR-4651;hsa-miR-4707-5p; hsa-miR-1256; hsa-miR-561-5p; hsa-miR-4456; hsa-miR-1233-3p
10 NR_033519 MASP1 hsa-miR-4283; hsa-miR-6746-3p; hsa-miR-4441; hsa-miR-4763-5p; hsa-miR-1286; hsa-miR-5092; hsa-miR-4267; hsa-miR-4478; hsa-miR-1207-5p; hsa-miR-4531; hsa-miR-6768-3p; hsa-miR-4522; hsa-miR-6752-3p; hsa-miR-518c-5p;hsa-miR-6773-5p; hsa-miR-6724-5p; hsa-miR-6081; hsa-miR-6805-3p; hsa-miR-5691; hsa-miR-6718-5p; hsa-miR-203b-5p; hsa-miR-4316; hsa-miR-1976;hsa-miR-3116; hsa-miR-1254; hsa-miR-376b-3p; hsa-miR-376a-3p
11 NR_038440 TBX5-AS1 hsa-miR-450b-5p; hsa-miR-4455; hsa-miR-765; hsa-miR-4532; hsa-miR-5192; hsa-miR-4428; hsa-miR-4419a; hsa-miR-296-5p; hsa-miR-6859-5p;hsa-miR-3916; hsa-miR-4263; hsa-miR-6802-3p; hsa-miR-3914; hsa-miR-933;hsa-miR-6805-5p; hsa-miR-129-5p; hsa-miR-1184; hsa-miR-6828-3p; hsa-miR-6129; hsa-miR-2115-3p; hsa-miR-4463; hsa-miR-4261; hsa-miR-3116; hsa-miR-1254; hsa-miR-4516; hsa-miR-2110; hsa-miR-1273h-3p; hsa-miR-6125;hsa-miR-491-5p
12 NR_125994 /// NR_125995 ///NR_125996
LINC01770 hsa-miR-4723-5p; hsa-miR-7111-5p; hsa-miR-6870-5p; hsa-miR-5698;hsa-miR-1275; hsa-miR-4268; hsa-miR-4261; hsa-miR-4532; hsa-miR-604;hsa-miR-4723-5p; hsa-miR-7111-5p; hsa-miR-6870-5p; hsa-miR-5698;hsa-miR-1275; hsa-miR-4268; hsa-miR-4261; hsa-miR-4532; hsa-miR-604;hsa-miR-1227-5p; hsa-miR-4723-5p; hsa-miR-7111-5p; hsa-miR-6870-5p;hsa-miR-5698; hsa-miR-4447; hsa-miR-1275; hsa-miR-2861; hsa-miR-4268;hsa-miR-4267; hsa-miR-4261; hsa-miR-4532; hsa-miR-4707-5p; hsa-miR-6885-5p; hsa-miR-328-5p; hsa-miR-6811-3p; hsa-miR-604; hsa-miR-3620-3p
Lietal.(2018),PeerJ,DOI10.7717/peerj.5721
9/22

Figure 4 Function of lncRNA target genes and pathway cluster analysis. (A) GO cell component (CC)analysis; (B) GO molecular function (MF) analysis; (C) GO biological process (BP) analysis; (D) KEGGpathway analysis.
Full-size DOI: 10.7717/peerj.5721/fig-4
Li et al. (2018), PeerJ, DOI 10.7717/peerj.5721 10/22

Table 2 GO analysis of targeted genes of target miRNAs of lncRNAs.
No. ofgenesin thedataset
No. ofgenesin thebackgrounddataset
Percentageof genes
Foldenrichment
P-value(Hypergeometrictest)
Bonferronimethod
BHmethod
Q-value(Storey-Tibshiranimethod)
Cellular componentNucleus 2,639 5847 39.63058 1.303398 1.48E−89 1.16E−86 1.16E−86 2.80835E−86Cytoplasm 2,501 5684 37.55819 1.270663 5.38E−69 4.22E−66 2.11E−66 5.1183E−66Golgi aparatus 463 897 6.952996 1.490606 9.01E−27 7.07E−24 2.36E−24 5.71401E−24Lysosome 710 1620 10.66226 1.265659 7.19E−16 5.64E−13 1.41E−13 3.42035E−13Plasma membrane 1,407 3,479 21.1293 1.167915 1.7E−15 1.33E−12 2.67E−13 6.47199E−13Perinuclear region 76 131 1.141313 1.675468 3.52E−08 2.76E−05 4.6E−06 1.11666E−05Cytoplasmic vesicle 87 160 1.306502 1.570333 2.23E−07 0.000175 2.5E−05 6.05744E−05Endosome 146 303 2.192521 1.391539 6.7E−07 0.000526 6.57E−05 0.000159399Endoplasmic reticulum 453 1,104 6.802823 1.184963 3.05E−06 0.00239 0.000266 0.000644219Actin cytoskeleton 70 132 1.051209 1.531521 1.04E−05 0.008169 0.000817 0.001981917Perinuclear region ofcytoplasm
64 119 0.961105 1.553224 1.36E−05 0.010642 0.000967 0.002347236
Cytosol 474 1,178 7.118186 1.162006 2.03E−05 0.015898 0.001325 0.003214386Ubiquitin ligase complex 28 43 0.420484 1.880674 4.37E−05 0.034276 0.002637 0.006396921Membrane 156 350 2.342694 1.287188 6.52E−05 0.051154 0.003654 0.008864862Transcriptional repressorcomplex
14 17 0.210242 2.378503 7.49E−05 0.058683 0.003912 0.009491763
ER-Golgi intermediatecompartment
21 30 0.315363 2.021761 8.29E−05 0.064958 0.00406 0.009850062
IntracellularmembranE−boundedorganelle
65 127 0.976123 1.478128 8.85E−05 0.069388 0.004082 0.009902896
Nuclear pore 26 42 0.390449 1.787959 0.000277 0.21717 0.012065 0.029271889Nucleolus 492 1,257 7.388497 1.130329 0.000312 0.24482 0.012885 0.031262049
Molecular functionTranscription factoractivity
450 842 6.757771 1.543387 2.32E−30 5.21E−28 5.21E−28 1.16521E−27
Protein serine/threoninekinase activity
171 301 2.567953 1.640629 1.98E−15 4.43E−13 2.22E−13 4.96214E−13
Transcription regulatoractivity
391 832 5.871753 1.357154 3.83E−14 8.57E−12 2.86E−12 6.39436E−12
Ubiquitin-specific proteaseactivity
195 377 2.928368 1.493736 4.7E−12 1.05E−09 2.63E−10 5.88953E−10
GTPase activity 118 222 1.772038 1.535027 9.96E−09 2.23E−06 4.46E−07 9.98462E−07Cytoskeletal proteinbinding
111 218 1.666917 1.470468 5E−07 0.000112 1.87E−05 4.17818E−05
Receptor signaling complexscaffold activity
154 322 2.31266 1.381177 5.95E−07 0.000133 1.9E−05 4.25886E−05
(continued on next page)
Li et al. (2018), PeerJ, DOI 10.7717/peerj.5721 11/22

Table 2 (continued)
No. ofgenesin thedataset
No. ofgenesin thebackgrounddataset
Percentageof genes
Foldenrichment
P-value(Hypergeometrictest)
Bonferronimethod
BHmethod
Q-value(Storey-Tibshiranimethod)
Guanyl-nucleotide exchangefactor activity
61 112 0.916053 1.572947 1.27E−05 0.002853 0.000357 0.000798111
RNA binding 162 366 2.432798 1.278259 7.4E−05 0.016579 0.001805 0.00403916Protein serine/threoninephosphatase activity
28 44 0.420484 1.837941 8.06E−05 0.018046 0.001805 0.00403916
Receptor signaling proteinserine/threonine kinaseactivity
12 14 0.180207 2.475567 0.000125 0.027935 0.00254 0.005683965
Receptor binding 65 129 0.976123 1.455213 0.00016 0.035854 0.002925 0.00654683Phosphoric diesterhydrolase activity
20 29 0.300345 1.991908 0.00017 0.038025 0.002925 0.00654683
VoltagE−gated ion channelactivity
65 130 0.976123 1.44402 0.000213 0.047665 0.003405 0.007620404
Transporter activity 237 576 3.559093 1.188246 0.000563 0.126085 0.008406 0.018813762Cell adhesion moleculeactivity
151 356 2.267608 1.224936 0.001256 0.281361 0.017585 0.039359191
Cytoskeletal anchoringactivity
23 39 0.345397 1.703376 0.001598 0.357936 0.021055 0.047125868
Ligand-dependent nuclearreceptor activity
21 35 0.315363 1.733021 0.001876 0.420189 0.022115 0.049498701
Lipid kinase activity 21 35 0.315363 1.733021 0.001876 0.420189 0.022115 0.049498701
Biological processRegulation of nucleobase,nucleoside, nucleotide andnucleic acid metabolism
1,222 2,828 18.3511 1.247854 7.26E−25 1.29E−22 1.29E−22 3.32593E−22
Signal transduction 1,561 3,934 23.44196 1.145882 7.17E−14 1.28E−11 6.38E−12 1.6434E−11Cell communication 1,449 3,713 21.76002 1.126977 2.68E−10 4.77E−08 1.59E−08 4.09544E−08Transport 492 1,215 7.388497 1.169402 6.4E−06 0.001139 0.000285 0.000733478Regulation of geneexpression, epigenetic
38 66 0.570656 1.662869 0.000112 0.019988 0.003998 0.010295646
Regulation of translation 10 13 0.150173 2.221911 0.002286 0.406912 0.067819 0.174664437Regulation of cell growth 13 21 0.195225 1.788221 0.009711 1 0.244311 0.629212828VesiclE−mediatedtransport
11 17 0.16519 1.869187 0.01098 1 0.244311 0.629212828
Cellular morphogenesisduring differentiation
3 3 0.045052 2.887818 0.041511 1 0.525479 1
Intracellular signalingcascade
3 3 0.045052 2.887818 0.041511 1 0.525479 1
Morphogenesis 3 3 0.045052 2.887818 0.041511 1 0.525479 1Cell proliferation 19 39 0.285328 1.407265 0.0485 1 0.525479 1
Li et al. (2018), PeerJ, DOI 10.7717/peerj.5721 12/22

Table 3 KEGG pathway analysis of targeted genes of target miRNAs of lncRNAs.
KEGG pathway p-value Genes
Mucin type O-Glycan biosyn-thesis
4.72E−23 C1GALT1 GALNT1 GALNTL6 GALNT3 GALNT10 GALNT13 B4GALT5 GALNT6 GALNT8POC1B-GALNT4 GALNT7 GCNT1 GALNT4 GALNT16
Proteoglycans in cancer 3.48E−09 CD44 PLCE1 PPP1CC ERBB4 MTOR ROCK1 VMP1 IGF1 SOS1 TGFB2 CBLB TP53 LUMRDX FZD7 CAMK2B DDX5 RAF1 SMAD2 PPP1R12B FGFR1 MET MRAS ANK2 SDC4ITGAV ELK1 PRKCB GPC3 PIK3R1 PDPK1 TIMP3 STAT3 MAPK1 ROCK2 IGF2 PRKACAARHGEF12 FZD3 WNT5A PTPN11 FZD6 PDCD4 ITPR1 WNT8B EGFR ANK3 CAV2 CBLCCND1 PIK3CA HPSE FRS2 ERBB3 WNT4 FAS ERBB2 GRB2 HBEGF PTK2 IQGAP1 FZD1WNT7A CAMK2A FGF2 PRKACB PIK3CB VEGFA SOS2 FZD4 WNT9B ITGA2 PTCH1 IGF1RCAMK2D ITPR2 THBS1 GAB1 SDC2 WNT7B WNT3 EZR PPP1CB ANK1 WNT2B KRASHSPG2 BRAF FLNA TWIST1 AKT3 DROSHA RHOA HIF1A PRKCA HGF CAMK2GWNT16NRAS TIAM1 FN1 PPP1R12A PIK3R3 RPS6KB1 EIF4B
Pathways in cancer 1.10E−07 COL4A6 PTGER3 MTOR ROCK1 GNB5 COL4A1 SUFU CCDC6 ARHGEF11 IGF1 SOS1TGFB2 GLI2 CBLB TP53 PTEN CDK6 PDGFRB EP300 JUP FZD7 TGFBR2 RAF1 COL4A5SMAD2 PML EGF GNAI3 HHIP FGFR1 MET LPAR3 CREBBP MAX DVL3 PIAS2 CRKCUL2 TCF7L2 PDGFB FGFR2 ITGAV GNAI2 SHH CTNNA1 STK36 PRKCB PIK3R1 CHUKPDGFRA ADCY4 PLCB4 PLCB1 STAT3 MAPK1 ROCK2 PGF ADCY2 CTBP1 PRKACAARHGEF12 XIAP FZD3 WNT5A EGLN3 FZD6 SMAD3 CSF2RA BIRC5 WNT8B FGF7COL4A4 GNAI1 EGFR FGF12 IKBKB TGFBR1 CBL AXIN2 F2RL3 ITGA6 CCND1 RUNX1T1PIK3CA NKX3-1 MSH6 BMP2 FGF9 LAMC3WNT4 FIGF GNG13 ERBB2 TPM3 DAPK2ARNT CDH1 NFKBIA PTK2 FZD1 PDGFA DCCWNT7A RALA GNAQ BCL2 SKP2 MLH1TCEB1 PRKACB FGF2 STAT5B GNG2 PIK3CB CXCL12 APC BDKRB2 SMAD4 VEGFA SOS2FZD4 GNA12 WNT9B LPAR1 ITGA2 MAPK8 EDNRA PTCH1 TPR IGF1R TRAF3 F2R ADCY5CSF1R GNA11 BCL2L1 FGF18 RASGRP2 STK4 CASP8 MAPK10 AR HDAC2 WNT7B WNT3FGF20 WNT2B ETS1 E2F3 KRAS CTNNA3 BRAF GNG12 APPL1 FGF1 PLD1 RALB GSK3BPPARG AKT3 RHOA HIF1A RARB PRKCA HGF LAMC1 STAT1 RASSF1 COL4A3 TGFARUNX1 FGF14 WNT16 RB1 FGF5 NRAS MAPK9 VHL SLC2A1 FGF23 ADCY1 GNG11 CDK2FN1 HSP90AA1 ARNT2 PIK3R3 MECOM E2F2
Glutamatergic synapse 4.88E−07 CACNA1A HOMER1 KCNJ3 GNB5 GNG12 PRKCB GRIN2B GRM8 PLD1 ADCY4 GRIA4CACNA1C SLC17A8 PLCB4 PLCB1 SLC38A2 MAPK1 JMJD7-PLA2G4B GRM7 GNAQ ADCY2GLS PRKCA PRKACA GRIA1 HOMER2 GRIK4 GRM5 ADRBK1 PRKACB GNG2 GRM3PPP3R1 ITPR1 PPP3CA GRM4 SLC17A6 GLS2 GRIA2 GRM6 GRIK3 GNAI1 SLC17A7GRIN2A GNAI3 ADCY1 ITPR2 GNG11 ADCY5 SLC38A1 GRIA3 GRM2 PLD2 GRIK2ADRBK2 SLC1A2 GRIN3A PLA2G4F PPP3CB DLGAP1 GNG13 TRPC1 GNAI2 GNAO1
Long-term depression 6.64E−07 CACNA1A RAF1 NRAS GRIA2 GUCY1A2 KRAS GNA12 GNAI1 BRAF PRKCB IGF1R GNAI3NOS1 ITPR2 PPP2R1B PLCB4 PLCB1 MAPK1 JMJD7-PLA2G4B GNAQ GRIA3 GNA11 IGF1PPP2CA PRKCA GRIA1 PRKG1 GUCY1B3 PLA2G4F PPP2R1A GUCY1A3 ITPR1 GNAI2GNAO1 GRID2
Thyroid hormone signalingpathway
7.16E−06 DIO2 SIN3A PLCE1 NCOA2 KRAS MTOR PRKCB PFKFB2 PIK3R1 ATP1A4 NCOA1 GSK3BPDPK1 AKT3 PLCB4 PLCB1 MAPK1 NCOA3 MED12L HIF1A PRKCA PRKACA TBC1D4TP53 PRKACB MED1 STAT1 MED14 PIK3CB EP300 MED17 RAF1 THRB KAT2B NRASSLC2A1 SLC16A10 MED24 MED13 CREBBP SLC16A2 NOTCH3 CCND1 ATP2A2 PIK3CANOTCH2 ATP1B2 MED13L PIK3R3 TSC2 ATP1B1 WNT4 HDAC2 ITGAV THRA
Signaling pathways regulatingpluripotency of stem cells
1.63E−05 FZD1 ACVR2B REST HOXB1 WNT7A IGF1 FGF2 PIK3CB HNF1A APC SMAD4 FZD7 PCGF6RAF1 FZD4 MEIS1 WNT9B SMAD2 ZIC3 IGF1R FGFR1 ACVR1 KAT6A RIF1 DVL3 JARID2SMAD9 LIF INHBB TBX3 FGFR2 WNT7B WNT3 IL6ST WNT2B KRAS INHBA BMPR2PCGF3 JAK2 PIK3R1 GSK3B BMPR1A AKT3 STAT3 MAPK1 ZFHX3 ID4 FZD3 PCGF5 ISL1WNT5A FZD6 SMAD3 PAX6 WNT16 SMARCAD1 SOX2 BMI1 NRAS WNT8B POU5F1BOTX1 SMAD5 LIFR AXIN2 ACVR1C PIK3CA PIK3R3 ACVR2A KLF4 BMP2 WNT4 SKILINHBC
(continued on next page)
Li et al. (2018), PeerJ, DOI 10.7717/peerj.5721 13/22

Table 3 (continued)
KEGG pathway p-value Genes
Axon guidance 1.65E−05 SEMA4F EPHA5 NGEF CFL2 SEMA3A EPHA7 KRAS PTK2 ROCK1 SLIT3 EFNB1 PAK6SEMA3E GSK3B DCCMAPK1 ROCK2 NFATC3 RHOA EPHA4 PAK7 ROBO1 EPHB6ARHGEF12 SLIT2 ROBO2 EFNA3 CXCL12 NTN1 EPHA3 SEMA4G PPP3R1 PLXNC1SEMA3C PPP3CA SLIT1 NRAS PAK2 SEMA5B SRGAP3 NFATC2 GNAI1 SEMA6A ABLIM1EFNB3 PAK3 LIMK2 GNAI3 EPHA8 NTNG1 MET EFNB2 DPYSL2 UNC5B UNC5C NCK1SEMA5A PLXNA2 UNC5D SRGAP1 NRP1 SEMA4B LRRC4 EPHB2 PPP3CB RASA1 GNAI2
Hippo signaling pathway 3.59E−05 MOB1B PPP1CC PRKCI DLG1 CDH1 BTRC FZD1 YWHAQ SERPINE1 WNT7A LATS1TGFB2 TEAD3 PPP2R2D GLI2 YWHAH PPP2R1A APC SMAD4 FZD7 LIMD1 TGFBR2INADL FZD4 LATS2 WNT9B WWTR1 PPP2R2A SMAD2WWC1 DLG2 YWHAG FRMD6BBC3 PARD3 DVL3 CSNK1E NF2 TCF7L2 TEAD1 SNAI2 WNT7B WNT3 PPP1CB WNT2BCTNNA1 CTNNA3 BMPR2 CCND2 RASSF6 FGF1 GSK3B BMPR1A PPP2R1B CRB1 TP73FZD3 WNT5A MPP5 RASSF1 FZD6 SMAD3 CTGF BIRC5 YAP1 WNT16 TP53BP2 SOX2WNT8B PARD6G SAV1 GDF6 TGFBR1 AXIN2 FBXW11 DLG3 PPP2CA CCND1 BMP2 WNT4
Renal cell carcinoma 6.78E−05 ARNT ETS1 KRAS BRAF PAK6 PIK3R1 AKT3 MAPK1 PAK7 TCEB1 SOS1 TGFB2 HIF1A HGFRAP1B PIK3CB EP300 RAP1A PTPN11 EGLN3 TGFA RAPGEF1 VEGFA SOS2 RAF1 NRASPAK2 VHL SLC2A1 PAK3 MET CREBBP PIK3CA CRK CUL2 ARNT2 PDGFB GAB1 PIK3R3
Arrhythmogenic right ventric-ular cardiomyopathy (ARVC)
0.000143688 ITGA1 CTNNA1 CTNNA3 DSG2 CACNA1C DMD LMNA PKP2 RYR2 ITGB8 DSC2 SLC8A1CACNG3 JUP CACNA2D1 CACNB3 ITGA2 CACNB2 CACNG7 CACNG8 ITGA6 ATP2A2ITGB6 TCF7L2 DAG1 CACNB4 GJA1 ITGAV CACNB1 CDH2 SGCD ITGA9 ITGA10
Estrogen signaling pathway 0.000148535 FKBP5 CREB3L1 CALM3 HBEGF KRAS KCNJ3 GABBR1 CALM2 PIK3R1 KCNJ6 ADCY4CREB3L2 AKT3 PLCB4 PLCB1 MAPK1 GNAQ ADCY2 KCNJ5 CREB3L3 SOS1 PRKACAPRKACB PIK3CB ATF2 ITPR1 SOS2 RAF1 NRAS GNAI1 EGFR GNAI3 ADCY1 SP1 ITPR2ADCY5 GABBR2 HSP90AA1 CREB5 PIK3CA PIK3R3 CALM1 CREB1 GNAI2 GNAO1
Focal adhesion 0.000167479 COL4A6 PPP1CC COL24A1 PTK2 ROCK1 COL5A1 PAK6 PDGFA VCL COL3A1 COL4A1COL11A1 BCL2 IGF1 PARVA SOS1 ITGB8 PTEN PDGFRB PIK3CB TLN1 RAP1A FLT1RAPGEF1 VEGFA VASP PARVB SOS2 COL4A5 RAF1 ITGA2 MAPK8 RELN EGF IGF1RPPP1R12B PDGFDMET THBS1 COL11A2 ITGB6 CRK PDGFB MAPK10 ITGAV COL27A1ITGA9 PPP1CB ITGA1 TLN2 ELK1 CCND2 BRAF TNR FLNA PRKCB PIK3R1 GSK3BPDGFRA COL1A2 PDPK1 AKT3 VAV3 MAPK1 ROCK2 COL6A3 PGF RHOA PAK7 PRKCACOL6A6 MYLK4 COL1A1 XIAP HGF LAMC1 RAP1B COL4A3 ARHGAP5 PAK2 BCAR1MAPK9 COL4A4 EGFR PAK3 CAV2 FN1 ITGA6 PPP1R12A CCND1 PIK3CA PIK3R3 LAMC3FIGF ERBB2 ITGA10
Adrenergic signaling incardiomyocytes
0.000215463 TPM3 CREB3L1 CALM3 SCN7A PPP1CC PPP2R5E ATP1A4 CREB3L2 CACNA1C PPP2R5DGNAQ BCL2 CAMK2A PPP2R2D PRKACB ADRB1 PIK3CB CACNG3 PPP2R1A ATF2CAMK2B CACNA2D1 PPP2R2A CACNG7 ATP2B2 GNAI3 KCNE1 CAMK2D ADCY5 ATP2A2PPP2R3A CALM1 CACNB4 CACNB1 RPS6KA5 GNAI2 PPP1CB CALM2 PIK3R1 ADCY4AKT3 PPP2R1B PLCB1 PLCB4 MAPK1 ADCY2 CREB3L3 RYR2 PRKCA PRKACA PPP1R1ASLC8A1 ATP2B4 CAMK2G ATP2B1 CACNB3 CREM CACNB2 GNAI1 ADCY1 CACNG8TPM1 PPP2CA CREB5 PIK3CA ATP1B2 PIK3R3 ATP1B1 CREB1
Rap1 signaling pathway 0.000389106 PFN2 CALM3 PLCE1 PRKCI CDH1 PDGFA CSF1 RALA GNAQ IGF1 FGF2 PDGFRBRAPGEF2 PIK3CB TLN1 RAP1A RAPGEF5 FLT1 INSR RAPGEF1 VEGFA VASP RAF1 NGFRLPAR1 MAGI3 EGF GRIN2A IGF1R GNAI3 PDGFD FGFR1 MET MRAS F2R LPAR3 THBS1ADCY5 CSF1R PARD3 FGF18 KRIT1 CRK RASGRP2 PDGFB PRKD3 CALM1 CTNND1FGFR2 GNAI2 MAP2K3 FGF20 TLN2 KRAS BRAF CALM2 PRKCB GRIN2B FGF1 PIK3R1RALB PDGFRA ADCY4 AKT3 PLCB4 PLCB1 MAPK1 PGF ADCY2 RHOA PRKCA SPECC1L-ADORA2A HGF RAP1B EFNA3 FGF14 FGF5 RAPGEF6 NRAS BCAR1 SIPA1L3 FGF7 PARD6GGNAI1 EGFR FGF12 SIPA1L1 FGF23 TIAM1 ADCY1 F2RL3 FARP2 CNR1 MAGI2 PIK3CAANGPT2 PIK3R3 FGF9 FIGF GNAO1
(continued on next page)
Li et al. (2018), PeerJ, DOI 10.7717/peerj.5721 14/22

Table 3 (continued)
KEGG pathway p-value Genes
Ras signaling pathway 0.000425038 CALM3 PLCE1 RASA2 GNB5 PAK6 PDGFA CSF1 JMJD7-PLA2G4B RALA IGF1 RASA4 SOS1KSR1 PLA2G12A PRKACB PLA2G2C FGF2 GNG2 PDGFRB REL PIK3CB RAP1A RAPGEF5FLT1 INSR VEGFA SOS2 RAF1 NGFR MAPK8 EGF GRIN2A IGF1R RASGRF2 PDGFD FGFR1MET MRAS RASAL2 CSF1R RAB5B BCL2L1 FGF18 PLD2 RASGRP2 SYNGAP1 PDGFB GAB1STK4 PLA2G4F RASA1 MAPK10 CALM1 FGFR2 FGF20 ETS1 ELK1 KRAS ABL2 GAB2 GNG12CALM2 PRKCB GRIN2B FGF1 PIK3R1 PLD1 RALB CHUK PDGFRA AKT3 MAPK1 PGFRHOA PAK7 PRKCA PRKACA FOXO4 HGF RAP1B RASSF1 EFNA3 PTPN11 NF1 FGF14FGF5 KSR2 RASAL3 PAK2 NRAS FGF7 MAPK9 EGFR RAB5C FGF12 IKBKB PAK3 FGF23TIAM1 GNG11 PIK3CA ANGPT2 PIK3R3 FGF9 FIGF GNG13
Oxytocin signaling pathway 0.000445043 CALM3 PPP1CC KCNJ2 ROCK1 KCNJ6 CACNA1C JMJD7-PLA2G4B NFATC3 GNAQCAMK2A PRKAA2 KCNJ5 CAMKK1 PRKACB CAMK1G PIK3CB CACNG3 GUCY1A3CAMK2B PRKAB2 CACNA2D1 RAF1 CACNG7 GNAI3 CAMK2D PPP1R12B ITPR2 ADCY5PLA2G4F PPP3CB CALM1 CACNB4 CACNB1 GNAI2 CAMK1 PPP1CB KRAS ELK1 KCNJ3CALM2 PRKCB PIK3R1 ADCY4 PLCB1 PLCB4 ROCK2 MAPK1 ADCY2 RHOA RYR2 PRKCAPRKACAMYLK4 NFATC1 CAMKK2 CAMK4 PRKAA1 CAMK2G PPP3R1 ITPR1 PPP3CACAMK1D NRAS GUCY1A2 PRKAG1 NFATC2 CACNB3 CACNB2 GNAI1 EGFR ADCY1CD38
Synaptic vesicle cycle 0.000719318 ATP6V1H CACNA1A SLC17A6 STX1B UNC13A CPLX3 VAMP2 UNC13C ATP6V1AATP6V0E1 SLC17A7 CLTCL1 ATP6V0B STX2 SLC17A8 ATP6V0A1 SLC18A2 NAPAATP6V0D2 CACNA1B ATP6V1C1 AP2M1 DNM3 ATP6V1B2 SYT1 ATP6V0D1 CLTC AP2B1ATP6V1G2 AP2A1 ATP6V0A2 RIMS1 CPLX2
Glioma 0.000810759 RB1 CALM3 RAF1 SOS2 NRAS E2F3 KRAS MTOR BRAF CALM2 EGFR PRKCB PDGFA EGFPIK3R1 IGF1R CAMK2D PDGFRA AKT3 MAPK1 CAMK2A IGF1 SOS1 CCND1 PRKCAPIK3CA TP53 PTEN PDGFB CDK6 PDGFRB PIK3R3 PIK3CB TGFA CALM1 CAMK2G E2F2CAMK2B
ErbB signaling pathway 0.000950519 HBEGF ERBB4 ELK1 KRAS PTK2 ABL2 MTOR BRAF PRKCB PAK6 PIK3R1 GSK3B BTCAKT3 MAPK1 PAK7 CAMK2A SOS1 PRKCA CBLB STAT5B PIK3CB MAP2K4 TGFACAMK2G CAMK2B SOS2 RAF1 NRAS PAK2 MAPK9 EGFR MAPK8 PAK3 EGF NRG4 CBLCAMK2D NRG3 NCK1 PIK3CA NRG1 CRK GAB1 RPS6KB1 PIK3R3 MAPK10 ERBB3 ERBB2
Choline metabolism in cancer 0.001052847 CHPT1 DGKA DGKG KRAS MTOR PRKCB PDGFA PCYT1B PIK3R1 SLC44A5 PLD1PDGFRA PDPK1 AKT3 MAPK1 JMJD7-PLA2G4B WASL SOS1 HIF1A TSC1 PRKCA LYPLA1PDGFRB PIK3CB DGKI DGKH SLC44A1 SOS2 RAF1 NRAS MAPK9 GPCPD1 EGFR MAPK8DGKB EGF WASF2 DGKZ SP1 PDGFD SLC22A3 PCYT1A PLD2 PIK3CA DGKD PIP5K1BPDGFB RPS6KB1 PIK3R3 PLA2G4F TSC2 WASF3 MAPK10 SLC44A3 SLC5A7 PIP5K1A
TGF-beta signaling pathway 0.001409773 BMPR2 INHBA ROCK1 ACVR2B BMPR1A PPP2R1B MAPK1 RHOA TGFB2 ID4 EP300PPP2R1A SMAD3 SMAD4 TGFBR2 CHRD RBL1 SMAD2 SMAD5 GDF6 TGFBR1 SKP1SP1 FST ACVR1 SMURF2 THBS1 ACVR1C CREBBP PPP2CA SMAD9 RPS6KB1 ZFYVE16ACVR2A INHBB BMP2 INHBC SMURF1
Endocytosis 0.001595389 DNAJC6 SH3GL2 ERBB4 PRKCI ASAP2 CLTCL1 AGAP1 CHMP1B HLA-F TGFB2 PSD4 CBLBAP2M1 DNM3 GIT1 ADRBK1 ADRB1 AP2A1 SH3GLB1 FLT1 TGFBR2 CYTH3 ASAP1 EHD4ACAP2 ARAP2 SMAD2 PML EGF IQSEC3 IGF1R TFRC EPN2 MET DAB2 RUFY1 PSD2 F2RSH3KBP1 SH3GL3 CSF1R RAB5B PARD3 TSG101 RNF41 PLD2 IQSEC1 RAB11A AGAP3VTA1 RAB11FIP2 ARFGEF1 FGFR2 SMURF1 ITCH PIP5K1A RAB31 ARF5 ARF1 GIT2 SMAP2STAM2 PLD1 PDGFRA EEA1 VPS36 STAMBP RABEP1 CCR5 RHOA EPN3 EPS15 WWP1AGAP2 CLTC GRK1 ARF3 SMAD3 CHMP4B RAB22A RAB11FIP4 EHD2 ARFGEF2 CHMP7PARD6G ZFYVE20 NEDD4 EGFR RAB5C CAV2 TGFBR1 CBL SMURF2 PSD3 SH3GLB2CHMP2B RAB11FIP1 ARFGAP3 ADRBK2 PIP5K1B PDCD6IP AP2B1 ZFYVE16 VPS37DERBB3 ASAP3 ARRB1
cGMP-PKG signalingpathway
0.001839639 CREB3L1 CALM3 PPP1CC PRKCE KCNMA1 ROCK1 ATP1A4 IRS2 CREB3L2 MEF2DCACNA1C NFATC3 GNAQ PDE3A ADRB1 PIK3CB ATF2 GUCY1A3 BDKRB2 INSR VASPRAF1 MEF2A ADRA2A PDE5A GNA12 EDNRA ATP2B2 GNAI3 ITPR2 IRS1 PDE2A ADCY5GNA11 ATP2A2 PPP3CB KCNMB1 CALM1 GNAI2 PPP1CB CALM2 PIK3R1 ADCY4 AKT3PLCB1 PLCB4 ROCK2 MAPK1 ADCY2 RHOA CREB3L3 MYLK4 NFATC1 SLC8A1 SRFPRKG1 ATP2B4 PPP3R1 ITPR1 MRVI1 PPP3CA ATP2B1 GUCY1A2 NFATC2 GNAI1 ADCY1PPP1R12A GTF2IRD1 CREB5 PIK3CA ATP1B2 MEF2C PIK3R3 GUCY1B3 ATP1B1 CREB1
(continued on next page)
Li et al. (2018), PeerJ, DOI 10.7717/peerj.5721 15/22

Table 3 (continued)
KEGG pathway p-value Genes
Prostate cancer 0.002067438 CREB3L1 NFKBIA E2F3 KRAS MTOR BRAF PDGFA PIK3R1 CHUK GSK3B PDGFRACREB3L2 PDPK1 AKT3 MAPK1 BCL2 IGF1 CREB3L3 SOS1 TP53 PTEN PDGFRB PIK3CBEP300 TGFA RB1 SOS2 RAF1 NRAS EGFR IKBKB EGF IGF1R PDGFD FGFR1 CDK2 CREBBPHSP90AA1 CREB5 CCND1 PIK3CA TCF7L2 NKX3-1 PDGFB PIK3R3 AR E2F2 FGFR2 CREB1ERBB2
Cholinergic synapse 0.002775275 CACNA1A CREB3L1 KCNJ2 KRAS KCNJ3 GNB5 GNG12 PRKCB PIK3R1 JAK2 CHRM1CHRNB2 CHAT KCNJ6 ADCY4 CREB3L2 CACNA1C AKT3 PLCB4 PLCB1 MAPK1 CACNA1BGNAQ ADCY2 BCL2 CAMK2A CREB3L3 PRKCA PRKACA KCNQ3 KCNQ5 PRKACB GNG2PIK3CB CAMK4 CAMK2G ITPR1 CAMK2B NRAS GNAI1 GNAI3 ADCY1 CAMK2D ITPR2GNG11 CHRM3 ADCY5 GNA11 CHRM2 CREB5 CHRNA7 PIK3CA KCNQ4 PIK3R3 GNG13GNAI2 CREB1 GNAO1 SLC5A7
Cocaine addiction 0.003037997 CREB3L1 BDNF GRIA2 GNAI1 GRIN2B GRIN2A FOSB GNAI3 CREB3L2 PDYN SLC18A2ADCY5 CDK5R1 CREB3L3 GRM2 CREB5 PRKACA PRKACB GRIN3A GRM3 ATF2 GNAI2CREB1
Pancreatic cancer 0.005050774 ARHGEF6 TGFBR2 RB1 VEGFA RAF1 E2F3 MAPK9 KRAS BRAF MAPK8 EGFR SMAD2 IK-BKB EGF PIK3R1 PLD1 RALB CHUK TGFBR1 AKT3 STAT3 MAPK1 RALA BCL2L1 TGFB2CCND1 PIK3CA TP53 CDK6 STAT1 PIK3R3 PIK3CB MAPK10 SMAD3 TGFA E2F2 ERBB2SMAD4
Wnt signaling pathway 0.008236698 BTRC FZD1 CSNK2A2 WNT7A NFATC3 CAMK2A GPC4 CHD8 TP53 PRKACB PORCNEP300 TBL1X APC SMAD4 FZD7 CAMK2B TBL1XR1 VANGL2 FZD4 CSNK1A1L WNT9BMAPK8 MAP3K7 CAMK2D LRP6 CREBBP DVL3 CSNK1E FRAT1 TCF7L2 PPP3CB CSNK1A1MAPK10 DKK2 WNT7B WNT3 WNT2B CSNK2A1 CCND2 PRKCB GSK3B SFRP1 PLCB1PLCB4 ROCK2 DAAM1 RHOA CTBP1 PRKCA PRKACA CXXC4 NFATC1 FZD3 WNT5AFZD6 SMAD3 PPP3R1 CAMK2G PPP3CAWNT16 NLK PRICKLE2 WNT8B MAPK9 NFATC2SKP1 AXIN2 FBXW11 DAAM2 CCND1 SIAH1 WNT4 SOST
Amphetamine addiction 0.010922929 PPP1CB CREB3L1 CALM3 PPP1CC CALM2 PRKCB GRIN2B GRIA4 CREB3L2 CACNA1CPDYN SLC18A2 CAMK2A ARC CREB3L3 PRKCA PRKACA GRIA1 PRKACB ATF2 CAMK4CAMK2G PPP3R1 CAMK2B PPP3CA GRIA2 GRIN2A FOSB CAMK2D ADCY5 GRIA3 CREB5GRIN3A PPP3CB CALM1 CREB1
Adherens junction 0.011434632 YES1 PVRL3 CTNNA1 CDH1 CSNK2A1 CTNNA3 IQGAP1 FER VCL CSNK2A2 PVRL1MAPK1 WASL RHOA PVRL4 TJP1 LMO7 EP300 SMAD3 SMAD4 INSR TGFBR2 NLK SSX2IPSORBS1 EGFR SMAD2 PTPN1 IGF1R WASF2 TGFBR1 MAP3K7 FGFR1 MET FARP2 CREBBPPARD3 TCF7L2 WASF3 SNAI2 CTNND1 ERBB2 PTPRB
Acute myeloid leukemia 0.017436812 RAF1 SOS2 NRAS KRAS MTOR BRAF IKBKB PML PIK3R1 CHUK AKT3 STAT3 MAPK1SOS1 RUNX1T1 CCND1 PIK3CA PIM2 PIM1 TCF7L2 STAT5B RPS6KB1 PIK3R3 PIK3CBRUNX1 JUP
MAPK signaling pathway 0.02786507 CACNA1A RASA2 MAP4K4 PTPRR RAP1A ATF2 SOS2 RAF1 GNA12 CACNG7 RASGRF2MRAS MAP3K3 RPS6KA1 CRK RASGRP2 STK4 PLA2G4F CACNB4 MAP2K3 FGF20 TAOK3DUSP6 MAP3K1 BRAF GNG12 NTRK2 CHUK PDGFRA PRKCA PPP3R1 FGF14 PAK2 NRASMAP4K3 EGFR ELK4 FGF12 MAP3K4 TGFBR1 CACNG8 DUSP4
and other relevant pathways (Fig. 4D). Eleven of these pathways may be related to thenervous system, including the glutamatergic synapse, axon guidance, Rap1 signalingpathway, Ras signaling pathway, synaptic vesicle cycle, ErbB signaling pathway, TGF-betasignaling pathway, cGMP-PKG signaling pathway, cholinergic synapse, Wnt signalingpathway and MAPK signaling pathway.
DISCUSSIONThere are two main highlights in the research. (1) The differentially expressed lncRNAswere identified through the re-annotation of published microarray results. (2) The target
Li et al. (2018), PeerJ, DOI 10.7717/peerj.5721 16/22
miRNAs of the lncRNAs and target genes were predicted using a bioinformatics method,and GO function and KEGG pathway analyses were performed to learn about the possiblemechanisms of lncRNA involved in the occurrence and development of HIVE.
In recent years, hundreds of lncRNAs have been discovered, and the changes in theexpression of lncRNAs have been associated with the occurrence and development ofmany diseases. Plenty of evidence has shown that lncRNA is involved in the replicationprocess of the virus (Zhang et al., 2013) and that lncRNA is involved in the infection processof HIV through changes in the cellular environment (Barichievy, Naidoo & Mhlanga,2015). However, the role of lncRNA in the occurrence and development of HIV-relatedencephalitis remains unclear. The mRNA, miRNA and lncRNA that were related tothe diseases were identified by microarray and bioinformatic method, which has beenapplied in the study of many human diseases, just the same in the study of HIV-relatedencephalitis. Because the annotation of microarray results has been continuously updated,some new results may be obtained by the re-annotation and re-analysis of published chipsin the common database. In the GEO public database, we retrieved more comprehensivemicroarray results of HIVE related study (multi-group and multi-organization types),and only differential analysis of the expression of mRNA in different brain tissues (thewhite matter, frontal cortex and basal ganglia brain tissues) of each group was carried out.We re-annotated the microarray results and identified possible ncRNA probe results toconstruct the ncRNA microarray results. In addition, we then compared and analyzed theresults to identiry differentially expressed ncRNAs that may be involved in the occurrenceand development of HIVE. We identified 63 probes with the ‘‘NR_’’ logo in the whitematter, one probe with the ‘‘NR_’’ logo in the frontal cortex, and 12 probes with the‘‘NR_’’ logo in basal ganglia. All the probes with the ‘‘NR_’’ logo were retrieved, and itwas found that only 17 probes with the ‘‘NR_’’ logo in the white matter were identifiedas lncRNAs. Among these 17 lncRNAs, expression of five were increasing in Group D,and the others were decreasing. As we found differentially expressed lncRNAs only inwhite matter, we speculated that cerebral white matter lesions may play an importantrole in the pathogenesis of HIV-associated encephalitis, which was also consistent withprevious research results. The central nervous system injury affected by HIV-1 usuallymanifested microglial nodules comprised of multinucleated giant cells and inflammatorycells. These lesions are particularly in white matter (Fischer-Smith et al., 2001) Neuronaldamage in HIVE is generally attributed to fully activated microglia/macrophages, especiallyin white matter (Roberts, Masliah & Fox, 2004). In addition, multinucleated giant cellsand perivascular demyelination leading to white matter pallor are typical features ofHIVE. In addition, these lncRNAs could be used as markers of white matter damageof HIVE. Based on the lncRNA-miRNA-mRNA mechanism,we used bioinformaticstools to predict target miRNAs and target genes of these 17 lncRNAs. GO and KEGGanalysis were carried out to make the correlation cluster analysis on target genes, inorder to explore the potential mechanisms of lncRNAs participating in HIVE. The GOcell component (CC) analysis results revealed that the target genes were significantlyclustered in the nucleus, cytoplasm, Golgi apparatus, lysosome, plasma membrane, etc.The GO molecular function (MF) analysis showed that the target genes were significantly
Li et al. (2018), PeerJ, DOI 10.7717/peerj.5721 17/22

clustered in the transcription factor activity, protein serine/threonine kinase activity,transcription regulator activity, ubiquitin-specific protease activity and other molecularfunctions. The GO biological process (BP) analysis revealed that the target genes weresignificantly clustered in the regulation of nucleobase, nucleoside, nucleotide and nucleicacid metabolism, signal transduction, cell communication, transport and other biologicalprocesses. Therefore, it was proven that lncRNAs may be involved in the occurrence anddevelopment of HIVE by way of their participation in the process of nuclear transcriptionand translation. The KEGG pathway analysis showed the target genes were significantlyclustered in the mucin type O-glycan biosynthesis, proteoglycans in cancer, pathways incancer, the glutamatergic synapse, long-term depression and other relevant pathways. Inprevious research, it was found that a variety of pathways were involved in neurologicaldisorders and even in the occurrence of HIVE. The pathway of glutamatergic synapsewas related with the occurrence of encephalitis, and the patients with anti-NMDARencephalitis had a diminished function of the glutamatergic synapse (Hughes et al., 2010).The expression changes of the glutamatergic synapse in the brain tissues were associatedwith the occurrence of hepatic encephalopathy (Montana, Verkhratsky & Parpura, 2014).For the axon guidance pathway, it has been reported of relevant gene expression impairmentof the axon guidance pathway and its downstream pathway (including MAPK pathway,calcium signaling pathway, Jak-STAT signaling pathway and VEGF signaling pathway)in the brain tissues of the patients with HIV-associated dementia, which provided newideas for the diagnosis and treatment of HIV-associated dementia (Zhou et al., 2012).Both Rap1 signaling pathway and Ras signaling pathway were involved in such nervoussystem functions as glutamatergic synaptic transmission (Imamura et al., 2003), synapticexcitability (Imamura et al., 2004), synaptic reversibility (Masliah et al., 2004), etc. Theabnormal expression of signaling pathway can cause encephalitis and other neuronaldysfunctions. The changes in the synaptic vesicle, especially the synaptic vesicle cycle,can cause abnormal neurotransmitter activity (Cortes-Saladelafont et al., 2016). For theErbB signaling pathway, there were significant changes in the gene expression of ErbBsignaling pathway in the brain tissues of the patients with HIV-associated dementia(Shityakov, Dandekar & Forster, 2015). The TGF-β signaling pathway was also involvedin the pathophysiology of the nervous system, which can limit inflammation and reduceneurological damage in the nervous system infection process (Cekanaviciute et al., 2014).The TGF-β signaling pathway was also related with the tolerance of dendritic cells(Esebanmen & Langridge, 2017). Together with the STAT2 signaling pathway, the TGF-βsignaling pathway can inhibit the progression of autoimMune encephalopathy (Xu et al.,2014). For the cGMP-PKG signaling pathway, its abnormality had something to do withthe diseases of the nervous system, and reduced kinase activity in the cGMP-PKG signalingpathway was found in rats with hepatic encephalopathy. Cognitive disorders could berelieved when the NO/sGC/cGMP/PKG signaling pathway was inhibited in diabetic rats.The iNOS-NO-cGMP signaling pathway also was involved in nervous system inflammationand myelin formation (Raposo et al., 2014). The activation of the Wnt signaling pathwaycould promote the occurrence of autoimMune encephalitis (Schneider et al., 2016), andthe Wnt signaling pathway was involved in the immunity and tolerance of dendritic
Li et al. (2018), PeerJ, DOI 10.7717/peerj.5721 18/22

cells (Swafford & Manicassamy, 2015). Moreover, plasma Dickkopf-related protein 1, theantagonist of theWnt signaling pathway, was associated with HIV-related cognitive deficits(Yu et al., 2017). Therefore, KEGG analysis showed that most of the significant clusteringpathways were related with the function of the nervous system. Thus, the differentiallyexpressed lncRNAs, act as ‘‘molecular sponges’’, could affect the function of their targetmiRNAs, and thereby regulating target genes. It can be confirmed that lncRNA is indeedinvolved in the occurrence and development of HIV-related encephalopathy through thelncRNA-miRNA-gene mechanism. In addition, it could also be indirectly confirmed thatit is feasible to construct a new chips by re-annotation and identify differentially expressedlncRNA from a expression chip.
CONCLUSIONSThe brand-new microarray results from a different perspective can be constructed throughthe updated annotation of the precious and published microarray data. In this study,the lncRNA results were obtained through the re-annotation of microarray data, whichprovides the foundation for further research on the role of lncRNA in the occurrence anddevelopment of HIVE. From the point of view of the lncRNA-miRNA-target genes, clusteranalysis was performed by various bioinformatic methods to explore the role of lncRNA.GO analysis showed that lncRNA may be involved in the occurrence and developmentof HIVE via its participation in the nuclear transcription and translation. The KEGGpathway analysis showed that most of the KEGG pathways with statistical significancewere associated with the function of the nervous system. Therefore, we can speculate thatlncRNA is indeed involved in the occurrence and development of HIVE, which is of greatsignificance for future research on lncRNA on HIVE. It is also proved that it is feasible toidentify lncRNAs from public database.
ADDITIONAL INFORMATION AND DECLARATIONS
FundingThisworkwas supported by theNational Significant Science Foundation (2015ZX09J15102-003). The funders had no role in study design, data collection and analysis, decision topublish, or preparation of the manuscript.
Grant DisclosuresThe following grant information was disclosed by the authors:National Significant Science Foundation: 2015ZX09J15102-003.
Competing InterestsThe authors declare there are no competing interests.
Author Contributions• Diangeng Li and Meiling Jin conceived and designed the experiments, performed theexperiments, analyzed the data, contributed reagents/materials/analysis tools, preparedfigures and/or tables, authored or reviewed drafts of the paper, approved the final draft.
Li et al. (2018), PeerJ, DOI 10.7717/peerj.5721 19/22
• Pengtao Bao, Zhiwei Yin, Lei Sun, Jin Feng and Zheng He performed the experiments,analyzed the data.• Changting Liu conceived and designed the experiments, authored or reviewed drafts ofthe paper, approved the final draft.
Data AvailabilityThe following information was supplied regarding data availability:
The raw measurements are provided in Data S1.
Supplemental InformationSupplemental information for this article can be found online at http://dx.doi.org/10.7717/peerj.5721#supplemental-information.
REFERENCESBarichievy S, Naidoo J, MhlangaMM. 2015. Non-coding RNAs and HIV: viral manip-
ulation of host dark matter to shape the cellular environment. Frontiers in Genetics6:Article 108 DOI 10.3389/fgene.2015.00108.
Cekanaviciute E, Dietrich HK, Axtell RC,Williams AM, Egusquiza R,Wai KM, KoshyAA, Buckwalter MS. 2014. Astrocytic TGF-beta signaling limits inflammation andreduces neuronal damage during central nervous system Toxoplasma infection.Journal of Immunology 193:139–149 DOI 10.4049/jimmunol.1303284.
Clifford DB, Ances BM. 2013.HIV-associated neurocognitive disorder. The LancetInfectious Diseases 13:976–986 DOI 10.1016/S1473-3099(13)70269-X.
Cortes-Saladelafont E, Tristan-Noguero A, Artuch R, Altafaj X, Bayes A, Garcia-Cazorla A. 2016. Diseases of the synaptic vesicle: a potential new group of neu-rometabolic disorders affecting neurotransmission. Seminars in pediatric neurology23:306–320 DOI 10.1016/j.spen.2016.11.005.
Costa FF. 2010. Non-coding RNAs: meet thy masters. BioEssays 32:599–608DOI 10.1002/bies.200900112.
Esebanmen GE, LangridgeWHR. 2017. The role of TGF-beta signaling in dendritic celltolerance. Immunologic Research 65:987–994 DOI 10.1007/s12026-017-8944-9.
Fischer-Smith T, Croul S, Sverstiuk AE, Capini C, L’Heureux D, Regulier EG, Richard-sonMW, Amini S, Morgello S, Khalili K, Rappaport J. 2001. CNS invasion byCD14+/CD16+ peripheral blood-derived monocytes in HIV dementia: perivascularaccumulation and reservoir of HIV infection. Journal of Neurovirology 7:528–541DOI 10.1080/135502801753248114.
Hughes EG, Peng X, Gleichman AJ, Lai M, Zhou L, Tsou R, Parsons TD, LynchDR, Dalmau J, Balice-Gordon RJ. 2010. Cellular and synaptic mechanisms ofanti-NMDA receptor encephalitis. The Journal of Neuroscience 30:5866–5875DOI 10.1523/JNEUROSCI.0167-10.2010.
Imamura Y, Matsumoto N, Kondo S, Kitayama H, NodaM. 2003. Possible involvementof Rap1 and Ras in glutamatergic synaptic transmission. Neuroreport 14:1203–1207DOI 10.1097/01.wnr.0000081872.45938.1f.
Li et al. (2018), PeerJ, DOI 10.7717/peerj.5721 20/22

Imamura Y, Matsumoto N, Kondo S, Kitayama H, NodaM. 2004. Effects of ras andRap1 on electrical excitability of differentiated NG108-15 cells. Neuroscience127:973–981 DOI 10.1016/j.neuroscience.2004.05.051.
Kumar AM, Borodowsky I, Fernandez B, Gonzalez L, KumarM. 2007.Humanimmunodeficiency virus type 1 RNA Levels in different regions of human brain:quantification using real-time reverse transcriptase-polymerase chain reaction.Journal of Neurovirology 13:210–224 DOI 10.1080/13550280701327038.
Masliah E, DeTeresa RM,Mallory ME, Hansen LA. 2000. Changes in patholog-ical findings at autopsy in AIDS cases for the last 15 years. Aids 14:69–74DOI 10.1097/00002030-200001070-00008.
Masliah E, Roberts ES, Langford D, Everall I, Crews L, Adame A, RockensteinE, Fox HS. 2004. Patterns of gene dysregulation in the frontal cortex of pa-tients with HIV encephalitis. Journal of Neuroimmunology 157:163–175DOI 10.1016/j.jneuroim.2004.08.026.
Montana V, Verkhratsky A, Parpura V. 2014. Pathological role for exocytotic glutamaterelease from astrocytes in hepatic encephalopathy. Current Neuropharmacology12:324–333 DOI 10.2174/1570159X12666140903094700.
Raposo C, Luna RL, Nunes AK, Thome R, Peixoto CA. 2014. Role of iNOS-NO-cGMPsignaling in modulation of inflammatory and myelination processes. Brain ResearchBulletin 104:60–73 DOI 10.1016/j.brainresbull.2014.04.002.
Roberts ES, Masliah E, Fox HS. 2004. CD163 identifies a unique population of ramifiedmicroglia in HIV encephalitis (HIVE). Journal of Neuropathology and ExperimentalNeurology 63:1255–1264 DOI 10.1093/jnen/63.12.1255.
Salmena L, Poliseno L, Tay Y, Kats L, Pandolfi PP. 2011. A ceRNA hypothesis: theRosetta Stone of a hidden RNA language? Cell 146:353–358DOI 10.1016/j.cell.2011.07.014.
Schneider R, Koop B, Schroter F, Cline J, Ingwersen J, Berndt C, Hartung HP, Aktas O,Prozorovski T. 2016. Activation of Wnt signaling promotes hippocampal neuroge-nesis in experimental autoimMune encephalomyelitis.Molecular Neurodegeneration11:Article 53 DOI 10.1186/s13024-016-0117-0.
Shityakov S, Dandekar T, Forster C. 2015. Gene expression profiles and protein-proteininteraction network analysis in AIDS patients with HIV-associated encephalitis anddementia. HIV/AIDS 7:265–276 DOI 10.2147/HIV.S88438.
Stam AJ, Nijhuis M, Van den BerghWM,Wensing AM. 2013. Differential genotypicevolution of HIV-1 quasispecies in cerebrospinal fluid and plasma: a systematicreview. AIDS Reviews 15:152–161.
Swafford D, Manicassamy S. 2015.Wnt signaling in dendritic cells: its role in regulationof immunity and tolerance. Discovery Medicine 19:303–310.
Xu G, Hu J, Fang X, Zhang X,Wang J, Guo Y, Li T, Chen Z, DaiW, Liu C. 2014.Genome sequence of pseudomonas aeruginosa strain LCT-PA220, which wasselected after space flight by using Biolog’s powerful carbon source utilizationtechnology. Genome Announcements 2:e00169-14 DOI 10.1128/genomeA.00169-14.
Li et al. (2018), PeerJ, DOI 10.7717/peerj.5721 21/22

Yu C, SeatonM, Letendre S, Heaton R, Al-Harthi L. 2017. Plasma dickkopf-relatedprotein 1, an antagonist of the Wnt pathway, is associated with HIV-associatedneurocognitive impairment. AIDS 31(10):1379–1385DOI 10.1097/QAD.0000000000001481.
Zhang Q, Chen CY, Yedavalli VS, Jeang KT. 2013. NEAT1 long noncoding RNA andparaspeckle bodies modulate HIV-1 posttranscriptional expression.mBio 4:e00596–e00512 DOI 10.1128/mBio.00596-12.
Zhou L, Pupo GM, Gupta P, Liu B, Tran SL, Rahme R,Wang B, Rua R, Rizos H, CarrollA, Cairns MJ, Saksena NK. 2012. A parallel genome-wide mRNA and microRNAprofiling of the frontal cortex of HIV patients with and without HIV-associated de-mentia shows the role of axon guidance and downstream pathways in HIV-mediatedneurodegeneration. BMC Genomics 13:677 DOI 10.1186/1471-2164-13-677.
Li et al. (2018), PeerJ, DOI 10.7717/peerj.5721 22/22