exploring the larval transcriptome of the common sole (solea
TRANSCRIPT

Ferraresso et al. BMC Genomics 2013, 14:315http://www.biomedcentral.com/1471-2164/14/315
RESEARCH ARTICLE Open Access
Exploring the larval transcriptome of the commonsole (Solea solea L.)Serena Ferraresso1*, Alessio Bonaldo2, Luca Parma2, Stefano Cinotti3, Paola Massi4, Luca Bargelloni1
and Pier Paolo Gatta2
Abstract
Background: The common sole (Solea solea) is a promising candidate for European aquaculture; however, thelimited knowledge of the physiological mechanisms underlying larval development in this species has hamperedthe establishment of successful flatfish aquaculture. Although the fact that genomic tools and resources areavailable for some flatfish species, common sole genomics remains a mostly unexplored field. Here, we report, forthe first time, the sequencing and characterisation of the transcriptome of S. solea and its application for the studyof molecular mechanisms underlying physiological and morphological changes during larval-to-juvenile transition.
Results: The S. solea transcriptome was generated from whole larvae and adult tissues using the Roche 454platform. The assembly process produced a set of 22,223 Isotigs with an average size of 726 nt, 29 contigs and atotal of 203,692 singletons. Of the assembled sequences, 75.2% were annotated with at least one known transcript/protein; these transcripts were then used to develop a custom oligo-DNA microarray. A total of 14,674oligonucleotide probes (60 nt), representing 12,836 transcripts, were in situ synthesised onto the array using Agilentnon-contact ink-jet technology. The microarray platform was used to investigate the gene expression profiles ofsole larvae from hatching to the juvenile form. Genes involved in the ontogenesis of the visual system are up-regulated during the early stages of larval development, while muscle development and anaerobic energypathways increase in expression over time. The gene expression profiles of key transcripts of the thyroid hormones(TH) cascade and the temporal regulation of the GH/IGF1 (growth hormone/insulin-like growth factor I) systemsuggest a pivotal role of these pathways in fish growth and initiation of metamorphosis. Pre-metamorphic larvaedisplay a distinctive transcriptomic landscape compared to previous and later stages. Our findings highlighted theup-regulation of gene pathways involved in the development of the gastrointestinal system as well as biologicalprocesses related to folic acid and retinol metabolism. Additional evidence led to the formation of the hypothesisthat molecular mechanisms of cell motility and ECM adhesion may play a role in tissue rearrangement duringcommon sole metamorphosis.
Conclusions: Next-generation sequencing provided a good representation of the sole transcriptome, and thecombination of different approaches led to the annotation of a high number of transcripts. The construction of amicroarray platform for the characterisation of the larval sole transcriptome permitted the definition of the mainprocesses involved in organogenesis and larval growth.
Keywords: Solea solea, Flatfish, Larval development, Metamorphosis, Transcriptome, Gene expression
* Correspondence: [email protected] of Comparative Biomedicine and Food Science, University ofPadova, Viale dell’Università 16, Legnaro, PD 35020, ItalyFull list of author information is available at the end of the article
© 2013 Ferraresso et al.; licensee BioMed Central Ltd. This is an Open Access article distributed under the terms of the CreativeCommons Attribution License (http://creativecommons.org/licenses/by/2.0), which permits unrestricted use, distribution, andreproduction in any medium, provided the original work is properly cited.

Ferraresso et al. BMC Genomics 2013, 14:315 Page 2 of 22http://www.biomedcentral.com/1471-2164/14/315
BackgroundFlatfish (order Pleuronectiformes) include 716 differentspecies worldwide, mostly marine, which undergo aunique developmental process during the larval-to-ju-venile transition in which one eye migrates across thetop of the skull to lie adjacent to the other eye on theopposite side, while the body flattens and lies on the eye-less side [1]. Members of the order Pleuronectiformesalso represent an important food resource as low-fat fishwith a white, flavourful flesh that is highly acceptable toconsumers. Despite their economic importance, flatfishproduction is still much lower than that of salmonids,cyprinids or other marine species such as the Europeansea bass and the gilthead sea bream. In Europe, the maincultured flatfish species are turbot, Atlantic halibut, and,to a lesser extent, the Senegalese sole and the commonsole [2]. The limited knowledge of the basic biology offlatfish has hampered the development of efficient aqua-culture practices for these species. The highest mortal-ities during the entire fish life cycle occur during larvaldevelopment, particularly during the transition fromendogenous to exogenous feeding, weaning and meta-morphosis [3,4]. Flatfish metamorphosis and other de-velopmental events involve drastic morphological andphysiological changes, the molecular basis of which re-mains poorly understood. The transition from larval tojuvenile stage involves the development of most organsand tissues, the maturation of different physiologicalfunctions and the establishment of the immune system;therefore, this transition represents a critical step in flat-fish farming. In fact, the current bottlenecks in flatfishproduction are mainly associated with the optimisationof larval culture and nutrition as well as the high larvalmortality due to infectious diseases. The limited know-ledge of the physiological mechanisms underlying larvaldevelopment has hampered the establishment of a suc-cessful flatfish aquaculture [5,6]. In recent years, func-tional genomics and proteomics approaches have beenapplied to flatfish research in order to enhance theknowledge of the biology of these species and shed lighton the molecular mechanisms underlying differentphysiological processes [7-12]. The identification andcharacterisation of genes and gene networks controllingtraits of commercial interest such as growth rate,reproduction and disease resistance would facilitate theoptimisation of production and management proceduresin the industry.The common sole (Solea solea), which is characterised
by high flesh quality and high market value, is a verypromising candidate for European aquaculture. Thedevelopment of a robust sole aquaculture productionwill also help reduce fishing pressure on wild sole popu-lations, which are currently overexploited. As for otherflatfish species, however, several critical bottlenecks
must be addressed in order to establish large scale solefarming production. Feeding behaviour, susceptibility todiseases, stocking density as well as juvenile mortalityrepresent key critical factors for sole aquaculture. Al-though genomic tools and resources are available forsome flatfish species (e.g. turbot, Atlantic halibut, Sene-galese sole), common sole genomics remains a mostlyunexplored area of research.Here, we report for the first time the sequencing and
characterisation of the transcriptome of S. solea, focus-ing on larval and juvenile stages. After transcriptomesequencing and annotation, an oligo-DNA microarrayfor the detection of 12,836 unique transcripts was devel-oped and applied to the study of molecular mechanismsunderlying physiological and morphological changesduring the larval-to-juvenile transition.
ResultsS. solea larval transcriptome assembly and annotationHigh-throughput sequencing of a S. solea cDNA librarygenerated a total of 909,466 sequences (882,214 aftertrimming), with a mean length of 245 nucleotides (nt).Newly produced sequences were assembled togetherwith already available mRNA sequences (314,486; seeMethods) with Newbler 2.6. The software produced aset of 22,223 Isotigs (grouped into 20,281 Isogroups)with an average size of 726 nt (N50 Isotig Size 808 nt),29 contigs and a total of 203,692 singletons. The finalnumber of aligned reads was 941,883 (78.71%) (numberassembled = 852,258). All Isotigs and contigs have beenstored in the public database Transcriptome ShotgunAssembly Sequence Database (TSA, [13]) under acces-sion number GAAQ00000000; transcripts sequences canbe retrieved by using the sequence name as the search cri-teria. The putative identities of the assembled sequenceswere obtained by running Blastx and Blastn similaritysearches on 18 different protein and nucleotide databases.Of 22,252 unique sequences, 16,731 (75.2%) showed atleast one significant match with a known transcript orprotein. All transcripts and corresponding annotations arelisted in Additional file 1. After further clustering byproteome mapping, a total of 1,346 Isotigs (1,196 showingthe same annotation with all 5 fish species) were filteredout, yielding a total of 15,385 unique annotated tran-scripts, which were employed for microarray design. TheSimple Sequence Repeats (SSRs) content of all Isotigs andcontigs was also investigated. Of 22,252 sequences exam-ined, 3,612 contained at least one SSR, with 638 sequencesshowing more than one SSR, for a total of 4,402 identifiedSSRs. The number of repeated dinucleotides was 2,622,with “AC” and “TG” SSRs being the most frequent (520SSRs and 506 SSRs, respectively). The number of re-peated trinucleotides was 1,486 (the “TTC” trinucleo-tide was the most frequent, with 89 SSRs). The number
Ferraresso et al. BMC Genomics 2013, 14:315 Page 3 of 22http://www.biomedcentral.com/1471-2164/14/315
of tetranucleotide repeats was 247, while penta- andhexanucleotide microsatellites accounted for 34 and 16SSRs, respectively.
Global gene expression analysisRaw and normalised fluorescence data from all micro-array experiments have been deposited in the GEOdatabase [14] under accession number GSE41261. Threedifferent clustering methods were employed in order togroup samples according to their gene expression pro-files. Principal Component Analysis (PCA) on the entire
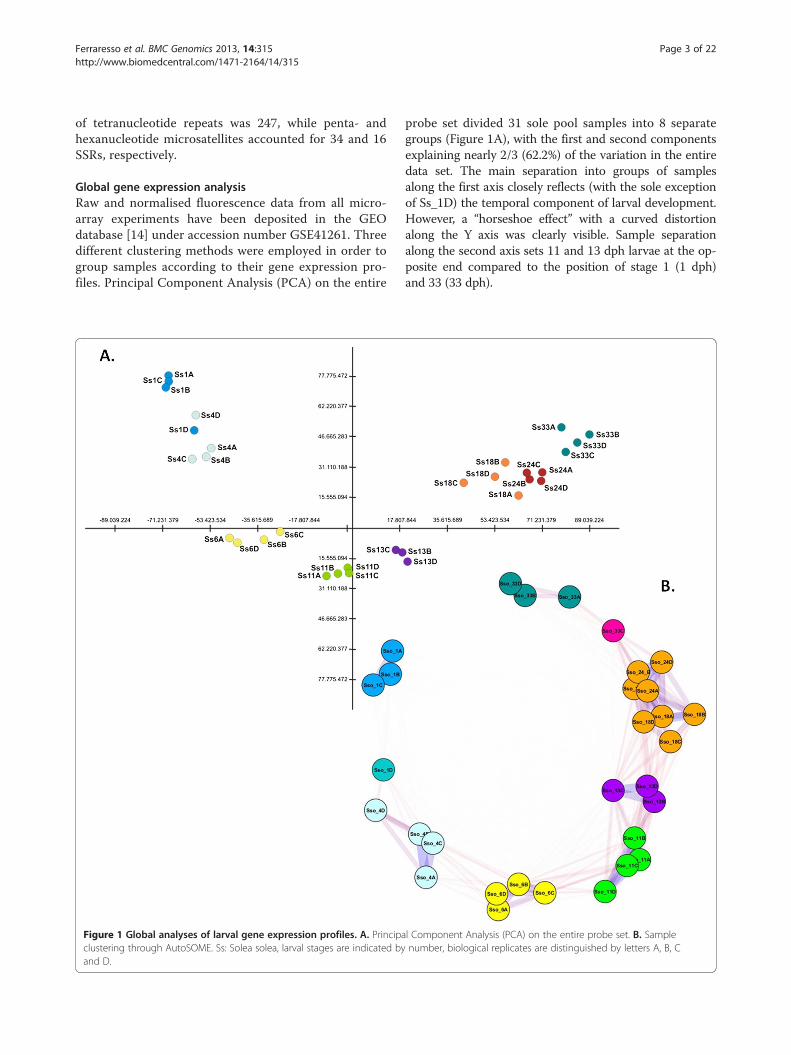
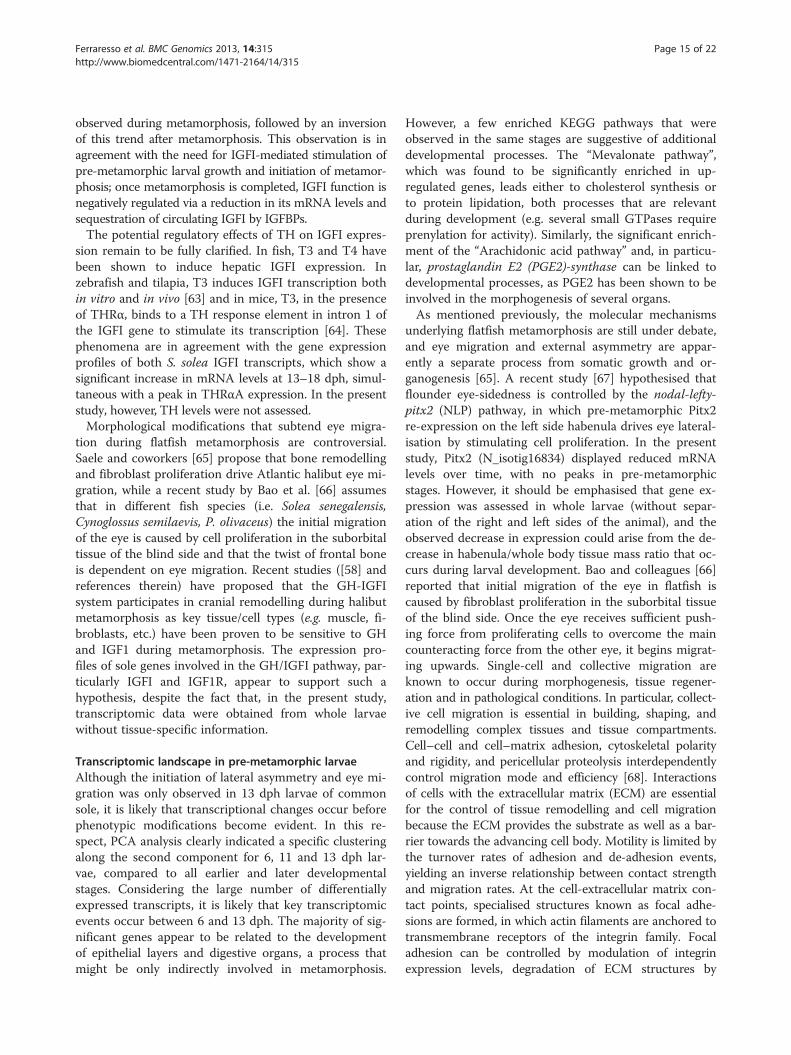
Figure 1 Global analyses of larval gene expression profiles. A. Principaclustering through AutoSOME. Ss: Solea solea, larval stages are indicated byand D.
probe set divided 31 sole pool samples into 8 separategroups (Figure 1A), with the first and second componentsexplaining nearly 2/3 (62.2%) of the variation in the entiredata set. The main separation into groups of samplesalong the first axis closely reflects (with the sole exceptionof Ss_1D) the temporal component of larval development.However, a “horseshoe effect” with a curved distortionalong the Y axis was clearly visible. Sample separationalong the second axis sets 11 and 13 dph larvae at the op-posite end compared to the position of stage 1 (1 dph)and 33 (33 dph).
l Component Analysis (PCA) on the entire probe set. B. Samplenumber, biological replicates are distinguished by letters A, B, C

Table 1 Genes up- or down-regulated over time
MUSCLE DEVELOPMENT
Probe Name Ensembl Acc.Number
Gene name
N_isotig14746 ENSDARG00000032976 Cardiac myosin lightchain-1
P_isotig00564 ENSDARG00000023963 Tropomyosin
N_isotig13004 ENSDARG00000020610 Troponin T
N_isotig07042 ENSDARG00000024141 Caveolin 3
N_isotig07602 ENSDARG00000009021 Cholinergic receptor,nicotinic, alpha 1 (CHNRA)
N_isotig21306 ENSDARG00000071433 Slow myosin heavy chain2
N_isotig01223 ENSDARG00000045242 Slow myosin heavy chain3
N_isotig04075 ENSDARG00000028213 Titin a
N_isotig11618 ENSDARG00000000563 Titin b
N_isotig08672 ENSDARG00000019342 Cholinergic receptor,nicotinic, delta polypeptide
N_isotig19778 ENSDARG00000031756 Myocyte enhancer factor2a
N_isotig05817 ENSDARG00000054942 Lectin, galactoside-binding,soluble, 1 (galectin 1)-like 1
P_isotig17511 ENSDARG00000026473 Sine oculis homeoboxhomolog 1b
N_isotig01855 ENSDARG00000006112 Ras-related C3 botulinumtoxin substrate 1
N_isotig03727 ENSDARG00000034240 Capping proteinmuscle Z-line, alpha 1
P_isotig01165 ENSDARG00000046004 Capping proteinmuscle Z-line, beta
P_isotig18441 ENSDARG00000023797 Ryanodine receptor 1b
N_isotig17357 ENSDARG00000019096 Myosin, light polypeptide 7
GLUCOSE METABOLISM
Probe Name Ensembl Acc. Number Gene name
N_contig01740 ENSDARG00000003191 Pyruvate kinase, muscle, b
N_isotig13675 ENSDARG00000004059 Galactokinase
N_isotig03674 ENSDARG00000005161 Glucose phosphateisomerase b
P_isotig13251 ENSDARG00000005423 Phosphoglycerate mutase1a
P_contig00403 ENSDARG00000011665 Aldolase a, fructose-bisphosphate, a
N_isotig03547 ENSDARG00000014179 Phosphofructokinase,muscle a
P_isotig10593 ENSDARG00000016875 Glycogen synthase 1
P_isotig18039 ENSDARG00000019702 Aldolase c, fructose-bisphosphate
N_isotig03683 ENSDARG00000022456 Enolase 1, (alpha)
N_isotig04393 ENSDARG00000026964 Hexokinase 2
N_isotig06502 ENSDARG00000028088 Galactokinase 1
N_isotig03558 ENSDARG00000030604 Phosphorylase kinase,gamma 1 (PHKG1a)
Ferraresso et al. BMC Genomics 2013, 14:315 Page 4 of 22http://www.biomedcentral.com/1471-2164/14/315
The same dataset was analysed using a SOM-basedclustering method, AutoSOME, which placed all sam-ples into 7 major clusters (Figure 1B), with Sso_1D andSso_33C highlighted as singletons. As in the PCA ana-lysis, the sample classification reflects the temporalscale of developmental stages. Pairwise affinities be-tween samples (the fraction of times two samples areco-clustered), however, revealed a stronger relationshipbetween 11 dph and 13 dph larvae as well as 18 dphand 24 dph individuals. The latter two stages weregrouped in the same cluster. Comparable results wereobtained with unsupervised hierarchical clustering(HCL) analysis (data not shown).
Transcriptional changes over timeQuantitative correlation analysis as implemented in thesoftware Significant Analysis of Microarray (SAM) [15]was used in order to identify genes whose expression ei-ther increased or decreased over time. A total of 2,209probes were positively correlated and 4,376 transcriptswere negatively correlated with time of larval develop-ment. The functional annotation of significant genesusing DAVID pinpointed a few pathways of particularinterest (see Table 1). Among up-regulated genes, themost significant KEGG pathways are related to muscledevelopment/contraction and glucose metabolism, whilethe Hedgehog signalling pathway (dre04340) and Wntsignalling pathway (dre04310) are among the most sig-nificant pathways represented by genes down-regulatedover time. Key components of muscle development andfunction such as caveolin 3 (N_isotig07042), troponin T(N_isotig13004), tropomyosin (P_isotig00564) and choliner-gic receptor, nicotinic, alpha 1 (CHNRA, N_isotig07602),which modulate muscle contraction as well as several formof myosin, display an increase in gene expression over time(Table 1, an heatmat showing gene expression values isreported in Additional file 2). Glucose metabolism, particu-larly glycolysis, is represented by several genes displayingthe same trend; aldolase a (P_contig00403), glucose phos-phate isomerase b (N_isotig03674), glyceraldehyde-3-phos-phate dehydrogenase (GAPDH, N_isotig18841), lactatedehydrogenase (P_isotig00860) and many others increasein expression more than 20-fold from 1 to 33 dph.By contrast, genes included in the pathways “Hedge-
hog signalling” and “Wnt signalling” displayed decreas-ing expression over time (see Table 1, Additional file 2for corresponding heatmaps). These two key pathwaysare involved in developmental processes and control ofasymmetric cell division. In particular, a large number ofgenes related to “Hedgehog signalling” displayed a de-creasing temporal trend of expression, such as sonichedgehog-like (P_isotig18139), bone morphogenetic pro-tein 7b (P_isotig17732), megalin (P_isotig07996), andhedgehog interacting protein (N_isotig19239). Likewise,

Table 1 Genes up- or down-regulated over time(Continued)
N_isotig18841 ENSDARG00000039914 Glyceraldehyde-3-phosphate dehydrogenase
P_isotig00860 ENSDARG00000040856 Lactate dehydrogenase A4
P_isotig00400 ENSDARG00000043180 Glycerol-3-phosphatedehydrogenase 1b
N_contig00167 ENSDARG00000054191 Phosphoglycerate kinase 1
N_isotig05258 ENSDARG00000057571 Phosphoglycerate mutase2 (muscle)
N_isotig12521 ENSDARG00000057630 Aldose 1-epimerase
N_isotig06792 ENSDARG00000060797 Phosphofructokinase,muscle b
P_isotig13923 ENSDARG00000062998 Peptidoglycan recognitionprotein 2
P_isotig03551 ENSDARG00000070826 2,3-bisphosphoglyceratemutase
N_isotig20169 ENSDARG00000071076 Similar to L-lactatedehydrogenase B chain
HEDGEHOG SIGNALLING PATHWAY
Probe Name Ensembl Acc. Number Gene name
N_isotig03639 ENSDARG00000052131 GLI-Kruppel family memberGLI3
N_isotig05619 ENSDARG00000008370 Casein kinase 1, delta a
N_isotig07032 ENSDARG00000005458 Casein kinase 1, gamma2a
N_isotig10399 ENSDARG00000017803 Glycogen synthase kinase3 beta (GSK3B)
N_isotig10687 ENSDARG00000034056 Casein kinase 1, gamma2b
N_isotig12392 ENSDARG00000004965 Bone morphogeneticprotein 5
N_isotig15047 ENSDARG00000071107 Wingless-type MMTVintegration site family,7Bb(WNT7)
N_isotig19239 ENSDARG00000060397 Hedgehog interactingprotein (HiP)
N_isotig20428 ENSDARG00000017230 F-box and WD-40 domainprotein 11b (FBXW11)
N_isotig21462 ENSDARG00000014134 Similar to cAMP-dependentprotein kinase (PKA C-alpha)
P_isotig04440 ENSDARG00000059125 Protein kinase, cAMP-dependent, catalytic, beta
P_isotig07996 ENSDARG00000060649 Megalin, low densitylipoprotein-related protein2 (LRP2)
P_isotig12515 ENSDARG00000052674 Casein kinase 1, alpha 1
P_isotig16544 ENSDARG00000015554 Zic family member 2
P_isotig17732 ENSDARG00000063230 Bone morphogeneticprotein 7b
P_isotig18139 ENSDARG00000068567 Sonic hedgehog-like; Sonichedgehog a
Table 1 Genes up- or down-regulated over time(Continued)
WNT SIGNALLING PATHWAY
Probe Name Ensembl Acc. Number Gene name
P_isotig22061 ENSDARG00000004305 Vang-like 1 (van gogh,Drosophila)
P_isotig10261 ENSDARG00000007791 Protein phosphatase 2(formerly 2A), regulatorysubunit, beta
P_isotig04271 ENSDARG00000009689 Dishevelled associatedactivator ofmorphogenesis 1
P_isotig18727 ENSDARG00000009870 Mitogen-activated proteinkinase 8
N_isotig02405 ENSDARG00000013582 Similar to Casein kinase IIsubunit alpha (CK II)
N_isotig21462 ENSDARG00000014134 Similar to cAMP-dependentprotein kinase (PKA C-alpha)
N_isotig04292 ENSDARG00000014571 Catenin, beta 2
N_isotig02225 ENSDARG00000014731 Calcyclin binding protein
N_isotig20428 ENSDARG00000017230 F-box and WD-40 domainprotein 11b
N_isotig10399 ENSDARG00000017803 Glycogen synthase kinase3 beta
P_isotig06163 ENSDARG00000019239 Cullin 1a
N_isotig12285 ENSDARG00000025747 Mitogen-activated proteinkinase 10
P_isotig09852 ENSDARG00000027397 Vang-like 2 (van gogh,Drosophila)
AS_isotig13833 ENSDARG00000031894 Lymphocyte enhancerbinding factor 1
P_isotig13436 ENSDARG00000038954 Beta-catenin-interactingprotein
N_isotig20334 ENSDARG00000039041 Secreted frizzled-relatedprotein 5
P_isotig04697 ENSDARG00000044062 C-terminal binding protein 2
N_isotig16673 ENSDARG00000045444 Frizzled homolog 8a
P_isotig12515 ENSDARG00000052674 Casein kinase 1, alpha 1
N_isotig03709 ENSDARG00000053020 Protein phosphatase 2(formerly 2A), catalyticsubunit A
P_isotig14067 ENSDARG00000057007 C-terminal binding protein 1
P_isotig10768 ENSDARG00000060716 Similar to Serine/threonine-protein kinasePRKX
N_isotig11316 ENSDARG00000060976 CREB binding protein b
N_isotig04935 ENSDARG00000061308 CREB binding protein a
N_isotig15047 ENSDARG00000071107 Wingless-type MMTVintegration site family, 7Bb
P_isotig08176 ENSDARG00000075226 Smad4
P_isotig03701 ENSDARG00000077776 Casein kinase 2 beta
Ferraresso et al. BMC Genomics 2013, 14:315 Page 5 of 22http://www.biomedcentral.com/1471-2164/14/315
Ferraresso et al. BMC Genomics 2013, 14:315 Page 6 of 22http://www.biomedcentral.com/1471-2164/14/315
28 genes belonging to “Wnt signalling”, which weremembers of the canonical pathway, the planar cell polar-ity (PCP) pathway, or the Wnt/Ca2+ pathway, werenegatively correlated with time of larval development.Of particular interest are neuropilin-1 and transcriptionfactor AP-2 alpha, genes that control the developmentand differentiation of the neural crest.
Transcriptional changes across larval stage transitionsA two-class unpaired SAM analysis was performed toidentify transcriptional changes between two consecutivelarval stages. The highest number of differentiallyexpressed genes was found between 1 dph and 4 dph,with a total of 1,539 significant genes (974 over- and 565under-expressed in 4 dph larvae), while only 120 genes(81 up- and 39 down-regulated) displayed a change inexpression between 11 and 13 dph. To obtain a morecomprehensive interpretation of the set of genes differ-entially expressed in each transition, enrichment ana-lyses were performed using the software DAVID (seeMethods). A complete list of Biological Process (BP) GOterms and KEGG pathways that were found to be signifi-cantly enriched is reported in Additional file 3.
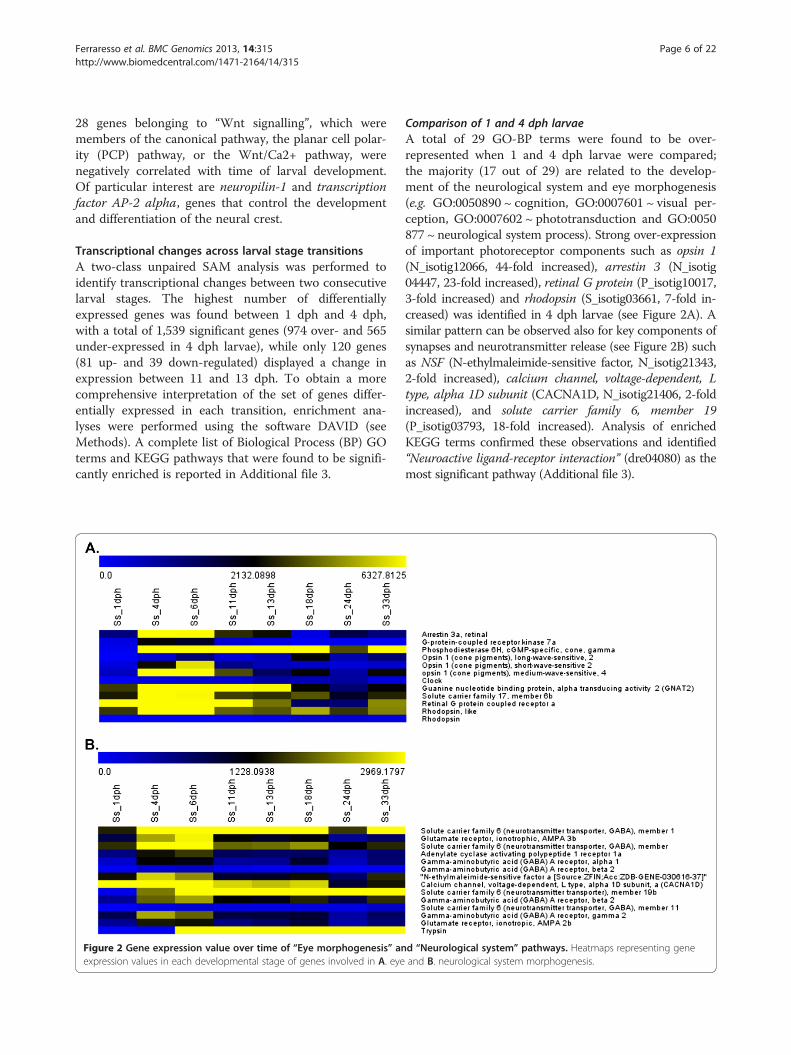
Figure 2 Gene expression value over time of “Eye morphogenesis” anexpression values in each developmental stage of genes involved in A. eye
Comparison of 1 and 4 dph larvaeA total of 29 GO-BP terms were found to be over-represented when 1 and 4 dph larvae were compared;the majority (17 out of 29) are related to the develop-ment of the neurological system and eye morphogenesis(e.g. GO:0050890 ~ cognition, GO:0007601 ~ visual per-ception, GO:0007602 ~ phototransduction and GO:0050877 ~ neurological system process). Strong over-expressionof important photoreceptor components such as opsin 1(N_isotig12066, 44-fold increased), arrestin 3 (N_isotig04447, 23-fold increased), retinal G protein (P_isotig10017,3-fold increased) and rhodopsin (S_isotig03661, 7-fold in-creased) was identified in 4 dph larvae (see Figure 2A). Asimilar pattern can be observed also for key components ofsynapses and neurotransmitter release (see Figure 2B) suchas NSF (N-ethylmaleimide-sensitive factor, N_isotig21343,2-fold increased), calcium channel, voltage-dependent, Ltype, alpha 1D subunit (CACNA1D, N_isotig21406, 2-foldincreased), and solute carrier family 6, member 19(P_isotig03793, 18-fold increased). Analysis of enrichedKEGG terms confirmed these observations and identified“Neuroactive ligand-receptor interaction” (dre04080) as themost significant pathway (Additional file 3).
d “Neurological system” pathways. Heatmaps representing geneand B. neurological system morphogenesis.

Ferraresso et al. BMC Genomics 2013, 14:315 Page 7 of 22http://www.biomedcentral.com/1471-2164/14/315
Comparison of 4 and 6 dph larvaeThe functional annotation of genes that were differen-tially expressed between 4 dph and 6 dph larvae resultedin the identification of 13 BP terms in common with theprevious larval transition as significantly enriched, all ofwhich are related to visual perception and neurologicalsystem processes (see Figure 2), although the level of in-crease in expression was not identical to that in the pre-vious comparison. Among genes up-regulated in 6 dphcompared to 4 dph larvae, several GO terms are relatedto lipid metabolism (i.e. GO:0008610 ~ lipid biosyntheticprocess, GO:0006633 ~ fatty acid biosynthetic processand GO:0016125 ~ sterol metabolic process), includingkey genes such as stearoyl-CoA desaturase (N_isotig05992,2.24 fold) and ELOVL family member 5 (N_isotig05673,3.76 fold), which display significant over-expression.This evidence is supported by KEGG analysis, whichhighlighted “Steroid biosynthesis” and “PPAR signal-ling pathway” as the most significantly enrichedpathways.
Comparison of 6 and 11 dph larvaeThe major evidence obtained when analyzing genes dif-ferentially expressed between 6 dph and 11 dph larvae isthat all BP terms related to visual and neuronal pro-cesses remain enriched, although the correspondinggenes display a significant down-regulation in stage 11larvae (Figure 2). If the enrichment analysis is restrictedonly to genes up-regulated at 11 dph, the BP terms orKEGG pathways that are found to be significantlyenriched are mainly related to metabolism, particularlyglucose metabolism (e.g. GO:0016052 ~ carbohydrate cata-bolic process, GO:0006096 ~ glycolysis and dre00010:Gly-colysis/Gluconeogenesis). An heatmap of gene expressionvalues across larval transitions is reported in Additionalfile 2.
Comparison of 11 and 13 dph larvaeThe comparison of 11 and 13 dph larvae yieldedthe lowest number of differentially expressed genes,with only 120 probes significant at FDR 1%. Amongthe 120 transcripts, no KEGG pathways and only afew BP terms were significantly enriched. The ma-jority of significant terms (15 of 18) were related tovisual and neuronal processes; however, genes be-longing to these processes displayed low fold-changes and did not exhibit an univocal trend inexpression (see Figure 2).
Comparison of 13 and 18 dph larvaeThe larval transition between 13 and 18 dph is alsocharacterised by the significant down-regulation ofall BP terms related to visual and neural processes.
Up-regulated genes include those involved in muscle mor-phogenesis and functioning (i.e. GO:0006941 ~ striatedmuscle contraction, GO:0003012 ~muscle system pro-cess, GO:0030239 ~myofibril assembly, dre04260:Cardiacmuscle contraction and dre04270:Vascular smooth musclecontraction), such as slow myosin heavy chain 2(N_isotig21306, 2.73 fold), slow myosin heavy chain 3(N_isotig01223, 2.98 fold), titin a (N_isotig04075, 2.18fold) and titin b (N_isotig11618, 2.16 fold), which alldisplayed over-expression at 18 dph, with further increasesover time (see Additional file 2).
Comparison of 18 and 24 dph larvaeStatistical analysis of the entire set of gene expressionvalues identified a close relationship between 18 and 24dph larvae; that in some cases (AutoSOME clusteringand HCL) have also been grouped in the same cluster.However, functional analysis of differentially expressedgenes identified an over-expression of genes involved inglucose metabolism (e.g. fructose-1,6-bisphosphatase 2, glu-cose phosphate isomerase b and 2,3-bisphosphoglyceratemutase) with several BP terms (i.e. GO:0006096 ~ glycoly-sis and GO:0006007 ~ glucose catabolic process) morethan 10-fold enriched (see Additional file 3). This finding isalso supported by KEGG pathway analysis, which identified“Glycolysis/Gluconeogenesis” as the most significant term.
Comparison of 24 and 33 dph larvaeThe comparison between 24 and 33 dph larvae identified1,316 differentially expressed genes, with 41 significantlyenriched BP terms. A total of 16 biological processes re-lated to cell division and chromosome organisation wererepresented by genes that were under-expressed at 33dph compared to 24 dph. Up-regulated genes are in-volved mainly in muscle cell development (10 of 41 BPterms).
Temporal expression of “hatching” enzymesA recurrent annotation in genes that are significantlyup- or down-regulated during larval stage transitions is“hatching enzyme”. In teleosts, several genes encodinghatching enzymes have been reported. In the commonsole transcriptome, eight transcripts were found to en-code a putative astacin-like metalloprotease. Phylogen-etic reconstruction of the evolutionary position of theseprotein sequences was conducted by comparison with allavailable astacin-like metalloproteases from vertebrategenomes (Additional file 4). Two sole sequences(P_isotig06925 and N_isotig08536) were classified as“true” hatching enzymes belonging to the groups HighChoriolytic Enzymes (HCE) and Low Choriolytic En-zymes (LCE), respectively [16]. The remaining putativeproteins were clustered with a large group of paralogues,which include zebrafish nephrosin and several medaka
Ferraresso et al. BMC Genomics 2013, 14:315 Page 8 of 22http://www.biomedcentral.com/1471-2164/14/315
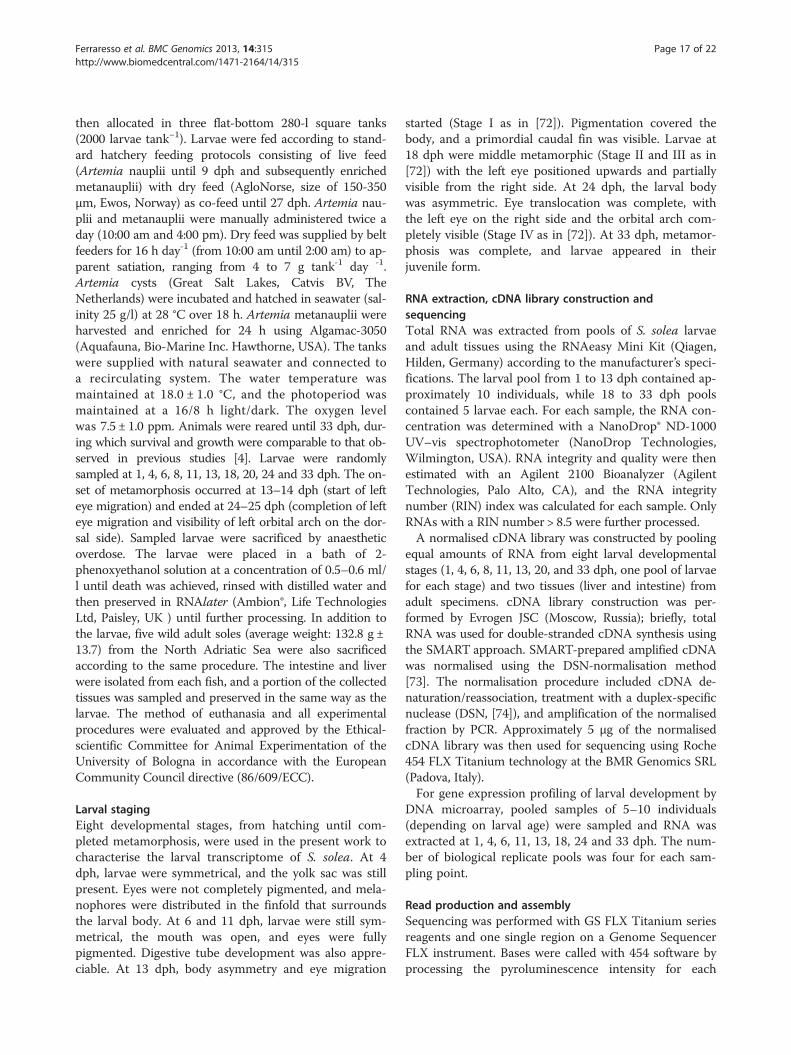
astacin-like metalloproteases. The only exception is theprotein encoded by transcript N_isotig00480, which hasa basal position in the phylogenetic tree (see Additionalfile 4). As noted previously, the majority of these tran-scripts were found to be significantly down- or up-regulated during stage transitions in sole larvae (Figure 3).The expression profiles for sole LCE (N_isotig08536) re-vealed basal expression without significant variations,
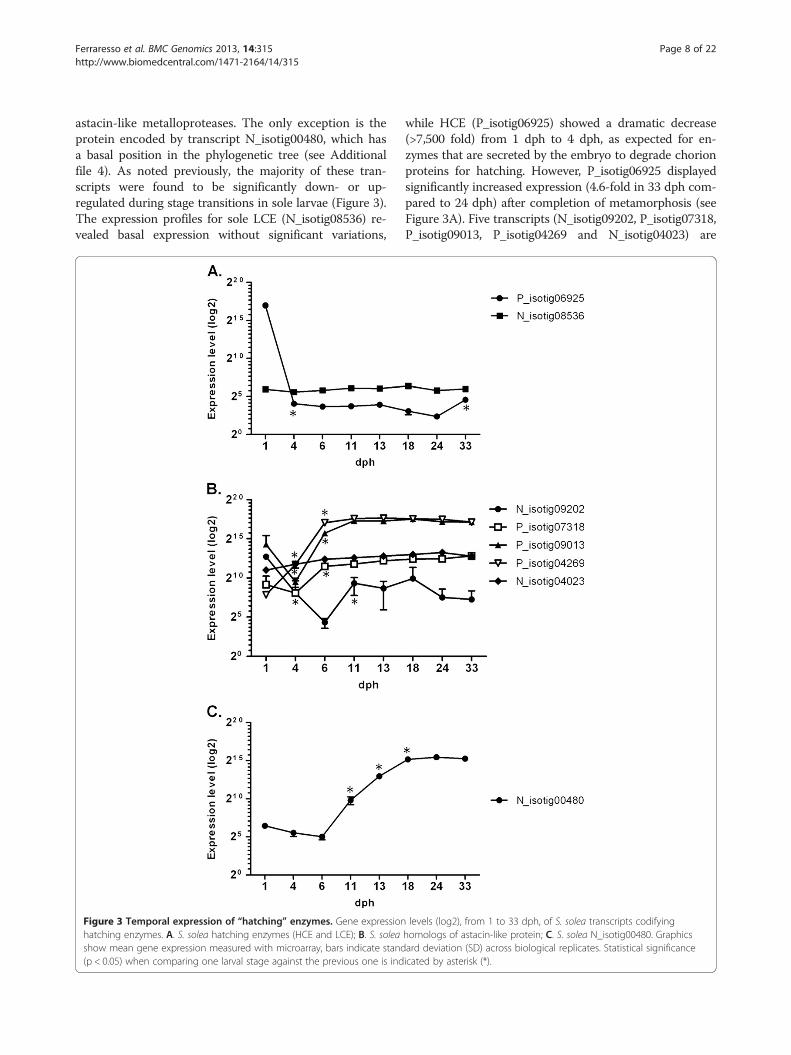
Figure 3 Temporal expression of “hatching” enzymes. Gene expressionhatching enzymes. A. S. solea hatching enzymes (HCE and LCE); B. S. soleashow mean gene expression measured with microarray, bars indicate stand(p < 0.05) when comparing one larval stage against the previous one is ind
while HCE (P_isotig06925) showed a dramatic decrease(>7,500 fold) from 1 dph to 4 dph, as expected for en-zymes that are secreted by the embryo to degrade chorionproteins for hatching. However, P_isotig06925 displayedsignificantly increased expression (4.6-fold in 33 dph com-pared to 24 dph) after completion of metamorphosis (seeFigure 3A). Five transcripts (N_isotig09202, P_isotig07318,P_isotig09013, P_isotig04269 and N_isotig04023) are
levels (log2), from 1 to 33 dph, of S. solea transcripts codifyinghomologs of astacin-like protein; C. S. solea N_isotig00480. Graphicsard deviation (SD) across biological replicates. Statistical significanceicated by asterisk (*).

Ferraresso et al. BMC Genomics 2013, 14:315 Page 9 of 22http://www.biomedcentral.com/1471-2164/14/315
putative homologs of a group of medaka astacin-likeproteins that were found to be expressed in epitheliallayers of internal organs (liver, intestine and kidney) indeveloping larvae and adults [16]. These transcriptsdisplay different patterns of expression (see Figure 3B).N_isotig04023 displays a steady increase in expressionover time from 1 to 24 dph, while N_isotig09202 ischaracterised by mRNA levels that decrease (339.4-fold)from 1 to 6 dph, followed by a significant increase (48.7-fold) until 18 dph and a new decline thereafter.P_isotig09013 and P_isotig04269 (see Figure 3B) appearto be expressed at very high levels and are characterisedby an earlier significant up-regulation (6–11 dph). Themost interesting pattern, however, was observed forN_isotig00480, which displayed a steep up-regulation(>1000-fold) during the transition between 6 and 18dph, a peak at 24 dph (stage IV, fully asymmetrical eye)and a decline at 33 dph (see Figure 3C). N_isotig00480has no orthologues in any vertebrate genome, apartfrom an uncharacterised protein in stickleback andmerits further study to characterise in greater detail itsrole during sole development.
Figure 4 Expression of TRH, TSH and TH receptors during larval devetranscripts codifying key genes of the TH cascade. A. S. solea TRH, TSH andmean gene expression measured with microarray, bars indicate standard d(p < 0.05) when comparing one larval stage against the previous one is ind
Expression of the TRH, TSH and TH receptors duringlarval developmentIn the present study, the gene expression profile of keytranscripts of the TH cascade was assessed. BothThyrotropin releasing hormone (TRH) and Thyrotropin(Thyroid Stimulating Hormone, TSH) can be detectedvery early during larval development (1–4 dph, seeFigure 4A). TRH mRNA levels (P_isotig14640) increasesignificantly in the early stages of development, reachinga peak of expression at 6 dph (2.8 fold compared to1 dph) after the first feeding, followed by a reductionuntil metamorphosis is completed. A similar trend, al-though shifted forward, can be observed for Thyrotropin,for which the TSH β transcript (P_isotig08941) displaysa gradual increase in expression, with a peak at 11 dph(3.6-fold compared to 1 dph). The expression pattern ofIodothyronine deiodinase I (D1), which controls the con-version of T4 to T3 as well as the inactive metaboliterT3, was also assessed. After hatching, D1 expression(N_isotig07895) increased gradually until the end ofmetamorphosis (24 dph, see Figure 4A) when it reachedits highest level (~13.5-fold compared to 1 dph). THs
lopment. Gene expression levels (log2), from 1 to 33 dph, of S. soleaD1 transcripts; B. S. solea THRαA and THRαB transcripts. Graphics showeviation (SD) across biological replicates. Statistical significanceicated by asterisk (*).

Ferraresso et al. BMC Genomics 2013, 14:315 Page 10 of 22http://www.biomedcentral.com/1471-2164/14/315
indirectly regulate downstream gene transcription bybinding to thyroid hormone receptors (TRs). In teleosts,two genes encoding TRα (referred to as TRαA andTRαB) and two TRβ have been reported [17,18]. In thepresent study, only Thyroid hormone receptor α (TRα,both TRαA and TRαB) was represented on the array;Blast searches on sole transcripts failed to detect any pu-tative TRβ isoform. The expression profiles of the TRαgenes during larval development display a particular pat-tern with TRαA and TRαB characterized by an oppositetrend (Figure 4B). The TRαA transcript (AS_isotig09887)increases in expression until the onset of metamorphosis(13 dph), at which point mRNA levels are 4.3-fold higherthan at 1 dph, followed by a decrease in expression,while TRαB (AS_isotig06092) displays a higher level ofexpression from 1 to 6 dph, followed by a gradual de-crease until 24 dph (3.5-fold compared to 6 dph).
Temporal expression of Growth hormone and Insulin-likeGrowth Factor-I systemIn the present study, several factors belonging to theGH-IGFI “axis” were identified and their gene expres-sion was assessed during larval development. Growth
Figure 5 Expression of GH/IGFI axis genes during larval developmenttranscripts codifying key genes of the GH/IGFI pathway. A. S. solea GH andmean gene expression measured with microarray, bars indicate standard d(p < 0.05) when comparing one larval stage against the previous one is ind
Hormone (GH), a protein involved in major physiologicalprocesses in the body, is characterised by a particulargene expression profile (see Figure 5A), with an increasein mRNA levels from 1 dph to 6 dph (34.5-fold),followed by a significant decrease at 11 dph (2-fold) anda subsequent gradual increase until 33 dph (with geneexpression levels twice those of 6 dph). A similar patterncan be observed for Growth Hormone Releasing Hor-mone (GHRH, S_isotig11444 and N_isotig01839), al-though the second increase in gene expression levelsbegan only at 24 dph (see Figure 5A). Other molecules as-sociated with GH, such as Growth factor receptor-boundprotein 2 (GRB2, N_isotig07093 and P_isotig04733) andGRB2-associated-binding protein 1 (P_isotig08245 andN_isotig01885), displayed no significant variation in ex-pression across larval stages.A completely different trend in gene expression was
observed for IGFI (represented on the array by twocontigs, S_isotig07586 and AS_isotig09786, that covertwo non-overlapping regions of the same transcript), forwhich mRNA levels were relatively low during the initialstages (from 1 to 6 dph), with a gradual increase from11 dph (see Figure 5B). At later stages (18–33 dph), gene
. Gene expression levels (linear), from 1 to 33 dph, of S. soleaGHRH transcripts; B. S. solea IGFI and IGFIR transcripts. Graphics showeviation (SD) across biological replicates. Statistical significanceicated by asterisk (*).

Ferraresso et al. BMC Genomics 2013, 14:315 Page 11 of 22http://www.biomedcentral.com/1471-2164/14/315
expression levels are at least 10-fold higher compared to1 dph (10- and 13.5-fold for S_isotig07586 andAS_isotig09786, respectively). Several IGF-binding pro-teins (IGFBPs) were also identified in the present study,with a heterogeneous assortment of expression profiles.IGFBP1, which is present as two isoforms, IGFBP1a andIGFBP1b, displayed an increase over time with a peak inexpression at 33 dph (3.8- and 4.3-fold, respectively,when compared to 24 dph; 18.7- and 22.1-fold whencompared to 1 dph). IGFBP2a was characterised by aninitial peak at 11 dph (1.8-fold compared to 1 dph) anda second peak at 33 dph (2.3-fold compared to 1 dph),while IGFBP4 exhibited a decrease in expression at 6dph (2-fold compared to 1 dph), followed by an increaseover time until 24 dph (3.9-fold compared to 6 dph).
Curved transcriptome landscape during flatfishdevelopmentAs mentioned above, a distinctive pattern was observedin the distribution of samples along the second component(Y-axis) in the PCA (Figure 1A), in which the transcrip-tome landscape describes a marked curve as compared tothe linear trend along the first component, which reflectstemporal transitions across developmental stages. Tofurther evaluate this observation, a SAM quantitative cor-relation analysis was conducted to identify genes thatsignificantly correlated with the projected position of indi-vidual samples along the Y-axis. A total of 530 probes werepositively correlated with Y-axis position (FDR 0%), i.e. up-regulated in 11-dph, 13-dph and, to a lesser extent, 6-dphlarvae (Figure 1A), and 508 probes were negatively corre-lated (Additional file 5). Similar results were obtained whenconsidering two groups of samples, one including 1, 4, 18,24, and 33 dph larvae, the other 6, 11, and 13 dph larvae,in a SAM two-class analysis (622 up- and 524 down-regulated transcripts). Following a conservative approach,only genes that were found to be significant using bothmethods were considered further.Functional annotation of all significantly up-regulated
and positively correlated genes (372) using DAVID re-vealed that 29 GO_BP terms were significantly enriched(Additional file 6). Among the most enriched pathways,two are related to metabolism of folic acid derivatives(GO:0009396 and GO:0006760, 16- and 13-fold enriched,respectively). Genes belonging to these GO terms includeGTP cyclohydrolase 1, whose product is a cofactor fortyrosine supply during melanogenesis [19], and MTHFD1(methylenetetrahydrofolate dehydrogenase (NADP+ depen-dent) 1a), which plays a key role in de novo purine andpyrimidine biosynthesis in humans [20]. Nucleotide metab-olism is also over-represented, with three terms related tonucleotide catabolic processes (GO:0009166, GO:0034656and GO:0034655) that were approximately 10-fold enriched(p < 0.05).
Several GO terms are linked to oxidative phosphoryl-ation (e.g. P_isotig14727 NADH dehydrogenase [ubiquin-one] 1 alpha subcomplex subunit 6, and P_isotig16393NADH dehydrogenase 1 alpha subcomplex subunit 11)and glycolysis (e.g. hexokinase 1, glucose phosphate isom-erase a, and lactate dehydrogenase B). Significant enrich-ment in cellular localisation was found for integralmembrane proteins (Additional file 6). Concordant evi-dence was provided by GO terms on Molecular Func-tion (Additional file 6). KEGG pathway analysis revealedseveral enriched pathways. The most relevant were the“Mevalonate pathway (dre00900)”, a cellular pathwayleading either to cholesterol synthesis or to proteinlipidation and “Arachidonic acid metabolism (dre00590)”(Additional file 6). Several GO terms as well as gene-specific annotations for positive/up-regulated genes sug-gested a putative role in liver and intestine function. Tofurther explore this hypothesis, the list of significantgenes was compared to transcripts that have been identi-fied as specifically expressed in the developing gastro-intestinal system of zebrafish larvae [21]. In that study,zebrafish larval cells were specifically sorted and ana-lyzed using a zebrafish Affymetrix microarray platform.Of 372 sole-significant genes (Additional file 7), 161corresponded to a putative zebrafish orthologue repre-sented by Affymetrix probes. These genes were matchedagainst 1,973 zebrafish genes that were found to be up-regulated in the developing gastrointestinal system ofzebrafish. A highly significant overlap was found (Fisher’sExact Test p < 0.0001), with 61 transcripts shared betweenthe two sets. Also of note is the presence of several genesinvolved in the scavenging of oxygen radical species (e.g.superoxide dismutase 1, glutathione peroxidase and gluta-thione S-transferase) and mitochondrial carriers.Two genes involved in retinol metabolism were also
included in the list of significant transcripts. Bcox, aprovitamin A-converting enzyme with a role in zebrafishembryogenesis and pigmentation [22], displayed themost striking profile, with a peak at 13 dph. The secondprotein was retinol binding protein 2 (RBP2), an intracel-lular chaperone for retinol and retinal, which is involvedin the intestinal absorption of vitamin A as well as inmodulating the supply of retinoic acid in specific celltypes. RBP2 displays a different expression profile, withan initial peak at 6 dph and a second, less marked, at 13dph. Notably, among the up-regulated and positively-correlated genes was a key regulator of morphogenesis(TSH-beta, P_isotig08941). A smaller set of genes (190)were found to be down-regulated as well as negativelycorrelated with the second PCA component (Additionalfile 8). Functional annotation with DAVID highlightedTight junction and Cell-cell adhesion as KEGG pathwayssignificantly enriched. Members of these pathways includeclaudin 4 (P_isotig13499), claudin 7b (N_isotig12365) and

Ferraresso et al. BMC Genomics 2013, 14:315 Page 12 of 22http://www.biomedcentral.com/1471-2164/14/315
occludin b (P_isotig18663), all significantly down-regulatedon 6-11-13 dph compared to previous and later stages. Inthis context, vitronectin a (P_isotig17782, 2.9- and 3.9-folddown-regulated compared to 1 dph and 33 dph, respect-ively), integrin, alpha-V (N_isotig20767, 2.3- and 1.4-folddown-regulated compared to 1 dph and 33 dph, respect-ively) and calpain-3 (N_isotig19399, 5.2- and 6.4-folddown-regulated compared to 1 dph and 33 dph, respect-ively), genes that play a role in focal adhesion and ECM-receptor interactions, were also identified as significant.
Real-time RT-PCR validationA set of 10 genes was assessed by RT-qPCR to validatethe microarray platform performance. This set of geneswas chosen among those involved in key pathways of S.solea larval development and displaying, in the presentstudy, different patterns of expression across stages.Three genes, Bcox, RBP2 and claudin 7b, were corre-
lated (negatively or positively) to sample projection onthe PCA Y-axis and were either down- (claudin 7b) orup-regulated (Bcox and RBP2) in pre-metamorphic lar-vae compared to previous and later stages. Three genes,megalin, sonic hedgehog-like and aldolase a, are mem-bers of key pathways of larval development (“Hedgehogsignalling” and “Glucose metabolism”) and displayed ex-pression levels that were positively (aldolase a) or nega-tively (megalin and sonic hedgehog-like) correlated withtime of larval development. The latter four genes, TSHβ,TRH, GH and IGF1, are members of the TH and GH/IGF1 cascades and displayed different patterns of expres-sion across larval stages.A Spearman rank-correlation test was used to assess
the correlation between expression values measured byRT-qPCR and by microarray in a total of 16 experiments(see Methods). Table 2 indicates the correlation coeffi-cients calculated for the validated genes. All genes
Table 2 Correlation between microarray and real-timeRT-PCR expression data
Sequence name Gene name Spearman’s rhoqPCR/probe
Contig00403 Aldolase A 0.946**
Isotig07996 Megalin 0.845**
Isotig04483 Bcox 0.946**
Isotig14204 Retinol binding protein 2 0.925**
Isotig12075 Growth hormone 0.760**
Isotig07586 Insulin growth factor I 0.943**
Isotig08941 Thyroid Stimulating Hormone 0.950**
Isotig14640 Thyrotropin releasing hormone 0.811**
Isotig18139 Sonic hedgehog-like 0.811**
Isotig12365 Claudin 7b 0.750**
**p < 0.01.
displayed high correlation coefficients between micro-array and RT-qPCR, with Spearman’s rho 0.75 < rho <0.95 (p < 0.01), thus confirming a strong positive correl-ation between the two technologies.
DiscussionThe continuous development of advanced next-generationsequencing (NGS) technologies and their competitivecosts have resulted in their use for a wide range of applica-tions, included genome and transcriptome sequencing ofnon-model species. To date, only limited transcriptome-wide studies on fish larvae have been conducted in teleostspecies [23-26], and only one study has been conducted inflatfish (i.e. Atlantic halibut [27]), a group of great interestbecause it undergoes a dramatic larval-to-juvenile transi-tion compared to other fish species. The present study isthe first to characterise gene expression profiles duringmetamorphosis of Solea solea, a flatfish species of rele-vance for Mediterranean aquaculture. The use of 454pyrosequencing produced a large set of good quality readsthat were then assembled into a significant number ofIsotigs. The combined approach used in this study allowedthe annotation of a high percentage (>75%) of soleIsotigs, considerably higher than the value observed insimilar studies on other fish species (turbot 50.7% [28],Senegalese sole 40.6% [10], pre-smolt Atlantic salmon50.3% [29], channel catfish 51% [30], European eel 33%[31], gilthead seabream 66% [26]). Annotated transcriptswere then employed for the construction of an oligo-DNA microarray in order to investigate the transcrip-tome variation during S. solea larval development. Thevariety of biological processes that were found to bedifferentially expressed between time points reveals thecomplexity of transcriptome regulation during larvalontogenesis. Changes in gene expression reflect pro-cesses related mainly to organogenesis (e.g. musculardevelopment, visual and neural development and ossifi-cation) and the maturation of essential physiologicalfunctions (e.g. digestive function and metabolic path-ways). Analysis of differentially expressed genes duringstage transitions delineated the main processes involvedin organogenesis and larval growth.Development of visual perception is essential for larval
feeding. The eye of indirectly developing species is oftenslightly pigmented or non-pigmented at hatching and ismost likely non-functional. In most species, the eye be-comes fully pigmented and functional within the firstweek after hatching [32]. Functional annotation of differ-entially expressed genes revealed a strong up-regulationof BPs related to visual perception during the early stagesof larval development (see Additional file 3). Many genesassociated with eye morphogenesis were found to be up-regulated until 6 dph, while an opposite trend was ob-served from 11 dph and thereafter, suggesting that this

Ferraresso et al. BMC Genomics 2013, 14:315 Page 13 of 22http://www.biomedcentral.com/1471-2164/14/315
stage represents the turning point for eye development.Pitx2 (Paired-like homeodomain transcription factor 2,N_isotig16834), a gene involved in anterior eye segmentdevelopment, displayed higher expression levels at 1 and 4dph. Opsin (i.e. green-, blue- and red-sensitive opsins) andrhodopsin transcripts, primary light sensors of retinal pho-toreceptors [33,34], as well as retinal arrestin, which isinvolved in signal transduction, displayed a strong up-regulation at 4 and 6 dph. In the literature, all these genesare reported to be regulated by vitamin A [27,35-37].Vitamin A (Retinol) is indispensable for eye morpho-genesis [38] and exerts its biological function throughits metabolite, retinoic acid (RA), a signal moleculeimportant for photoreceptor development in verte-brates. In the present study, KEGG pathway analysishighlighted “Retinol metabolism” (dre00830) as signifi-cantly enriched (p < 0.05, Fold enrichment >3) at 4 and6 dph. Many genes that play a crucial role in RA synthe-sis and transport, such as RDH10 (Retinol dehydrogen-ase 10), RALDH2 (Retinaldehyde dehydrogenase 2),CRABP (Cellular retinoic acid binding protein 1) andCRBP (Cellular retinol-binding protein), displayed highlevels of expression at the earliest larval stages, followedby a decrease over time, supporting the hypothesis thatRA is mainly produced in specific temporal windows [39].Retinoic acid treatment influences photoreceptor develop-ment in zebrafish and has been reported to up-regulatethe transcription of several photoreceptor-specific genes[36], as it was observed for opsins and arrestin in thepresent study. Through in situ hybridisation of differentopsin cDNAs on single cones expressing either blue-,green- or red-sensitive opsin, Prabhudesai and colleagues[36] demonstrated that, in zebrafish, exposure to endogen-ous RA differentially regulates gene transcription on spe-cific photoreceptors with a simultaneous increase in theexpression of rod opsin and red cone opsin and a decreasein the expression of blue and UV cone opsins. The resultsobtained in the present study were not in agreement withthis evidence, as both red-, green- and blue-sensitive op-sins were up-regulated at 4 and 6 dph, with green-sensitive opsins displaying the highest expression levels(~10-fold). However, this inconsistency may be due to themethods applied for assessing the expression of differentopsin sets because, to be comparable, the microarray ana-lysis should have been performed on single photorecep-tors already committed to a specific phenotype ratherthan globally. Taken together, all the above evidenceclearly indicate that genes involved in the ontogenesis ofthe visual system are up-regulated during early stages oflarval development (4–11 dph), further confirming thatthe eye is still developing during this larval period.Many genes related to muscle development and function
increased over time (see Table 1 and Additional file 2), andthe corresponding BPs were significantly enriched (up to
10-fold) during the transition from 13 to 18 dph larvae andlater stages. Caveolin 3 is involved in zebrafish muscleprecursor differentiation, and Cav3 knockout mice ex-hibit a mild muscular dystrophy phenotype [40]. Thetranscription factor myocyte enhancer factor-2 (MEF2)is important for all types of embryonic muscle differen-tiation and, in Drosophila, plays an essential role inadult myogenesis by participating in the control of myo-blast fusion and in myofibrillogenesis in developingmyotubes [41]. Galectin-1 promotes skeletal muscle dif-ferentiation in human foetal mesenchymal cells [42] andhas been shown to be involved in muscle regeneration.Titin a is required for sarcomere assembly and is con-sidered a molecular marker for cardiomyocyte differen-tiation [43]. These data are in agreement with thoseobtained for the European seabass [23] and the Atlantichalibut [27] and reflect the progressive development ofmuscle during larval ontogenesis. Post-embryonic growth isassociated with both hypertrophy (increase in muscle fibrediameter) and hyperplasia (recruitment of new muscle fi-bres) from undifferentiated myoblasts or myosatellite cells[44]. Gene expression analysis alone is not sufficient todiscriminate between those two mechanisms of musclegrowth without the support of other analyses (i.e. hist-ology), however our findings are in agreement with previ-ous studies conducted in fish [3] where it is reported thatthe mechanism of muscle development during fish larvalgrowth is mainly related to stratified hyperplasia, which isresponsible for the increase in number of muscle fibers.A clear correspondence was also observed between
muscle development and energy metabolism. Energymetabolism in early fish larvae is almost entirely aerobic.The anaerobic power of muscle fibres is low after hatch-ing but increases during the transition from larva to ju-venile [3]. Fish larvae primarily use dietary lipids andproteins as their first energetic sources. This is reflectedby the sole gene expression profiles, in which manygenes involved in proteolysis and lipid metabolism areup-regulated at the mouth-opening stage (6 dph). Thisenergy production pathway is masked in later stages bythe increase in the expression of genes involved in glu-cose metabolism (Table 1), with several BP terms andKEGG pathways significantly enriched at 24 dph. Ofparticular interest, the gene expression of lactate dehydro-genase (LDH), the enzyme that catalyses the interconver-sion of pyruvate and lactate when oxygen is absent (or inshort supply), increased gradually, with fold-changes of29-fold (at 24 dph) and 58-fold (at 33 dph) for LDH-A(P_isotig00860) and LDH-B (N_isotig20169), respectively.This finding further confirms a previous study by Dariasand coworkers [23] that suggested a relationship betweenglucose metabolism and the development of white musclefibres, in which the anaerobic energy necessary for swim-ming is mainly supplied by the glycolytic pathway.
Ferraresso et al. BMC Genomics 2013, 14:315 Page 14 of 22http://www.biomedcentral.com/1471-2164/14/315
Coordinated expression of the TH cascade during larvalmetamorphosisThyroid hormones (TH) are among the most prominentfactors controlling vertebrate development and metabolismin adult animals. In particular, 5′,3′,5,3-tetraiodothyronine(T4) and 3′,5,3-triiodothyronine (T3) are widely reportedto play a key role in larval development and fish metamor-phosis [17,45-47]. Flatfish metamorphosis is a TH-drivenprocess, and numerous studies have demonstrated the im-portance of these hormones for metamorphosis-associatedtissue modifications [45-48]. The start of metamorphosishas been associated with a surge in THs in which TH levelsincrease until the metamorphic climax and decreasepost-climax [46]. Japanese flounder (Paralichthys olivaceus)and Atlantic halibut (Hippoglossus hippoglossus) metamor-phosis has been proven to be induced precociously by THtreatment and, conversely, to be delayed or abolished fol-lowing exposure to agents that inhibit TH synthesis [17].Several studies have assessed the expression profiles ofgenes belonging to the thyroid-pituitary axis in flatfish, al-though focusing on a single gene or a few genes without aglobal view of the whole gene network. In the presentstudy, both TRH and TSHβ transcripts were detected;however, these genes exhibited slightly different expressionpatterns during development. TRH reached its maximumof expression at 6 dph, while the TSHβ peak was shiftedforward to 11 dph. These findings are in good agreementwith those previously reported for the Senegalese sole [17]and other fish species [45]. Temporal regulation of mRNAlevels is coherent with the role of TRH, which promotesthe synthesis and release of TSH. TSH in turn acts on thethyroid follicles by inducing iodothyronine deionidase ac-tivity [49], which ultimately leads to the synthesis of T4and T3, which display higher concentrations at the climaxof metamorphosis. Only slight changes in Iodothyroninedeionidase I (D1) expression occurred during the pre-metamorphosis stages, with an initial peak in expression at13 dph (onset of metamorphosis) and strong up-regulationat 24 dph (metamorphosis climax). D1 has been reportedto play a double role in TH synthesis by i) activating T4 byproducing the more active T3 and ii) inactivating T4 byproducing the metabolite rT3 [46]. The peak of expressionobserved at 24 dph appears to be in better agreement withthe inactivating function of D1, with a possible role in de-creasing circulating levels of THs after metamorphosis.Higher vertebrates commonly possess two principal
TR isoforms, namely, TRα and TRβ, and two genes en-coding TRα (TRαA and TRαB) have been found in dif-ferent fish species [18,50-52] as a result of the wholegenome duplication that occurred during teleost evolu-tion [53]. To date, two TRβ genes have been reportedonly in Conger myriaster [54]. In this study, two tran-scripts encoding TRα genes were identified, and theirexpression in common sole is similar to what has been
reported during metamorphosis in halibut [18] andgilthead seabream [45] and suggests a correlation be-tween TH levels and TRαA. This evidence supports thehypothesis postulated by Galay-Burgos [18] that TRαAis itself a TH-inducible gene.
Role of the GH/IGFI system during sole larvaldevelopmentThe Growth Hormone (GH) - Insulin-like Growth Factor-I (IGF-I) system is widely recognised for its importance inthe regulation of growth and development in fish by par-ticipating in the determination of both physiological pro-cesses and behavioural aspects [55]. During the lastdecade, there has been a growing interest in the physio-logical role of the GH/IGF system in developmental pro-cesses of fish. Although several studies have investigatedthe role of key components of the GH/IGFI axis in fishgrowth [55-57], there is no information on the temporalregulation of corresponding mRNA levels during larvaldevelopment and metamorphosis. In the present study,analysis of the mRNA levels of GH, GHRH, IGFI, IGF1Rand IGFBPs revealed a trend in expression coherent withtheir postulated role in the GH pathway. The cascade ofevents by which GH induces its biological function beginswhen GH, whose expression is stimulated by growthhormone-releasing hormone (GHRH), binds to specificGH receptors (GHR) and in turn stimulates IGFI synthesisin the liver [58].In the Atlantic halibut, the GH-IGFI system is estab-
lished at the start of autonomous feeding [59]. In thecommon sole, GHRH and GH display similar expressionpatterns, with a significant up-regulation before meta-morphosis onset (6 dph, soon after mouth opening),followed by a decrease in mRNA levels until 24 dph anda then subsequent increase (albeit not significant) at 33dph. Up-regulation of IGFI and IGFR1 appears to beconcurrent with the decrease in GH mRNA levels. Thisevidence is in agreement with the hypothesis that IGFIsynthesis acts as a mediator of a negative feedbackmechanism by inhibiting GH transcription as alreadydemonstrated in different fish species (e.g. Oncorhynchusmykiss, Oreochromis mossambicus, Anguilla anguilla) ([60]for a review). Other key components of the GH/IGFI path-ways are IGFBPs. In the present study, IGFBP mRNAsdisplayed lower expression in pre-metamorphosis stages,then gradually increased and reached a peak at metamor-phosis climax (24 dph, IGFBP4) or later (33 dph, IGFBP1,IGFBP2a). In the Japanese flounder, there is evidence thatIGFBPs play an important role in regulating the activityof IGFs during larval development and metamorphosis[61]. In zebrafish in vivo expression of IGFBP1 has beenreported to cause growth and developmental retardation[62]. In the common sole, down-regulation of IGFBP-1mRNA and increased expression of IGFI mRNA were
Ferraresso et al. BMC Genomics 2013, 14:315 Page 15 of 22http://www.biomedcentral.com/1471-2164/14/315
observed during metamorphosis, followed by an inversionof this trend after metamorphosis. This observation is inagreement with the need for IGFI-mediated stimulation ofpre-metamorphic larval growth and initiation of metamor-phosis; once metamorphosis is completed, IGFI function isnegatively regulated via a reduction in its mRNA levels andsequestration of circulating IGFI by IGFBPs.The potential regulatory effects of TH on IGFI expres-
sion remain to be fully clarified. In fish, T3 and T4 havebeen shown to induce hepatic IGFI expression. Inzebrafish and tilapia, T3 induces IGFI transcription bothin vitro and in vivo [63] and in mice, T3, in the presenceof THRα, binds to a TH response element in intron 1 ofthe IGFI gene to stimulate its transcription [64]. Thesephenomena are in agreement with the gene expressionprofiles of both S. solea IGFI transcripts, which show asignificant increase in mRNA levels at 13–18 dph, simul-taneous with a peak in THRαA expression. In the presentstudy, however, TH levels were not assessed.Morphological modifications that subtend eye migra-
tion during flatfish metamorphosis are controversial.Saele and coworkers [65] propose that bone remodellingand fibroblast proliferation drive Atlantic halibut eye mi-gration, while a recent study by Bao et al. [66] assumesthat in different fish species (i.e. Solea senegalensis,Cynoglossus semilaevis, P. olivaceus) the initial migrationof the eye is caused by cell proliferation in the suborbitaltissue of the blind side and that the twist of frontal boneis dependent on eye migration. Recent studies ([58] andreferences therein) have proposed that the GH-IGFIsystem participates in cranial remodelling during halibutmetamorphosis as key tissue/cell types (e.g. muscle, fi-broblasts, etc.) have been proven to be sensitive to GHand IGF1 during metamorphosis. The expression pro-files of sole genes involved in the GH/IGFI pathway, par-ticularly IGFI and IGF1R, appear to support such ahypothesis, despite the fact that, in the present study,transcriptomic data were obtained from whole larvaewithout tissue-specific information.
Transcriptomic landscape in pre-metamorphic larvaeAlthough the initiation of lateral asymmetry and eye mi-gration was only observed in 13 dph larvae of commonsole, it is likely that transcriptional changes occur beforephenotypic modifications become evident. In this re-spect, PCA analysis clearly indicated a specific clusteringalong the second component for 6, 11 and 13 dph lar-vae, compared to all earlier and later developmentalstages. Considering the large number of differentiallyexpressed transcripts, it is likely that key transcriptomicevents occur between 6 and 13 dph. The majority of sig-nificant genes appear to be related to the developmentof epithelial layers and digestive organs, a process thatmight be only indirectly involved in metamorphosis.
However, a few enriched KEGG pathways that wereobserved in the same stages are suggestive of additionaldevelopmental processes. The “Mevalonate pathway”,which was found to be significantly enriched in up-regulated genes, leads either to cholesterol synthesis orto protein lipidation, both processes that are relevantduring development (e.g. several small GTPases requireprenylation for activity). Similarly, the significant enrich-ment of the “Arachidonic acid pathway” and, in particu-lar, prostaglandin E2 (PGE2)-synthase can be linked todevelopmental processes, as PGE2 has been shown to beinvolved in the morphogenesis of several organs.As mentioned previously, the molecular mechanisms
underlying flatfish metamorphosis are still under debate,and eye migration and external asymmetry are appar-ently a separate process from somatic growth and or-ganogenesis [65]. A recent study [67] hypothesised thatflounder eye-sidedness is controlled by the nodal-lefty-pitx2 (NLP) pathway, in which pre-metamorphic Pitx2re-expression on the left side habenula drives eye lateral-isation by stimulating cell proliferation. In the presentstudy, Pitx2 (N_isotig16834) displayed reduced mRNAlevels over time, with no peaks in pre-metamorphicstages. However, it should be emphasised that gene ex-pression was assessed in whole larvae (without separ-ation of the right and left sides of the animal), and theobserved decrease in expression could arise from the de-crease in habenula/whole body tissue mass ratio that oc-curs during larval development. Bao and colleagues [66]reported that initial migration of the eye in flatfish iscaused by fibroblast proliferation in the suborbital tissueof the blind side. Once the eye receives sufficient push-ing force from proliferating cells to overcome the maincounteracting force from the other eye, it begins migrat-ing upwards. Single-cell and collective migration areknown to occur during morphogenesis, tissue regener-ation and in pathological conditions. In particular, collect-ive cell migration is essential in building, shaping, andremodelling complex tissues and tissue compartments.Cell–cell and cell–matrix adhesion, cytoskeletal polarityand rigidity, and pericellular proteolysis interdependentlycontrol migration mode and efficiency [68]. Interactionsof cells with the extracellular matrix (ECM) are essentialfor the control of tissue remodelling and cell migrationbecause the ECM provides the substrate as well as a bar-rier towards the advancing cell body. Motility is limited bythe turnover rates of adhesion and de-adhesion events,yielding an inverse relationship between contact strengthand migration rates. At the cell-extracellular matrix con-tact points, specialised structures known as focal adhe-sions are formed, in which actin filaments are anchored totransmembrane receptors of the integrin family. Focaladhesion can be controlled by modulation of integrinexpression levels, degradation of ECM structures by

Ferraresso et al. BMC Genomics 2013, 14:315 Page 16 of 22http://www.biomedcentral.com/1471-2164/14/315
proteases, and focal contact disassembly by cytoskeletalreorganisation (reviewed by [69]). In this context, interest-ing findings arose from the identification of genes thatwere differentially expressed in pre-metamorphic S. solealarvae. Functional annotation and KEGG pathway analysesrevealed that “Focal adhesion” (dre04510) and “TightJunction” (dre04530) were differentially expressed in pre-metamorphic stages and 18 dph larvae. Vitronectin a(P_isotig17782), a cell adhesion factor found in serum andECM that is recognised by certain members of the integ-rin family and serves as a cell-to-substrate adhesion mol-ecule, was found to be down-regulated in 6, 11 and 13dph larvae compared to previous and later stages. Severalcomponents of tight junctions displayed a similar patternof expression. Members of the claudin family (i.e. claudin5b, 8d, 15d and 30c), which in some cases have beenreported to have a role in adhesion to ECM and inhib-ition of cell motility in human cancer [70], were under-expressed in pre-metamorphic stages. Similar evidencewas observed for the transcript encoding occludin b(P_isotig18663).An opposite trend was observed for matrix
metalloproteinase-2 (MMP2) and collagenase MT1-MMP, both reported by Friedl and coworker [69] toplay a key role in ECM degradation during cell migra-tion. MMP2 was up-regulated at 11-18-24 dph, whileMT1-MMP was over-expressed at 18–24 dph. Anothergroup of metalloproteases that is potentially involvedin pre- and early metamorphosis stages is that repre-sented by astacin-like metallo-endopeptidase. Astacin-like zinc-metalloproteases, also known as hatchingenzymes, are widely present in egg-laying animals andplay a key role in degrading chorion proteins to releasethe developing embryo. As reported above, a significantincrease in expression from 6 dph was observed for threemembers of this family, encoded by transcripts N_iso-tig09202, P_isotig09013 and P_isotig04269 (see Figure 3Band Results). Evolutionary analysis of astacin-like metal-loproteases in the medaka and zebrafish genomes [16]demonstrated that one or two genes represent bona fide“hatching enzymes”, while the rest are paralogous copiesof still unclear function. A recent study [71] revealed thatthese proteins are involved in mouse and chicken embryo-genesis and organogenesis, mostly in remodelling epithe-lia. Whether astacin-like metallo-endopeptidases have asimilar role in the common sole and, more specifically, inpromoting cellular/tissue migration through ECM reorg-anisation during early development represents an interest-ing topic for further studies.Finally, coordinated changes in the actin cytoskeleton
as well as the actin-myosin interaction provide the forcefor cellular motility. In the present study, both α-actinand myosin light-chain displayed increased levels of ex-pression at 13 dph and thereafter. The over-expression
of these genes could be simply related to muscle develop-ment, which occurs during the same stages; however, arole in molecular mechanisms of cell migration and, moregenerally, in tissue rearrangement cannot be excluded.In conclusion, despite the limitations of gene expres-
sion analysis on whole larvae, including the absence ofcell- or tissue-specific information and the potential sig-nal dilution of scarcely represented transcripts, the char-acterisation of the larval sole transcriptome permitted aglobal view of the main molecular mechanisms under-lying physiological and morphological changes duringthe larval-to-juvenile transition. In particular, the obser-vation of a peculiar shape in the transcriptomic land-scape of 6–13 dph larvae and the analysis of genesinvolved in such phenomenon indicated molecular path-ways and gene networks that might be critical for theprofound phenotypical changes that occur during flatfishmetamorphosis.
ConclusionsWith the advent of novel methods for high-throughputDNA sequencing such as 454 pyrosequencing technol-ogy, genomic resources are gradually becoming more af-fordable for the study of non-model species for whomthis type of knowledge remains limited. The develop-ment of different ‘omic’ technologies is thus enhancingthe knowledge of the complex genetic control under-lying different physiological processes of flatfishes. In thepresent study, the transcriptome of the common sole, aflatfish species of great interest for European aquacul-ture, was sequenced for the first time, and a microarrayplatform for gene expression profiling is now available.Gene expression analysis of developmental stages per-mitted the delineation of the main mechanisms under-lying physiological and morphological changes duringthe larval-to-juvenile transition. The large variety of bio-logical processes found to be differentially expressed be-tween time points reveals the complexity of transcriptomeregulation during larval ontogenesis. The detailed analysisof the transcriptomic landscape of pre-metamorphic lar-vae indicates molecular pathways and gene networks thatmight be critical for the profound phenotypical changesthat occur during flatfish metamorphosis.
MethodsLarval rearing and samplingCommon sole larvae came from one batch of fertilisedeggs obtained from spontaneous spawning of a broodstockmaintained at the Laboratory of Aquaculture, Departmentof Medical Veterinary Sciences, University of Bologna,Italy. Broodstock fish were captured in the Adriatic Seaand adapted to captivity over the past 6 years. Eggs andnewly hatched larvae were maintained in a single incuba-tor until mouth opening at 4 days post hatching (dph) and
Ferraresso et al. BMC Genomics 2013, 14:315 Page 17 of 22http://www.biomedcentral.com/1471-2164/14/315
then allocated in three flat-bottom 280-l square tanks(2000 larvae tank−1). Larvae were fed according to stand-ard hatchery feeding protocols consisting of live feed(Artemia nauplii until 9 dph and subsequently enrichedmetanauplii) with dry feed (AgloNorse, size of 150-350μm, Ewos, Norway) as co-feed until 27 dph. Artemia nau-plii and metanauplii were manually administered twice aday (10:00 am and 4:00 pm). Dry feed was supplied by beltfeeders for 16 h day-1 (from 10:00 am until 2:00 am) to ap-parent satiation, ranging from 4 to 7 g tank-1 day -1.Artemia cysts (Great Salt Lakes, Catvis BV, TheNetherlands) were incubated and hatched in seawater (sal-inity 25 g/l) at 28 °C over 18 h. Artemia metanauplii wereharvested and enriched for 24 h using Algamac-3050(Aquafauna, Bio-Marine Inc. Hawthorne, USA). The tankswere supplied with natural seawater and connected toa recirculating system. The water temperature wasmaintained at 18.0 ± 1.0 °C, and the photoperiod wasmaintained at a 16/8 h light/dark. The oxygen levelwas 7.5 ± 1.0 ppm. Animals were reared until 33 dph, dur-ing which survival and growth were comparable to that ob-served in previous studies [4]. Larvae were randomlysampled at 1, 4, 6, 8, 11, 13, 18, 20, 24 and 33 dph. The on-set of metamorphosis occurred at 13–14 dph (start of lefteye migration) and ended at 24–25 dph (completion of lefteye migration and visibility of left orbital arch on the dor-sal side). Sampled larvae were sacrificed by anaestheticoverdose. The larvae were placed in a bath of 2-phenoxyethanol solution at a concentration of 0.5–0.6 ml/l until death was achieved, rinsed with distilled water andthen preserved in RNAlater (Ambion®, Life TechnologiesLtd, Paisley, UK ) until further processing. In addition tothe larvae, five wild adult soles (average weight: 132.8 g ±13.7) from the North Adriatic Sea were also sacrificedaccording to the same procedure. The intestine and liverwere isolated from each fish, and a portion of the collectedtissues was sampled and preserved in the same way as thelarvae. The method of euthanasia and all experimentalprocedures were evaluated and approved by the Ethical-scientific Committee for Animal Experimentation of theUniversity of Bologna in accordance with the EuropeanCommunity Council directive (86/609/ECC).
Larval stagingEight developmental stages, from hatching until com-pleted metamorphosis, were used in the present work tocharacterise the larval transcriptome of S. solea. At 4dph, larvae were symmetrical, and the yolk sac was stillpresent. Eyes were not completely pigmented, and mela-nophores were distributed in the finfold that surroundsthe larval body. At 6 and 11 dph, larvae were still sym-metrical, the mouth was open, and eyes were fullypigmented. Digestive tube development was also appre-ciable. At 13 dph, body asymmetry and eye migration
started (Stage I as in [72]). Pigmentation covered thebody, and a primordial caudal fin was visible. Larvae at18 dph were middle metamorphic (Stage II and III as in[72]) with the left eye positioned upwards and partiallyvisible from the right side. At 24 dph, the larval bodywas asymmetric. Eye translocation was complete, withthe left eye on the right side and the orbital arch com-pletely visible (Stage IV as in [72]). At 33 dph, metamor-phosis was complete, and larvae appeared in theirjuvenile form.
RNA extraction, cDNA library construction andsequencingTotal RNA was extracted from pools of S. solea larvaeand adult tissues using the RNAeasy Mini Kit (Qiagen,Hilden, Germany) according to the manufacturer’s speci-fications. The larval pool from 1 to 13 dph contained ap-proximately 10 individuals, while 18 to 33 dph poolscontained 5 larvae each. For each sample, the RNA con-centration was determined with a NanoDrop® ND-1000UV–vis spectrophotometer (NanoDrop Technologies,Wilmington, USA). RNA integrity and quality were thenestimated with an Agilent 2100 Bioanalyzer (AgilentTechnologies, Palo Alto, CA), and the RNA integritynumber (RIN) index was calculated for each sample. OnlyRNAs with a RIN number > 8.5 were further processed.A normalised cDNA library was constructed by pooling
equal amounts of RNA from eight larval developmentalstages (1, 4, 6, 8, 11, 13, 20, and 33 dph, one pool of larvaefor each stage) and two tissues (liver and intestine) fromadult specimens. cDNA library construction was per-formed by Evrogen JSC (Moscow, Russia); briefly, totalRNA was used for double-stranded cDNA synthesis usingthe SMART approach. SMART-prepared amplified cDNAwas normalised using the DSN-normalisation method[73]. The normalisation procedure included cDNA de-naturation/reassociation, treatment with a duplex-specificnuclease (DSN, [74]), and amplification of the normalisedfraction by PCR. Approximately 5 μg of the normalisedcDNA library was then used for sequencing using Roche454 FLX Titanium technology at the BMR Genomics SRL(Padova, Italy).For gene expression profiling of larval development by
DNA microarray, pooled samples of 5–10 individuals(depending on larval age) were sampled and RNA wasextracted at 1, 4, 6, 11, 13, 18, 24 and 33 dph. The num-ber of biological replicate pools was four for each sam-pling point.
Read production and assemblySequencing was performed with GS FLX Titanium seriesreagents and one single region on a Genome SequencerFLX instrument. Bases were called with 454 software byprocessing the pyroluminescence intensity for each

Ferraresso et al. BMC Genomics 2013, 14:315 Page 18 of 22http://www.biomedcentral.com/1471-2164/14/315
bead-containing well in each nucleotide incorporation. Atotal of 909,466 sequence reads were produced from thenormalised cDNA library constructed using a mixture oflarval and adult tissues (see above). All Roche 454 FLXreads were trimmed to remove adapter sequences andhave been deposited in the NCBI Sequence Read Arch-ive (SRA) [75] under accession number SRA058691. Anadditional set of 314,486 reads was available from a sec-ond cDNA library of skeletal muscle (L. Bargelloni, un-published data). In addition, 21 mRNA sequences for S.solea were available in NCBI [76] (as of 1st September2011). All 454 sequence reads and all mRNAs were thenassembled with Newbler 2.6 software using defaultsettings. Newbler software produces “contigs”, “Isotigs”and “Isogroups”. An Isogroup is a collection of contigscontaining reads that imply connections between them.An Isotig is meant to be analogous to an individual tran-script; different isotigs from a given Isogroup can be in-ferred splice-variants. Ideally, Isogroups are transcripts,isotigs are splice variants of one transcript and contigsare separate exons.
Transcriptome annotationThe Basic Local Alignment Search Tool (BLAST) wasused to annotate S. solea Isotigs and contigs. Blast2GOsoftware [77] was used to perform Blastn (cut off E-value of < 1.0 e-7) searches against the NCBI nucleic nrdatabase as well as Blastx (cut off E-value of < 1.0 e-5)searches against the NCBI amino acid nr database andSWISSPROT database. By using this approach, GeneOntology (GO) terms associations for “Biological process”,“Molecular function” and “Cellular component” were alsoobtained for transcripts with a significant match with aknown protein. To improve the number of annotatedtranscripts, two additional approaches were attempted: i)blastx (cut off E-value of < 1.0 e-5) and blastn (cut off E-value of < 1.0 e-7) searches against proteins and high-quality draft transcriptomes of Danio rerio, Gasterosteusaculeatus, Oryzias latipes, Takifugu rubripes, Tetraodonnigroviridis, Homo sapiens, and Mus musculus availableon the Ensembl Genome Browser (release 56, [78], ii)blastn search (cut off E-value of < 1.0 e-7) against D. rerio,O. latipes, Gadus morhua, G. aculeatus, Ictalurusfurcatus, I. punctatus, Salmo salar, Oncorhynchus mykiss,Oreochromis niloticus, Pimephales promelas, H. sapiens,M. musculus databases stored in the NCBI UniGene data-base [79].Annotated transcripts were then further clustered
through mapping against a single species proteome, i.e.looking for independent isotigs or contigs that putativelyencoded the same protein (named “redundant” for brev-ity). Two or more Isotigs/contigs were considered clus-tered together when they displayed the same annotationwith at least 3 of 5 fish species when considering the
Ensembl Gene IDs of five fish species (D. rerio, G.aculeatus, O. latipes, T. nigroviridis, and T. rubripes). Inthe case of two transcripts encoding the same protein,only the longer one was used for microarray design.
Solea solea oligonucleotide microarrayGene expression analyses were performed with theAgilent-036353 Solea solea oligo microarray (GEO ac-cession: GPL16124). All unique annotated transcripts(15,385; see Results), excluding those annotated onlywith Unigene (2,549), were employed for microarray de-sign. Transcript matches with ENSEMBL protein ortranscript databases were then exploited to infer sole se-quence orientations by identifying i) transcripts with un-equivocal orientation (sequence frame concordant acrossall matches), ii) transcripts with ambiguous orientation(sequence frame not concordant across matches), and iii)transcripts with unknown orientation (transcripts whosematch was against the NCBI nr nucleotide database). Oneprobe for annotated sequences with unequivocal orienta-tion (10,987) was designed while, whenever possible, twoprobes with both orientations (sense and antisense) weredesigned for Isotigs with ambiguous/unknown orientation(1,849). A total of 14,674 oligonucleotide probes (60 nt)representing 12,836 transcripts were in situ synthesisedonto the array using Agilent non-contact ink-jet technol-ogy (8 × 15 K format, including default positive and nega-tive controls).A single dye (Cy3) labelling scheme was implemented,
and a mixture of 10 different viral poly-adenylated RNAs(Agilent Spike-In Mix) was added to each RNA sampleto monitor labelling and hybridisation quality as well asmicroarray analysis work-flow. Sample labelling and hy-bridisation were performed as reported in Ferraresso et al.[80] with slight modifications. Processed slides werescanned at 5 μm resolution with an Agilent G2565BADNA microarray scanner. Default settings were modifiedto scan the same slide twice at two different sensitivitylevels (XDR Hi 100% and XDR Lo 10%). The two linkedimages generated were analysed together, and data wereextracted and background subtracted using the standardprocedures contained in Agilent Feature Extraction (FE)Software version 9.5.1.
Statistical analysesThe normalisation procedure was performed using Rstatistical software [81]. Microarray data were quantilenormalised across all arrays. To exclude poor-qualityprobes from statistical analyses, hybridisation successand mean fluorescence for each probe were evaluated ina total of 31 experiments (four biological replicates foreach developmental stage with the exception of 13 dph,for which one biological replicate was discarded). Micro-array probes were considered unreliable when a successful

Ferraresso et al. BMC Genomics 2013, 14:315 Page 19 of 22http://www.biomedcentral.com/1471-2164/14/315
hybridisation (“glsFound” equal to 1) in less than 50% ofthe experiments and a mean fluorescence below 10 wereobserved. Using this approach, 753 probes were filteredout, leaving 13,921 probes for all further analyses. A total of546 probes of 753 (72.5%) were sense or antisense oligosdesigned for transcripts with unknown orientation forwhich the second probe (antisense or sense respectively)showed good performance.Cluster analyses were performed on the entire dataset
using the AutoSOME strategy [82] by modifying defaultsettings to increase Ensemble runs to 500 and to main-tain the p-value threshold at 0.05. A fuzzy clusternetwork for illustrating the AutoSOME results was gen-erated with the visualisation tool Cytoscape [83]. Bidir-ectional Hierarchical Clustering (HCL) and PrincipalComponent Analysis (PCA), as implemented in TIGRMultiExperiment Viewer (MeV, version 4.5.1), were alsoperformed on the entire gene expression dataset. Expres-sion profile comparisons between developmental stageswere performed using Significance Analysis of Micro-arrays (SAM) software [15]. Two-class comparisons (FDR1%, minimal Fold-Change (FC) ≥ 2) were performed byconsidering each time point as independent. SAM quanti-tative correlation analyses (FDR 0%) were also performedin order to reveal genes whose expression was positively ornegatively correlated with either developmental stages orsample projection on the PCA Y-axis. A non-parametricSpearman rank-correlation test was used to assess the cor-relation between the expression values measured by real-time RT-PCR and microarray for a set of 10 candidategenes. Spearman correlation tests were implemented usingSPSS 12.0.
Functional annotation of differentially expressed genesFunctional annotation analysis of differentially expressedgenes was performed using the DAVID (Database forAnnotation, Visualisation and Integrated Discovery) web-server [84]. “Biological process”, “Molecular function” and“Cellular component” annotations were performed by set-ting gene count = 4 and ease = 0.05. KEGG pathway ana-lysis was also performed with gene count = 4 and ease =0.05. Because DAVID contains functional annotation datafor a limited number of species, it was necessary to linksole transcripts with sequence identifiers that could berecognised in DAVID. This was performed using S. soleamatches with zebrafish proteins and transcripts (see“Transcriptome annotation” section). Finally, D. rerioEnsembl Gene IDs were obtained from the correspondingEnsembl protein and transcript entries using theBIOMART data mining tool [85].
Real-time RT-PCR validationA set of 10 genes was tested by RT-qPCR using the samesamples used for the microarray experiments to validate
the performance of the microarray platform. Thosegenes, listed in Table 2, were chosen from among thosefound to be involved in larval development and thatdisplayed different patterns of expression across stages.A total of 16 samples, 4 pools for each of 1, 6, 13 and 24dph larvae, were employed. One microgram of totalRNA for each sample was reverse-transcribed to cDNAin a total of 20 μl, by using 200 units of Superscript II(Invitrogen™, Carlsbad, California) and 1 μl randomhexamers (50 μM). An aliquot (2.5 μl) of diluted (1:100)cDNA template was amplified in a final volume of 10 μlcontaining 5 μl Platinum SYBR Green qPCR SuperMix-UDG 2× (Invitrogen™) and 0.25 μl each gene-specific pri-mer (10 μM). The amplification protocol consisted of aninitial step of 2 min at 50°C and 2 min at 95° followed by45 cycles of 10 s at 95°C and 30 s at 60°C. All experimentswere performed in a LightCycler® 480 thermocycler (RocheDiagnostics, Mannheim, Germany). To evaluate the effi-ciency of each assay, standard curves were constructed byamplifying twofold serial dilutions (from 1:40 to 1:1280) ofthe same cDNA, which was used as a calibrator. For alltranscripts, the efficiency of the primer pairs was alwayswithin the range 95 - 105%. For each sample, the Cp(Crossing point) was used to determine the relativeamount of target gene; each measurement was performedin duplicate and normalised to the reference gene (riboso-mal protein S27, RPS27), which was also measured induplicate. RPS27 (Isotig21747) was chosen as the refer-ence for RT-qPCR assays as it is commonly considered ahousekeeping gene and did not exhibit any significantchange in microarray data between developmental stages(%CV 7.5%).
Microsatellite screeningAll annotated Isotigs and contigs were used for micro-satellite repeat searches using MISA software [86]. A se-quence was considered to contain a microsatellite if itpossessed any of the following repeated motifs: at least 6repeated dinucleotides or at least 5 repeated tri-, tetra-,penta- or hexanucleotide motifs.
Additional files
Additional file 1: Isotigs and their annotation. List of all 16,371annotated transcripts and their annotation against 18 differenttranscript/protein databases. Different excel sheets for each of the 18databases used for sequences annotation are provided. In each, speciesaffiliation of hit, accession number, length of aligned region (for matchwith transcriptomes) and E-value are reported. An additional sheet called“global annotation” reports a global view of all match.
Additional file 2: Heatmaps representing the gene expression valuein each developmental stages of pathways and genes listed inTable 1. A. Glucose metabolism, B. Muscle development, C. Hedgehogsignaling pathway, D. Wnt signaling pathway.
Additional file 3: Functional annotation of differentially expressedgenes across larval transitions. Lists of Biological processes and KEGG

Ferraresso et al. BMC Genomics 2013, 14:315 Page 20 of 22http://www.biomedcentral.com/1471-2164/14/315
pathways found significantly enriched in each stage comparison. Foreach comparison three different lists are reported: “ALL” indicatesenriched BP or KEGG pathways found enriched when considering allsignificant genes (both up- and down-regulated), “UP” indicates BP orKEGG pathways found enriched within up-regulated genes while“DOWN” indicates BP or KEGG pathways found enriched withinup-regulated genes.
Additional file 4: Phylogenetic analysis of “hatching enzymes”.Phylogenetic tree showing the evolutionary relationships betweenS. solea sequences (indicated with Isotig name) and all availableastacin-like metalloproteases from vertebrate genomes. Methods onhow phylogenetic analysis was conducted are also reported.
Additional file 5: List of significant probes identified by SAMquantitative analysis. Microarray probes significantly correlated tosamples projection on PCA Y-axis. Probes highlighted in red are thosefound positively correlated to samples projection on PCA Y-axis whileprobes highlighted in green are those found negatively correlated tosamples projection on PCA Y-axis. Annotation for each probe is alsoreported.
Additional file 6: Functional annotation of genes up-regulated onpre-metamorphic larvae. Functional annotation, based on both GeneOntology and KEGG Pathway analyses, of genes significantly up-regulatedin pre-metamorphic larvae and positively correlated to PCA Y-axisprojection.
Additional file 7: List and annotation of up-regulated genes onpre-metamorphic larvae. List and annotation of 372 genes found bothsignificantly up-regulated in pre-metamorphic larvae and positivelycorrelated to samples projection on PCA Y-axis.
Additional file 8: List and annotation of down-regulated genes onpre-metamorphic larvae. List and annotation of 190 genes found bothsignificantly down-regulated in pre-metamorphic larvae and negativelycorrelated to samples projection PCA Y-axis.
Competing interestsThe authors declare that they have no competing interests.
Authors’ contributionsPPG, LB, SC, PM and AB conceived and designed the project. AB and LPconducted fish rearing and sampling. SF carried out transcriptomesequencing and annotation, probe design, microarray experiments and qRT-PCR validation. SF and LB executed statistical analyses and functionalannotation. SF, LB, AB and PPG wrote the manuscript. All listed authorsedited the manuscript. All authors read and approved the manuscript.
AcknowledgementsResearch project was partially funded by the Istituto ZooprofilatticoSperimentale della Lombardia e dell’Emilia. We thank also two anonymousreviewers for their useful comments on an earlier version of the manuscript.
Author details1Department of Comparative Biomedicine and Food Science, University ofPadova, Viale dell’Università 16, Legnaro, PD 35020, Italy. 2Department ofVeterinary Medical Sciences, Alma Mater Studiorum, University of Bologna,via Tolara di Sopra 50, Ozzano Emilia, BO 40064, Italy. 3Istituto ZooprofilatticoSperimentale della Lombardia e dell’Emilia, via Bianchi 9Brescia 24125, Italy.4Istituto Zooprofilattico Sperimentale della Lombardia e dell’Emilia, Sezionedi Forlì, Via Marchini 1, Forlì 47122, Italy.
Received: 18 October 2012 Accepted: 1 May 2013Published: 10 May 2013
References1. Okada N, Takagi Y, Seikai T, Tanaka M, Tagawa M: Asymmetrical
development of bones and soft tissues during eye migration ofmetamorphosing Japanese flounder, Paralichthys olivaceus. Cell Tissue Res2001, 304(1):59–66.
2. Cerdà J, Douglas S, Reith M: Genomic resources for flatfish research andtheir applications. J Fish Biol 2010, 77:1045–1070.
3. Mazurais D, Darias M, Zambonino-Infante JL, Cahu CL: Transcriptomics forunderstanding marine fish larval development. Can J Zool 2011, 89:599–611.
4. Bonaldo A, Parma L, Badiani A, Serratore P, Gatta PP: Very early weaning ofcommon sole (Solea solea L.) larvae by means of different feedingregimes and three commercial microdiets: influence on performances,metamorphosis development and tank hygiene. Acquaculture 2011,321:237–244.
5. Agulleiro MJ, Nguis V, Cañavate JP, Martínez-Rodríguez G, Mylonas CC,Cerdà J: Induction of spawning of captive-reared Senegal sole (Soleasenegalensis) using different delivery systems for gonadotropin-releasinghormone agonist. Aquaculture 2006, 257(1–4):511–524.
6. Conceição LEC, Ribeiro L, Engrola S, Aragão C, Morais S, Lacuisse M, SoaresF, Dinis MT: Nutritional physiology during development of Senegalesesole (Solea senegalensis). Aquaculture 2007, 268(1–4):64–81.
7. Cerdà J, Douglas SE, Buesa C, Cañavate P, López-Barea J, Manchado M,Martínez G, Navas JI, Piferrer F, Planas J, Prat F, Reith M, Ruíz-Rejón M, YúferaM: PLEUROGENE: flatfish genomics and proteomics for aquaculture.Comp Biochem Physiol 2005, 141A:s87.
8. Douglas SE, Knickle LC, Kimball J, Reith ME: Comprehensive EST analysis ofAtlantic halibut (Hippoglossus hippoglossus), a commercially relevantaquaculture species. BMC Genomics 2007, 8:144.
9. Murray HM, Lall SP, Rajaselvam R, Boutilier LA, Flight RM, Blanchard B,Colombo S, Mohindra V, Yúfera M, Douglas SE: Effect of early introductionof microencapsulated diet to larval Atlantic halibut, Hippoglossushippoglossus L. assessed by microarray analysis. Mar Biotechnol 2010,12(2):214–229.
10. Cerdà J, Mercadé J, Lozano JJ, Manchado M, Tingaud-Sequeira A, Astola A,Infante C, Halm S, Viñas J, Castellana B, Asensio E, Cañavate P, Martínez-Rodríguez G, Piferrer F, Planas JV, Prat F, Yúfera M, Durany O, Subirada F,Rosell E, Maes T: Genomic resources for a commercial flatfish, theSenegalese sole (Solea senegalensis): EST sequencing, oligo microarraydesign, and development of the Soleamold bioinformatic platform.BMC Genomics 2008, 9:508.
11. Taboada X, Robledo D, Del Palacio L, Rodeiro A, Felip A, Martínez P, Viñas A:Comparative expression analysis in mature gonads, liver and brain ofturbot (Scophthalmus maximus) by cDNA-AFLPS. Gene 2012,492(1):250–261.
12. Darias MJ, Boglino A, Manchado M, Ortiz-Delgado JB, Estévez A, Andree KB,Gisbert E: Molecular regulation of both dietary vitamin A and fatty acidabsorption and metabolism associated with larval morphogenesis ofSenegalese sole (Solea senegalensis). Comp Biochem Physiol A Mol IntegrPhysiol 2012, 161(2):130–139.
13. Transcriptome Shotgun Assembly Sequence Database. http://www.ncbi.nlm.nih.gov/genbank/tsa.
14. GEO database. http://www.ncbi.nlm.nih.gov/geo/.15. Tusher VG, Tibshirani R, Chu G: Significance analysis of microarrays
applied to the ionizing radiation response. Proc Natl Acad Sci 2001,98(9):5116–5121.
16. Kawaguchi M, Yasumasu S, Hiroi J, Naruse K, Inoue M, Iuchi I: Evolution ofteleostean hatching enzyme genes and their paralogous genes.Dev Genes Evol 2006, 216(12):769–784.
17. Manchado M, Infante C, Asensio E, Planas JV, Cañavate JP: Thyroidhormones down-regulate thyrotropin beta subunit and thyroglobulinduring metamorphosis in the flatfish Senegalese sole (Solea senegalensisKaup). Gen Comp Endocrinol 2008, 155(2):447–455.
18. Galay-Burgos M, Power DM, Llewellyn L, Sweeney GE: Thyroid hormonereceptor expression during metamorphosis of Atlantic halibut(Hippoglossus hippoglossus). Mol Cell Endocrinol 2008, 281:56–63.
19. Pelletier I, Bally-Cuif L, Ziegler I: Cloning and developmental expression ofzebrafish GTP cyclohydrolase I. Mech Dev 2001, 109(1):99–103.
20. Brody LC, Conley M, Cox C, Kirke PN, McKeever MP, Mills JL, Molloy AM,O’Leary VB, Parle-McDermott A, Scott JM: A polymorphism, R653Q, in thetrifunctional enzyme methylenetetrahydrofolate dehydrogenase/methenyltetrahydrofolate cyclohydrolase/formyltetrahydrofolatesynthetase is a maternal genetic risk factor for neural tube defects:report of the Birth Defects Research Group. Am J Hum Genet 2002,71(5):1207–1215.
21. Stuckenholz C, Lu L, Thakur P, Kaminski N, Bahary N: FACS-assistedmicroarray profiling implicates novel genes and pathways in zebrafishgastrointestinal tract development. Gastroenterology 2009,137(4):1321–1332.
Ferraresso et al. BMC Genomics 2013, 14:315 Page 21 of 22http://www.biomedcentral.com/1471-2164/14/315
22. Lampert JM, Holzschuh J, Hessel S, Driever W, Vogt K, von Lintig J:Provitamin A conversion to retinal via the beta, beta-carotene-15,15′-oxygenase (bcox) is essential for pattern formation and differentiationduring zebrafish embryogenesis. Development 2003, 130(10):2173–2186.
23. Darias MJ, Zambonino-Infante JL, Hugot K, Cahu CL, Mazurais D: Geneexpression patterns during the larval development of European sea bass(Dicentrarchus labrax) by microarray analysis. Mar Biotechnol (NY). 2008,10(4):416–428.
24. Sarropoulou E, Kotoulas G, Power DM, Geisler R: Gene expression profilingof gilthead sea bream during early development and detection of stress-related genes by the application of cDNA microarray technology. PhysiolGenomics 2005, 23:182–191.
25. Ferraresso S, Vitulo N, Mininni AN, Romualdi C, Cardazzo B, Negrisolo E,Reinhardt R, Canario AV, Patarnello T, Bargelloni L: Development andvalidation of a gene expression oligo microarray for the gilthead seabream (Sparus aurata). BMC Genomics 2008, 9:580.
26. Yúfera M, Halm S, Beltran S, Fusté B, Planas JV, Martínez-Rodríguez G:Transcriptomic characterization of the larval stage in gilthead seabream(Sparus aurata) by 454 pyrosequencing. Mar Biotechnol (NY). 2012,14(4):423–435.
27. Douglas SE, Knickle LC, Williams J, Flight RM, Reith ME: A first generationAtlantic halibut Hippoglossus hippoglossus (L.) microarray: application todevelopmental studies. J Fish Biol 2008, 72(9):2391–2406.
28. Pardo BG, Fernández C, Millán A, Bouza C, Vázquez-López A, Vera M,Alvarez-Dios JA, Calaza M, Gómez-Tato A, Vázquez M, Cabaleiro S,Magariños B, Lemos ML, Leiro JM, Martínez P: Expressed sequence tags(ESTs) from immune tissues of turbot (Scophthalmus maximus)challenged with pathogens. BMC Vet Res 2008, 25:4–37.
29. Adzhubei AA, Vlasova AV, Hagen-Larsen H, Ruden TA, Laerdahl JK, HøyheimB: Annotated expressed sequence tags (ESTs) from pre-smolt Atlanticsalmon (Salmo salar) in a searchable data resource. BMC Genomics 2007,8:209.
30. Liu Z, Li RW, Waldbieser GC: Utilization of microarray technology forfunctional genomics in ictalurid catfish. J Fish Biol 2008, 72:2377–2390.
31. Coppe A, Pujolar JM, Maes GE, Larsen PF, Hansen MM, Bernatchez L, Zane L,Bortoluzzi S: Sequencing, de novo annotation and analysis of the firstAnguilla anguilla transcriptome: EeelBase opens new perspectives for thestudy of the critically endangered European eel. BMC Genomics 2010, 11:635.
32. Falk-Petersen IB: Comparative organ differentiation during early lifestages of marine fish. Fish Shellfish Immunol 2005, 19(5):397–412.
33. Yarfitz S, Hurley JB: Transduction mechanisms of vertebrate andinvertebrate photoreceptors. J Biol Chem 1994, 269(20):14329–14332.
34. Terakita A: The opsins. Genome Biol 2005, 6(3):213.35. Bohnsack BL, Kasprick DS, Kish PE, Goldman D, Kahana A: A zebrafish
model of axenfeld-rieger syndrome reveals that pitx2 regulation byretinoic acid is essential for ocular and craniofacial development. InvestOphthalmol Vis Sci 2012, 53(1):7–22.
36. Prabhudesai SN, Cameron DA, Stenkamp DL: Targeted effects of retinoicacid signaling upon photoreceptor development in zebrafish. Dev Biol2005, 287(1):157–167.
37. Li A, Zhu X, Craft CM: Retinoic acid upregulates cone arrestin expressionin retinoblastoma cells through a Cis element in the distal promoterregion. Invest Ophthalmol Vis Sci 2002, 43(5):1375–1383.
38. Cammas L, Trensz F, Jellali A, Ghyselinck NB, Roux MJ, Dollé P: Retinoic acidreceptor (RAR)-alpha is not critically required for mediating retinoic acideffects in the developing mouse retina. Invest Ophthalmol Vis Sci 2010,51(6):3281–3290.
39. Matt N, Dupé V, Garnier JM, Dennefeld C, Chambon P, Mark M, GhyselinckNB: Retinoic acid-dependent eye morphogenesis is orchestrated byneural crest cells. Development 2005, 132(21):4789–4800.
40. Nixon SJ, Wegner J, Ferguson C, Méry PF, Hancock JF, Currie PD, Key B,Westerfield M, Parton RG: Zebrafish as a model for caveolin-associatedmuscle disease; caveolin-3 is required for myofibril organization andmuscle cell patterning. Hum Mol Genet 2005, 14(13):1727–1743.
41. Bryantsev AL, Baker PW, Lovato TL, Jaramillo MS, Cripps RM: Differentialrequirements for Myocyte Enhancer Factor-2 during adult myogenesis inDrosophila. Dev Biol 2012, 361(2):191–207.
42. Chan J, O’Donoghue K, Gavina M, Torrente Y, Kennea N, Mehmet H, StewartH, Watt DJ, Morgan JE, Fisk NM: Galectin-1 induces skeletal muscledifferentiation in human fetal mesenchymal stem cells and increasesmuscle regeneration. Stem Cells 2006, 24(8):1879–1891.
43. Seeley M, Huang W, Chen Z, Wolff WO, Lin X, Xu X: Depletion of zebrafishtitin reduces cardiac contractility by disrupting the assembly of Z-discsand A-bands. Circ Res 2007, 100(2):238–245.
44. Johnston IA: Environment and plasticity of myogenesis in teleost fish.J Exp Biol 2006, 209:2249–2264.
45. Campinho MA, Galay-Burgos M, Sweeney GE, Power DM: Coordination ofdeiodinase and thyroid hormone receptor expression during the larvalto juvenile transition in sea bream (Sparus aurata, Linnaeus). Gen CompEndocrinol 2010, 165(2):181–194.
46. Power DM, Llewellyn L, Faustino M, Nowell MA, Björnsson BT, Einarsdottir IE,Canario AV, Sweeney GE: Thyroid hormones in growth and developmentof fish. Comp Biochem Physiol C Toxicol Pharmacol 2001, 130(4):447–459.
47. Brown DD, Cai L: Amphibian metamorphosis. Dev Biol 2007, 306(1):20–33.48. Infante C, Asensio E, Cañavate JP, Manchado M: Molecular characterization
and expression analysis of five different elongation factor 1 alpha genesin the flatfish Senegalese sole (Solea senegalensis Kaup): differential geneexpression and thyroid hormones dependence during metamorphosis.BMC Mol Biol 2008, 9:19.
49. Köhrle J: Thyrotropin (TSH) action of thyroid hormone deiodination andsecretion: One aspect of thyrotropin regulation of thyroid cell biology. InPhysiological Regulation and Biological Function of Thyrotropin. Edited byStuttgart BG. New York: Georg Thieme Verlag: Hormone and MetabolicResearch, Supplement Series, 23; 1990:18–28.
50. Harada M, Yoshinaga T, Ojima D, Iwata M: cDNA cloning and expressionanalysis of thyroid hormone receptor in the coho salmon Oncorhynchuskisutch during smoltification. Gen Comp Endocrinol 2008, 155(3):658–667.
51. Kawakami Y, Nozaki J, Seoka M, Kumai H, Ohta H: Characterization ofthyroid hormones and thyroid hormone receptors during the earlydevelopment of Pacific bluefin tuna (Thunnus orientalis). Gen CompEndocrinol 2008, 155(3):597–606.
52. Manchado M, Infante C, Rebordinos L, Cañavate JP: Molecularcharacterization, gene expression and transcriptional regulation ofthyroid hormone receptors in Senegalese sole. Gen Comp Endocrinol2009, 160(2):139–147.
53. Nakatani Y, Takeda H, Kohara Y, Morishita S: Reconstruction of thevertebrate ancestral genome reveals dynamic genome reorganization inearly vertebrates. Genome Res 2007, 17(9):1254–1265.
54. Kawakami Y, Tanda M, Adachi S, Yamauchi K: Characterization of thyroidhormone receptor alpha and beta in the metamorphosing Japaneseconger eel. Conger myriaster. Gen Comp Endocrinol. 2003, 132(2):321–332.
55. Reinecke M, Björnsson BT, Dickhoff WW, McCormick SD, Navarro I, Power DM,Gutiérrez J: Growth hormone and insulin-like growth factors in fish: wherewe are and where to go. Gen Comp Endocrinol 2005, 142(1–2):20–24.
56. Hidahl J, Sweeney G, Galay-Burgos M, Einarsdóttir IE, Björnsson BT: Cloningof Atlantic halibut growth hormone receptor genes and quantitativegene expression during metamorphosis. Gen Comp Endocrinol 2007,151(2):143–152.
57. Hildahl J, Galay-Burgos M, Sweeney G, Einarsdóttir IE, Björnsson BT:Identification of two isoforms of Atlantic halibut insulin-like growth factor-Ireceptor genes and quantitative gene expression during metamorphosis.Comp Biochem Physiol B Biochem Mol Biol 2007, 147(3):395–401.
58. Clark RG, Robinson IC: Up and down the growth hormone cascade.Cytokine Growth Factor Rev 1996, 7(1):65–80.
59. Hildahl J, Power DM, Björnsson BT, Einarsdóttir IE: Involvement of growthhormone-insulin-like growth factor I system in cranial remodeling duringhalibut metamorphosis as indicated by tissue- and stage-specificreceptor gene expression and the presence of growth hormonereceptor protein. Cell Tissue Res 2008, 332(2):211–225.
60. Reinecke M: Influences of the environment on the endocrine andparacrine fish growth hormone-insulin-like growth factor-I system.J Fish Biol 2010, 76(6):1233–1254.
61. Zhai W, Zhang J, Shi Z, Fu Y: Identification and expression analysis ofIGFBP-1 gene from Japanese flounder (Paralichthys olivaceus). CompBiochem Physiol B Biochem Mol Biol 2012, 161(4):413–420.
62. Kamei H, Lu L, Jiao S, Li Y, Gyrup C, Laursen LS, Oxvig C, Zhou J, Duan C:Duplication and diversification of the hypoxia-inducible IGFBP-1 gene inzebrafish. PLoS One 2008, 3(8):e3091.
63. Schmid AC, Lutz I, Kloas W, Reinecke M: Thyroid hormone stimulateshepatic IGF-I mRNA expression in a bony fish, the tilapia Oreochromismossambicus, in vitro and in vivo. Gen Comp Endocrinol 2003,130:129–134.

Ferraresso et al. BMC Genomics 2013, 14:315 Page 22 of 22http://www.biomedcentral.com/1471-2164/14/315
64. Xing W, Govoni KE, Donahue LR, Kesavan C, Wergedal J, Long C, Bassett JH,Gogakos A, Wojcicka A, Williams GR, Mohan S: Genetic evidence thatthyroid hormone is indispensable for prepubertal insulin-like growthfactor-I expression and bone acquisition in mice. J Bone Miner Res 2012,27(5):1067–1079.
65. Saele O, Smáradóttir H, Pittman K: Twisted story of eye migration inflatfish. J Morphol 2006, 267(6):730–738.
66. Bao B, Ke Z, Xing J, Peatman E, Liu Z, Xie C, Xu B, Gai J, Gong X, Yang G,Jiang Y, Tang W, Ren D: Proliferating cells in suborbital tissue drive eyemigration in flatfish. Dev Biol 2011, 351(1):200–207.
67. Suzuki T, Washio Y, Aritaki M, Fujinami Y, Shimizu D, Uji S, Hashimoto H:Metamorphic pitx2 expression in the left habenula correlated withlateralization of eye-sidedness in flounder. Dev Growth Differ 2009,51(9):797–808.
68. Friedl P, Wolf K: Plasticity of cell migration: a multiscale tuning model.J Cell Biol 2010, 188(1):11–19.
69. Friedl P, Wolf K: Tumour-cell invasion and migration: diversity and escapemechanisms. Nat Rev Cancer 2003, 3:362–374.
70. Escudero-Esparza A, Jiang WG, Martin TA: Claudin-5 is involved in breastcancer cell motility through the N-WASP and ROCK signalling pathways.J Exp Clin Cancer Res 2012, 31:43.
71. Acloque H, Lavial F, Pain B: Astacin-like metallo-endopeptidase isdynamically expressed in embryonic stem cells and embryonicepithelium during morphogenesis. Dev Dyn 2012, 241(3):574–582.
72. Fernández-Díaz C, Yúfera M, Cañavate JP, Moyano FJ, Alarcón FJ, Díaz M:Growth and physiological changes during metamorphosis of Senegalsole reared in the laboratory. J Fish Biol 2001, 58:1086–1097.
73. Zhulidov PA, Bogdanova EA, Shcheglov AS, Vagner LL, Khaspekov GL,Kozhemyako VB, Matz MV, Meleshkevitch E, Moroz LL, Lukyanov SA, ShaginDA: Simple cDNA normalization using kamchatka crab duplex-specificnuclease. Nucleic Acids Res 2004, 32(3):e37.
74. Shagin DA, Rebrikov DV, Kozhemyako VB, Altshuler IM, Shcheglov AS,Zhulidov PA, Bogdanova EA, Staroverov DB, Rasskazov VA, Lukyanov S: Anovel method for SNP detection using a new duplex-specific nucleasefrom crab hepatopancreas. Genome Res 2002, 12(12):1935–1942.
75. Sequence Read Archive (SRA). http://www.ncbi.nlm.nih.gov/sra.76. NCBI. http://www.ncbi.nlm.nih.gov/.77. Conesa A, Götz S, García-Gómez JM, Terol J, Talón M, Robles M: Blast2GO: a
universal tool for annotation, visualization and analysis in functionalgenomics research. Bioinformatics 2005, 21(18):3674–3676.
78. Ensemble Genome Browser. http://www.ensembl.org/index.html.79. Unigene. http://www.ncbi.nlm.nih.gov/unigene.80. Ferraresso S, Milan M, Pellizzari C, Vitulo N, Reinhardt R, Canario AV,
Patarnello T, Bargelloni L: Development of an oligo DNA microarray forthe European sea bass and its application to expression profiling of jawdeformity. BMC Genomics 2010, 11:354.
81. R statistical software. http://www.r-project.org.82. Newman AM, Cooper JB: AutoSOME: a clustering method for identifying
gene expression modules without prior knowledge of cluster number.BMC Bioinforma 2010, 11:117.
83. Cytoscape. http://www.cytoscape.org.84. DAVID Bioinformatic Database. http://david.abcc.ncifcrf.gov/.85. Ensembl BIOMART. http://www.ensembl.org/biomart/martview/.86. Thiel T, Michalek W, Varshney RK, Graner A: Exploiting EST databases for
the development and characterization of gene-derived SSR-markers inbarley (Hordeum vulgare L.). Theor Appl Genet 2003, 106(3):411–422.
doi:10.1186/1471-2164-14-315Cite this article as: Ferraresso et al.: Exploring the larval transcriptome ofthe common sole (Solea solea L.). BMC Genomics 2013 14:315.
Submit your next manuscript to BioMed Centraland take full advantage of:
• Convenient online submission
• Thorough peer review
• No space constraints or color figure charges
• Immediate publication on acceptance
• Inclusion in PubMed, CAS, Scopus and Google Scholar
• Research which is freely available for redistribution
Submit your manuscript at www.biomedcentral.com/submit