exploring usability in web-based aviation weather: an
TRANSCRIPT
Exploring Usability in Web-Based Aviation Weather: An Assessment of the Aviation Weather Center Website
by
Benjamin Remy
Bachelor of Science Aeronautical Science
Florida Institute of Technology 2014
A thesis submitted to the College of Aeronautics at
Florida Institute of Technology in partial fulfillment of the
requirements for the degree of
Master of Science in
Aviation Human Factors
Melbourne, Florida May 2017

We, the undersigned committee, hereby approve the attached thesis “Exploring Usability in Web-Based Aviation Weather: An Assessment of the Aviation Weather Center Website” by Benjamin Remy
_________________________________ Deborah Carstens, Ph.D. Graduate Program Chair and Professor College of Aeronautics _________________________________ John Deaton, Ph.D. Human Factors Program Chair and Professor College of Aeronautics _________________________________ Heidi Hatfield Edwards, Ph.D. Associate Head and Professor School of Arts and Communication _________________________________ Korhan Oyman, Ph.D. Dean and Professor College of Aeronautics

Abstract
iii
Title: Exploring Usability in Web-Based Aviation Weather: An Assessment of the
Aviation Weather Center Website.
Author: Benjamin Remy
Major Advisor: Deborah Carstens, Ph.D.
To provide a starting point for usability research in the area of online aviation
weather, we performed a two-part usability study of the popular Aviation Weather
Center website for general aviation users. The first part of the study utilized the
System Usability Scale to examine different types of weather information as used by
a general aviation pilot on a VFR cross-country flight and compare the usability of
the information to an existing benchmark. No scores were significantly less than the
benchmark, but the ordering of weather information by usability score provided
valuable insight into the relationship between usability and pilot weather product
preference. The second part of the study involved a concurrent think-aloud task, in
which pilots were asked to verbalize their thoughts as they completed a weather
briefing on the site. With audio of participants verbalizations and screen captures
during this task, we discovered a number of specific usability issues in both the
weather information displayed on the site and the site itself. Many had a broad
impact, especially for novice users. These issues were used to form suggestions for
aviation weather providers and to form recommendations for future research.
Table of Contents
iv
List of Figures ........................................................................................................... v
List of Tables .......................................................................................................... vi
Acronyms and Abbreviations .............................................................................. vii
Acknowledgments ................................................................................................ viii
Chapter 1: Introduction .......................................................................................... 1
Problem Statement ................................................................................................. 1 Purpose Statement .................................................................................................. 2 Operationally Defining Usability ........................................................................... 2 Research Questions (RQs) and Hypotheses.......................................................... 2 Assumptions and Limitations ................................................................................ 3 Significance of the Study ........................................................................................ 4
Chapter 2: Review of Literature ............................................................................. 6 Aviation Weather Information .............................................................................. 6 Usability ................................................................................................................. 11
Chapter 3: Methodology ........................................................................................ 19
Research Design .................................................................................................... 19 Instrument and Procedure ................................................................................... 21 Participants ........................................................................................................... 27 Summary ............................................................................................................... 29
Chapter 4: Results .................................................................................................. 30 Quantitative Results ............................................................................................. 31 Qualitative Results ................................................................................................ 34
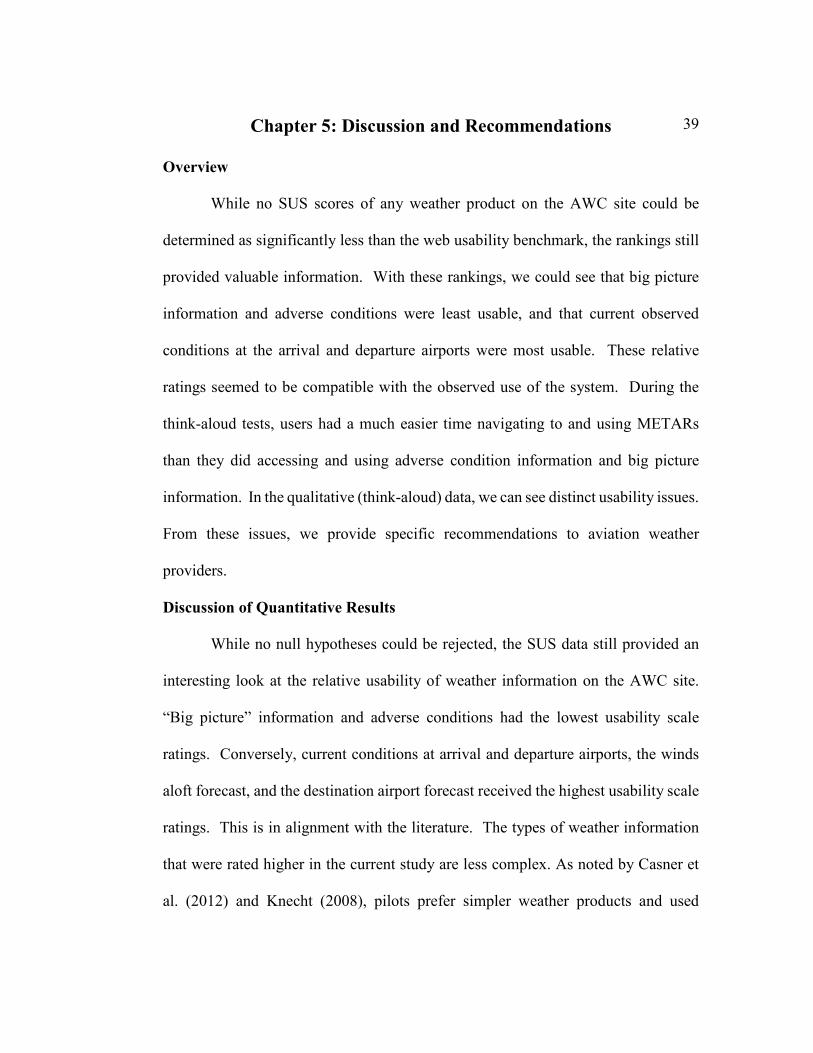
Chapter 5: Discussion and Recommendations .................................................... 39
Discussion of Quantitative Results ...................................................................... 39 Discussion of Qualitative Results ........................................................................ 44 Recommendations for Aviation Weather Providers .......................................... 54 Recommendations for Future Study ................................................................... 55 Summary and Conclusion .................................................................................... 56
References ............................................................................................................... 58

List of Figures
v
Figure 1. Aviation Weather Center homepage ......................................................... 22 Figure 2. Getting METAR data on the AWC site .................................................... 45 Figure 3. AWC Local Forecast Search Box ............................................................. 46

List of Tables
vi
Table 1. Adapted System Usability Scale Questionnaire Items ............................... 25 Table 2. Weather Information SUS Scores Ordered by Mean Rating ..................... 32 Table 3. Results Shapiro-Wilks Test for Normality ................................................ 33 Table 4. Phase One t-test Results ............................................................................. 34 Table 5. Weather Information and Usability Attribute Code Co-Occurrence ......... 36 Table 6. Weather Products and Usability Attribute Code Co-Occurrence .............. 37 Table 7. Adverse Conditions (Usability Issues) ....................................................... 41 Table 8. Big Picture Information (Usability Issues). ............................................... 47 Table 9. Current Conditions at Arrival and Departure Airports (Usability Issues) .............................................................................................. 47 Table 10. Current Enroute Conditions (Usability Issues). ....................................... 48 Table 11. Enroute Forecast (Usability Issues) ......................................................... 49 Table 12. Destination Forecast (Usability Issues).................................................... 50 Table 13. Winds and Temperatures Aloft Forecast (Usability Issues) .................... 50 Table 14. Site-Related Usability Issues ................................................................... 51 Table 15. SUS Questionnaire Item Scores and Weather Information Type ............ 52

Acronyms and Abbreviations
vii
ATC Air Traffic Control
AWC Aviation Weather Center
CFR Code of Federal Regulations
FAA Federal Aviation Administration
GA General Aviation
ICAO International Civil Aviation Organization
IFR Instrument Flight Rules
NOAA National Oceanic and Atmospheric Administration
NWS National Weather Service
SUS System Usability Scale
VFR Visual Flight Rules
Acknowledgments
viii
Without the support of so many people, not limited to those named here, this
research would not have been possible. Dr. Debbie Carstens offered tireless support
and guidance not only as my committee chair but throughout my graduate education
at Florida Tech. Dr. John Deaton and Dr. Heidi Hatfield Edwards gave valuable
feedback and support as committee members. The College of Aeronautics and FIT
Aviation staff were tremendously helpful and accommodating in their support of my
data collection.
There are a few more people I want to personally acknowledge for their
support of this work. My parents, Martin and Christine, have always encouraged me
to chase my dreams and it is because of them I can be where I am today. My sister,
Erika, is an incredible person and inspires me to work harder. My partner, Tara, has
been supremely understanding through this process and kept me focused on my
goals.

Chapter 1: Introduction
1
Aviation weather information is critically important to safety of flight. In
addition to the obvious aeronautical dangers of weather, namely thunderstorms, low
visibility, and ice, even seemingly minor factors including temperature and humidity
can impact safety (FAA, 2016b). While many sources of weather information are
available to general aviation (GA) pilots, the internet is the most popular way to get
up to speed on the weather. Ninety-one percent of GA pilots surveyed by Casner et
al. (2012) “usually” or “always” accessed aviation weather products online. As
such, designing online aviation weather products to be useful and easy to use is an
important undertaking. Usability is the system attribute that describes the ease of
use. Usability is a conglomerate of interface characteristics, each with a particular
importance in the actual use of the system.
This study aimed to contribute to the literature with an investigation into the
usability of a popular government aviation weather website. Participants rated the
usability of different types of aviation weather products on the site with an adapted
version of the System Usability Scale (Brooke, 1996). As a follow up qualitative
investigation, the think-aloud method of usability evaluation was used to investigate
the process of obtaining weather on the site and discover specific usability issues to
address.
Problem Statement
Since aviation weather is of such critical importance in aviation safety, the
usability of aviation weather products needs to be investigated and improved,

2
especially as sources of aviation weather become more accessible. Some research
has examined the use of online aviation weather, but a gap in the literature exists in
the area of aviation weather usability. Beginning to fill this gap may improve the
quality of aviation weather, making it easier for pilots to use and understand weather
information.
Purpose Statement
This study examined the usability of a popular aviation weather website to
determine the kinds of usability issues associated with the site and with the aviation
weather products on the site. The study also compared the usability of each type of
weather information on the site to a pre-defined web usability benchmark. This study
aimed to provide recommendations to improve the usability of the weather website
and the weather products themselves. Additionally, this study aimed to provide
recommendations for future research in the area of aviation weather usability.
Operationally Defining Usability
For the purposes of this research, the usability construct is operationally
defined as the ease of use of the aviation weather website and the weather products
within the site. More specifically, usability was defined as the rating given by a
participant on the System Usability Scale as a conglomerated measure of each
attribute of the interface that contributes to usability.
Research Questions (RQs) and Hypotheses
This study aimed to answer three research questions:

3
RQ1: How does the usability of weather information on the Aviation
Weather Center (AWC) website compare to an established web
usability benchmark?
RQ2: What usability problems exist with the AWC website?
RQ3: What usability problems exist with weather products on the AWC
website?
Only one research question needed to be answered quantitatively and thus only one
set of hypotheses was formed. These hypotheses were tested for each type of weather
information.
Null Hypothesis
H0: The usability of the aviation weather information on the AWC
website is greater than or equal to the web usability benchmark set by
Sauro (2011).
Alternative Hypothesis
HA: The usability of the aviation weather information on the AWC
website is significantly less than the web usability benchmark set by
Sauro (2011).
Assumptions and Limitations
Some assumptions were made in this study. First, the one-sample t-test be used in
comparing usability scores to the benchmark requires the assumption that the data
are normally distributed, though it is fairly robust to violations of this assumption.

4
System Usability Scale scores have been shown in prior studies to be normally
distributed (Sauro, 2011), the normality of the acquired data was tested for normality
with Shapiro-Wilks tests before performing the t-tests. Additional assumptions were
made about the think-aloud protocol used in the qualitative portion of the study. In
using this method, we assumed the user’s words accurately represent their cognitive
process, and that thinking-aloud does not interfere with their use of the system.
This study was limited in some areas First, test users will participate in
person, and the total sample size estimated (38) is large for a single researcher to
obtain, process, and fairly compensate. 28 participants were recruited to participate
in this study. Another limitation is the use of the AWC website. The live version of
the website will be used for the study. Therefore, users will be able to see dynamic
weather conditions, but this also means that weather conditions may not vary enough
between users to uncover hidden usability issues. This also means that usability
scores may vary depending on the type of real-world weather seen by the test users.
Significance of the Study
As described by the FAA (2009) in risk management training materials,
weather is often related to operational pitfalls and is the largest cause of aviation
fatalities. 14 C.F.R. §91.103 requires pilots to “before a flight, become familiar with
all available information concerning that flight” to include weather reports and
forecasts, “for a flight under IFR or a flight not in the vicinity of an airport.” Despite
this regulation and despite the possibility of danger, some pilots choose not to obtain
5
weather information before flying. More than 50% of pilots involved in weather
related accidents did not obtain a weather briefing prior to their accident flight
(Federal Aviation Administration, 2009). There is no way to know whether the pilots
in these accidents acquired weather from other sources. If they did, they may have
acquired information online or from another unverifiable source.
By many definitions, including that of the International Organization for
Standardization, usability is a measure of software quality. International Standard
ISO 9126-1 (2000) defines usability as, “The capability of the software product to be
understood, learned, used and attractive to the user, when used under specified
conditions.” There is a gap in the literature between usability and aviation weather.
To begin understanding the effects of aviation weather product usability on aviation
safety, we propose an assessment of the popular Aviation Weather Center website.
The site contains government-produced weather products that form the basis of many
other sources of aviation weather information. While the results of this research may
not be generalizable due to the fact that only one aviation weather source was studied,
we aim to offer a perspective on aviation weather usability that can be carried
forward into future research of aviation weather usability with a broader scope.

Chapter 2: Review of Literature
6
Introduction
In discussing aviation weather products, it is important to first understand the
term general aviation, and how it differs from other types of aviation. General
aviation encompasses all civil aviation activities outside of scheduled or unscheduled
air transportation for payment, hire, or commercial space transportation (Federal
Aiviaton Administration [FAA], 2016). This includes non-commercial business
flying, recreational flying, flight instruction, and aerial work. Aerial work includes
flying such as agricultural spraying, aerial photography, and aerial advertising
(International Civil Aviation Organization [ICAO], 2009). The FAA (2015)
estimated 204,408 active general aviation pilots flew 23,271,185 hours in the United
States in 2014. General aviation airplanes typically fly at lower altitudes and are less
technologically advanced than air carrier aircraft, leaving them more vulnerable to
the hazards of weather. Weather has a tremendous influence on all types of aviation,
and especially general aviation. Weather-related accidents are consistently the most
fatal type of general aviation aircraft accident (Kenny, 2016). Mitigating the hazards
of weather is crucial to safety.
Aviation Weather Information
To obtain an effective weather briefing, the FAA recommends developing
first a “total awareness of the overall big picture” through monitoring of weather
patterns several days before the flight and finally acquiring a standard weather
briefing as the time of the flight approaches and an updated weather briefing

7
immediately before flight. Pre-flight weather briefings can be obtained online
through approved portals or over the phone with a National Weather Service (NWS)
certified weather briefer (NWS & FAA, 2010). Weather information is also available
directly through other sources (FAA, 2016a). In-flight, weather information can be
obtained through radio communication or though data-link if the pilot has that
equipment available.
Sources of aviation weather. Three types of aviation weather products are
available to pilots: observations, analysis, and forecasts (FAA, 2016a). To become
familiar with all available information concerning a flight, the FAA (2016b) suggests
pilots obtain a weather briefing from an approved source. A standard weather
briefing, from certified weather briefers or certified online portals, includes the
following items:
• Adverse conditions, which include thunderstorms, turbulence, and icing
along the route of flight.
• Advisory that VFR flight is not recommended if weather conditions for a
flight are below VFR weather minimums.
• Synopsis of “big picture” weather information, including fronts and major
weather systems along the route of flight.
• Current observed conditions at the departure and arrival airports, and
along the route of flight.
• Enroute forecast.
8
• Destination forecast for the estimated time of arrival.
• Winds and temperatures aloft forecast.
• Notice to Airmen (NOTAM) information which includes information
about hazards such as runway closures and inoperative navigational aids.
• Air traffic control (ATC) delays.
• Other information, including in-flight radio flight service frequencies and
any additional information requested by the pilot.
In addition to a standard briefing, pilots can receive an abbreviated briefing,
which is meant to supplement a standard briefing received earlier, or an outlook
briefing from these sources (NWS & FAA, 2010).
Prinzo, Hendrix, and Hendrix (2007) studied 306 general aviation
pilot telephone conversations with weather briefers for content and context. In that
study, 78% of pilots who called flight service requested a weather briefing, most
requesting a standard weather briefing. Furthermore, 15% of pilots declined weather
briefings (17% in good weather conditions, 5% in typical weather conditions, and
21% in bad weather conditions). When the pilot declined a weather briefing, the
weather briefer still provided the pilot with weather conditions significant to their
flight. Of the 22 pilots who received “VFR not recommended” advisories, 27% did
not cancel or delay their flight plan.
Pilots can also obtain weather information directly, outside of a weather
briefing, from a number of websites and mobile applications. The Aviation Weather

9
Center is a popular government website (aviationweather.gov) offering direct access
to National Oceanic and Atmospheric Administration (NOAA) and NWS aviation
weather products (Aviation Weather Center, 2016). In interviews conducted in 2005,
a sample of general aviation pilots reported using a flight service briefing on 61.5%
of flights and the Aviation Digital Data Service (ADDS, the former designation of
aviationweather.gov) on 49.8% of flights (Knecht, 2008). This proportion has
certainly changed in favor of the internet in the decade since the research was
conducted. This can be seen in later data collected by Casner, Murphy, Neville, and
Neville (2012) where 91% of pilots surveyed usually or always accessed weather
products directly.
Between 2002 and 2013, the FAA required operators to use online aviation
weather providers that were approved as Qualified Internet Communications
Providers (QICPs), though this was later canceled (Albersheim, 2013). While
operators are no longer required to use approved third-party providers, the FAA
cautions pilots to verify the source of weather providers’ information and to be
cautious when using unfamiliar sources. The Aeronautical Information Manual
states, “when in doubt, consult with a FAA Flight Service Station Specialist” (para.
7-1-3). Pilots should also be aware that some government weather research
organizations create experimental weather products that should not be used for flight
planning (FAA, 2016a).

10
Self-briefing. A study of general aviation pilots’ weather briefing habits
found 25% of pilots surveyed rarely or never speak to a weather briefer (Casner et
al., 2012). The results of that study indicated 91% of surveyed pilots “usually” or
“always” accessed weather products directly, whether or not they called a weather
briefer. Self-briefing pilots (pilots who rarely or never spoke to a weather briefer)
tended to have higher levels of pilot certification, more flight experience, and were
also more likely to use cockpit weather systems in-flight. Self-briefing pilots in that
study did not differ in the primary purpose of their flying whether local flying or
cross-country flying, or business flying or training flying, but fewer self-briefing
pilots engaged in “fun” flying than pilots who did not self-brief.
Pilots who access weather products directly can choose which products they
use to get the weather information they need. Both Casner et al. (2012) and Knecht
(2008) found that pilots tended to prefer simple weather products (e.g. local
observations and forecasts) to more complex materials. As Knecht (2008) states,
“there seems to be a strong, counter tendency to value and use that which is simplest,
even if simplicity comes at the cost of greater risk.” In Knecht (2008) and in Casner
et al. (2012), self-briefing pilots in particular tended to use weather products that
describe specific weather observations or forecasts and do not extensively study
weather products that provide a larger view of weather systems.

11
Usability
Usability is an important attribute of aviation weather products, especially for
pilots who directly access weather products online. Nielsen (1993) defines usability
as an attribute associated with five primary characteristics of an interface:
learnability, efficiency, memorability, error rate, and satisfaction. Learnability
describes the ease of learning for a novice user to become proficient and efficient.
Efficiency is the user’s performance once they have become proficient in the system.
Memorability refers to the user’s ability to regain proficiency after not using the
system for some time. Error rate when using a system should be low, and errors that
do occur should be easily recoverable. Satisfaction is the user’s opinion of their
experience using the system. In other words, in addition to the emotions and
enjoyment the user felt from the system, satisfaction is the user’s subjective
assessment of the other four usability attributes. Satisfaction is extremely important.
If the user does not feel the system will help them accomplish their tasks, they are
less likely to use it (Ferre, Juristo, Windl, & Constantine, 2001).
International Standard ISO 9126-1 (2000) also discusses usability as an
attribute of software quality, defining usability as, “The capability of the software
product to be understood, learned, used and attractive to the user, when used under
specified conditions.” These characteristics (understandability, learnability,
operability, and attractiveness) complement Nielsen’s definition. Reliability (which
includes recoverability from errors) and efficiency exist as separate classifications
12
under these software functionality standards, but they are noted in the standard as
affecting usability.
Another characteristic that influences usability is the utility, or functionality
of a system. Lecerof and Paterno (1998) argue that if a system cannot perform the
functions a user needs from it, they will not feel the system is usable. Though the
usability and utility of a system are related, the difference between the terms is
important to note. Both usability and utility can be categorized under “usefulness,”
which describes the ability of the system to be used to achieve a goal (Nielsen, 1993).
Usefulness is an attribute of system acceptability. Usability describes the ease-of-
use of a system or interface, while utility describes the functionality. Usability
complements utility, and vice-versa, but they are distinct categories of usefulness.
An interface can be easy to use but function-poor, or function rich and unusable
(Grudin, 1992).
The attributes that contribute to usability of a system are interrelated. For
example, learnability and efficiency (operability in ISO 9126-1) are inversely related.
(Ferre et al., 2001; Nielsen, 1993). An interface designed for novice users may be
easy to learn but could be less efficient than a system designed for expert users. A
system for expert users may be harder to learn initially but more efficient once the
user is proficient. There may also be a tradeoff between efficiency and error rate,
where a system is designed to have as few errors as possible may be inherently
inefficient (Nielsen, 1993). Therefore, designers should not target the highest

13
possible values in all categories. Instead, appropriate targets should be set for each
attribute depending on the goal of the system. Optimal usability is achieved when
the targets for each attribute are met (Ferre et al., 2001).
Website Usability. Website usability is a common area of study, though
much of the literature relates to the improvements of websites for commerce (e.g.
Lee & Kozar, 2012; Tung, Xu, & Tan, 2009). Palmer (2002) proposed four
characteristics of website usability: download delay, navigability, interactivity, and
responsiveness. Improving these metrics was shown to improve “success,” as
measured by user satisfaction, frequency of use, and likelihood of return. In terms
of the components of Nielsen’s definition of usability, download delay is related to
efficiency and satisfaction, navigability is related to learnability, interactivity is
related to efficiency and satisfaction, and responsiveness (the presence of feedback)
is also related to efficiency and satisfaction, as well as memorability. To incorporate
Palmer’s (2002) metric into a definition of website usability is not to say that
Nielsen’s (1993) definition does not apply. Each characteristic is important in the
interface.
A goal of an aviation weather website might be to support weather
information retention. Part of the understanding of an aviation weather website’s
usability is the site itself, but equally, if not more, important are the weather products
displayed on the site. O’Hare and Waite (2012) studied the effectiveness of graphic
displays of weather information, comparing information recall when using coded

14
information, plain English information, graphic information, and dual-mode plain
English and graphic information. Participants recalled the most items correctly
when using the dual mode display, though the graphic information by itself was not
associated with improved recall. Pilot experience was also examined in that study.
Experienced pilots could recall information much better using the coded text format
than other formats, perhaps because of their familiarity with it. Notably, experienced
and highly certificated pilots had higher information recall overall.
Usability testing. Many methods exist to evaluate the usability of an
interface. Nielsen (1993) proposes that testing with “real users” is “the most
fundamental usability method and is in some sense irreplaceable, since it provides
direct information about how people use computers and what their exact problems
are with the concrete interface being tested” (p. 165). Many methods exist for testing
or assessing usability with actual users, including think-aloud testing (which will be
discussed in the following section of this chapter), performance measurement,
observation, interviewing, and interaction logging. Often, usability testing is
designed to measure a quantifiable usability metric to judge performance against a
goal, but many qualitative methods are also used to provide supplemental
information.
Nielsen (1993) discusses two concerns with usability testing: reliability and
validity. Due to differences between users, quantitative usability testing data may be
highly variable. This means that when making design decisions from usability data,

15
it may be a case of choosing the least unreliable results. Increasing the number of
users may decrease the width of the confidence interval, increasing reliability.
Validity is also important in usability testing, though is improved in a methodological
sense rather than statistical. To achieve high validity, Nielsen (1993) suggests testing
with users who reasonably represent the actual user population. Users can be
categorized by their knowledge of the domain, their experience with the system or a
similar system, and by their general experience with computers. Testing with the
actual users of a system, if possible, is the best option. Choosing a task for the
usability test is also important to achieve high validity. The task should be
representative of a task users would complete with the system. The task should also
be designed to cover important aspects of the system. Tasks can be designed with a
task analysis based on the intended uses of the system (Nielsen, 1993).
Observational testing and logging use. Observing users’ interactions with a
system and logging their actual use of the system through input tracking can provide
valuable information to the researcher. With these methods, the researcher may
observe previously unknown ways the user could interact with the system (Nielsen,
1993). Logging can provide quantitative use metrics such as error rate and
quantitative data about users’ interactions with an interface. Knecht (2011) logged
aviation weather website users’ page views and page view durations. From the total
page view durations, the author calculated the total time for a weather briefing. The
16
author also calculated a “dwell index” by multiplying the page views by view
duration.
Think-aloud. A think-aloud test asks a user to think-aloud while completing
a task (Nielsen, 1993; van Someren, Barnard, Sandberg, & Solomon, 1994). In the
context of usability, the user completes a task on the interface being studied.
(Jørgensen, 1990; Lewis & Mack, 1981). This usability testing method allows the
researcher to understand how the user interacts with the system and what
misconceptions they may have (Nielsen, 1993). Compared with retrospective
usability methods, think-aloud tests can reveal ongoing cognitive processes, before
the user loses information from short term memory (Ericsson & Simon, 1993).
Boren and Ramey (2000) described the application of theory from Ericsson
and Simon’s (1993) influential work on verbal reporting (thinking-aloud) to usability
testing practice. Boren and Ramey (2000) contend three main principles from
Ericsson and Simon (1993) are applicable to usability testing. First, only “hard” data
should be collected, meaning users guesses about the reasons for usability issues
should not be collected. Collecting this information may mislead the researcher and
distract from the real cause of a usability problem. Second, the participant should be
given detailed instructions about thinking-aloud. The participant should be asked to
speak as if they are alone in the room, and, third, should be reminded to think-aloud
if they have not spoken for a predetermined time. Ericsson and Simon recommend

17
saying, “Keep talking.” Finally, when possible, avoid intervening. Even unbiased
questions redirect attention from the task and from verbalization.
The think-aloud method is fairly incompatible with qualitative measurements
of user performance (Nielsen, 1993). Additionally, users involved in the test may
develop their own ideas about the cause of usability problems, which may in turn
influence the researchers’ ideas. To counteract this, as mentioned earlier in this
section, observers should note the actions at the time of an error to more objectively
determine the cause and avoid collecting user opinion (Ericsson & Simon, 1993;
Nielsen, 1993).
Sample size. Nielsen (1994) recommended the use of four subjects, plus or
minus one, for cost-effective think-aloud testing. He proposed it is possible to find
75 percent of usability issues with four to five think-aloud test subjects. In the
context of usability testing for iterative design, he postulates using more than six or
seven subjects is not worth the effort. In the same context, he proposed the goal of
finding 75 percent of usability issues is reasonable for three reasons; it would be very
expensive to find all the problems that exist, the next iteration of the design is likely
to introduce new usability problems, and that the most important problems will be
discovered first.
The number of participants required for think aloud test, however, is the
subject of some debate. Hwang and Salvendy (2010), disagree with Nielsen’s (1994)

18
estimates. They performed a meta-analysis of usability studies and found that
achieving an 80% discovery rate in requires 10 users, plus or minus two.
Think-aloud tasks. Van Someren et al. (1994) offer guidance about selecting
tasks for a think-aloud activity, proposing two important considerations. First, the
tasks for the activity should be at an appropriate level for the cognitive process. In
other words, the task should not be too easy and should be a task that is completed
quickly and non-verbally. While the task must be difficult enough, it should not be
too unusual or atypical. To choose an atypical task means the findings from the
activity may be somewhat irrelevant to the typical use of the system. To assess this
consideration, participants can be asked post-test if the task was unusual.
Chapter 3: Methodology
19
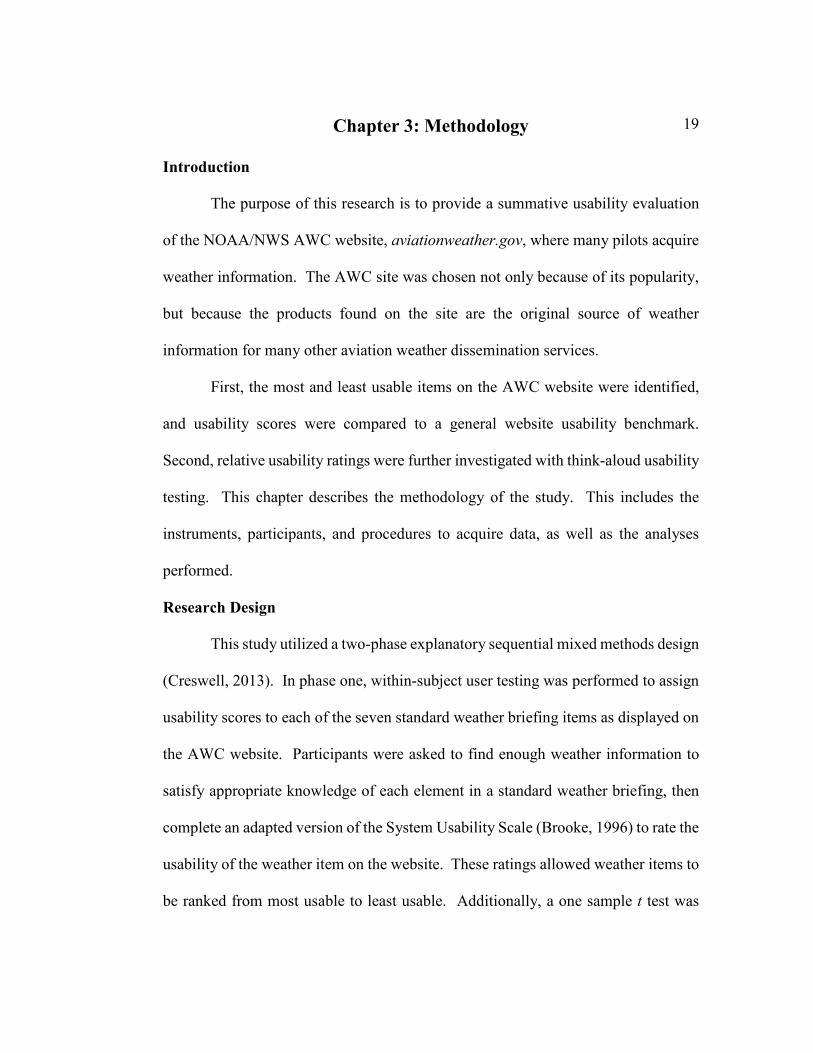
Introduction
The purpose of this research is to provide a summative usability evaluation
of the NOAA/NWS AWC website, aviationweather.gov, where many pilots acquire
weather information. The AWC site was chosen not only because of its popularity,
but because the products found on the site are the original source of weather
information for many other aviation weather dissemination services.
First, the most and least usable items on the AWC website were identified,
and usability scores were compared to a general website usability benchmark.
Second, relative usability ratings were further investigated with think-aloud usability
testing. This chapter describes the methodology of the study. This includes the
instruments, participants, and procedures to acquire data, as well as the analyses
performed.
Research Design
This study utilized a two-phase explanatory sequential mixed methods design
(Creswell, 2013). In phase one, within-subject user testing was performed to assign
usability scores to each of the seven standard weather briefing items as displayed on
the AWC website. Participants were asked to find enough weather information to
satisfy appropriate knowledge of each element in a standard weather briefing, then
complete an adapted version of the System Usability Scale (Brooke, 1996) to rate the
usability of the weather item on the website. These ratings allowed weather items to
be ranked from most usable to least usable. Additionally, a one sample t test was

20
utilized to determine if scores are significantly less than an existing website usability
benchmark. Phase two attempts to explain these usability ratings with qualitative
think-aloud testing data to better understand the process of accessing and interpreting
the weather products on the AWC website.
Pilot testing was conducted prior to each phase of the study to gather feedback
on instructions that may not be clear and uncover formatting/typographical issues as
well as technological data collection issues that needed to be fixed prior to
conducting the actual research. Data collected during the pilot testing was not
analyzed for the research.
Quantitative variables. Phase one of the study examined one independent
variable, the weather briefing item accessed, and one dependent variable, the adapted
SUS rating of the weather item. Weather items were ranked by usability rating to
assess the relative usability of each item and compare with one-sample t-tests to a
web usability benchmark.
Qualitative data. Qualitative information about the usability of weather
items was collected during phase two with the concurrent think-aloud user testing
method (Nielsen, 1993; van Someren et al., 1994). The computer screen was
recorded with synced participant audio recording to capture user interaction together
with verbal comments or exclamations. With the aid of thematic analysis ((Braun &
Clarke, 2006), these data were utilized to explain the usability ratings given in phase

21
one, and to identify specific usability issues to provide recommendations for
improving the presentation of weather products and site navigation.
Instrument and Procedure
Participants in both phases were asked to complete tasks on the AWC website
(see Figure 1). To avoid the possibility of limiting the usability problems discovered
to a particular static weather type or type of prevailing weather conditions, users
accessed the dynamic, real-time website. Participants may not have all seen the same
weather information, but this allowed the dynamic nature of weather to present a
variety of opportunities to discover usability issues.

22
Figure 1. Aviation Weather Center homepage (National Oceanic and Atmospheric Association & National Weather Service, 2016).
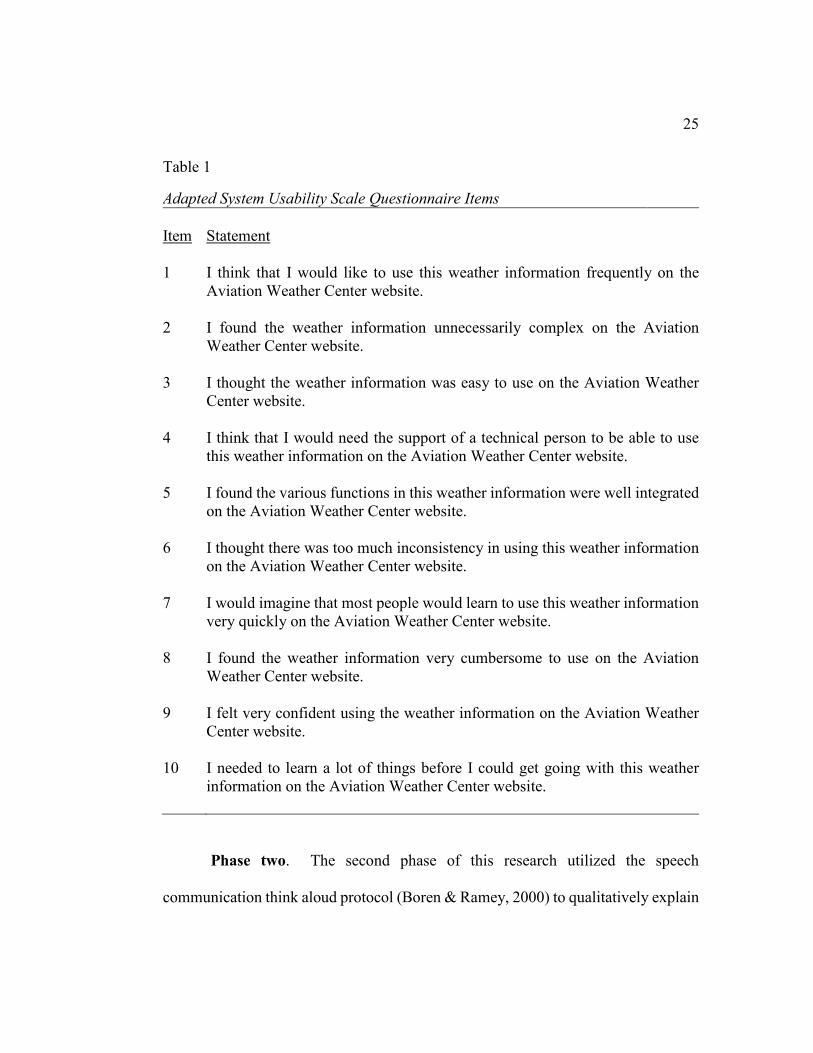
Phase one. Phase one gathered quantitative usability ratings with a modified
version of the System Usability Scale (SUS). The scale included 10 statements to
which the participant responded on scale from one to five as “Strongly Disagree” to
“Strongly Agree.” Table 1 lists the scale statements, which were adapted to this
study by replacing the word “system” with “weather information” and adding the
phrase “on the Aviation Weather Center website.” Modifications to this scale like
these can be safely performed without affecting the scale’s validity or reliability
(Sauro, 2011). To sum each participant’s responses to the scale, each item score
23
ranges from 0 to 4. Items 1, 3, 5, 7, and 9 contribute the score minus 1 to the sum.
Items 2, 4, 6, 8, and 10 contribute 5 minus the score to the sum. The sum of all
contributions is multiplied by 2.5 to obtain a value out of 100 for total system
usability (Brooke, 1996). As a rule of thumb, SUS ratings above 70 are considered
“passable,” with a good product rating falling between ratings in the upper 70s and
lower 80s. Products with scores above 90 are “truly superior” (Bangor, Kortum, &
Miller, 2008). Sauro (2011) calculated a specific SUS benchmark of 67.0 (SD =
13.4) for large-scale public facing websites from 446 prior SUS studies.
Phase one task. The assigned task, or tasks, in a usability study must
represent the real use of the system. In this study, participants were asked to find the
weather information for each of the elements in a standard weather briefing for a
proposed cross country flight. These proposed flights were from one of three airport
pairs, each representing different areas of the continental United States with
distinctly different weather patterns. These pairs were: Melbourne International
Airport (KMLB) to Daytona International Airport (KDAB) in Florida, Centennial
Airport (KAPA) to Pueblo Memorial Airport (KPUB) in Colorado, and Grant County
International Airport (KMWH) to Yakima Air Terminal/McAllister Field (KYKM)
in Washington. The items participants were requested to access were: adverse
conditions including thunderstorms, turbulence, and icing along the route of flight, a
synopsis of “big picture” weather information including fronts and major weather
systems along the route of flight, current observed conditions at the departure and
24
arrival airports, current observed conditions along the route of flight, an enroute
forecast, a destination forecast for the estimated time of arrival, and a winds and
temperatures aloft forecast. After locating and recording each weather element for
the proposed flight, the participant completed the adapted SUS and continued to the
next weather element until all weather elements were completed.
25
Table 1
Adapted System Usability Scale Questionnaire Items Item
Statement
1 I think that I would like to use this weather information frequently on the Aviation Weather Center website.
2 I found the weather information unnecessarily complex on the Aviation Weather Center website.
3 I thought the weather information was easy to use on the Aviation Weather Center website.
4 I think that I would need the support of a technical person to be able to use this weather information on the Aviation Weather Center website.
5 I found the various functions in this weather information were well integrated on the Aviation Weather Center website.
6 I thought there was too much inconsistency in using this weather information on the Aviation Weather Center website.
7 I would imagine that most people would learn to use this weather information very quickly on the Aviation Weather Center website.
8 I found the weather information very cumbersome to use on the Aviation Weather Center website.
9 I felt very confident using the weather information on the Aviation Weather Center website.
10 I needed to learn a lot of things before I could get going with this weather information on the Aviation Weather Center website.
Phase two. The second phase of this research utilized the speech
communication think aloud protocol (Boren & Ramey, 2000) to qualitatively explain

26
the usability ratings given in phase one and reveal ongoing cognitive processes in
participants use of the aviation weather products on the AWC website. In this phase
of the study, participants were asked to think aloud while navigating the AWC
website. Participants were tasked with obtaining the weather information required
by a standard weather briefing for a cross country flight between one of three airport
pairs. The airport pairs used in phase one were also used in this phase. Unlike phase
one, however, there was no interruption to complete the SUS questionnaire between
accessing each weather item. Participants’ remarks were audio recorded and
participants’ on-screen actions were video recorded with a screen capture program.
Usability issues with the weather products and the AWC website were distilled from
the verbal data collected using the screen recording for context.
While the think-aloud method could have been utilized concurrently with
SUS in phase one, the interruptions created by completing the SUS for each weather
item could have influenced user behavior and the cognitive processes measured by
the concurrent think-aloud method. Conversely, thinking aloud also has the potential
to influence user behavior (Nielsen, 1993), which could influence SUS ratings.
Protocol. Per the speech communication think aloud protocol (Boren &
Ramey, 2000), if the participant continued to use the website while not talking, the
researcher prompted the participant to continue verbalizing their thoughts and
actions. In this study we used the prompts “keep talking,” as recommended by
Ericsson and Simon (1993), and the more friendly, “let me know what you are

27
doing,” if the user continued to perform actions in the system without speaking for
15 seconds. Additional prompts were given as necessary to elicit further information
but questions that interfered with or influenced user thoughts and actions were
carefully avoided. For example, if the user is not clicking a button that leads to the
next correct step, they were not asked, “Why are you not clicking the ____ button?”
Because the researcher is in the role of a listener, “acknowledgment tokens,”
including “ok,” “yeah” or “mmhm” (Boren & Ramey, 2000), were also used to
encourage the participant to keep speaking.
Participants
College of Aeronautics students, flight instructors, and professors at Florida
Institute of Technology were recruited to participate in this research. All participants
were required to hold an FAA-issued private pilot certificate or higher or were a
student pilot actively pursuing certification as a private pilot. No restrictions will be
placed on gender or experience (as measured by total flight time), but these data were
collected in a pre-test questionnaire purely for descriptive purposes. All participants
were 18 years of age or older.
A priori power and sample size estimates. We estimated the number of
participants required to detect a practically significant difference between SUS
scores and the benchmark score using the sample size estimation formula for SUS
benchmark comparison (equation 1) from Sauro (2011). The estimate was made at
a significance of 𝛼𝛼 = 0.05, 80% power (𝛽𝛽 = 0.2), and detectable difference of d = 10.

28
Standard deviation for SUS scores was estimated by Sauro (2011) as s = 21. These
inputs to the formula gave an estimated sample size of n = 28.
𝑛𝑛 =�𝑧𝑧𝛼𝛼+ 𝑧𝑧𝛽𝛽�
2𝑠𝑠2
𝑑𝑑2 (1)
This estimate was confirmed with a one sample t-test power calculation in R using
the “pwr” package (Champely, 2016; R Core Team, 2015).
We estimated a smaller number of participants would be required in phase
two than in phase one because of the qualitative nature of the data, as well as the
large amount of data the method produces with relatively few users (Nielsen, 1993).
A goal of 10 participants +/- 2 was set in this phase of the study, following the
recommendation of Hwang and Salvendy (2010), to achieve an 80% discovery rate
of usability issues with the think-aloud method.
Actual participants. Twenty participants took part in phase one. This
sample size is notably smaller than the sample size estimated a priori, which will be
addressed as a limitation in following chapters. Of the phase one participants, 80%
were male and 20% were female. The mean phase one participant age was 27.4 years
(SD = 9.6). The mean total flight time of phase one participants was 674.4 (SD =
1045.3). The phase one sample included two student pilots. All other participants
had achieved at least private pilot level certification. Ten participants had received
an instrument rating, nine had achieved at least a commercial pilot certificate, three
had achieved ATP certification, and eight were flight instructors.

29
Eight participants took part in phase two. Of the phase two participants, 75%
were male and 25% were female. The mean age of phase two participants was 23.1
years (SD = 3.4). All participants had achieved FAA certification at least at the
private pilot level. Five had received an instrument rating. Five had earned a
commercial pilot certificate. Four were certificated flight instructors. Mean flight
time was 348.1 hours (SD = 270).
Summary
This two-phase study produced both qualitative and quantitative usability
data. Students, faculty, and staff at Florida Institute of Technology with varying
levels of pilot certification and experience were recruited to participate. During
phase one, the System Usability Scale (SUS) was utilized to quantitatively determine
the usability of different types of weather information on the Aviation Weather
Center (AWC) website. SUS scores were compared to a known usability benchmark.
Twenty participants took part in phase one. During phase two, the concurrent think-
aloud method was utilized to collect information about usability problems with the
website. Eight participants took part in this qualitative phase of the study.

Chapter 4: Results
30
Introduction
In this chapter, we discuss the findings of both phases of the usability study.
In phase one, the quantitative portion, all but two SUS mean scores were greater than
the benchmark scores, and the scores below the benchmark were not significantly
less than the benchmark. The ordering of scores, however, did provide some
information. In phase two, the qualitative portion, specific usability issues were
found with the weather products on the site and with the site itself. Below are the
research questions and hypotheses tested:
RQ1: How does the usability of weather information on the Aviation
Weather Center (AWC) website compare to an established web
usability benchmark?
RQ2: What usability problems exist with the AWC website?
RQ3: What usability problems exist with weather products on the AWC
website?
Null Hypothesis
H0: The usability of the aviation weather information on the AWC
website is greater than or equal to the web usability benchmark set by
Sauro (2011).

31
Alternative Hypothesis
HA: The usability of the aviation weather information on the AWC
website is significantly less than the web usability benchmark set by
Sauro (2011).
Quantitative Results
Phase one, the quantitative portion of this study, investigated research
question one: “How does the usability of weather products on the Aviation Weather
Center (AWC) website compare to a known web usability benchmark?” System
Usability Scale scores for each type of weather information were first used to order
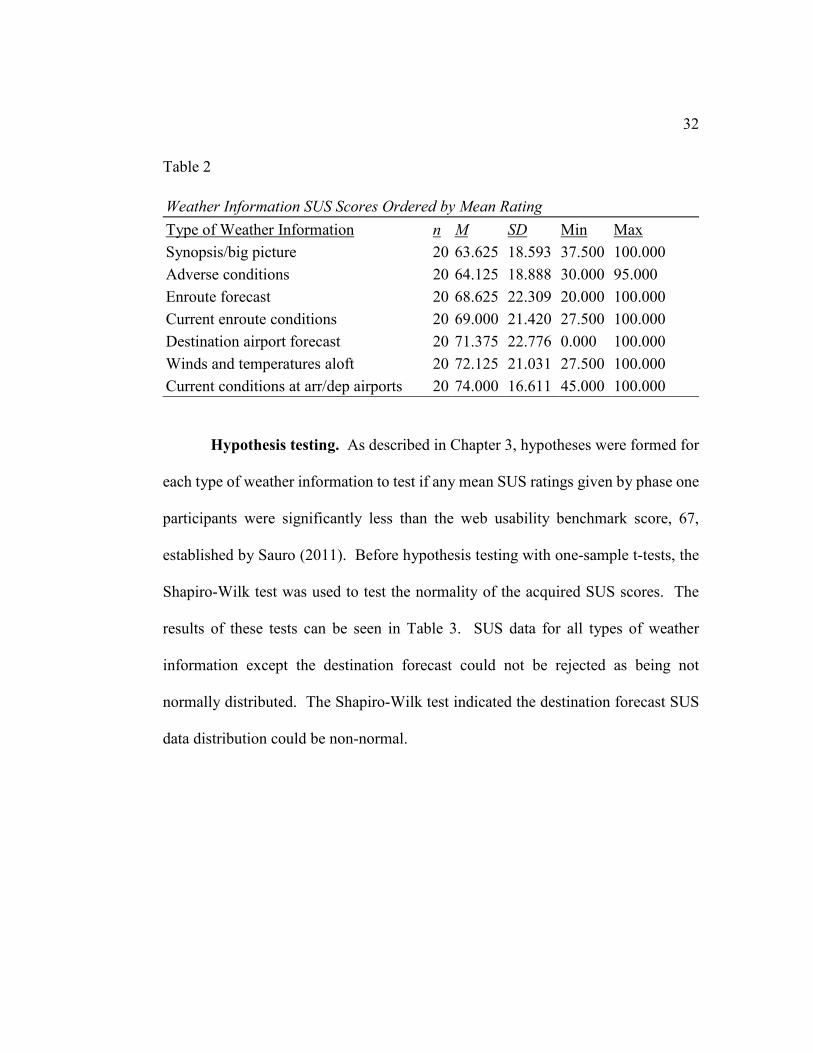
the types of weather information from least usable to most usable (Table 2). Score
means were fairly evenly distributed from a minimum of 63.6 (for synopsis/big
picture information) to a maximum mean of 74 (for current conditions at arrival and
departure airports). Standard deviations were approximately as expected for SUS
data, ranging from 16.6 to 22.8. The ordering of weather information types by mean
SUS scores was used to guide the qualitative analysis performed in phase two.
32
Table 2 Weather Information SUS Scores Ordered by Mean Rating Type of Weather Information n M SD Min Max Synopsis/big picture 20 63.625 18.593 37.500 100.000 Adverse conditions 20 64.125 18.888 30.000 95.000 Enroute forecast 20 68.625 22.309 20.000 100.000 Current enroute conditions 20 69.000 21.420 27.500 100.000 Destination airport forecast 20 71.375 22.776 0.000 100.000 Winds and temperatures aloft 20 72.125 21.031 27.500 100.000 Current conditions at arr/dep airports 20 74.000 16.611 45.000 100.000
Hypothesis testing. As described in Chapter 3, hypotheses were formed for
each type of weather information to test if any mean SUS ratings given by phase one
participants were significantly less than the web usability benchmark score, 67,
established by Sauro (2011). Before hypothesis testing with one-sample t-tests, the
Shapiro-Wilk test was used to test the normality of the acquired SUS scores. The
results of these tests can be seen in Table 3. SUS data for all types of weather
information except the destination forecast could not be rejected as being not
normally distributed. The Shapiro-Wilk test indicated the destination forecast SUS
data distribution could be non-normal.
33
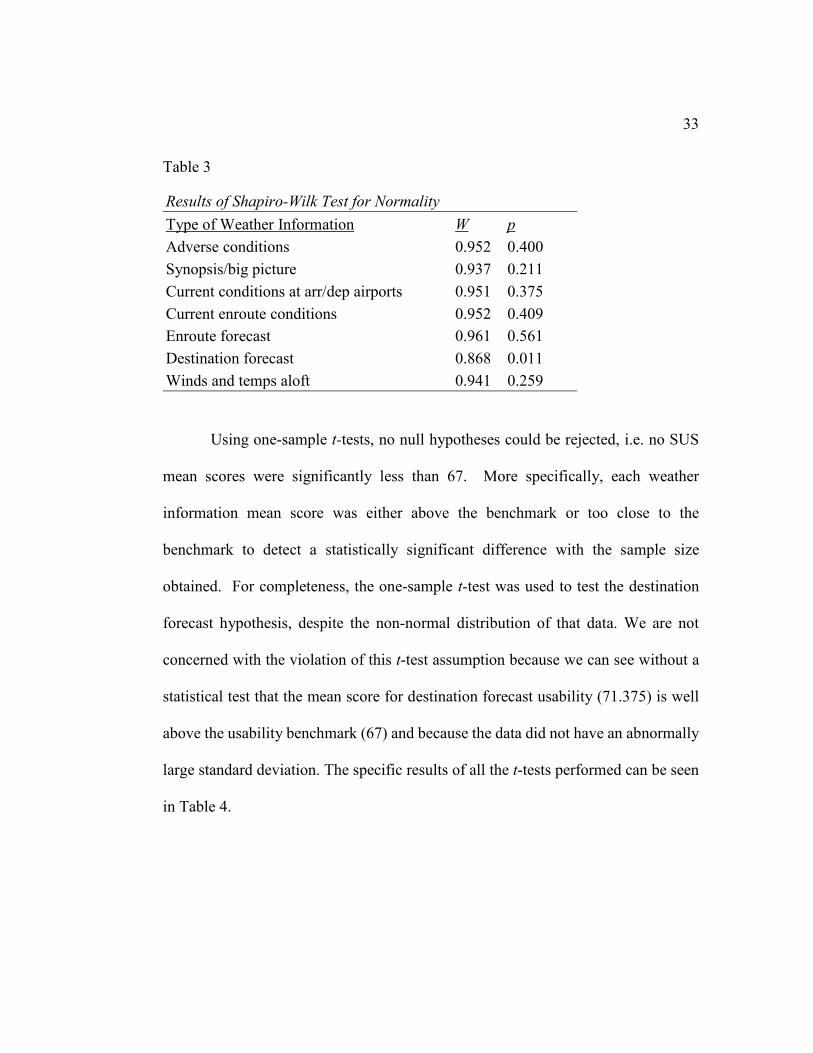
Table 3
Results of Shapiro-Wilk Test for Normality Type of Weather Information W p Adverse conditions 0.952 0.400 Synopsis/big picture 0.937 0.211 Current conditions at arr/dep airports 0.951 0.375 Current enroute conditions 0.952 0.409 Enroute forecast 0.961 0.561 Destination forecast 0.868 0.011 Winds and temps aloft 0.941 0.259
Using one-sample t-tests, no null hypotheses could be rejected, i.e. no SUS
mean scores were significantly less than 67. More specifically, each weather
information mean score was either above the benchmark or too close to the
benchmark to detect a statistically significant difference with the sample size
obtained. For completeness, the one-sample t-test was used to test the destination
forecast hypothesis, despite the non-normal distribution of that data. We are not
concerned with the violation of this t-test assumption because we can see without a
statistical test that the mean score for destination forecast usability (71.375) is well
above the usability benchmark (67) and because the data did not have an abnormally
large standard deviation. The specific results of all the t-tests performed can be seen
in Table 4.

34
Table 4
Phase One t-test Results Type of Weather Information M t df p Adverse conditions 64.125 -0.681 19 0.252 Synopsis/big picture 63.625 -0.812 19 0.213 Current conditions at arr/dep airports 74.000 1.885 19 0.963 Current enroute conditions 69.000 0.418 19 0.660 Enroute forecast 68.625 0.326 19 0.626 Destination forecast 71.375 0.859 19 0.799 Winds and temps aloft 72.125 1.090 19 0.855
Qualitative Results
The think-aloud method was utilized to gather qualitative information about
user perceptions of the site, with a focus on discovering usability issues to answer
research question two, “What usability problems exist with the AWC site?” and
research question three, “What usability problems exist with weather products on the
AWC site?” Analysis of think-aloud data (screen and audio recordings) was
performed with Atlas.ti software, guided by thematic analysis methodology (Braun
& Clarke, 2006). Relevant excerpts of think aloud data were coded by the type of
weather information accessed by the user, then by the specific weather products used
to obtain the type of weather information. SUS questionnaire comments from stage
one were also incorporated into the software’s analysis file (the “Hermeneutic Unit”)
and were also coded by the weather information type and weather product they
referenced. Excerpts were also coded by the type of website element they referenced.
35
All relevant data were then coded by the type of usability problem the user
encountered or mentioned in the excerpt by Nielsen’s (1993) five attributes of
usability: learnability, efficiency, memorability, errors, and satisfaction. Many
excerpts were coded under multiple usability attributes. These usability attribute
codes were handled as themes in the thematic analysis methodology, guiding the
mapping of lower level codes within those themes. In total, 62 excerpts were coded
under the five usability element themes.
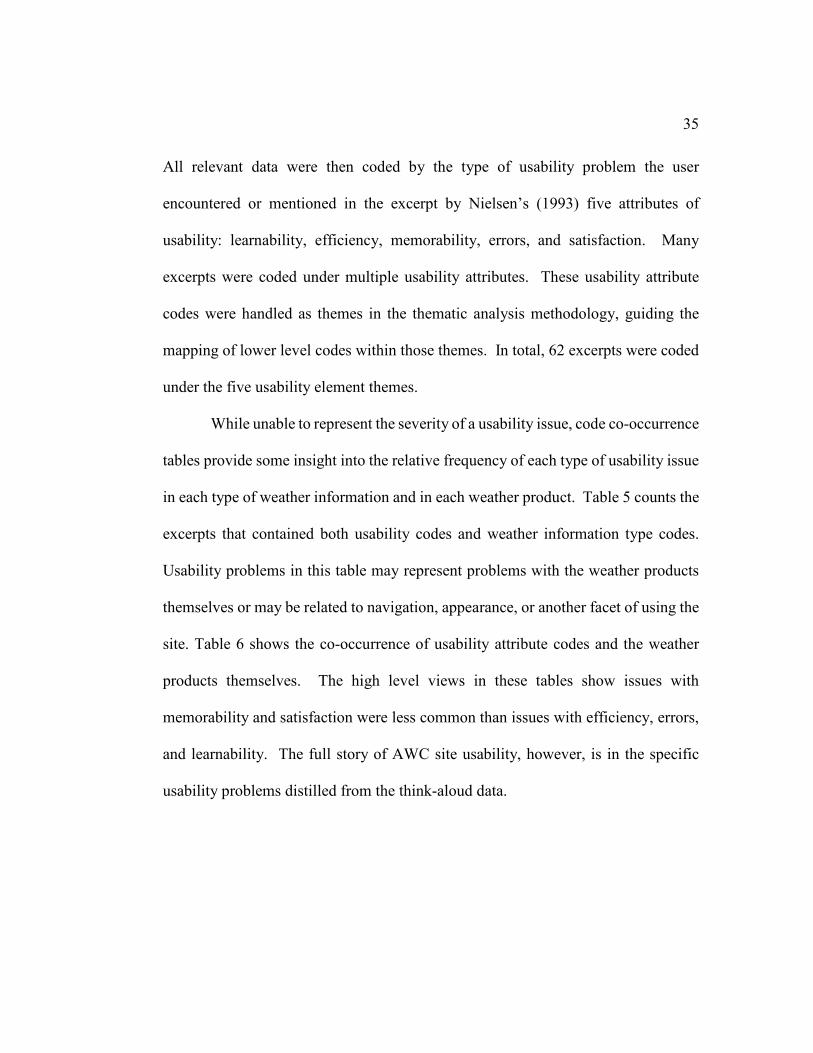
While unable to represent the severity of a usability issue, code co-occurrence
tables provide some insight into the relative frequency of each type of usability issue
in each type of weather information and in each weather product. Table 5 counts the
excerpts that contained both usability codes and weather information type codes.
Usability problems in this table may represent problems with the weather products
themselves or may be related to navigation, appearance, or another facet of using the
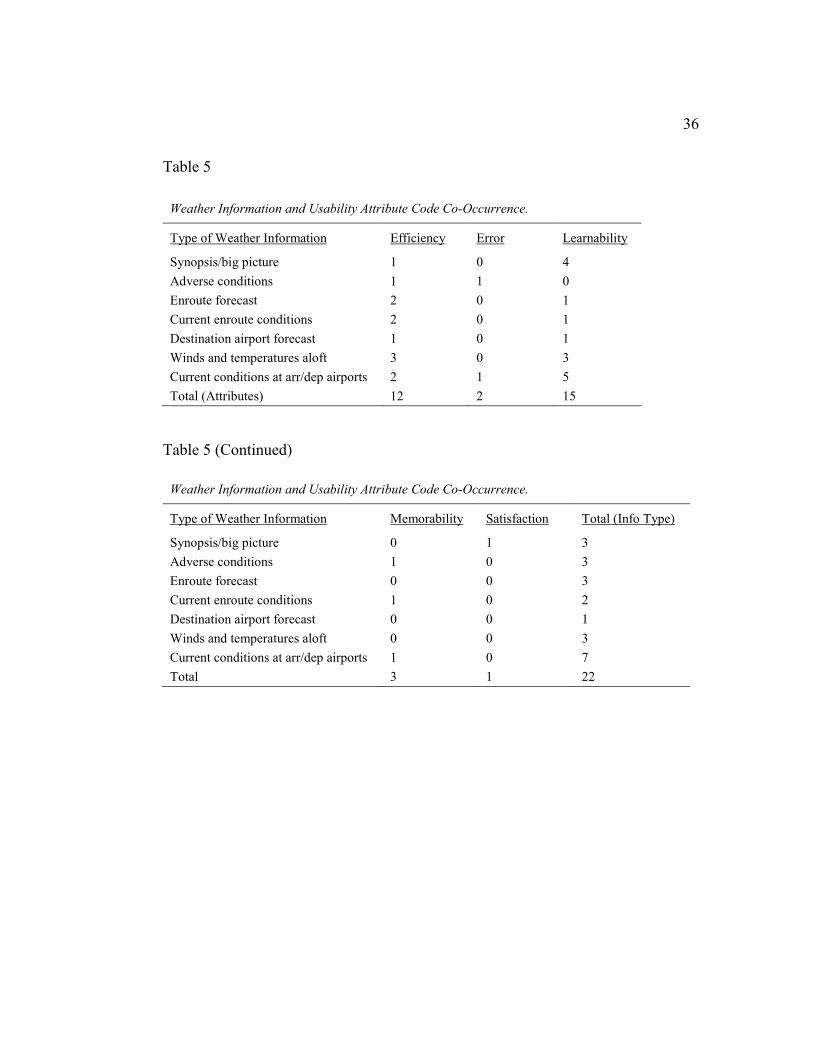
site. Table 6 shows the co-occurrence of usability attribute codes and the weather
products themselves. The high level views in these tables show issues with
memorability and satisfaction were less common than issues with efficiency, errors,
and learnability. The full story of AWC site usability, however, is in the specific
usability problems distilled from the think-aloud data.
36
Table 5
Weather Information and Usability Attribute Code Co-Occurrence.
Type of Weather Information Efficiency Error Learnability
Synopsis/big picture 1 0 4 Adverse conditions 1 1 0 Enroute forecast 2 0 1 Current enroute conditions 2 0 1 Destination airport forecast 1 0 1 Winds and temperatures aloft 3 0 3 Current conditions at arr/dep airports 2 1 5 Total (Attributes) 12 2 15
Table 5 (Continued)
Weather Information and Usability Attribute Code Co-Occurrence.
Type of Weather Information Memorability Satisfaction Total (Info Type)
Synopsis/big picture 0 1 3 Adverse conditions 1 0 3 Enroute forecast 0 0 3 Current enroute conditions 1 0 2 Destination airport forecast 0 0 1 Winds and temperatures aloft 0 0 3 Current conditions at arr/dep airports 1 0 7 Total 3 1 22
37
Table 6
Weather Products and Usability Attribute Code Co-Occurrence.
Product Efficiency Error Learnability Memorability Satisfaction
Area forecast 1 2 1 0 0 METAR 0 4 2 1 0 PIREP 1 0 1 1 0 Prog charts 0 0 0 0 0 Radar 0 0 0 0 1 Satellite 0 0 0 0 0 TAF 1 0 2 0 0 Winds and temps aloft 3 0 3 0 0
Specific usability issues. The specific usability issues from think-aloud data
are the most important results of this qualitative analysis and serve to specifically
answer research questions two and three. The issues encountered by users of the
AWC site are listed in the following chapter in Table 8 through Table 15 by type of
weather information or site element. In that chapter, as seen in those tables, we also
propose solutions or “fixes” for each usability problem, based on user feedback and
usability principles.
Summary
No SUS scores for weather information were found to be significantly less
than the usability benchmark, though there was an ordering of weather information
which could indicate some weather products were less usable than others for various
reasons. The qualitative (think-aloud) results could not be used to provide rankings
to usability, but could describe some of the issues found with each type of weather

38
product and with the website itself. These issues were used to form conclusions and
recommendations, discussed in the following chapter.
Chapter 5: Discussion and Recommendations
39
Overview
While no SUS scores of any weather product on the AWC site could be
determined as significantly less than the web usability benchmark, the rankings still
provided valuable information. With these rankings, we could see that big picture
information and adverse conditions were least usable, and that current observed
conditions at the arrival and departure airports were most usable. These relative
ratings seemed to be compatible with the observed use of the system. During the
think-aloud tests, users had a much easier time navigating to and using METARs
than they did accessing and using adverse condition information and big picture
information. In the qualitative (think-aloud) data, we can see distinct usability issues.
From these issues, we provide specific recommendations to aviation weather
providers.
Discussion of Quantitative Results
While no null hypotheses could be rejected, the SUS data still provided an
interesting look at the relative usability of weather information on the AWC site.
“Big picture” information and adverse conditions had the lowest usability scale
ratings. Conversely, current conditions at arrival and departure airports, the winds
aloft forecast, and the destination airport forecast received the highest usability scale
ratings. This is in alignment with the literature. The types of weather information
that were rated higher in the current study are less complex. As noted by Casner et
al. (2012) and Knecht (2008), pilots prefer simpler weather products and used

40
weather information that describes specific weather observations or forecasts rather
than “big picture” information that provides a wider view. In Casner et al. (2012),
81%, of self-briefing pilots reported they usually or always used TAFs (airport
forecasts), 72% reported usually or always using METARs (airport/station weather
observations), and and 72% reported usually or always using winds aloft forecasts,
respectively. Far fewer self-briefing pilots in that study (47%) used AIRMETs and
SIGMETs, which are adverse weather advisories, and even fewer (33%) used
significant weather prognostic charts.
To gain further insight into the results provided by the SUS data, we can break
the scale apart by question. Although there is no measure of external validity for
single items (Sauro, 2011) and examining a single questionnaire item eliminates
internal validity, viewing mean responses for particular questionnaire items offers
dissected viewpoints of the overall SUS rating.

41
Table 7 shows participant responses to each questionnaire item for each
weather information type. Note that the questions have been abbreviated slightly in
the table, eliminating the phrase “on the Aviation Weather Center Website” for
brevity. We can see in the dissected responses for each questionnaire item that
adverse conditions and big picture information consistently received worse ratings
(note that “worse” in SUS items alternate between negative and positive due to the
design of the scale).
Table 7 SUS Questionnaire Item Scores and Weather Information Type.
I think that I would like to use this weather information frequently.
I found the weather information unnecessarily complex.
I thought the weather information was easy to use.
Adverse conditions 3.8 2.3 3.35 Big picture 3.6 2.3 3.45 Current conditions at dep/arr airports 4.3 2 4.05 Current enroute conditions 3.9 2.25 3.7 En route forecast 3.75 2 3.8 Destination Forecast 4.16 1.95 4.21 Winds and temps aloft 3.95 1.9 3.85

42
Table 7 (Continued) SUS Questionnaire Item Scores and Weather Information Type.
I think that I would need the support of a technical person to be able to use this weather information.
I found the various functions in this weather information were well integrated.
I thought there was too much inconsistency in using this weather information.
Adverse conditions 2 3.35 2.05 Big picture 2.3 3.4 2.05 Current conditions at dep/arr airports 1.8 3.6 1.85 Current enroute conditions 2.1 3.55 2 Enroute forecast 1.95 3.3 2.05 Destination Forecast 1.68 3.53 1.84 Winds and temps aloft 1.65 3.35 1.8
Table 7 (Continued) SUS Questionnaire Item Scores and Weather Information Type.
I would imagine that most people would learn to use this weather information very quickly.
I found the weather information very cumbersome to use.
I felt very confident using the weather information.
Adverse conditions 3.15 2.55 3.75 Big picture 3.2 2.5 3.75 Current conditions at dep/arr airports 3.65 2.1 4.2 Current enroute conditions 3.5 2.35 3.95 Enroute forecast 3.45 2.35 3.95 Destination Forecast 3.68 2.11 4.16 Winds and temps aloft 3.6 2.3 4.1

43
Table 7 (Continued) SUS Questionnaire Item Scores and Weather Information Type.
I needed to learn a lot of things before I could get going with this weather information.
Adverse conditions 2.85 Big picture 2.8 Current conditions at dep/arr airports 2.45 Current enroute conditions 2.3 Enroute forecast 2.45 Destination Forecast 2.11 Winds and temps aloft 2.35
Limitations. The biggest limitation in the quantitative phase of this study
was the number of participants we were able to recruit. While we estimated a priori
that 28 participants would be enough to detect a 10-point difference between the SUS
benchmark and a weather information SUS score, we were only able to recruit 20
participants. Using all the same parameters for the estimate except the sample size,
solving the estimation formula (Equation 1 in Chapter 3) for the detectable difference
gives 12 points with 20 participants and 10 points with 28 participants. It is important
to note this post-hoc power analysis is not to dissect the results of the current study,
but rather to provide perspective for future work. Even 10 points is a large difference
given the small variation in usability scores seen in this study. In other words, 10
points is on the edge of being practically significant. The estimated sample size for
detecting a five-point difference, however, is 110. Depending on the goals of future

44
research and the resources of the researcher, we recommend recruiting a larger
sample so conclusions that are more definitive can be drawn with SUS data.
Discussion of Qualitative Results
Many of the usability issues with the weather products themselves could be
grouped into the following three general usability issues:
• Abbreviations of locations or weather terminology were often difficult
for users to interpret.
• When retrieving weather information that requires knowledge of enroute
airports or weather stations, it is difficult for users unfamiliar with an area
to find which stations are relevant to their route of flight.
• Time conversion was an issue across products that required users to
convert from local time to UTC or vice versa.
The feedback from test users indicates these general issues with weather products are
especially problematic for novice users. Improving usability by novice users is
especially important in this domain because of the law of effect (FAA, 2009b), which
describes how success encourages learning. There is often a tradeoff between
usability (especially learnability) and functionality, but the learnability issues
uncovered in this study are fixable without harming efficiency or functionality.
The issues with the site itself and its navigability are, like the issues with
weather information, most serious for novice users. The site is fairly functional, but
it is difficult to find specific information if a user is unfamiliar with the site or with

45
aviation weather information in general. The METAR page (Figure 2) is a good
example of a page that is difficult for a novice to interpret. The plot options are
complex and include non-standard abbreviations. The abbreviation “wgst,” meaning
“wind gust,” for example, was particularly confusing.
Figure 2. Getting METAR data on the AWC site.
Some issues with the AWC site are simple web usability issues, which can
also be frustrating for users. The local forecast search box (see Figure 3) is a good
example. There were three usability issues with this small site element alone.
Foremost, the help box instructing the user to click “Go” to access the forecast covers
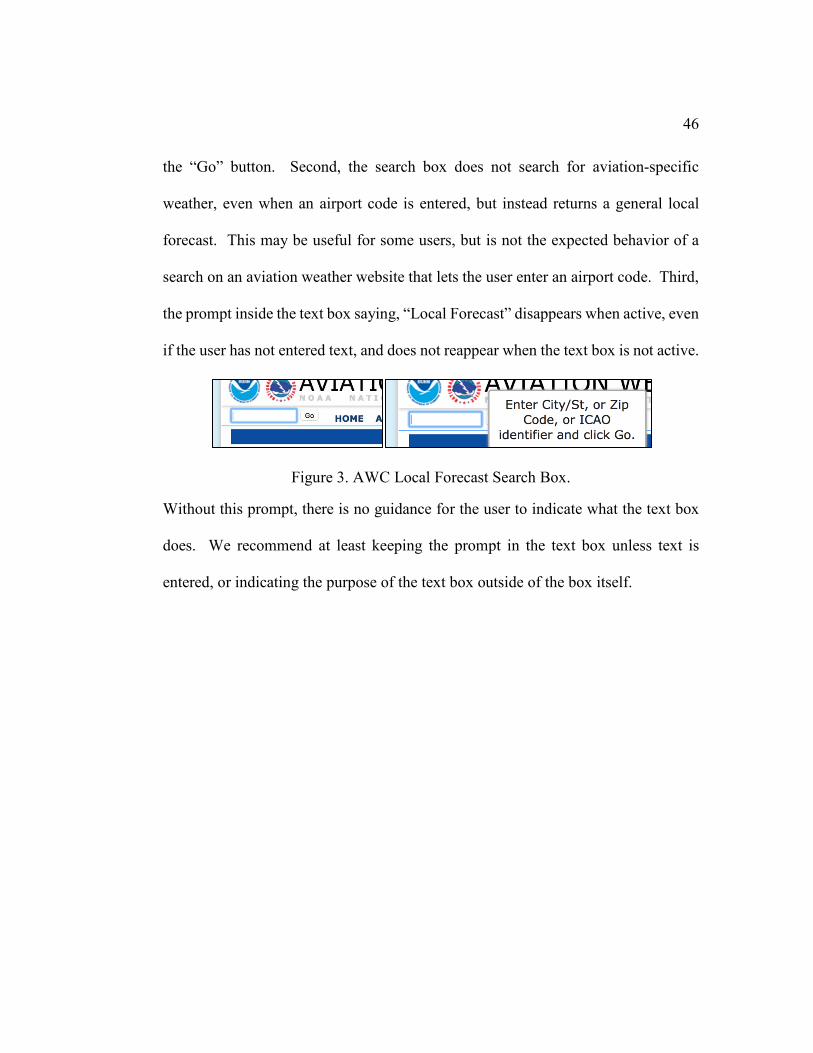
46
the “Go” button. Second, the search box does not search for aviation-specific
weather, even when an airport code is entered, but instead returns a general local
forecast. This may be useful for some users, but is not the expected behavior of a
search on an aviation weather website that lets the user enter an airport code. Third,
the prompt inside the text box saying, “Local Forecast” disappears when active, even
if the user has not entered text, and does not reappear when the text box is not active.
Figure 3. AWC Local Forecast Search Box.
Without this prompt, there is no guidance for the user to indicate what the text box
does. We recommend at least keeping the prompt in the text box unless text is
entered, or indicating the purpose of the text box outside of the box itself.

47
Table 8
Adverse Conditions (Usability Issues).
Issue Type Description Fix
Efficiency To view specific AIRMET/SIGMET
information on graphical plot by clicking
on the graphical advisory area, data
overlays that overlaid the same area had to
be disabled.
When graphical advisory areas
overlay each other, allow the user
to select which advisory they
would like to learn information
about.
Table 9
Big Picture Information (Usability Issues).
Issue Type Description Fix
Learnability If the pilot is not familiar with area
forecast terminology or abbreviations, they
will not be able to effectively use or
understand the area forecast product.
Provide a translated area forecast
or a glossary. Abbreviated or
uncommon terminology could be
presented with an option to mouse
over and view a translation.
48
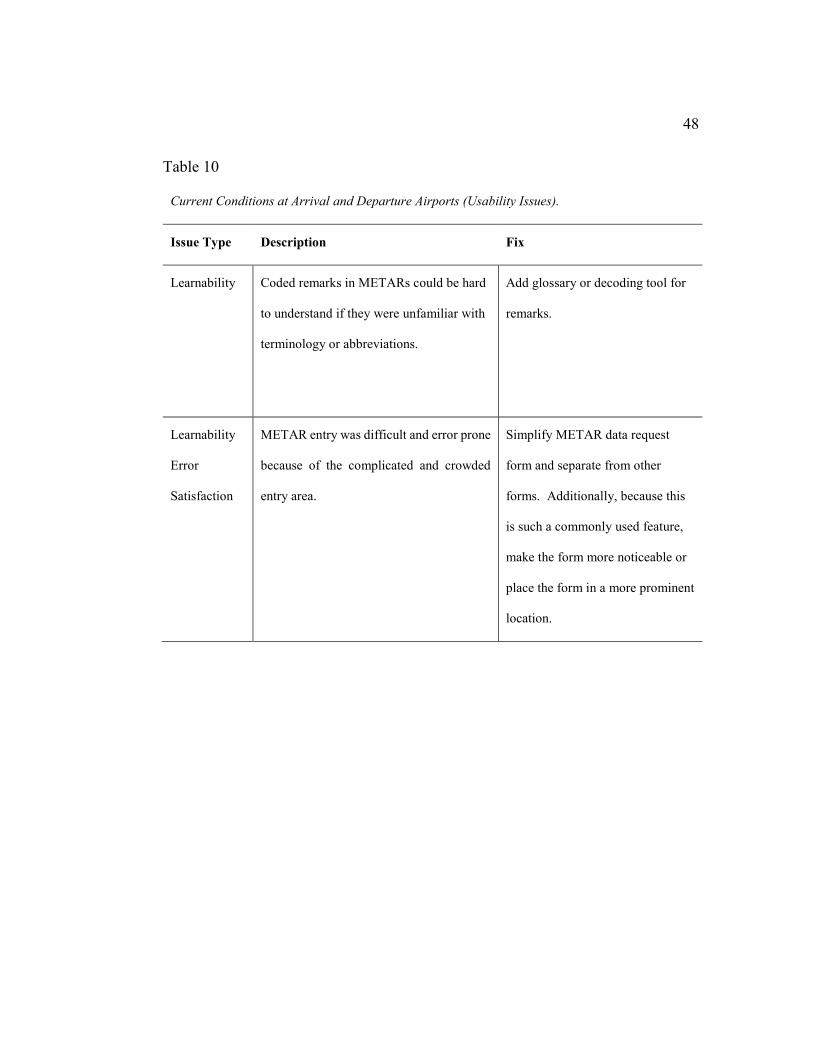
Table 10
Current Conditions at Arrival and Departure Airports (Usability Issues).
Issue Type Description Fix
Learnability Coded remarks in METARs could be hard
to understand if they were unfamiliar with
terminology or abbreviations.
Add glossary or decoding tool for
remarks.
Learnability
Error
Satisfaction
METAR entry was difficult and error prone
because of the complicated and crowded
entry area.
Simplify METAR data request
form and separate from other
forms. Additionally, because this
is such a commonly used feature,
make the form more noticeable or
place the form in a more prominent
location.

49
Table 11
Current Enroute Conditions (Usability Issues).
Issue Type Description Fix
Learnability
Efficiency
When looking for enroute METARs, there
is no way to know which airports are
nearby the route and would be useful for
looking at to determine observed
conditions enroute.
Offer a tool for including or
suggesting observations within a
certain distance from the route.
Efficiency
Satisfaction
Error
Users found it difficult to quickly grasp
the importance and relevance of PIREPs to
their particular flight. Additionally, the
PIREP graphic is helpful but the textual
lookup requires knowing the center ID.
This is not common knowledge and not
easy to find.
Offer a tool on the PIREP page for
retrieving PIREPs within a certain
distance of the route, or at least
offer a tool for looking up center
IDs.

50
Table 12
Enroute Forecast (Usability Issues).
Issue Type Description Fix
Learnability
Efficiency
The area forecast gives users a wealth of
information about general forecast
conditions but requires both local
knowledge and fluency in weather
abbreviations to determine the meaning of
specific items and to locate areas of
interest. Additionally, the information of
interest is buried in a wall of text
describing forecast conditions in multiple
states.
Offer tools for narrowing down
relevant information. These tools
could offer portions of the area
forecast by state of by part of state.
The area of interest should be
translated or unabbreviated to help
users find their area of interest.
Table 13
Destination Forecast (Usability Issues).
Issue Type Description Fix
Efficiency
Error
Many users made errors converting local
time to Coordinated Universal Time
(UTC) or vice versa while attempting to
retrieve relevant information from the
forecast.
Offer a time conversion tool or
time conversion aid. Offer the
time from the present (e.g. “Two
hours from now”) when showing a
UTC time.

51
Table 14
Winds and Temperatures Aloft Forecast (Usability Issues).
Issue Type Description Fix
Efficiency Many users preferred to use textual winds
and temperatures aloft forecasts, but in
doing so lost perspective about which
stations were relevant to their flight.
Offer a tool that shows users which
forecast stations are most relevant
to a flight.
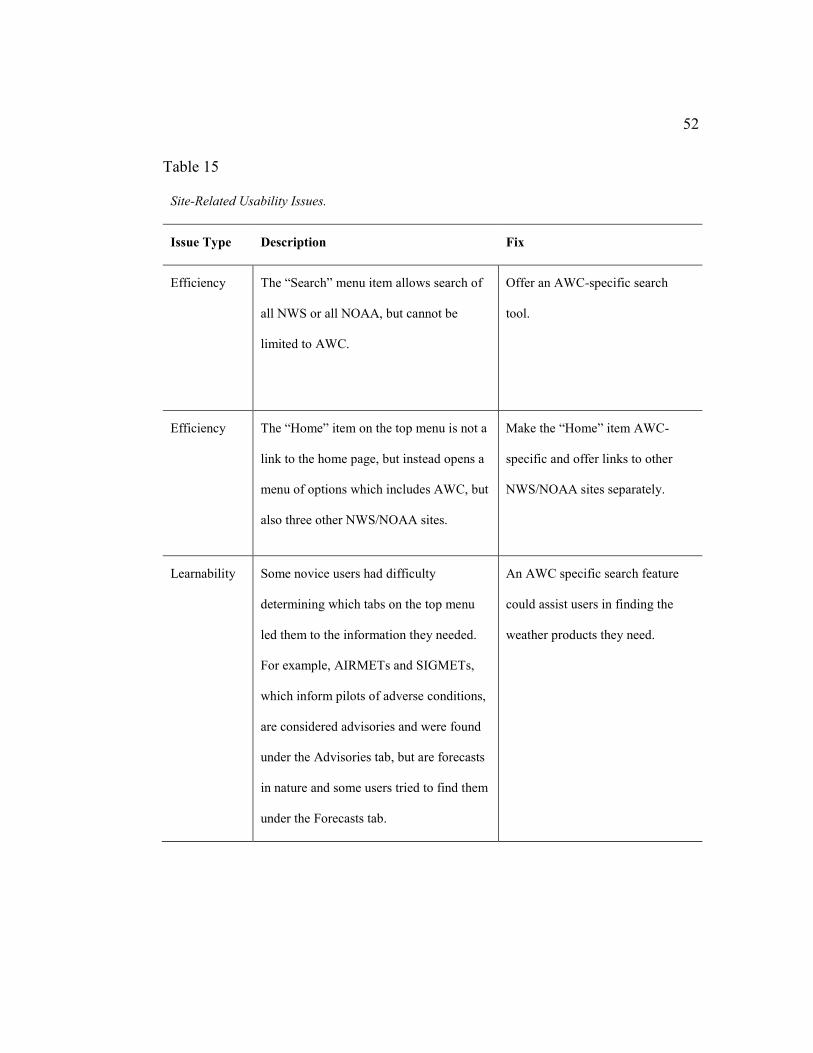
52
Table 15
Site-Related Usability Issues.
Issue Type Description Fix
Efficiency The “Search” menu item allows search of
all NWS or all NOAA, but cannot be
limited to AWC.
Offer an AWC-specific search
tool.
Efficiency The “Home” item on the top menu is not a
link to the home page, but instead opens a
menu of options which includes AWC, but
also three other NWS/NOAA sites.
Make the “Home” item AWC-
specific and offer links to other
NWS/NOAA sites separately.
Learnability Some novice users had difficulty
determining which tabs on the top menu
led them to the information they needed.
For example, AIRMETs and SIGMETs,
which inform pilots of adverse conditions,
are considered advisories and were found
under the Advisories tab, but are forecasts
in nature and some users tried to find them
under the Forecasts tab.
An AWC specific search feature
could assist users in finding the
weather products they need.
53
Table 15 (Continued)
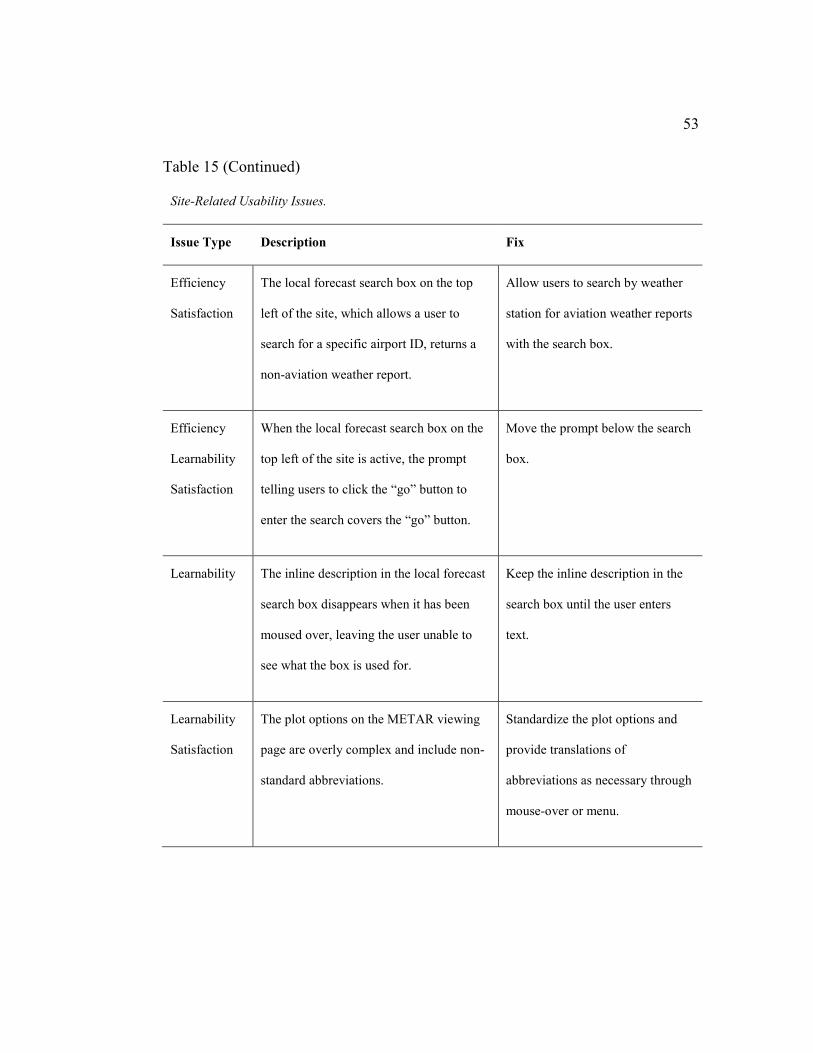
Site-Related Usability Issues.
Issue Type Description Fix
Efficiency
Satisfaction
The local forecast search box on the top
left of the site, which allows a user to
search for a specific airport ID, returns a
non-aviation weather report.
Allow users to search by weather
station for aviation weather reports
with the search box.
Efficiency
Learnability
Satisfaction
When the local forecast search box on the
top left of the site is active, the prompt
telling users to click the “go” button to
enter the search covers the “go” button.
Move the prompt below the search
box.
Learnability The inline description in the local forecast
search box disappears when it has been
moused over, leaving the user unable to
see what the box is used for.
Keep the inline description in the
search box until the user enters
text.
Learnability
Satisfaction
The plot options on the METAR viewing
page are overly complex and include non-
standard abbreviations.
Standardize the plot options and
provide translations of
abbreviations as necessary through
mouse-over or menu.

54
Recommendations for Aviation Weather Providers
Satisfaction could be considered the most important usability attribute,
because it is the user’s perception of all other usability attributes. If users do not feel
satisfied with something, they will be less likely to use it (Ferre, Juristo, Windl, &
Constantine, 2001). Not only is feeling accomplished important for learning, it is
important for retaining experienced users. Most of the usability issues discovered
with the AWC site could be classified as efficiency issues, which are problems for
satisfaction for all users, from novice to expert. If users are not able to find what
they need on the site, they may be less likely to return to the site. If a user is not able
to understand or use a weather product, they may be less likely to use that weather
product. While more complex weather products are less popular with pilots, they
contain important weather information for the safety of flight. Our first very general
suggestion is to improve satisfaction by decreasing complexity and improving
learnability.
Below are additional recommendations that apply to the AWC site but may
also apply to other sources of aviation weather.
• Provide translated “plain English” versions of weather products, by
adding a translation tool, or by adding a glossary. This may increase
learnability, efficiency, and satisfaction.
• Provide a tool that provides relevant stations along a route as necessary
for each type of weather product.

55
• Provide a time conversion tool or assistant, or a reference of the stated
time to the current time (e.g. “1253z, 35 minutes ago” or “in 3 hours”).
Overall, the preference of self-briefing general aviation pilots for simpler weather
products and the trouble users had with the complexity of weather information in this
study hint that aviation weather providers who serve general aviation pilots should
focus usability efforts on simplicity to aid learnability and satisfaction.
Recommendations for Future Study
From the lessons learned while conducting this study and the areas of interest
the study generated, we can offer a few recommendations to improve research of this
type and build on this research to improve the base of aviation weather usability
knowledge. First, in utilizing the SUS, acquiring a sample size large enough to detect
a practically significant difference between SUS scores is important if detecting that
difference is critical to the research. While not critical for this study, detecting
practically significant differences could be important for quantitatively determining
the best weather information configurations or something similar. Second, in
conducting think-aloud user studies of aviation weather we recommend including
participants with a variety of experience levels to ensure all perspectives are heard.
Participants with all levels of pilot certification, from Student Pilot to Airline
Transport Pilot, provided valuable input about the usability of the AWC site from
their unique perspectives.

56
As far as recommendations for future study of aviation weather information
usability, we see improving the simplicity and learnability of complex weather
products as an important step forward, and encourage the development and testing
of such products or interfaces for such products. We also see the relationship
between usability, safety, and weather-related decision making as an interesting and
important area of research. Aviation weather products should be usable, and in being
usable should encourage good safety practices and good decision making.
Summary and Conclusion
The usability of aviation weather information is an important area of study
but literature on the topic is relatively sparse. To begin filling in this gap in the
literature, we performed a two-part usability study of the popular Aviation Weather
Center website, which as a government website also serves as a primary distributor
of aviation weather information. The first part of the study quantitatively examined
different types of weather products with the System Usability Scale to determine if
the usability of any type of weather information normally used for a VFR cross-
country flight by general aviation pilots was less usable than a known web usability
benchmark. We could not determine that any score was significantly less than the
benchmark, but the ordering of usability scores seemed to concur with known
information about pilots’ use and perception of those types of aviation weather
information. Following the quantitative study, we performed a concurrent think-
aloud user study to qualitatively discover specific usability issues with the AWC site
57
and the weather products displayed on the site. Using the findings from both the first
and second phases of the research, we discovered and categorized a number of
usability issues with a wide impact. The most important usability findings could be
summarized as issues with the learnability and the efficiency of the site and the
weather information displayed on it, as well as the satisfaction of site users, which
can influence the types of weather they access and how often they use the site. From
these findings we suggest further study in the topic of online aviation weather to
improve the usability of weather information available to pilots.

References
58
Albersheim, S. (2013). ACTION: Cancelation of Advisory Circular (AC) 00-62, Internet Communications of Aviation Weather and NOTAMs. Federal Aviation Administration.
Aviation Weather Center. (2016). Aviation Digital Data Service. Retrieved from aviationweather.gov
Bangor, A., Kortum, P. T., & Miller, J. T. (2008). An Empirical Evaluation of the System Usability Scale. International Journal of Human-Computer Interaction, 24(March 2015), 574–594. http://doi.org/10.1080/10447310802205776
Boren, M. T., & Ramey, J. (2000). Thinking aloud: Reconciling theory and practice. IEEE Transactions on Professional Communication, 43(3), 261–278. http://doi.org/10.1109/47.867942
Braun, V., & Clarke, V. (2006). Using thematic analysis in psychology. Qualitative Research in Psychology, 3(2), 77–101. http://doi.org/http://dx.doi.org/10.1191/1478088706qp063oa
Brooke, J. (1996). SUS - A quick and dirty usability scale. In P. W. Jordan, B. Thomas, B. A. Weerdmeester, & I. L. McClelland (Eds.), Usability evaluation in industry (pp. 189–194). London: Taylor and Francis.
Casner, S. M., Murphy, M. P., Neville, E. C., & Neville, M. R. (2012). Pilots as Weather Briefers: The Direct Use of Aviation Weather Products by General Aviation Pilots. The International Journal of Aviation Psychology, 22(4), 367–381. http://doi.org/10.1080/10508414.2012.718241
Champely, S. (2016). pwr: Basic Functions for Power Analysis. Retrieved from http://cran.r-project.org/package=pwr
Creswell, J. W. (2013). Research Design: Qualitative, Quantitative, and Mixed Methods Approaches (4th ed.). Sage.
Ericsson, K. A., & Simon, H. A. (1993). Protocol analysis: Verbal reports as data. Cambridge, MA: MIT Press. Retrieved from http://www.worldcat.org/title/protocol-analysis-verbal-reports-as-data/oclc/42328830
Federal Aviation Administration. (2009a). Aeronautical Decision-Making: A Basic Staple. In Risk Management Handbook (FAA-H-8083-2). Retrieved from https://www.faa.gov/regulations_policies/handbooks_manuals/aviation/risk_management_handbook/media/rmh_ch05.pdf
Federal Aviation Administration. (2009b). Aviation Instructor’s Handbook. Retrieved from https://www.faa.gov/regulations_policies/handbooks_manuals/aviation/aviation_instructors_handbook/media/FAA-H-8083-9A.pdf
Federal Aviation Administration. (2015). Common General Aviation and Air Taxi Measures. In General Aviation and Part 135 Activity Surveys - CY 2014.
Federal Aviation Administration. (2016a). Aeronautical Information Manual.
59
Federal Aviation Administration. (2016b). Pilot’s Handbook of Aeronautical Knowledge. Oklahoma City, OK.
Federal Aviation Administration. (2016c). Pilot/Controller Glossary. Ferre, X., Juristo, N., Windl, H., & Constantine, L. (2001). Usability basics for
software developers. IEEE Software, 18(1), 22–29. http://doi.org/10.1109/52.903160
Grudin, J. (1992). Utility and usability: research issues and development contexts. Interacting with Computers, 4(2), 209–217. http://doi.org/10.1016/0953-5438(92)90005-Z
Hwang, W., & Salvendy, G. (2010). Number of People Required for Usability Evaluation: The 10±2 Rule. Communications of the ACM, 53(5), 130–133. http://doi.org/10.1145/1735223.1735255
International Civil Aviation Organization. (2009). Review of the Classification and Definitions Used for Civil Aviation Activities (No. STA/10-WP/7).
International Organization for Standardization. (2000). Software product quality (ISO/IEC 9126-1).
Jørgensen, A. H. (1990). Thinking-aloud in user interface design: a method promoting cognitive ergonomics. Ergonomics, 33(4), 501–507. http://doi.org/10.1080/00140139008927157
Kenny, D. J. (2016). 25th Joseph T. Nall Report: General Aviation Accidents in 2013.
Knecht, W. (2011). Testing Web-Based Preflight Weather Self-Briefing for General Aviation Pilots (No. DOT/FAA/AM-11/5). Oklahoma City, OK.
Knecht, W. R. (2008). Use of Weather Information by General Aviation Pilots, Part I, Quantitative: Reported Use and Value of Providers and Products (No. DOT/FAA/AM-08/6). Oklahoma City, OK.
Lecerof, A., & Paterno, F. (1998). Automatic support for usability evaluation. IEEE Transactions on Software Engineering, 24(10), 863–888. http://doi.org/10.1109/32.729686
Lee, Y., & Kozar, K. A. (2012). Understanding of website usability: Specifying and measuring constructs and their relationships. Decision Support Systems, 52(2), 450–463. http://doi.org/10.1016/j.dss.2011.10.004
Lewis, C. H., & Mack, R. (1981). Learning to use a text processing system: Evidence from “Thinking Aloud” protocols. Association for Computing Machinery, 387–392. http://doi.org/10.1145/800049.801817
National Oceanic and Atmospheric Association, & National Weather Service. (2016). Aviation Weather Center. Retrieved November 18, 2016, from https://www.aviationweather.gov/
National Weather Service, & Federal Aviation Administration. (2010). Aviation Weather Services (No. Advisory Circular AC 00-45G, Change 1). Oklahoma City, OK.
60
Nielsen, J. (1993). Usability Engineering. Boston: Academic Press. Nielsen, J. (1994). Estimating the number of subjects needed for a thinking aloud
test. International Journal of Human-Computer Studies, 41(3), 385–397. http://doi.org/10.1006/ijhc.1994.1065
O’Hare, D., & Waite, A. (2012). Effects of Pilot Experience on Recall of Information from Graphical Weather Displays. The International Journal of Aviation Psychology, 22(1), 1–17. http://doi.org/10.1080/10508414.2012.635122
Palmer, J. W. (2002). Web site usability, design, and performance metrics. Information Systems Research, 12(2), 151–167.
Prinzo, O. V., Hendrix, A. M., & Hendrix, R. (2007). An Analysis of Preflight Weather Briefings (No. DOT/FAA/AM-07/4). Oklahoma City, OK.
R Core Team. (2015). R: A language and environment for statistical computing. Vienna, Austria: R Foundation for Statistical Computing. Retrieved from http://www.r-project.org/
Sauro, J. (2011). A Practical Guide to the System Usability Scale. Denver, Colorado: Measuring Usability LLC.
Tung, L. L., Xu, Y., & Tan, F. B. (2009). Attributes of Web Site Usability: A Study of Web Users with the Repertory Grid Technique. International Journal of Electronic Commerce, 13(4), 97–126. http://doi.org/10.2753/JEC1086-4415130405
van Someren, M. W., Barnard, Y. F., Sandberg, J. A., & Solomon, P. (1994). The think aloud method: A practical guide to modelling cognitive processes. London: Academic Press. http://doi.org/10.1016/0306-4573(95)90031-4