extended bandwidth doherty power ampli er for carrier
TRANSCRIPT

Extended Bandwidth Doherty PowerAmplifier for Carrier Aggregated
Signals
by
Mehdi Naseri Ali Abadi
A thesispresented to the University of Waterloo
in fulfillment of thethesis requirement for the degree of
Master of Applied Sciencein
Electrical and Computer Engineering
Waterloo, Ontario, Canada, 2014
c© Mehdi Naseri Ali Abadi 2014

I hereby declare that I am the sole author of this thesis. This is a true copy of the thesis,including any required final revisions, as accepted by my examiners.
I understand that my thesis may be made electronically available to the public.
ii

Abstract
In the conventional classes of power amplifiers the efficiency drops at power back-off,whereas in order to maximize the spectral efficiency and data rate, wireless communicationstandards employ signals with high peak to average power ratio. This results in low averageefficiency for power amplifiers, which in turn results in heavy cooling requirements anddamage to the environment. To improve the low back-off efficiency Doherty techniquehas been widely investigated. But, the conventional Doherty power amplifiers are fairlynarrowband, while modern transmitters are needed to support multiple standards andoperate at multiple frequency bands.
This thesis proposes two novel output combiners for Doherty power amplifiers withextended bandwidth. It will be shown analytically how the problem of wideband Dohertycan be converted into an impedance synthesization problem. Then two networks to syn-thesize the desired impedance are proposed. To achieve the proper load modulation over awide bandwidth, the first proposed combiner employs a quarter-wave short-circuited stubat the output of the peaking transistor and the second proposed combiner uses a parallelLC tank at the same node.
In addition to inherent wideband characteristics, the proposed Doherty output combin-ers have three other important benefits. First, they present small low-frequency impedancefor both the main and peaking transistors, which results in improved linearity and lineariz-ability when the amplifier is concurrently driven with multi-band modulated signals. Sec-ond, the new combiners result in smaller group delay variation across the band comparedto the conventional Doherty amplifier, which results in improved linearizability when theamplifier is driven with extra wideband modulated signals. Finally, the output capacitanceof the peaking transistor can be easily absorbed into the combiners without compromisingthe performance of the amplifier.
The thesis starts with an overview of the Doherty power amplifier principles and pro-vides a bandwidth analysis for the conventional Doherty power amplifier. Then it continueswith the new approach to extend the bandwidth of Doherty amplifiers with respect to re-quirements of multi-band transmission. Based on the proposed combiners, two GalliumNitride 20 W Doherty power amplifiers have been designed and fabricated. The mea-surement results have been provided to validate the developed theory. The first amplifercovers 1.72 GHz to 2.27 GHz and the second one covers 700 MHz to 950 MHz andboth maintain higher than 48% of drain efficiency at 6 dB back-off across the band. Thetwo amplifiers are successfully linearized when driven with carrier aggregated modulatedsignals.
iii

Acknowledgements
I would like to thank my parents and my two brothers for their endless support. It istheir unconditional love that motivates me to follow superior goals.
I would also want to thank my Master’s supervisor, Dr. Slim Boumaiza, for his helpand support throughout my studies as a Master student.
I like to thank all my friends at EMRG group, specially Hamed for his valuable technicaldiscussions in these two years, Hassan and Farouk and Bilel for their help with digital pre-distortion, and Kasyap for proofreading this thesis.
Last, but not least, I would like to thank Dr. Peter Levine and Dr. Karim Karim forreading my thesis and giving their valuable comments.
iv

Dedication
This is dedicated to my parents.
v

Table of Contents
List of Tables viii
List of Figures ix
Nomenclature xiii
1 Introduction 1
1.1 Motivation . . . . . . . . . . . . . . . . . . . . . . . . . . . . . . . . . . . . 1
1.2 Problem Statement . . . . . . . . . . . . . . . . . . . . . . . . . . . . . . . 3
1.3 Thesis Organization . . . . . . . . . . . . . . . . . . . . . . . . . . . . . . . 3
2 Overview of the Conventional Doherty Power Amplifier 5
2.1 Overview of RFPAs . . . . . . . . . . . . . . . . . . . . . . . . . . . . . . . 5
2.1.1 Conventional Classes of Operation . . . . . . . . . . . . . . . . . . . 6
2.2 Conventional DPA (Principle of Operation) . . . . . . . . . . . . . . . . . 10
2.3 Bandwidth Analysis of Conventional DPA . . . . . . . . . . . . . . . . . . 12
2.4 Literature Review on wideband DPA . . . . . . . . . . . . . . . . . . . . . 17
3 Bandwidth Extension of DPA 21
3.1 New Approach for Bandwidth Extension of DPA . . . . . . . . . . . . . . . 21
3.2 Broadband DPA using New TL-based Combiner Network . . . . . . . . . . 27
3.2.1 Group Delay . . . . . . . . . . . . . . . . . . . . . . . . . . . . . . . 30
vi

3.2.2 Baseband Impedance . . . . . . . . . . . . . . . . . . . . . . . . . . 33
3.2.3 Parasitic Absorption . . . . . . . . . . . . . . . . . . . . . . . . . . 35
3.2.4 Real-to-Real Impedance Transformer . . . . . . . . . . . . . . . . . 35
3.3 Broadband DPA using New Combiner Network with Discrete Resonator . . 41
4 Measurement Results 48
4.1 Fabricated Amplifier Based on the First Proposed Combiner . . . . . . . . 48
4.2 Fabricated Amplifier Based on the Second Proposed Combiner . . . . . . . 53
5 Conclusions and Future Works 58
5.1 Conclusions . . . . . . . . . . . . . . . . . . . . . . . . . . . . . . . . . . . 58
5.2 Future Work . . . . . . . . . . . . . . . . . . . . . . . . . . . . . . . . . . . 60
References 61
vii

List of Tables
2.1 Summary of two-way DPA . . . . . . . . . . . . . . . . . . . . . . . . . . . 20
4.1 Summary of the design parameters of the second proposed DPA . . . . . . 54
5.1 Performance comparison . . . . . . . . . . . . . . . . . . . . . . . . . . . . 59
viii

List of Figures
1.1 (a) The amplitude of 4C-WCDMA signal (b) Rayleigh PDF . . . . . . . . 1
1.2 Different scenarios for carrier aggregation in LTE-Advanced . . . . . . . . 2
2.1 (a) Transfer and (b) Output characteristic of an ideal transistor . . . . . . 7
2.2 Current waveforms and conduction angles in different classes of operation . 8
2.3 Class-F amplifier . . . . . . . . . . . . . . . . . . . . . . . . . . . . . . . . 9
2.4 The schematic of conventional DPA combiner . . . . . . . . . . . . . . . . 11
2.5 Comparison of the efficiency of class-B and Doherty PA . . . . . . . . . . . 11
2.6 The drain (a) current and (b) voltage profiles of the main and peakingtransistors in Doherty amplifier . . . . . . . . . . . . . . . . . . . . . . . . 12
2.7 Modulation of the main impedance through the peaking current . . . . . . 13
2.8 Contribution of the main and peaking transistors to the output power inDoherty amplifier . . . . . . . . . . . . . . . . . . . . . . . . . . . . . . . . 13
2.9 The conventional DPA output combiner with the transistors replaced withcurrent sources . . . . . . . . . . . . . . . . . . . . . . . . . . . . . . . . . 14
2.10 (a) Rm and (b) Xm of the conventional DPA output combiner at 6 dBback-off from peak power . . . . . . . . . . . . . . . . . . . . . . . . . . . . 15
2.11 The conventional DPA output combiner with single-section quarter-wavetransformer . . . . . . . . . . . . . . . . . . . . . . . . . . . . . . . . . . . 16
2.12 (a) Rm and (b) Xm of the conventional DPA output combiner at 6 dB back-off and peak power (a single section quarter-wave transformer is used tomatch 50Ω to Ropt
2) . . . . . . . . . . . . . . . . . . . . . . . . . . . . . . . 17
2.13 Complete schematic of a conventional DPA . . . . . . . . . . . . . . . . . . 18
ix

3.1 Load modulation versus normalized input voltage in a conventional DPA atcenter frequency . . . . . . . . . . . . . . . . . . . . . . . . . . . . . . . . . 22
3.2 General Doherty configuration . . . . . . . . . . . . . . . . . . . . . . . . . 22
3.3 (a) Solution of 3.2, 3.5, and 3.8, (b) Load variation versus frequency at peakpower and back-off corresponding to the solution of 3.2, 3.5, and 3.8 . . . . 24
3.4 (a) Solution of 3.2, 3.5, when ϕ = −π2
(ffo
), (b) Load variation versus fre-
quency at peak power and back-off corresponding to the solution of 3.2, 3.5,
when ϕ = −π2
(ffo
). . . . . . . . . . . . . . . . . . . . . . . . . . . . . . . 25
3.5 (a) Solution of 3.2, 3.5, when ϕ = −π2, (b) Load variation versus frequency
at peak power and back-off corresponding to the solution of 3.2, 3.5, whenϕ = −π
2. . . . . . . . . . . . . . . . . . . . . . . . . . . . . . . . . . . . . 25
3.6 (a) Solution of 3.2, 3.5, when ϕ = −π + π2
(ffo
), (b) Load variation versus
frequency at peak power and back-off corresponding to the solution of 3.2,
3.5, when ϕ = −π + π2
(ffo
). . . . . . . . . . . . . . . . . . . . . . . . . . 26
3.7 The first proposed Doherty combiner . . . . . . . . . . . . . . . . . . . . . 27
3.8 The first proposed Doherty combiner with the transistors replaced by currentsources . . . . . . . . . . . . . . . . . . . . . . . . . . . . . . . . . . . . . . 28
3.9 The first proposed Doherty combiner with Z2 = 23Ropt . . . . . . . . . . . . 29
3.10 The first proposed Doherty combiner with Z2 = 65Ropt . . . . . . . . . . . . 30
3.11 (a) Rm versus frequency for different values of Z2 in the first proposed Do-herty, (b) Rm at 6 dB back-off in the proposed and conventional DPA . . . 31
3.12 Phase, group delay, and group delay dissipation of the conventional andproposed DPA versus frequency at three different power levels . . . . . . . 32
3.13 Applying bias voltage in a conventional DPA . . . . . . . . . . . . . . . . . 33
3.14 Applying bias voltage through the parallel λ/4 stub . . . . . . . . . . . . . 34
3.15 (a) The normalized baseband impedance seen by the drain of main andpeaking transistor (Z2 = 6
5Ropt), (b) Typical baseband impedance for the
conventional and the proposed DPA . . . . . . . . . . . . . . . . . . . . . . 34
3.16 The first proposed DPA output combiner with single-section quarter-wavetransformer . . . . . . . . . . . . . . . . . . . . . . . . . . . . . . . . . . . 36
x

3.17 (a) Rm and (b) Xm of the proposed DPA output combiner at 6 dB back-offof peak power (a single section quarter-wave transformer is used to match50Ω to Ropt
2) . . . . . . . . . . . . . . . . . . . . . . . . . . . . . . . . . . . 36
3.18 Rm of the proposed DPA output combiner at back-off and peak power versusfrequency for two different values of Z2 . . . . . . . . . . . . . . . . . . . . 38
3.19 (a) Rm of the conventional and proposed combiners at back-off and peakpower for Ropt = 30Ω, (b) Load modulation in the conventional DPA, (c)load modulation in the proposed DPA, (d) Efficiency of the conventionalDPA, (e) Efficiency of the proposed DPA . . . . . . . . . . . . . . . . . . . 39
3.20 Normalized baseband impedance seen by the drain of main transistor whenZ2 = 6
5∗Ropt = 36Ω (tapered line) and when Z2 = 7.6Ω (single-section) . . 40
3.21 Optimum value of Z2 of the proposed combiner for x = 5% . . . . . . . . . 40
3.22 Complete schematic of the first proposed Doherty amplifier . . . . . . . . . 41
3.23 Short-circuited quarter-wave stub as a resonator . . . . . . . . . . . . . . . 42
3.24 Second proposed output combiner . . . . . . . . . . . . . . . . . . . . . . . 42
3.25 Applying bias voltage through the tank inductor Lt . . . . . . . . . . . . . 43
3.26 Load modulation versus normalized input voltage . . . . . . . . . . . . . . 46
3.27 Complete schematic of the second proposed DPA . . . . . . . . . . . . . . 47
4.1 Fabricated amplifier based on the proposed combiner . . . . . . . . . . . . 49
4.2 Measured CW gain versus output power for the proposed DPA. . . . . . . 49
4.3 Measured CW efficiency versus output power for the proposed DPA. . . . . 50
4.4 Measured efficiency at peak output power and 6-dB and 10-dB back-off forthe proposed DPA versus frequency. . . . . . . . . . . . . . . . . . . . . . . 50
4.5 Measured spectrum of the output of the first proposed DPA before and afterlinearization when driven with four-carrier WCDMA signal at (a) 1.8GHz,(b) 2GHz, and (c) 2.2GHz. . . . . . . . . . . . . . . . . . . . . . . . . . . 51
4.6 Measured spectrum of the output of the first proposed DPA before and afterlinearization when driven with 80MHz modulated signal. . . . . . . . . . 52
4.7 Measured spectrum of the output of the first proposed DPA before and afterlinearization when driven with dual-band modulated signal. . . . . . . . . . 53
xi

4.8 Fabricated amplifier based on the proposed combiner . . . . . . . . . . . . 54
4.9 Measured CW gain versus output power for the proposed DPA. . . . . . . 55
4.10 Measured CW efficiency versus output power for the proposed DPA. . . . . 55
4.11 Measured efficiency at peak output power and 6-dB and 10-dB back-off forthe proposed DPA versus frequency. . . . . . . . . . . . . . . . . . . . . . . 56
4.12 Measured spectrum of the output of the second proposed DPA before andafter linearization when driven with 40MHz modulated signal. . . . . . . 57
4.13 Measured spectrum of the output of the second proposed DPA before andafter linearization when driven with dual-band modulated signal. . . . . . . 57
xii

Nomenclature
AC Alternating Current
ACLR Adjacent Channel Leakage Ratio
CW Continuous Wave
DC Direct Current
DE Drain Efficiency
DPA Doherty Power Amplifier
GaN Gallium Nitride
HGA High Gain Amplifier
HMET High Electron Mobility Transistor
ITR Impedance Transformation Ratio
LDMOS Laterally Diffused Metal Oxide Semiconductor
LNA Low Noise Amplifier
LTE Long Term Evolution
PAE Power Added Efficiency
PAPR Peak to Average Power Ratio
PDF Probability Density Function
RFPA Radio Frequency Power Amplifier
xiii

SRFT Simplified Real Frequency Technique
WCDMA Wideband Code Division Multiple Access
xiv

Chapter 1
Introduction
1.1 Motivation
In order to maximize the spectral efficiency, wireless communication standards employsignals with a high peak to average power ratio (PAPR). An example of a high PAPRsignal, four carrier Wideband Code Division Multiple Access (4C-WCDMA), is shown inFig.1.1(a). The probability density function (PDF) of the amplitude of these signals followsthe Rayleigh PDF, as shown in Fig.1.1(b). Efficient amplification of such high PAPR signalsrequires an amplifier which is linear and has high efficiency at power back-off as well aspeak power.
0.000 0.0005 0.001 0.0015 0.002 0.0025 0.0030
0.1
0.2
0.3
0.4
0.5
0.6
0.7
Time (mS)
Am
plitu
de
High PAPR Signal
Peak
Average
(a) (b)
Figure 1.1: (a) The amplitude of 4C-WCDMA signal (b) Rayleigh PDF
1

To further increase the bit-rate, the Long Term Evolution (LTE) Advanced uses carrieraggregation [1]. There are three different scenarios for carrier aggregation, which are shownin Fig.1.2. The first scenario in which all the component carriers are contiguous and arewithin the same operating frequency band is called intra-band contiguous and is illustratedin Fig.1.2(a). Depicted in Fig.1.2(b) is the case when carriers are within the same bandbut they are separated by a gap, or gaps, in between. This case is known as intra-bandnon-contiguous. Finally, when the carriers are in different bands it is called inter-bandnon-contiguous and is depicted in Fig.1.2(c). The amplification of such carrier aggregatedsignals requires an amplifier which is wideband and is capable of amplifying wideband andmulti-band signals.
(a) Intra-band, contiguous
(b) Intra-band, non-contiguous
(c) Inter-band, non-contiguous
Figure 1.2: Different scenarios for carrier aggregation in LTE-Advanced
Therefore, future communication systems require radio frequency (RF) power amplifiers(PAs) which are linear, efficient and capable of supporting multiple standards and operatingat multiple bands, even concurrently.
2

1.2 Problem Statement
In the conventional classes of power amplifiers (e.g. class-A, AB, B) the efficiency drops atpower back-off. Therefore, amplification of high PAPR signals with such amplifiers resultsin low average efficiency, which in turn results in heavy cooling requirements. This notonly increases the costs, but also causes damage to the environment.
To address the limited back-off efficiency of PAs, efficiency enhancement techniquessuch as Doherty [2] have been extensively investigated. Although the conventional Dohertypower amplifiers (DPAs) are successful in improving the back-off efficiency, they are fairlynarrow-band (less than 10%). Therefore, they are not suitable for wideband applications.Also, they usually fail to amplify carrier aggregated signals, especially when there is alarge gap between the component carriers. Although, there have been several attemptsto extend the bandwidth of DPA in recent years (a review of such works is provided inthe next chapter), they have not addressed the case where the DPA is driven with carrieraggregated signals.
In this thesis, a novel approach to extend the bandwidth of DPA has been proposed.The proposed combiner is simple to implement and enables concurrent amplification ofmulti-band signals. A single PA which supports multiple communication bands results incost and complexity reduction of base-station transmitters.
1.3 Thesis Organization
The organization of this thesis is as follows. Chapter two starts with an overview ofconventional classes of RFPAs. Then it continues with a brief overview of the principles ofoperation of the conventional DPA followed by the bandwidth analysis. Finally a literaturereview of the previous works on wideband DPAs closes the chapter.
Chapter 3, which constitutes the core of the thesis, introduces the new approach toextend the bandwidth of the DPA. This approach converts the problem of wideband DPAinto an impedance synthesization problem. In the rest of this chapter, two networks havebeen proposed to synthesize the desired impedance needed for a wideband DPA. Othercharacteristics of the new combiners are also discussed, including the group delay andlow-frequency impedance. It has been explained why maintaining small low-frequencyimpedance is critical for successful linearization of the PA when it is concurrently drivenwith multi-band signals.
3

To verify the developed theory, two wide-band DPAs have been designed and fabri-cated based on the proposed combiners, the measurement results of which are presentedin chapter 4. Finally, chapter 5 finishes with conclusions from the thesis.
4

Chapter 2
Overview of the ConventionalDoherty Power Amplifier
2.1 Overview of RFPAs
A PA is an amplifier which amplifies power. In other words, its output power and powergain are important. The gain of a PA is defied as:
G =PoutPin
(2.1)
where Pin is the input RF power to the amplifier and Pout is the RF power delivered to theload in Watt. To deliver the power Pout to the load, the amplifier consumes Direct Current(DC) power from a DC source, i.e. PDC . PDC is higher than Pout and the difference wouldbe dissipated as heat. If for the same amount of output power the amplifier consumes lessDC power or in other words dissipates less power as heat the amplifier is more efficient.The efficiency (drain efficiency) of a PA is defined as:
Drain Efficiency = η =PoutPDC
(2.2)
The above figure of merit does not include the gain and input power to the PA. In fact,very efficient PAs can be designed with no gain. To include the gain, another figure ofmerit called the Power Added Efficiency (PAE) is defined is follows:
PAE =Pout − PinPDC
= η(1− 1
G) (2.3)
5
As can be seen, if the amplifier has a high gain (G→∞) the two values converge.
In a high gain amplifier (HGA) the input as well as the output are conjugate matchedto maximize the gain. In a low noise amplifier (LNA)the input is noise matched to lowerthe noise figure and the output is conjugate matched to get a reasonable gain. In a poweramplifier, however the input side is conjugate matched for the gain and the output side ispower matched to get the maximum power out of the device. Assuming that the transistorcan be modelled with an ideal current source, the power match at the output meansterminating the drain with a resistance equal to so called Ropt, where Ropt is defined as:
Ropt =VDCImax/2
(2.4)
where VDC is the drain supply voltage (which approximately is equal to Vmax/2) and Imaxis the maximum allowed drain current. Terminating the output with Ropt ensures thatthe device is pushed into its limits in terms of voltage and current and hence maximumpossible power can be delivered to the load without causing damage to the transistor.
2.1.1 Conventional Classes of Operation
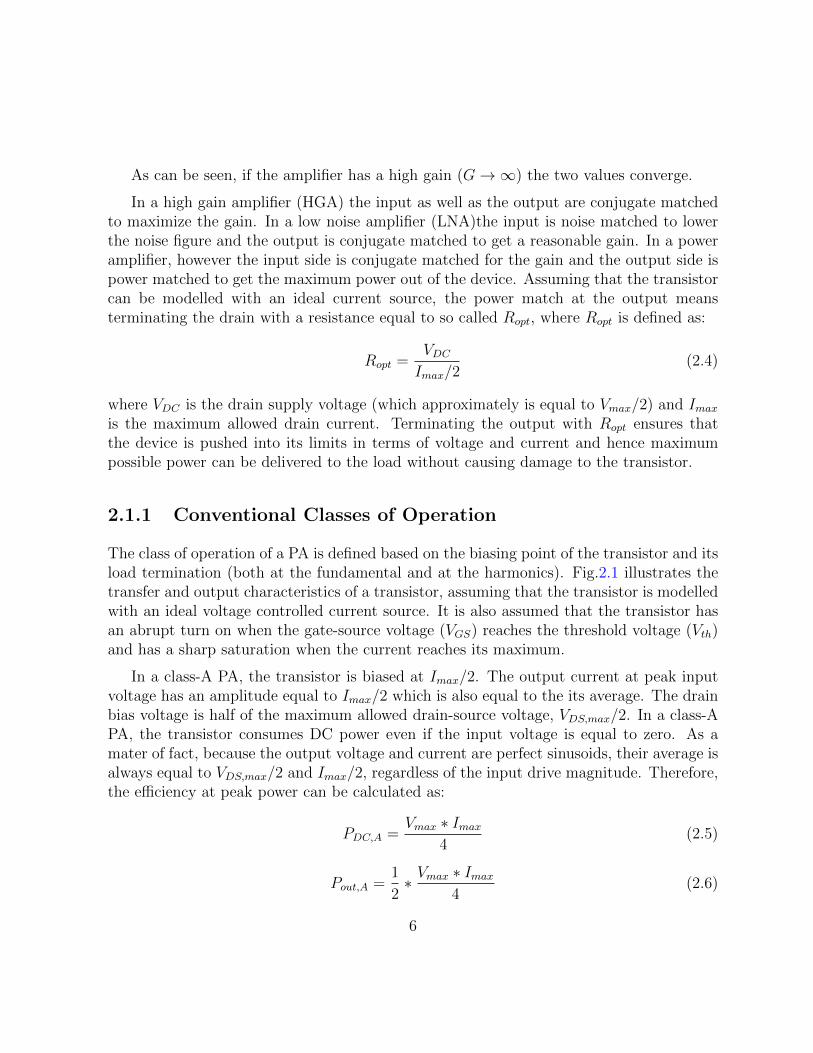
The class of operation of a PA is defined based on the biasing point of the transistor and itsload termination (both at the fundamental and at the harmonics). Fig.2.1 illustrates thetransfer and output characteristics of a transistor, assuming that the transistor is modelledwith an ideal voltage controlled current source. It is also assumed that the transistor hasan abrupt turn on when the gate-source voltage (VGS) reaches the threshold voltage (Vth)and has a sharp saturation when the current reaches its maximum.
In a class-A PA, the transistor is biased at Imax/2. The output current at peak inputvoltage has an amplitude equal to Imax/2 which is also equal to the its average. The drainbias voltage is half of the maximum allowed drain-source voltage, VDS,max/2. In a class-APA, the transistor consumes DC power even if the input voltage is equal to zero. As amater of fact, because the output voltage and current are perfect sinusoids, their average isalways equal to VDS,max/2 and Imax/2, regardless of the input drive magnitude. Therefore,the efficiency at peak power can be calculated as:
PDC,A =Vmax ∗ Imax
4(2.5)
Pout,A =1
2∗ Vmax ∗ Imax
4(2.6)
6

ηA =Pout,APDC,A
=1
2= 50% (2.7)
Therefore, a class-A PA has two major drawbacks: first it consumes power without theinput drive and second, its peak efficiency is 50%, i.e. half of the consumed DC power willbe dissipated as heat. The important benefit of a class-A PA is that it has the highest gainamong all classes of operation.
(a) (b)
Figure 2.1: (a) Transfer and (b) Output characteristic of an ideal transistor
In order to increase the efficiency, the gate bias voltage can be moved towards the cut-off. In a class-B PA the gate bias is equal to the threshold voltage. Therefore, without theinput signal, the transistor does not draw any DC current and therefore the consumed DCpower is equal to zero. Also, the amplifier only conducts for half of the input cycle, so ina class-B PA the so called conduction angle is equal to π, as illustrated with purple curvesin Fig.2.2.
The DC and fundamental components of a half sine current (as is the case in class B)are equal to Imax/π and Imax/2, respectively. Therefore, the efficiency at peak power canbe calculated as:
PDC,B =Vmax ∗ Imax
2 ∗ π(2.8)
Pout,B =1
2∗ Vmax ∗ Imax
4(2.9)
ηB =Pout,BPDC,B
=π
4= 78.5% (2.10)
7

Figure 2.2: Current waveforms and conduction angles in different classes of operation
Therefore a class-B PA has two major benefits: first it consumes no DC power withoutthe input drive and second, its peak efficiency is 78.5%, i.e. only 22.5% of the consumedDC power will be dissipated as heat. The disadvantage of a class-B PA is that the inputdrive should be doubled in order to push the transistor to its maximum limits. This meansthat the gain of a class-B PA is 6 dB lower than that of a class-A PA.
As the current waveform moves away from a perfect sinusoid, harmonic componentsstart to appear at the output current. Therefore, in an ideal class-B mode, all the harmonicsshould be terminated with short-circuited impedance.
When the conduction angle is between π and 2π, the class of operation is called classAB. The efficiency at the peak power in this case is somewhere between 50% and 78.5%.Moving closer to class-B mode, the efficiency goes up while the gain goes down.
Finally, when the conduction angle is lower than π the PA is operating in class-C. Theefficiency gets closer to 100% as the conduction angle gets closer to zero, although therewould be no gain remaining there.
So far, it has been assumed that all the harmonics are terminated with a short circuitedimpedance. It can be shown that by proper use of harmonics higher efficiencies can beachieved, e.g. in class F. In a class-F PA the bias point is in the AB region (it is usually
8

(a) Class-F current and voltage waveforms
(b) An implementation of class-F PA
Figure 2.3: Class-F amplifier
very close to the class-B bias point). The voltage and current waveforms corresponding tothis class of operation are square and half-sine waves, respectively, as shown in Fig.2.3(a),leading to ideally 100% drain efficiency at full rail-to-rail voltage swing. To achieve thesewaveforms, the required harmonic load terminations of the transistor should be as follows:
ZL(fo) = RL (2.11)
ZL(2kfo) = 0 (2.12)
ZL((2k + 1)fo) =∞ (2.13)
Comparing a class-F PA with the class-B, one can conclude that,
V Fm =
4
πV Bm (2.14)
where Vm is the magnitude of fundamental drain voltage of the transistor, and F andB superscripts represent class-F and B quantities, respectively. Subsequently, the peak
9

output power of the two PAs can be written as
PBout =
1
2V BIB (2.15)
P Fout =
1
2V F IF (2.16)
Assuming that the output power of the two cases are equal, one can deduce the relationbetween the required fundamental voltage and current components of the class-F PA atpeak power in terms of those of the class-B PA, i.e.,
V F =4
πV B (2.17)
IF =π
4IB (2.18)
In other words, the maximum current provided by the class-F PA has to scale down by afactor of π/4 = 0.785 for the same output power. Therefore, the optimum load impedanceof the class-F main transistor at full power can be calculated as
RFopt =
V FM
IFM=
(4
π
)2
RBopt (2.19)
Therefore, to get the ideal 100% efficiency, the transistor is needed to be terminated withthe above impedance at the fundamental and with short circuit at even and open circuitat odd harmonics. Although in practice, the harmonic termination is usually realizable upto three harmonics. This gives a better efficiency than a class-B PA, but still far from theideal 100% efficiency.
2.2 Conventional DPA (Principle of Operation)
Fig.2.4(a) depicts the schematic of a conventional DPA. Doherty power amplifier is suitablefor efficiently amplifying high PAPR signals, since it maintains its peak efficiency over acertain range (e.g., 6 dB) of back-off, depicted in Fig.2.5. In order to do so, it uses anauxiliary (also called peaking) transistor to modulate the impedance seen by the main (alsocalled carrier) transistor. The main and peaking transistors are operating in class B andC, respectively.
10

(a) The load impedance is equal to RL (b) A real-to-real impedance transformer transforms50Ω to RL
Figure 2.4: The schematic of conventional DPA combiner
Figure 2.5: Comparison of the efficiency of class-B and Doherty PA
The characteristic impedance of the quarter-wave line that connects the drain of mainand peaking transistors, Zo, is equal to Ropt and the value of load impedance, RL, is equalto Ropt/2, where Ropt is the optimum load impedance of the main transistor.
The drain current and voltage profiles of the main and peaking transistors are illustratedin Fig.2.6. These figures are drawn for the case when the second efficiency peak occurs at6 dB back-off of the peak power, because the peaking transistor turns on when the inputvoltage is half of its maximum value.
11

(a) (b)
Figure 2.6: The drain (a) current and (b) voltage profiles of the main and peaking tran-sistors in Doherty amplifier
Fig.2.6(b) shows that the voltage excursion of the main transistor is maximized in theupper half of the the input drive. Hence, it operates with its maximum efficiency in thisregion. In order to maintain linearity while keeping this maximum swing, the peakingcurrent along with the quarter-wave inverter modulates the impedance seen by the drainof the main transistor as depicted in Fig.2.7.
In the first half of the input drive, only the main transistor contributes to the outputpower, while during the upper half the output power is a combination of the main andpeaking output powers. This has been illustrated in Fig.2.8.
2.3 Bandwidth Analysis of Conventional DPA
For now,is has been assumed that RL = Ropt/2 regardless of frequency (i.e., an idealwideband real-to-real impedance transformer such as a tapered line with infinite length hasbeen used; see Fig.2.4(a)). With this assumption, Rm = real Zm and Xm = imag Zmversus frequency can be plotted for the conventional DPA combiner, where Zm is theimpedance seen by the drain of the main transistor. It is also assumed that the transistors
12

Figure 2.7: Modulation of the main impedance through the peaking current
Figure 2.8: Contribution of the main and peaking transistors to the output power inDoherty amplifier
13

are ideal current sources, as depicted in Fig.2.9.
Figure 2.9: The conventional DPA output combiner with the transistors replaced withcurrent sources
Fig.2.10 shows the normalized Rm and Xm at peak power and 6 dB back-off for theconventional DPA. It is important to note that since the load impedance is Ropt/2, theseplots are valid for any DPA regardless of the power level. In this figure,it has been assumedthat
• @ 6 dB back-off: Ip = 0
• @ peak power: |Ip| = |Im| & ϕp = −π2∗ ffo
, where fo is the center frequency (thisphase profile can be realized using a Wilkinson power divider with a quarter-waveline at the input of the peaking transistor).
Assuming 5% variation in Rm at back-off is acceptable within the bandwidth (thistranslates to a 5% reduction in efficiency), Fig.2.10(a) shows that the bandwidth of theconventional DPA is about 17%, irrespective of the value of Ropt. However, in practice,the larger output capacitances of the main and peaking transistors are more difficult toabsorb in the combiner at high power levels and usually higher power translates to lowerbandwidth. Fig.2.10(a) also illustrates that in a conventional DPA, as frequency deviatesfrom the center frequency, the 6 dB back-off efficiency falls, but the peak power efficiencyis constant versus frequency (if a Wilkinson divider has been used at the input).
14

0.85 0.9 0.95 1 1.05 1.10.9
1
1.1
1.2
1.3
1.4
1.5
1.6
1.7
1.8
1.9
2
2.1
normalized frequency (f/fo)
norm
aliz
ed R
m (
real
(Zm
)/R
opt)
6−dB back−offpeak power
x=5%, BW=17%
(a)
0.85 0.9 0.95 1 1.05 1.1−0.8
−0.6
−0.4
−0.2
0
0.2
0.4
0.6
normalized frequency (f/fo)
norm
aliz
ed X
m (
imag
(Zm
)/R
opt)
6−dB back−offpeak power
(b)
Figure 2.10: (a) Rm and (b) Xm of the conventional DPA output combiner at 6 dB back-offfrom peak power
The real-to-real transformer of Fig.2.4(b) transforms the 50Ω load to Ropt/2 and usuallyis a single-section quarter-wave transformer, a multi-section quarter-wave transformer, ora tapered line. At low power levels, where the impedance transformation ratio (ITR)is low (e.g., less than 4), the single-section quarter-wave transformer provides acceptablebandwidth and is preferable due to its physical length being smaller than the tapered line.Alternatively, at high power levels, where the ITR is high, the bandwidth of the single-section transformer limits the bandwidth of the amplifier and therefore using a double-section transformer or a tapered line is preferred.
The response of the real-to-real transformer versus frequency has an important impacton the performance of the conventional DPA. Here, the case where a single-section trans-former has been used as the real-to-real impedance transformer is discussed as shown inFig.2.11.
It is important to note that any plot in this section is dependent on Ropt and henceon the power level, because the 50Ω load is always constant and the performance of thereal-to-real transformer is a function of its ITR. Here, the plots for the typical case ofRopt = 30Ω (which corresponds to a peak output power of 20 W with 28 V DC supply) areillustrated.
Fig.2.12 shows the normalized Rm and Xm at peak power and 6 dB back-off for the
15

Figure 2.11: The conventional DPA output combiner with single-section quarter-wavetransformer
conventional DPA with a single-section quarter-wave transformer for Ropt = 30Ω. In thiscase Zo = 30Ω, Z1 =
√15 ∗ 50 = 27.5Ω and ITR = 50
Ropt2
= 3.33. In this figure,it has been
assumed that
• @ 6 dB back-off: Ip = 0
• @ peak power: |Ip| = |Im| & ϕp = −π2∗ ffo
Assuming 5% variation inRm at back-off is acceptable within the bandwidth, Fig.2.12(a)shows that the bandwidth of the conventional DPA with a single section transformer isabout 9%, when Ropt = 30Ω. This bandwidth can be increased to 17% using a taperedline as has been shown in the previous part (although the physical length of a tapered lineis much larger than of a single-section transformer). Fig.2.12(a) also suggests that as thefrequency deviates from the center frequency, the efficiency at both 6 dB back-off and peakpower will decrease.
Finally, the schematic of a complete conventional DPA is illustrated in Fig.2.13. Thebiases of the main and peaking transistors are applied either through large inductors (openat AC) or through high-Z λ/4 lines, in order for the bias feeds not to affect the performanceof the amplifier at RF. Also, like most RFPAs, a set of grounding capacitances have by-passed the supply node from low frequencies to operating frequency and at the harmonics.
16

0.85 0.9 0.95 1 1.05 1.112
18
24
30
36
42
48
545760
66
normalized frequency
Rm
6−dB back−offpeak power
x=5%, BW=9%
(a)
0.85 0.9 0.95 1 1.05 1.1−25
−20
−15
−10
−5
0
5
10
15
20
25
normalized frequency
Xm
6−dB back−offpeak power
(b)
Figure 2.12: (a) Rm and (b) Xm of the conventional DPA output combiner at 6 dB back-offand peak power (a single section quarter-wave transformer is used to match 50Ω to Ropt
2)
2.4 Literature Review on wideband DPA
As mentioned in the previous chapter, to address the limited back-off efficiency of RFPAs,efficiency enhancement techniques such as Doherty [2] have been extensively investigatedin the literature. Traditional DPA design methods presented in the literature have beenband-limited (less than 10% fractional bandwidth) due to theoretical and practical issuessuch as offset lines, the quarter-wave transformer, and transistor parasitics.
Several attempts to extend the traditional DPA to amplify multi-standard and multi-band signals have been reported [3]-[20]. The approaches have mainly attempted to extendthe bandwidth of the DPA to incorporate multiple communication bands [3]-[19] or developa multi-band DPA architecture capable of operating at two discrete frequencies [20]. In thiswork, the focus is on extending the bandwidth of the DPA to allow concurrent amplificationof multiple communication signals at multiple bands.
Most of the recent work attempting to extend the bandwidth of the DPA utilizes eitherone or both of the following approaches: relying on a mixed-signal setup to allow theseparate adjustment of input amplitude and phase of the main and peaking transistoracross the bandwidth, or focusing on the output combiner to extend the bandwidth of theDPA.
17

Figure 2.13: Complete schematic of a conventional DPA
18

The first approach, while capable of achieving excellent back-off efficiency and band-width [7]-[9], [19] (e.g., the DPA in [9] maintains more than 50% drain efficiency at 6 dBback-off for 40% fractional bandwidth), requires a more complicated mixed signal setup.Furthermore, concurrent amplification of multi-band signals using such a DPA is morecomplex and has not been presented in the literature.
In the second approach, the authors try to increase the bandwidth by modifying theoutput combiner. For example, authors in [7] and [15] have replaced the quarter-wavetransformer with a lumped component model which alleviates the bandwidth limitation ofthe DPA through absorption of the transistor’s parasitics. Also, new output combiners arepresented in [9], [12], and [13] which mitigates the bandwidth limitation of the traditionaltwo-way DPA for different power back-offs, however, this method requires two differentsupply voltages for the main and peaking transistors which results in a high breakdownvoltage requirement for the peaking transistor.
The focus of two-way DPA has been on efficiency improvement for up to 6 dB back-offrange. For efficient amplification of higher PAPR signals, authors in [14] proposed a newthree-way DPA output combiner to extend the back-off range of the DPA to 9 dB whilemaintaining high bandwidth.The authors in [20] proposed a concurrent dual-band DPA for two wide-spacing frequencies(i.e. 0.85 GHz and 2.33 GHz). For doing so, they replaced all the components of DPAwith their dual-band versions (i.e. dual-band power divider, offset-line, and inverter).
Finally, Table 2.1 summarizes some of the works on wideband two-way DPA, whichprovides a benchmark for comparison to what has been done in this thesis.
19

Table 2.1: Summary of two-way DPA
Technology Frequency (GHz) Gain (dB) Pout (dBm) η(6 dB) min/max(%)
[4] GaN∗∗ 2.2-3 7 40.5 35/48
[5] GaN 3-3.6 10 43 38/43
[6] GaN 1.96-2.46 11 41 40/46
[7]∗ LDMOS∗∗∗ 1.7-2.3 13 43 35/54
[8]∗ GaN 1.96-2.46 13 43 40/54
[9]∗ GaN 1.6-2.4 9 42 50/60
[12] GaN 0.7-1 15.3 49.9 48/57
[16] GaN 1.5-2.14 11 43.8 34/48
[17] GaN 1.7-2.25 49 53/65
[18] GaN 1.6-2.25 53 40/60
∗ Digital input setup has been used.
∗∗ GaN stands for Gallium Nitride.
∗∗∗ LDMOS stands for Laterally Diffused Metal Oxide Semiconductor.
20

Chapter 3
Bandwidth Extension of DPA
3.1 New Approach for Bandwidth Extension of DPA
Fig.3.1 depicts the load variation of the main and peaking transistors versus the normalizedinput voltage at the center frequency of a conventional DPA. This load modulation profilegarantees the perfect linearity and Doherty efficiency. But, as discussed in the previouschapter, as the frequency deviates from the center frequency, because of the dispersivebehaviour of the inverter, the impedances drop and therefore the conventional DPA is nar-rowband. Therefore, In a wideband DPA one needs to maintain the same load modulationprofile of Fig.3.1 over a wide bandwidth.
Fig.3.1 depicts a general DPA in which the main and peaking transistors have beenreplaced with ideal current sources. In a wideband DPA, RL(ω), XL(ω), and ϕ(ω) areneeded to be fined for the following criteria to be satisfied over a wide frequency range(however not larger than one octave due to the short circuited harmonic requirement ofmain amplifier which operates in class B),
• At 6 dB back-off (Ip = 0): Rm = 2Ropt, Xm = 0
• At peak power (|Ip| = |Im|): Rm = Ropt, Xm = 0
• At peak power (|Ip| = |Im|): Rp = Ropt, Xp = 0
where ϕ can be any (even non-linear) function of ω and SM can be any lossless passivenetwork.
21

0 0.25 0.5 0.75 10
0.5
1
1.5
2
2.5
3
3.5
Normalized Input Voltage
Nor
mal
ized
Rm
and
Rp
Rm
Rp
Figure 3.1: Load modulation versus normalized input voltage in a conventional DPA atcenter frequency
Figure 3.2: General Doherty configuration
22

At frequencies where Rm < 2Ropt at back-off and Rm < Ropt at peak power, theefficiency will be lower than that of the ideal case. Frequencies where mag(Zm) > 2Ropt
(Rm > 2Ropt if Xm is sufficiently small) at back-off or mag(Zm) > Ropt (Rm > Ropt if Xm
is small) at peak power are not acceptable because the amplifier will not be linearizableat those frequencies. Although in practice, due to the presence of the harmonics and softtransition to the knee region, Rm can be a few percent larger than the optimal value.Furthermore, Xm needs to be as small as possible (ideally zero) with respect to Ropt versusfrequency and input power, although relatively small reactance values are tolerable.
Regarding Fig.3.1, at 6 dB back-off:
ZBOm = Ropt ∗
RL + jXL + jRopttan(θ)
Ropt + j(RL + jXL)tan(θ)(3.1)
RBOm = real(ZBO
m ) = 2Ropt (3.2)
XBOm = imag(ZBO
m ) = 0 (3.3)
and at peak power:
ZPPm =
((cos(θ) + jRoptsin(θ)
RL+jXL
jsin(θ)Ropt
+ cos(θ)RL+jXL
)(cos(θ)∠ϕ+ 1)
)− jRoptsin(θ)∠ϕ (3.4)
RPPm = real(ZPP
m ) = Ropt (3.5)
XPPm = imag(ZPP
m ) = 0 (3.6)
ZPPp =
(1∠− ϕ) + cos(θ)jsin(θ)Ropt
+ cos(θ)RL+jXL
(3.7)
RPPp = real(ZPP
p ) = Ropt (3.8)
XPPp = imag(ZPP
p ) = 0 (3.9)
Equations 3.2,3.3,3.5,3.6,3.8, and 3.9 constitute a set of six equations with three un-knowns (RL, XL, and ϕ). Since in a DPA, small values of Xm and Xp are tolerable, onlythe criteria on the real parts (equations 3.2, 3.5, and 3.8) need to be considered. Solvingfor RL, XL, and ϕ in equations 3.2, 3.5, and 3.8 results in:
ϕ = −3
4+
1
4
(f
fo
)(3.10)
23

0.8 0.85 0.9 0.95 1 1.05 1.1 1.15 1.2−0.3
−0.2
−0.1
0
0.1
0.2
0.3
0.4
0.5
0.6
normalized frequency (f/fo)
norm
aliz
ed R
L and
XL (
RL/R
opt a
nd X
L/Rop
t)
RL
XL
(a)
0.8 0.85 0.9 0.95 1 1.05 1.1 1.15 1.2−0.5
0
0.5
1
1.5
2
2.5
normalized frequency (f/fo)
norm
aliz
ed R
m, X
m, R
p, Xp
Rm
, BO Xm
, PP Xm
. BO Rm
& Rp, PP X
p, PP
(b)
Figure 3.3: (a) Solution of 3.2, 3.5, and 3.8, (b) Load variation versus frequency at peakpower and back-off corresponding to the solution of 3.2, 3.5, and 3.8
also, RL and XL along with the corresponding RBOm , XBO
m , RPPm , XPP
m , RPPp , and XPP
p areshown in Fig.3.3(a) and Fig.3.3(b), respectively.
It is important to note that although 3.10 is the solution of 3.2, 3.5, and 3.8, this phaseprofile is not easily realizable. therefore, 3.2 and 3.5 for the following three phase profiles,which are close to the 3.10 and at the same time are easy to realize, will be solved.
• ϕ = −π2
(ffo
),this phase profile can be realized using a Wilkinson divider with a
quarter-wave line at the input of the peaking transistor. For this case, the RL andXL along with the corresponding RBO
m , XBOm , RPP
m , XPPm , RPP
p , and XPPp are shown
in Fig.3.4(a) and Fig.3.4(b), respectively.
24

0.8 0.85 0.9 0.95 1 1.05 1.1 1.15 1.2−0.5
−0.4
−0.3
−0.2
−0.1
0
0.1
0.2
0.3
0.4
0.5
normalized frequency (f/fo)
norm
aliz
ed R
L and
XL (
RL/R
opt a
nd X
L/Rop
t)
RL
XL
(a)
0.8 0.85 0.9 0.95 1 1.05 1.1 1.15 1.2−2
−1.5
−1
−0.5
0
0.5
1
1.5
2
2.5
normalized frequency (f/fo)
norm
aliz
ed R
m, X
m, R
p, Xp
R
m, PP R
m, BO X
m, PP X
m, BO R
p, PP X
p, PP
(b)
Figure 3.4: (a) Solution of 3.2, 3.5, when ϕ = −π2
(ffo
), (b) Load variation versus frequency
at peak power and back-off corresponding to the solution of 3.2, 3.5, when ϕ = −π2
(ffo
)
• ϕ = −π2
,this phase profile can be realized using a 90-degree hybrid. For this case,the RL and XL along with the corresponding RBO
m , XBOm , RPP
m , XPPm , RPP
p , and XPPp
are shown in Fig.3.5(a) and Fig.3.5(b), respectively.
0.8 0.85 0.9 0.95 1 1.05 1.1 1.15 1.2−0.4
−0.3
−0.2
−0.1
0
0.1
0.2
0.3
0.4
0.5
0.6
0.7
normalized frequency (f/fo)
norm
aliz
ed R
L and
XL (
RL/R
opt a
nd X
L/Rop
t)
RL
XL
(a)
0.8 0.85 0.9 0.95 1 1.05 1.1 1.15 1.2−1
−0.5
0
0.5
1
1.5
2
2.5
normalized frequency (f/fo)
norm
aliz
ed R
m, X
m, R
p, Xp
R
m, PP R
m, BO X
m, PP X
m, BO R
p, PP R
p, PP
(b)
Figure 3.5: (a) Solution of 3.2, 3.5, when ϕ = −π2, (b) Load variation versus frequency at
peak power and back-off corresponding to the solution of 3.2, 3.5, when ϕ = −π2
25

• ϕ = −π + π2
(ffo
), this phase profile can be realized using a 180-degree hybrid with
a quarter-wave line at the input of the main transistor. For this case, the RL andXL along with the corresponding RBO
m , XBOm , RPP
m , XPPm , RPP
p , and XPPp are shown
in Fig.3.6(a) and Fig.3.6(b), respectively.
0.8 0.85 0.9 0.95 1 1.05 1.1 1.15 1.2−0.2
−0.1
0
0.1
0.2
0.3
0.4
0.5
0.6
normalized frequenncy (f/fo)
norm
aliz
ed R
L and
XL (
RL/R
opt a
nd X
L/Rop
t)
RL
XL
(a)
0.8 0.85 0.9 0.95 1 1.05 1.1 1.15 1.2−1
−0.5
0
0.5
1
1.5
2
2.5
normalized frequency (f/fo)
norm
aliz
ed R
m, X
m, R
p, Xp
Rm
, PP Rm
, BO Xm
, BO Xm
, PP Rp, PP X
p, PP
(b)
Figure 3.6: (a) Solution of 3.2, 3.5, when ϕ = −π + π2
(ffo
), (b) Load variation versus
frequency at peak power and back-off corresponding to the solution of 3.2, 3.5, when
ϕ = −π + π2
(ffo
)
Among the above cases, ϕ = −π2
and ϕ = −π + π2
(ffo
)result in load variations versus
frequency that are close to the case where ϕ = −34
+ 14
(ffo
), but since ϕ = −π
2is simply
realizable using a 90-degree hybrid it is preferable.
After finding the proper value for ZL = RL + jXL, which is depicted in Fig.3.5(a), theimpedance must be synthesized. When doing this, there are two issues to consider:
• Bias and baseband impedance
• Parasitic absorption
In the next two sections, two topologies that realize the proper ZL and satisfy the abovecriteria have been proposed.
26

3.2 Broadband DPA using New TL-based Combiner
Network
The purpose of this chapter is to propose a Doherty combiner that can realize the ZL ofFig.3.5(a) over as wide band as possible. Fig.3.7(a) illustrates the schematic of the firstproposed combiner, where the 50Ω load is usually transformed to RL via a real-to-realimpedance transformer, as illustrated in Fig.3.7(b).
(a) The load impedance is equal to RL (b) A real-to-real impedance transformer trans-forms 50Ω to RL
Figure 3.7: The first proposed Doherty combiner
As shown in Fig.3.7(b), the first proposed combiner adds a quarter-wave short-circuitedstub to the output of the peaking transistor. As will be discussed, the characteristicimpedance of this stub, Z2, has a critical impact on the performance of the proposed DPA.
In both the conventional and the proposed DPA combiners, the values of RL and Zo areequal to Ropt/2 and 2Ropt (when the second efficiency peak occurs at 6 dB back-off from thepeak output power), respectively. Therefore, at the center frequency the performances ofthe proposed and conventional DPAs are identical; the difference being their performanceacross the bandwidth which is determined by Z2.
The value of Ropt and hence RL depends on the output power of the amplifier. Sincethe load value usually is equal to 50Ω, a matching network is needed to transform 50Ω toRL = Ropt/2. For now, is is assumed that RL = Ropt/2 irrespective of frequency (i.e., an
27

extremely wide-band real-to-real impedance transformer such as a tapered line with infinitelength has been used). With this assumption, Rm = real(Zm) and Xm = imag(Zm) versusfrequency for the proposed Doherty combiner can be plotted, where Zm is the impedanceseen by the drain of the main transistor. It is also assumed that the transistors are idealcurrent sources, as depicted in Fig.3.8.
Figure 3.8: The first proposed Doherty combiner with the transistors replaced by currentsources
Fig.3.9 and Fig.3.10 show the normalized Rm and Xm at peak power and 6 dB back-off for the proposed DPA for two different values of Z2 = 2
3Ropt and Z2 = 6
5Ropt. It is
important to note that since the load impedance is Ropt/2, these plots are valid for anyDPA regardless of the power level.
As can be seen from Fig.3.9, if Z2 = 23Ropt, then for Rm at back-off (Ip = 0) at the
center frequency:
if Z2 =2
3Ropt then,
∂Rm
∂f=∂2Rm
∂f 2= 0 @ back − off (3.11)
However, in the conventional DPA, the second order derivative is non-zero. So, Z2 = 23Ropt
results in a flat Rm versus frequency at back-off.
28

0.7 0.8 0.9 1 1.1 1.2 1.3
1
1.1
1.2
1.3
1.4
1.5
1.6
1.7
1.8
1.9
2
normalized frequency
norm
aliz
ed R
m
6−dB back−offpeak power
x=5%, BW=49%
(a) Rm
0.7 0.8 0.9 1 1.1 1.2 1.3−1
−0.8
−0.6
−0.4
−0.2
0
0.2
0.4
0.6
0.8
1
normalized frequency
norm
aliz
ed X
m
6−dB back−offpeak power
(b) Xm
Figure 3.9: The first proposed Doherty combiner with Z2 = 23Ropt
Assuming that 5% variation in Rm at back-off is acceptable within the bandwidth,Fig.3.9(a) shows that the bandwidth of the proposed Doherty is about 49%, irrespectiveof the value of Ropt. But, as mentioned earlier, since the value of normalized Rm at peakpower is larger than 1, the value of Z2 is not useful due to linearity issues. Although Rm
can be a few percent (e.g., 3%) larger than Ropt at peak power as the transition to kneeregion is not abrupt, the result is more than 20% larger which is not acceptable. Therefore,it is needed to find a value for Z2 which makes Rm flat versus frequency at peak power.Setting Z2 = 6
5Ropt, then for Rm at peak power (Ip = Im∠− 90) at the center frequency:
if Z2 =6
5Ropt then,
∂Rm
∂f=∂2Rm
∂f 2= 0 @ peak power (3.12)
29

0.8 0.85 0.9 0.95 1 1.05 1.1 1.15 1.20.9
1
1.1
1.2
1.3
1.4
1.5
1.6
1.7
1.8
1.9
2
2.1
normalized frequency
norm
aliz
ed R
m
6−dB back−offpeak power
x=5%, BW=25%
(a) Rm
0.8 0.85 0.9 0.95 1 1.05 1.1 1.15 1.2−0.8
−0.6
−0.4
−0.2
0
0.2
0.4
0.6
0.8
normalized frequency
norm
aliz
ed X
m
6−dB back−offpeak power
(b) Xm
Figure 3.10: The first proposed Doherty combiner with Z2 = 65Ropt
Again, assuming a 5% variation in Rm at back-off is acceptable within the bandwidth,Fig.3.10(a) shows that the bandwidth of the proposed Doherty is about 25%, irrespective ofthe value of Ropt. In this case, Rm at peak power is flat versus frequency, so the bandwidthof the amplifier is improved without compromising the linearity.
For purposes of comparison, Fig.3.11(a) shows Rm at 6 dB back-off and peak power forZ2 = 2/3Ropt, Ropt ,and 6/5Ropt. Fig.3.11(b) illustrates Rm at 6 dB back-off for both aconventional DPA and the proposed DPA with Z2 = 6
5Ropt.
As will be discussed in the section on baseband impedance, it is important to make Z2
as small as possible. To achieve this, Fig.3.11(a) suggests that one can start with a slightlysmaller value for Ropt and optimize Z2 for bandwidth, as we are ultimately interested insmall variations in Rm rather than zero derivatives across the band, since the percentagevariation of Rm across the band is equal to the percentage variation of the efficiency.
3.2.1 Group Delay
Group delay is relevant to examine in the content of wideband signal amplification. Itsvariation in the conventional and proposed DPA will be reviewed.
• Group delay: τ = − dφdω
30

0.85 0.9 0.95 1 1.05 1.1 1.15 1.2
1
1.2
1.4
1.6
1.8
2
normalized frequency
norm
aliz
ed R
m
6−dB back−off, Z2=2/3*R
opt
peak power, Z2=2/3*R
opt
6−dB back−off, Z2=R
opt
peak power, Z2=R
opt
6−dB back−off, Z2=6/5*R
opt
peak power, Z2=6/5*R
opt
(a)
0.8 0.85 0.9 0.95 1 1.05 1.1 1.15 1.21.7
1.75
1.8
1.85
1.9
1.95
2
normalized frequency
norm
aliz
ed R
m a
t 6−
dB b
ack−
off
proposed Dohertyconventional Doherty
BW=17%
BW=25%
(b)
Figure 3.11: (a) Rm versus frequency for different values of Z2 in the first proposed Doherty,(b) Rm at 6 dB back-off in the proposed and conventional DPA
• Group delay variation (dissipation): D2 = d2φdω2
Fig.3.12 shows the phase of the output voltage, the normalized group delay (−fo ∗ dΦdf
),
and normalized group delay dissipation (f 2o ∗ d2Φ
df2) of the conventional and proposed DPA
versus frequency at three different power levels:
• vin = 0.5 (i.e., 6 dB back-off)
• vin = 0.75 (i.e., 2.5 dB back-off)
• vin = 1 (i.e., peak power)
Fig.3.12 reveals two important points. First, the phase depends on the power level asthe frequency deviate from the center frequency in both cases. This AM/PM is inherent toDPA operation and exists even if all of the components in the amplifier are ideally linear.Second, and more importantly, the group delay dissipation of the proposed DPA is smallerthan that of the conventional DPA (more than 5 times). This feature, along with the lowbaseband impedance level of the proposed DPA (discussed in the next section), makes itsuitable for amplification of wideband signals.
31

0.8 0.85 0.9 0.95 1 1.05 1.1 1.15 1.250
60
70
80
90
100
110
120
130
normalized frequency (f/fo)
phas
e (Φ
) (d
egre
e)
6−dB back−off2.5−dB back−offpeak power
(a) Phase of the conventional DPA
0.8 0.85 0.9 0.95 1 1.05 1.1 1.15 1.250
60
70
80
90
100
110
120
130
normalized frequency (f/fo)
phas
e (Φ
) (d
egre
e)
6−dB back−off2.5−dB back−offpeak power
(b) Phase of the proposed DPA
0.8 0.85 0.9 0.95 1 1.05 1.1 1.15 1.280
90
100
110
120
130
140
150
160
170
180
190
normalized frequency (f/fo)
norm
aliz
ed g
roup
del
ay [−
f oxdΦ
/df]
6−dB back−off2.5−dB back−offpeak power
(c) Normalized group delay of the conventionalDPA
0.8 0.85 0.9 0.95 1 1.05 1.1 1.15 1.280
90
100
110
120
130
140
150
160
170
180
190
normalized frequency (f/fo)
norm
aliz
ed g
roup
del
ay (
−f oxd
Φ/d
f)
6−dB back−off2.5−dB back−offpeak power
(d) Normalized group delay of the proposedDPA
0.8 0.85 0.9 0.95 1 1.05 1.1 1.15 1.2−400
−300
−200
−100
0
100
200
300
400
normalized frequency (f/fo)
norm
aliz
ed g
roup
del
ay d
issi
patio
n (f o2 xd
2 Φ/d
f2 )
6−dB back−off2.5−dB back−offpeak power
(e) Normalized group delay dissipation of theconventional DPA
0.8 0.85 0.9 0.95 1 1.05 1.1 1.15 1.2−60
−40
−20
0
20
40
60
norrmalized frequency (f/fo)
norm
aliz
ed g
roup
del
ay d
issi
patio
n (f o2 xd
2 Φ/d
f2 )
6−dB back−off2.5−dB back−offpeak power
(f) Normalized group delay dissipation of theproposed DPA
Figure 3.12: Phase, group delay, and group delay dissipation of the conventional andproposed DPA versus frequency at three different power levels
32

3.2.2 Baseband Impedance
In a conventional DPA, the bias of the main and peaking transistors are applied eitherthrough a large inductor (open at AC) or through a high-Z λ/4 lines as depicted in Fig.3.13.Most RFPAs include a set of grounding capacitances bypassing the supply node from lowfrequencies to operating frequency and at the harmonics.
Figure 3.13: Applying bias voltage in a conventional DPA
The bias feeds are high-Z so that they will not affect the AC operation of the amplifier.Due to the presence of the DC block capacitors and large inductance of the high-Z lines,usually one (or even more) resonance occurs at the baseband impedance. This has anegative impact when the amplifier is concurrently amplifying multi-band signals as itresults in significant bias supply modulation and degrades the linearity of the amplifier[21].
In the new combiner, the bias of the main and peaking transistors can be appliedthrough the parallel low-Z stub (Z2) as depicted in Fig.3.14. This provides low low-frequency impedance to the drain of the main and peaking transistors, which helps avoidbias supply modulation and improves the linearity and linearizability of the amplifierwhen it is driven with concurrent multi-band modulated signals. Fig.3.15(a) illustratesthe magZm from DC to f=BW for the case where Z2 = 6
5Ropt. Fig.3.15(b) compares the
typical baseband impedance of the conventional and proposed Doherty.
33

Figure 3.14: Applying bias voltage through the parallel λ/4 stub
0 0.05 0.1 0.15 0.2 0.250
0.2
0.4
0.6
0.8
1
1.2
1.4
normalized frequency [0 to BW/fo]
norm
aliz
ed b
aseb
and
impe
danc
e [m
ag(Z
)/R
opt]
main transistorpeaking transistor
(a) (b)
Figure 3.15: (a) The normalized baseband impedance seen by the drain of main andpeaking transistor (Z2 = 6
5Ropt), (b) Typical baseband impedance for the conventional and
the proposed DPA
As can be seen, mag Zm is small for baseband frequencies up to the bandwidth ofthe amplifier. Also, the impedance seen by the peaking device is smaller than the main
34

device since it is connected to ground through a single low-Z λ/4 line. In the real case,after the absorption of the main and peaking transistors’ output capacitances, one usuallywill end up with lines whose lengths are smaller than 90 degrees and this, in turn, willresult in even lower baseband impedance. In the next few sections, it will be shown howusing different real-to-real transformers can further decrease the baseband impedance.
3.2.3 Parasitic Absorption
Another important benefit of the proposed combiner is that the parasitic capacitance of thepeaking transistor can be easily absorbed in the parallel low-Z stub without compromisingthe bandwidth.
3.2.4 Real-to-Real Impedance Transformer
As mentioned earlier, the real-to-real transformer of Fig.3.7(b) transforms the 50Ω load toRopt/2 and usually is a single-section quarter-wave transformer, a multi-section quarter-wave transformer, or a tapered line. The response of the real-to-real transformer versusfrequency has an important impact on the performance of the proposed DPA, because itis part of the SM network in Fig.3.1 and can be designed to shape the ZL profile versusfrequency, as will be discussed in detail below.
The first case to consider is when a single-section transformer is used as the real-to-realimpedance transformer as shown in Fig.3.16.
It is important to note that any plot in this section is dependent on Ropt and henceon the power level, because the 50Ω load remains constant and the performance of thereal-to-real transformer is a function of its ITR. Here, some plots for the typical case ofRopt = 30Ω (which corresponds to peak output power of 20 W with 28 V DC supply) areillustrated.
Fig. 18 shows Rm and Xm of the proposed combiner at back-off and peak power versusfrequency where Ropt = 30Ω. In this case Zo = 30Ω, Z1 =
√15 ∗ 50Ω, and Z2 = 7.6Ω. In
this figure, it is assumed that:
• @ 6 dB back-off: Ip = 0
• @ peak power: |Ip| = |Im| & ϕp = −π2
35

Figure 3.16: The first proposed DPA output combiner with single-section quarter-wavetransformer
0.8 0.85 0.9 0.95 1 1.05 1.1 1.15 1.224
30
36
42
48
54
57
60
normalized frequency
Rm
6−dB back−offpeak power
x=5%, BW=34%
(a)
0.8 0.85 0.9 0.95 1 1.05 1.1 1.15 1.2−20
−15
−10
−5
0
5
10
15
20
normalized frequency
Xm
6−dB back−offpeak power
(b)
Figure 3.17: (a) Rm and (b) Xm of the proposed DPA output combiner at 6 dB back-offof peak power (a single section quarter-wave transformer is used to match 50Ω to Ropt
2)
In this case, Rm is equal to 2Ropt at the center frequency. As the frequency deviate from
36

the center, Rm falls until it reaches a local minimum and then increases. The value of Z2
has been chosen such that Real Zm varies by 5% across the bandwidth. It is importantto note that the ideal Doherty operation occurs only at the center frequency where the loadvaries from 60Ω at back-off to 30Ω at peak power. At frequencies where Real Zm < 60Ωat back-off and Real Zm < 30Ω at peak power the efficiency will be lower than that of thecenter frequency. Frequencies where mag Zm > 60Ω (real (Zm) > 60Ω if Xm is small)at back-off or mag Zm > 30Ω (real (Zm) > 30Ω if Xm is small) at peak power are notacceptable because the amplifier will not be linearizable at these frequencies (although inreality, because the transition to the knee region is not abrupt, such values as 31Ω or 32Ωare still acceptable). Fig.3.17 shows that for the case where Ropt = 30Ω, the bandwidthis about 34% where 5% variation is maintained across the band, which is significantlylarger than the bandwidth of the conventional DPA. In fact, the value of Z2 as a degree offreedom, can be calculated or optimized to make a compromise between the bandwidth ofDPA and the variation of Real Zm across the band. By applying the following criteriaat back-off, one can calculate the value of Z2 for x% variation in Rm.
∂(real(Zm(f))
∂(f)= 0 @ f = fc (3.13)
2Ropt −Real(Zm(fc))
2Ropt
= x (3.14)
Here, fc is the frequency of the local minimum.
Fig.3.18 shows the Re(Zm) of the proposed combiner at back-off and peak power versusfrequency where Ropt = 30Ω. In this case Zo = 30Ω, Z1 =
√15 ∗ 50Ω, Z2 = 7.6Ω (x = 5%),
and Z2 = 8.4Ω (x = 10%). As previously discussed, the bandwidth can be increased atthe cost of increasing the performance variation across the band.
Fig.3.18 shows that the value of Z2 as a degree of freedom can be optimized to eitherincrease the bandwidth at the cost of larger performance variation across the band, orminimize the performance variation across the band for a smaller bandwidth.
For easier comparison, Fig.3.19(a) illustrates the Re(Zm) at back-off and peak powerversus frequency for the conventional and proposed combiners (x = 5%) for Ropt = 30Ω.This figure shows that adding the parallel stub from the drain of the peaking transistorto ground results in significant improvement in the bandwidth. The load modulation andefficiency for the two cases is also illustrated in Fig.3.19(b), Fig.3.19(c), Fig.3.19(d), andFig.3.19(e).
The value of Z2 used in this case was 7.6Ω which is much lower than the case where atapered line was used as the real-to-real transformer (in that case, Z2 = 6/5 ∗Ropt = 36Ω).
37

0.75 0.8 0.85 0.9 0.95 1 1.05 1.1 1.15 1.2 1.2520
30
40
50
60
70
80
90
Normalized frequency
real
(Zm
) at
pea
k po
wer
and
bac
k−of
f
Real(Z
m) @ back−off [x=5%]
Real(Zm
) @ peak power [x=5%]
Real(Zm
) @ back−off [x=10%]
Real(Zm
) @ peak power [x=10%]
BW1=34%, x=5%
BW2=40%, x=10%
Figure 3.18: Rm of the proposed DPA output combiner at back-off and peak power versusfrequency for two different values of Z2
This in turn results in lower baseband impedance for the same power level, as illustratedin Fig.3.20.
As mentioned at the beginning of this section, since the 50Ω load is constant, the ITRincreases as the power level increases and the optimum value of Z2 is not a straightforwardfunction of Ropt. Fig.3.21 depicts the optimum value of Z2 as function of Ropt for the casewhere x = 5%.
At high power levels (low Ropt), with a single section transformer, the value of Z2 willbe too low and is not feasible to implement. In this case, a tapered line can be used as thereal-to-real transformer and Z2 will be larger.
The blue curve in Fig.3.21 represents the case where an N-section quarter-wave trans-former with a large N has been used. The red curve is for the case of N = 1. The optimumvalue of Z2 for the case of N = 2, 3, . . . will be somewhere in between the two curves (asN increases, so does Z2).
In the case of N = 2, the characteristic impedance of one of the quarter-wane lines inthe real-to-real transformer (e.g. Z3) is also a degree of freedom and can be optimized forthe bandwidth. In this case a good strategy is to set Z2 equal to the minimum realizablevalue and optimize Z3 for bandwidth, since for the sake of baseband impedance the lowest(feasible) value of Z2 is preferable.
38

0.8 0.85 0.9 0.95 1 1.05 1.1 1.15 1.20.33
0.66
1
1.33
1.66
2
2.33
normalized frequency
Rm
6−dB back−off, Conventional6−dB back−off, Proposedpeak power, Conventionalpeak power, Proposed
(a)
0 0.2 0.4 0.6 0.8 10.33
0.66
1
1.33
1.66
2
2.33
normalized vin
Rm
f=fo
f=0.95fo, 1.05f
o
f=0.9fo, 1.1f
o
f=0.85fo, 1.15f
o
f=0.83fo, 1.17f
o
(b)
0 0.2 0.4 0.6 0.8 1
1
1.33
1.66
2
normalized vin
Rm
f=fo
f=0.95fo, 1.05f
o
f=0.9fo, 1.1f
o
f=0.85fo, 1.15f
o
f=0.83fo, 1.17f
o
(c)
0 0.2 0.4 0.6 0.8 10
0.1
0.2
0.3
0.4
0.5
0.6
0.7
0.8
normalized vin
Effi
cien
cy
f=fo
f=0.95fo, 1.05 f
o
f=0.9fo, 1.1 f
o
f=0.85fo, 1.15 f
o
f=0.83fo, 1.17 f
o
(d)
0 0.2 0.4 0.6 0.8 10
0.1
0.2
0.3
0.4
0.5
0.6
0.7
0.8
normalized vin
Effi
cien
cy
f=fo
f=0.95fo, 1.05f
o
f=0.9fo, 1.1f
o
f=0.85fo, 1.15f
o
f=0.83fo, 1.17f
o
(e)
Figure 3.19: (a) Rm of the conventional and proposed combiners at back-off and peakpower for Ropt = 30Ω, (b) Load modulation in the conventional DPA, (c) load modulationin the proposed DPA, (d) Efficiency of the conventional DPA, (e) Efficiency of the proposedDPA 39

0 0.05 0.1 0.15 0.2 0.25 0.30
0.2
0.4
0.6
0.8
1
1.2
1.4
normalized frequency (f/fo)
mag
(Zm
/Rop
t) &
(R
opt=
30Ω
)
Z2=6/5*R
opt=36Ω (R
L=R
opt/2)
Z2=7.6Ω (single−section transformer
has been used to transform 50Ω to RL)
Figure 3.20: Normalized baseband impedance seen by the drain of main transistor whenZ2 = 6
5∗Ropt = 36Ω (tapered line) and when Z2 = 7.6Ω (single-section)
10 15 20 25 30 35 40 45 500
10
20
30
40
50
60
Ropt
Z2 (
optim
um fo
r x=
5%)
single section transformertapered line
Figure 3.21: Optimum value of Z2 of the proposed combiner for x = 5%
40

Also, at medium to high power levels where the value of Z2 is too low with a singlesection transformer, the use of a double-section or triple-section transformer is preferableto a tapered line (if that results in a reasonable value for Z2) because of the large physicalsize of tapered lines.
Finally, the schematic of the complete first proposed DPA is illustrated in Fig.3.22.
Figure 3.22: Complete schematic of the first proposed Doherty amplifier
3.3 Broadband DPA using New Combiner Network
with Discrete Resonator
A short-circuited quarter-wave stub is a resonator, whose behaviour around the centerfrequency can be approximated by a parallel LC tank, as depicted in Fig.3.23.
So, in the second proposed combiner the short-circuited quarter-wave stub can be re-placed with its equivalent LC tank, illustrated in Fig.3.24. As a result the bandwidthwill be improved compared to the conventional DPA. It also results in lower group delaydissipation. The output capacitance of the peaking device can be easily absorbed in Ct.
41

Figure 3.23: Short-circuited quarter-wave stub as a resonator
Finally, the inductor Lt can be used as the biasing feed of the main and peaking transistorsas depicted in Fig.3.25 and this again results in low low-frequency impedance.
Figure 3.24: Second proposed output combiner
The parallel LC tank and a short-circuited quarter-wave stub are equivalent aroundthe center frequency, but their behaviour is different at the harmonics. Assuming thatthe capacitor Ct is large enough, the LC tank is effectively short circuited at all of theharmonics while the quarter-wave stub is short at even and is open at odd harmonic. So,the impedance seen by the main transistor at second harmonic is a short circuit and at thirdharmonic is an open circuit due to the presence of a quarter-wave line between the maintransistor and the LC tank. This makes the main amplifier operate in class F mode[22].So, the design equations which are conventionally developed for a class B-C Doherty have
42

Figure 3.25: Applying bias voltage through the tank inductor Lt
to be modified for a class F-C Doherty.
ZL (fo) = RL (3.15)
ZL (2kfo) = 0 (3.16)
ZL ((2k + 1) fo) =∞ (3.17)
Comparing a DPA with its main stage operating in ideal class-F with the conventionalDPA whose main stage is in class-B, one can conclude that,
V Fm =
4
πV Bm (3.18)
where Vm is the magnitude of the fundamental drain voltage of the main transistor, andF and B superscripts represent class-F and B quantities, respectively. Subsequently, thepeak output power of the main stage of the two DPA structures can be written as
PBout,M =
1
2V BM I
BM (3.19)
P Fout,M =
1
2V FMI
FM (3.20)
Assuming that the output power of the two cases are equal, one can deduce the relationbetween the required fundamental voltage and current components of the class-F DPA at
43

peak power in terms of those of the class-B DPA:
V FM =
4
πV BM =
4
π(Vdd − Vk) (3.21)
IFM =π
4IBM (3.22)
where Vdd and Vk denote the drain supply voltage and the transistor knee voltage, respec-tively. In other words, the maximum current provided by the main class-F PA has to scaledown by a factor of π
4= 0.875 for the same output power. Therefore, the optimum load
impedance of the class-F main transistor at full power can be calculated as
RFopt =
V FM
IFM=
(4
π
)2
RBopt (3.23)
Our ultimate goal is to determine the class-F DPA circuit parameters, ZO and RL. Theoutput voltage swing of the peaking transistor, VP , or equivalently the voltage across theload, VL, is related to the current of the main device through the traditional quarter-waveline impedance inverter:
VL = V FP = ZoI
Fm (3.24)
where V FP is the magnitude of the fundamental drain voltage of the peaking transistor
for the DPA whose main stage operates in class-F mode. It is assumed that the peakingtransistor is an ideal class-C PA, with no harmonic tuning, unlike the main PA. In otherwords, at maximum power V F
P = V BP = Vdd − Vk. Consequently, Zo can be calculated by
evaluating (10) at the peak power as in,
Zo =Vdd − VkIFM
(3.25)
or
Zo =4
πRBopt =
π
4RFopt (3.26)
For proper Doherty operation, we should look at the modulation of the impedance ofthe main transistor by the peaking current. This can be easily done by evaluating themain impedance at two power points: 6 dB power back-off where the first efficiency peakoccurs and at peak power. At 6 dB back-off, where the peaking transistor is still off:
ZFm,BO =
Z2o
RL
= 2RFopt (3.27)
44

In fact, 3.27 ensures that the main transistor has a maximum voltage swing and effi-ciency when the input drive is half of its peak value, equivalent to 6 dB input back-off.Substituting 3.23 in 3.27, one can determine the new load resistance, RL in terms of theoptimum load impedance of the class-B main PA as follows:
RL =RBopt
2(3.28)
which is the exact same value as in a conventional class-B DPA. This means that theoutput transformer for matching the standard 50Ω does not need to be changed comparedto the conventional case. At peak power, the impedance of the main device must reduceto RF
opt by proper action of the peaking device:
ZFm,F = Zo
(ZoRL
− IFPIFM
)= RF
opt (3.29)
Therefore, the ratio of the current from the peaking device to that of the main deviceat peak power, is determined to be
IFP =4
πIFM (3.30)
or
IFP =4
πIFM = IBM = IBP (3.31)
As a matter of fact, both the voltage and current swings of the peaking device remainunchanged, and so does the peaking optimum load impedance. Hence, one can calcu-late the impedance seen by the main and peaking transistors when the main device is aharmonically-tuned class-F amplifier as a function of the voltage drive as follows:
Zm(vin) =
2(
4π
)2RBopt, 0 < vin < 0.5(
4π
)2RBopt/vin, 0.5 < vin < 1
(3.32)
Zp(vin) =
∞, 0 < vin < 0.512RBopt
vinvin−0.5
, 0.5 < vin < 1(3.33)
Fig.3.26 displays the main and peaking impedance profiles versus normalized voltagedrive. As can be observed, unlike the class-B DPA, the impedance of the main and peakingtransistors are no longer equal at the peak point.
45

Figure 3.26: Load modulation versus normalized input voltage
The next step is to calculate the required power division ratio between the main andpeaking transistors. Assuming a constant gm for the transistors for simplicity:
V Bin,m
V Fin,m
=IBmIFm
=π
4(3.34)
Consequently,
V Fin,m =
π
4V Bin.m (3.35)
V Fin,p = V B
in,p (3.36)
Therefore, the input power ratio of the main and peaking amplifiers can be expressed as
P Fin,m =
π2
16 + π2Pin (3.37)
P Fin,p =
16
16 + π2Pin =
(4
π
)2
P Fin,m (3.38)
In other words, unlike the conventional class-B DPA, the power has to be unevenly splitbetween the two transistors, with a ratio of 62% to 38% in favour of the peaking device,assuming similar gains for the two cells. Therefore, a new input power divider must bedesigned for the desired division ratio. The drawback would be a decreased gain of about1.2 dB.
Finally, a complete schematic of the second proposed DPA is illustrated in Fig.3.27.
46

Figure 3.27: Complete schematic of the second proposed DPA
47

Chapter 4
Measurement Results
4.1 Fabricated Amplifier Based on the First Proposed
Combiner
In order to validate the first proposed output combiner, a 20W wideband DPA was designedand fabricated using 10 W and 25 W GaN HEMT Cree packaged devices for the mainand peaking transistors, respectively, as shown in Fig. 4.1. At the design power level ,the characteristic impedance of the resonator is chosen equal to 7Ω to make the back-offimpedance flat versus frequency. The same line has also been used as the biasing feed forthe main and peaking transistors.
To assess the performance of the fabricated DPA, efficiency and gain versus outputpower at different frequencies was measured with continuous wave (CW) signals. Fig. 4.2and 4.3 show the measured gain and efficiency of the DPA at different frequencies in theband. As Fig. 4.3 illustrates, the DPA maintains good efficiency across the entire bandwhich supports the theoretically predicted behavior of the proposed Doherty configuration.Fig. 4.4 illustrates the efficiency of the PA at peak output power and 6dB and 10dB back-off versus frequency. it can be seen that the proposed DPA maintains more than 49%efficiency at 6 dB back-off from 1.72 GHz to 2.27 GHz, corresponding to 28% fractionalbandwidth.
The linearity and linearizability of the proposed DPA was validated using single-bandand dual-band modulated signals. The amplifier was linearizable under WCDMA and LTEsingle- and dual-band modulated signal excitations. Fig. 4.5 shows the measured spectrumof the DPA, before and after linearization, when the amplifier was excited with a 20MHz
48

Figure 4.1: Fabricated amplifier based on the proposed combiner
22 25 28 31 34 37 40 435
6
7
8
9
10
11
Pout
(dBm)
Gia
n (d
B)
1.72 GHz1.8 GHz1.9 GHz2 GHz2.1 GHz2.2 GHz2.27 GHz
Figure 4.2: Measured CW gain versus output power for the proposed DPA.
49

22 25 28 31 34 37 40 430
10
20
30
40
50
60
70
Pout
(dBm)
DE
(%
)
1.72 GHz1.8 GHz1.9 GHz2 GHz2.1 GHz2.2 GHz2.27 GHz
Figure 4.3: Measured CW efficiency versus output power for the proposed DPA.
1800 1900 2000 2100 220030
35
40
45
50
55
60
65
70
Frequency (MHz)
Dra
in E
ffici
ency
(%
)
peak power6 dB back−off10 dB back−off
Figure 4.4: Measured efficiency at peak output power and 6-dB and 10-dB back-off for theproposed DPA versus frequency.
50

WCDMA signal at 1.8GHz, 2GHz, and 2.2GHz. The amplifier achieved 52 dB adjacentchannel leakage ratio at an average output power of 36.9 dBm and exhibited an averagedrain efficiency of 53% at 1.8GHz, 55% at 2GHz, and 48% at 2.2GHz, with a PAPR of7.14 dB.
1740 1760 1780 1800 1820 1840 1860−60
−50
−40
−30
−20
−10
0PSD
Frequency (MHz)
Nor
mal
ized
PS
D (
dBc/
Hz)
Without DPDAfter DPD
32 dB
52 dB
(a)
1940 1960 1980 2000 2020 2040 2060−60
−50
−40
−30
−20
−10
0PSD
Frequency (MHz)
Nor
mal
ized
PS
D (
dBc/
Hz)
Without DPDAfter DPD
33 dB
52 dB
(b)
2140 2160 2180 2200 2220 2240 2260−60
−50
−40
−30
−20
−10
0PSD
Frequency (MHz)
Nor
mal
ized
PS
D (
dBc/
Hz)
Without DPDAfter DPD
52 dB
29 dB
(c)
Figure 4.5: Measured spectrum of the output of the first proposed DPA before and afterlinearization when driven with four-carrier WCDMA signal at (a) 1.8 GHz, (b) 2 GHz,and (c) 2.2GHz.
Fig. 4.6 shows the measured spectrum of the DPA, before and after linearization, when
51

the amplifier was excited with a 80 MHz signal at 2 GHz. The amplifier achieved 48 dBadjacent channel leakage ratio at an average output power of 32.7 dBm and exhibited anaverage drain efficiency of 35% , with a PAPR of 10.25 dB.
1800 1850 1900 1950 2000 2050 2100 2150 2200−60
−50
−40
−30
−20
−10
0PSD
Frequency (GHz)
Nor
mal
ized
PS
D (
dBc)
Before DPDAfter DPD
29 dB
48 dB
Figure 4.6: Measured spectrum of the output of the first proposed DPA before and afterlinearization when driven with 80MHz modulated signal.
Fig. 4.7 shows the measured spectrum of the DPA, before and after linearization, whenthe amplifier was concurrently excited with 15 MHz WCDMA (101) and 15 MHz LTEsignals at 1750 MHz and 2250 MHz respectively. The linearization was conducted usinga dual-band base-band equivalent Volterra based digital pre-distortion. The amplifierachieved 52 dB and 51 dB adjacent channel leakage ratio for the two bands at an averageoutput power of 33.6 dBm and exhibited an average drain efficiency of 36% , with acombined PAPR of 9.4 dB.
52

1700 1720 1740 1760 1780 1800−70
−60
−50
−40
−30
−20
−10
0PSD
Frequency (MHz)
Nor
mal
ized
PS
D (
dBc/
Hz)
Without DPDAfter DPD
52 dB34 dB
(a) Band I − 15 MHz WCDMA at 1750 MHz
2200 2220 2240 2260 2280 2300−60
−50
−40
−30
−20
−10
0PSD
Frequency (MHz)
Nor
mal
ized
PS
D (
dBc/
Hz)
Without DPDAfter DPD
51 dB
31 dB
(b) Band II − 15 MHz LTE at 2250 MHz
Figure 4.7: Measured spectrum of the output of the first proposed DPA before and afterlinearization when driven with dual-band modulated signal.
4.2 Fabricated Amplifier Based on the Second Pro-
posed Combiner
In order to validate the second proposed output combiner, a 20 W wideband DPA wasdesigned and fabricated using 10W and 25W GaN HEMT Cree packaged devices for themain and peaking transistors, respectively, as shown in Fig. 4.8. The design parametervalues are presented in Table 4.1. At the design power level and frequency, the resonancetank inductance and capacitance have been chosen equal to 1.9nH and 19 pF to make theback-off impedance flat versus frequency. The resonance inductor, Lt, was realized using ashort transmission line which was also used as the biasing feed for the main and peakingtransistors.
To assess the performance of the fabricated DPA, efficiency and gain versus outputpower at different frequencies was measured with continuous wave (CW) signals. Fig. 4.9and 4.10 show the measured gain and efficiency of the DPA at different frequencies in theband. As Fig. 4.10 illustrates, the DPA maintains good efficiency across the entire bandwhich supports the theoretically predicted behavior of the proposed Doherty configuration.Fig. 4.11 illustrates the efficiency of the PA at peak output power and 6 dB and 10 dB
53

Table 4.1: Summary of the design parameters of the second proposed DPA
Design Parameter Expression Value
RFopt
(4π
)2RBopt 48.6 Ω
Zo4πRBopt = π
4RFopt 38 Ω
RLRB
opt
215 Ω
P Fin,m
π2
16+π2Pin 0.38Pin
P Fin,p
1616+π2Pin =
(4π
)2P Fin,m 0.62Pin
Figure 4.8: Fabricated amplifier based on the proposed combiner
54

back-off versus frequency. it can be seen that the proposed DPA maintains more than 48%efficiency at 6 dB back-off from 700 MHz to 950 MHz, corresponding to 30% fractionalbandwidth.
22 25 28 31 34 37 40 4310
11
12
13
14
15
16
Output power (dBm)
Gai
n (d
B)
700 MHz
750 MHz
800 MHz
850 MHz
900 MHz
950 MHz
Figure 4.9: Measured CW gain versus output power for the proposed DPA.
22 25 28 31 34 37 40 430
10
20
30
40
50
60
70
Output Power (dBm)
Dra
in E
ffici
ency
700 MHz750 MHz800 MHz850 MHz900 MHz950 MHz
Figure 4.10: Measured CW efficiency versus output power for the proposed DPA.
The linearity and linearizability of the proposed DPA was validated using single-bandand dual-band modulated signals. The amplifier was linearizable under WCDMA andLTE single- and dual-band modulated signal excitations. Fig. 4.12 shows the measuredspectrum of the DPA, before and after linearization, when the amplifier was excited with a40MHz signal at 825MHz. The amplifier achieved 48 dB adjacent channel leakage ratio
55

700 750 800 850 900 95035
40
45
50
55
60
65
70
75
Frequency (MHz)
Effi
cien
cy
@ peak output power
@ 6−dB back−off
@ 10−dB back−off
Figure 4.11: Measured efficiency at peak output power and 6-dB and 10-dB back-off forthe proposed DPA versus frequency.
at an average output power of 34.5 dBm and exhibited an average power added efficiencyof 46% , with a combined PAPR of 8.45 dB.
Fig. 4.13 shows the measured spectrum of the DPA, before and after linearization,when the amplifier was concurrently excited with 15 MHz WCDMA (101) and 15 MHzLTE signals at 750 MHz and 900 MHz respectively. The linearization was conductedusing a dual-band base-band equivalent Volterra based digital pre-distortion. Twenty-fivecoefficients were used in each band. The amplifier achieved 50 dB and 48 dB adjacentchannel leakage ratio for the two bands at an average output power of 33.5 dBm andexhibited an average power added efficiency of 42% , with a combined PAPR of 9.4 dB.
56

740 765 785 805 825 845 865 885 900−60
−50
−40
−30
−20
−10
0
Frequency (MHz)
Nor
mal
ized
PS
D (
dBc)
Before DPDAfter DPD
36.6 dB48.4 dB
Figure 4.12: Measured spectrum of the output of the second proposed DPA before andafter linearization when driven with 40MHz modulated signal.
700 710 720 730 740 750 760 770 780 790 800−60
−50
−40
−30
−20
−10
0
Frequency (MHz)
Nor
mal
ized
PS
D (
dBc)
Before DPDAfter DPD
50 dB
33.6 dB
(a) Band I − 15 MHz WCDMA at 750 MHz
850 860 870 880 890 900 910 920 930 940 950−60
−50
−40
−30
−20
−10
0
Frequency (MHz)
Nor
mal
ized
PS
D (
dBc)
Before DPDAfter DPD
34.7 dB
48.2 dB
(b) Band II − 15 MHz LTE at 900 MHz
Figure 4.13: Measured spectrum of the output of the second proposed DPA before andafter linearization when driven with dual-band modulated signal.
57

Chapter 5
Conclusions and Future Works
5.1 Conclusions
This thesis tried to address some of the challenges that future power amplifiers are facing,specifically the high PAPR of signals and carrier aggregation. The thesis started witha brief overview of conventional classes of operation of RFPAs and introduced differentfigures of merit. Then, chapter two explained the key idea behind the Doherty operation.After that, it moved to the bandwidth analysis of the conventional DPA. Finally, chaptertwo ended with literature review on wideband DPAs.
In chapter three, the new perspective from which we looked at the wideband DPAproblem has been explained. Deriving the governing equations, it was shown how thisproblem can be converted into an impedance synthesization problem. Then, two networksto realize the desired impedances were proposed. In doing so, we were also careful about thebaseband impedance and it was explained why it is important to maintain low basebandimpedance, especially when dealing with carrier aggregated signals.
The new combiners will have the following beneficial impacts on the performance ofthe DPA:
• improved bandwidth
• improved baseband impedance
• improved group delay dissipation
• ease of parasitic absorption
58

Theoretically, the efficiency of the second proposed DPA is larger than that of the first( 4π
times), but its gain is smaller (π4
times = −1.2 dB).
Two GaN DPAs were fabricated based on the proposed combiners. The measurementresults have been provided to validate the developed theory. The first amplifier covers1.72 GHz to 2.27 GHz and the second one covers 700 MHz to 950 MHz and bothmaintain higher than 48% of drain efficiency at 6 dB back-off across the band. Thetwo amplifiers are successfully linearized when driven with extra wideband and multibandcarrier aggregated modulated signals.
The Table 5.1 compares the two fabricated PAs of this work with some of the references:
Table 5.1: Performance comparison
Technology Frequency (GHz) Gain (dB) Pout (dBm) η(6 dB)
min/max(%)
[4] GaN 2.2-3 (31%) 7 40.5 35/48
[5] GaN 3-3.6 (18%) 10 43 38/43
[6] GaN 1.96-2.46 (23%) 11 41 40/46
[12] GaN 0.7-1 (35%) 15.3 49.9 48/57
[16] GaN 1.5-2.14 (34%) 11 43.8 34/48
[17] GaN 1.7-2.25 (28%) 49 53/65
[18] GaN 1.6-2.25 (34%) 53 40/60
PA 1∗ GaN 1.72-2.27 (28%) 9.5 43 49/53
PA 2∗ GaN 0.7-0.95 (30%) 14 43 48/59
∗ Capable of concurrently amplifying carrier aggregated signals.
59

5.2 Future Work
As future work, one can try the Laterally Diffused MOS (LDMOS) based DPAs withthe proposed combiners to validate the effectiveness of the new approach with LDMOStransistors as well. Especially for the applications that are targeting higher power at lowerfrequency bands.
Another possibility is to try to find new networks to realize the desired impedance(e.g. using the simplified real frequency technique (SRFT)) and compare the properties ofdifferent networks in terms of bandwidth, efficiency and linearity. This might help to findDPAs in which the main and auxiliary transistors are operating at different classes thanthe conventional class B-C (e.g. in the second proposed combiner the main transistor isoperating at class-F which resulted in higher back-off efficiency when the auxiliary transis-tor is off). In this view, finding a DPA whose main (and auxiliary) are operating at class-Jwould be valuable.
60

References
[1] J. Wannstrom. (2013) Carrier Aggregation explained [Online]. Available FTP:http://www.3gpp.org/technologies/keywords-acronyms/101-carrier-aggregation-explained
[2] W. H. Doherty, A new high efficiency power amplifier for modulated waves, Proceedingsof the Institute of Radio Engineers, vol. 24, pp. 11631182, Sep. 1936.
[3] K. Bathich, A. Z. Markos, and G. Boeck, Frequency response analysis and bandwidthextension of the Doherty amplifier, IEEE Transactions on Microwave Theory and Tech-niques, vol. 59, no. 4, pp. 934944, Apr. 2011.
[4] G. Sun and R. H. Jansen, Broadband Doherty power amplifier via real frequency tech-nique, IEEE Transactions on Microwave Theory and Techniques, vol. 60, no. 1, pp.99111, Jan. 2012.
[5] J. M. Rubio, J. Fang, V. Camarchia, R. Quaglia, M. Pirola, and G. Ghione, 33.6-GHzwideband GaN Doherty power amplifier exploiting output compensation stages, IEEETransactions on Microwave Theory and Techniques, vol. 60, no. 8, p. 25432548, Aug.2012.
[6] M. Akbarpour, M. Helaoui, and F. M. Ghannouchi, A transformerless load-modulated(TLLM) architecture for efficient wideband power amplifiers, IEEE Transactions onMicrowave Theory and Techniques, vol. 60, no. 9, p. 28632874, Sep. 2012.
[7] J. H. Qureshi, N. Li, W. C. E. Neo, F. Rijs, I. Blednov, and L. C. N. de Vreede, A wide-band 20W LMOS Doherty power amplifier, in IEEE MTT-S International MicrowaveSymposium Digest, Anaheim, CA, May 2010, pp. 1504 1507.
[8] R. Darraji, F. M. Ghannouchi, and M. Helaoui, Mitigation of bandwidth limitationin wireless Doherty amplifiers with substantial bandwidth enhancement using digital
61

techniques, IEEE Transactions on Microwave Theory and Techniques, vol. 60, no. 9, p.28752884, Sep. 2012.
[9] D. Gustafsson, C. M. Andersson, and C. Fager, A modified Doherty power amplifierwith extended bandwidth and reconfigurable efficiency, IEEE Transactions on MicrowaveTheory and Techniques, vol. 61, no. 1, pp. 533 542, Jan. 2013.
[10] C. Ma, W. Pan, S. Shao, C. Qing, and Y. Tang, A wideband Doherty power am-plifier with 100 MHz instantaneous bandwidth for LTE-advanced applications, IEEEMicrowave and Wireless Components Letters, vol. 23, no. 11, pp. 614 616, Nov. 2013.
[11] J. Xia, X. Zhu, L. Zhang, J. Zhai, and Y. Sun, High-efficiency GaN Doherty poweramplifier for 100-MHz LTE-advanced application based on modified load modulationnetwork, IEEE Transactions on Microwave Theory and Techniques, vol. 61, no. 8, pp.2911 2921, Aug. 2013.
[12] D. Y.-T. Wu and S. Boumaiza, A modified Doherty configuration for broadband ampli-fication using symmetrical devices, IEEE Transactions on Microwave Theory and Tech-niques, vol. 60, no. 10, pp. 32013213, Oct. 2012.
[13] D. Wu and S. Boumaiza, A mixed-technology asymmetrically biased extended andreconfigurable Doherty amplifier with improved power utilization factor, IEEE Transac-tions on Microwave Theory and Techniques, vol. 61, no. 5, pp. 19461956, May 2013.
[14] H. Golestaneh, F. A. Malekzadeh, and S. Boumaiza, An extended bandwidth three-way Doherty power amplifier, IEEE Transactions on Microwave Theory and Techniques,vol. 61, no. 9, pp. 3318 3328, Sep. 2013.
[15] D. Kang, D. Kim, Y. Cho, B. Park, J. Kim, and B. Kim, Design of bandwidth-enhanced Doherty power amplifiers for handset applications, IEEE Transactions on Mi-crowave Theory and Techniques, vol. 59, no. 12, pp. 34743482, Dec. 2011.
[16] K. Bathich, A. Markos, and G. Boeck, A wideband GaN Doherty amplifier with 35
[17] K. Bathich and G. Boeck, Wideband hamonically-tuned GaN Doherty power amplifier,in IEEE MTT-S International Microwave Symposium Digest, Montreal, QC, Canada,Jun. 2012, pp. 13.
[18] K. Bathich, M. T. Arnous, and G. Boeck, Design of 200 W wideband Doherty amplifierwith 34
62

[19] D. Gustafsson, J. C. Cahuana, R. Hellberg, and C. Fager, A 13-GHz digitally con-trolled dual-RF input power-amplifier design based on a Doherty-Outphasing continuumanalysis, IEEE Transactions on Microwave Theory and Techniques, vol. 61, no. 10, pp.3743 3752, Oct. 2013.
[20] W. Chen, S. Zhang, Y. Liu, Y. Liu, and F. M. Ghannouchi, Concurrent dual-banduneven Doherty power amplifier with frequency-dependent input power division, IEEETransactions on Circuits and Systems I: Regular Papers, vol. 61, no. 2, pp. 552561, Feb.2013.
[21] S. C. Cripps, “Advanced Techniques in RF Power Amplier Design,” Norwood, MA,Artech House, 2002.
[22] T. H. Lee,“The Design of CMOS Radio-Frequency Integrated Circuits,” CambridgeUniversity Press, 2004.
63