extent of road lighting impact on the quality of...
TRANSCRIPT

EXTENT OF ROAD LIGHTING IMPACT ON THE QUALITY OF ROADWAY
SERVICE
AZTRI YULI KURNIA
A project report submitted in partial fulfillment of the
requirements for the award of degree of
Master of Engineering (Civil - Transportation and Highway)
Faculty of Civil Engineering
Universiti Teknologi Malaysia
JANUARY 2012

iii
To my beloved mommy and daddy

iv
ACKNOWLEDGEMENT
First and foremost, I would like to express my sincere thanks and
appreciation to my project supervisor Assoc. Prof. Dr. Johnnie Ben-Edigbe, who
continuously guided me throughout every step of my study and generously shared his
time and knowledge with me.
My special thanks to lecturers who have given knowlegde and guidance
during my study, staff members of FKA especially Department of Geothechnics and
Transportation for their help and assistance.
Million words of thanks to my parents, sisters, brothers, and my beloved for
their support and encouragement in all my life. Big thanks for MAP classmates and
best friends who showed their concern and support all the way. Unfortunately, it is
not possible to list all of them in this limited space.
v
ABSTRACT
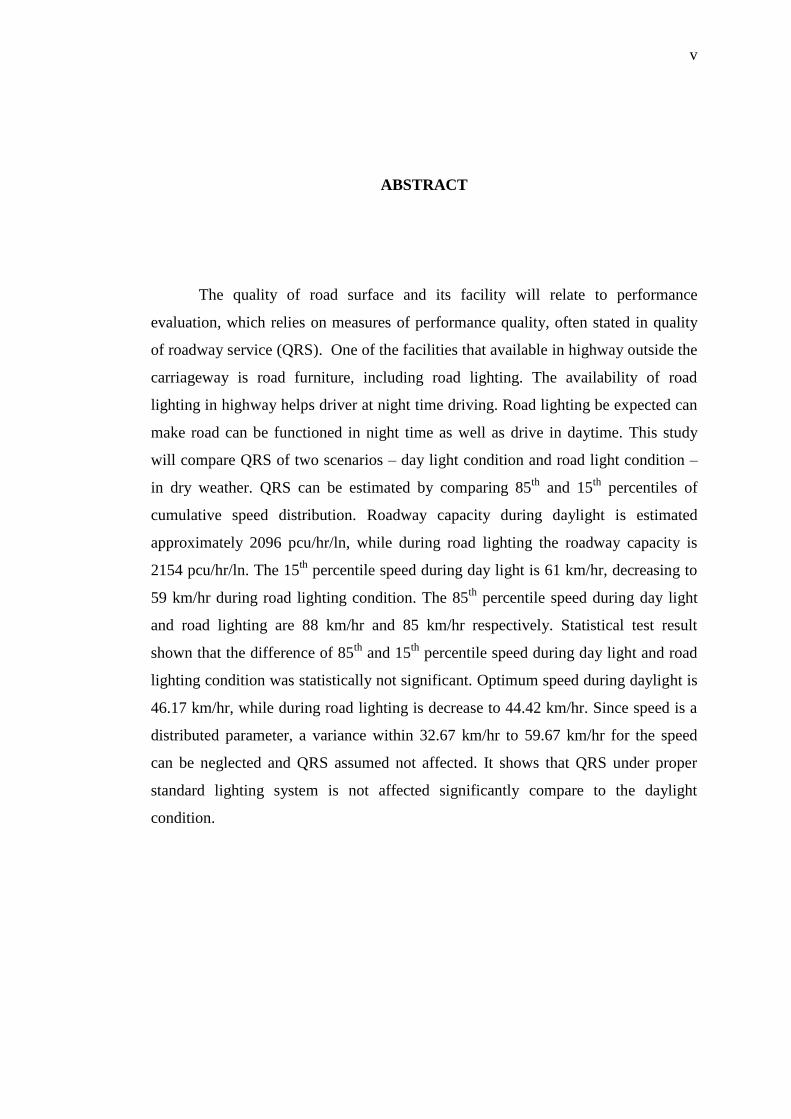
The quality of road surface and its facility will relate to performance
evaluation, which relies on measures of performance quality, often stated in quality
of roadway service (QRS). One of the facilities that available in highway outside the
carriageway is road furniture, including road lighting. The availability of road
lighting in highway helps driver at night time driving. Road lighting be expected can
make road can be functioned in night time as well as drive in daytime. This study
will compare QRS of two scenarios – day light condition and road light condition –
in dry weather. QRS can be estimated by comparing 85th
and 15th
percentiles of
cumulative speed distribution. Roadway capacity during daylight is estimated
approximately 2096 pcu/hr/ln, while during road lighting the roadway capacity is
2154 pcu/hr/ln. The 15th
percentile speed during day light is 61 km/hr, decreasing to
59 km/hr during road lighting condition. The 85th
percentile speed during day light
and road lighting are 88 km/hr and 85 km/hr respectively. Statistical test result
shown that the difference of 85th
and 15th
percentile speed during day light and road
lighting condition was statistically not significant. Optimum speed during daylight is
46.17 km/hr, while during road lighting is decrease to 44.42 km/hr. Since speed is a
distributed parameter, a variance within 32.67 km/hr to 59.67 km/hr for the speed
can be neglected and QRS assumed not affected. It shows that QRS under proper
standard lighting system is not affected significantly compare to the daylight
condition.

vi
ABSTRAK
Kualiti permukaan jalan dan kemudahan yang berkaitan dengan penilaian
prestasi, bergantung kepada prestasi kualiti yang diukur, yang dinyatakan dalam
kualiti perkhidmatan jalan (QRS). Salah satu kemudahan yang disediakan di luar
laluan lebuh raya adalah perabot jalan, termasuk lampu jalan. Penggunaan lampu
jalan di lebuh raya membantu pemandu di waktu malam. Lampu jalan dijangkakan
boleh membuat jalan berfungsi pada waktu malam serta pemanduan di siang hari.
Kajian ini akan membandingkan QRS bagi dua senario – keadaan siang dan keadaan
malam pada cuaca kering. QRS boleh dianggarkan dengan membandingkan 85 dan
15 persentil agihan laju kumulatif. Kapasiti jalan raya pada waktu siang hari
dianggarkan kira-kira 2096 pcu/hr/ln, manakala semasa malam hari kapasiti jalan
2154 pcu/hr/ln. Kelajuan 15 persentil semasa siang hari adalah 61 km/hr,
berkurangan kepada 59 km/hr dalam keadaan malam hari. Kelajuan 85 persentil
semasa siang hari dan malam hari, masing-masing adalah 88 km/hr dan 85 km/hr.
Keputusan ujian statistik menunjukkan bahawa perbezaan kelajuan 85 dan 15
persentil semasa siang hari dan keadaan malam hari adalah tidak signifikan secara
statistik. Kelajuan optimum pada waktu siang hari adalah 46,17 km/hr, manakala
semasa malam hari menurun kepada 44,42 km/hr. Oleh kerana kelajuan adalah
parameter teragih, varians untuk kelajuan dalam lingkungan 32,67 km/hr hingga
59,67 km/hr boleh diabaikan dan QRS dianggap tidak terjejas. Ini menunjukkan
bahawa QRS pada malam hari di bawah sistem lampu piawaian yang betul tidak
terjejas dengan ketara berbanding dengan keadaan siang hari.
vii
TABLE OF CONTENTS
CHAPTER TITLE PAGE
DECLARATION ii
DEDICATION iii
ACKNOWLEDGEMENTS iv
ABSTRACT v
ABSTRAK vi
TABLE OF CONTENTS vii
LIST OF TABLES xii
LIST OF FIGURES xiv
LIST OF APPENDICES xvi
LIST OF SYMBOLS AND ABBREVIATIONS xvii
1 INTRODUCTION 1
1.1 Introduction 1
1.2 Statement of the Problem 2
1.3 Aim and Objective of the Study 3

viii
1.4 Scope 3
1.5 Significant of the Study 4
2 LITERATURE REVIEW 5
2.1 Introduction 5
2.2 Road Lighting 5
2.2.1 Objectives of Road Lighting 5
2.2.2 Road Lighting Terminology 6
2.2.2.1 Photometric Terms 6
2.2.2.2 Installation Terms 7
2.3 Traffic Stream Parameter 10
2.3.1 Volume and Rate of Flow 10
2.3.2 Speed 12
2.3.3 Density 14
2.3.4 Relationship of Flow, Speed, and
Density
14
2.4 Greenshield’s Macroscopic Stream Model 15
2.5 Roadway Capacity 17
2.5.1 Passenger Car Equivalent 18
2.6 Level-of-Service 20
2.6.1 Level-of-Service Based on Highway
Capacity Manual
20
ix
2.6.2 Level-of-Service Based on Malaysian
Standard
21
2.7 Factors Affecting Capacity and Quality of
Roadway Service
22
2.8 The 85th
and 15th
Percentile Speeds 24
2.8.1 Asymptotic Distribution of Sample
Quantiles
25
2.8.2 Asymptotic Distribution of 85th
Sample
Quantile From The Normal Distribution
26
2.9 Linear Regression 27
3 METHODOLOGY 28
3.1 Introduction 28
3.2 Data Requirement 28
3.3 Location Selected 29
3.4 Data Collection 30
3.4.1 Data Collection Equipments 30
3.4.2 Data Collection Method 30
3.4.3 Data Extraction 31
3.4.4 Data Collection Time 32
3.5 Study Hypotheses 33
3.6 Data Analysis 33
3.7 Summary 35

x
4 FINDINGS 36
4.1 Introduction 36
4.2 Site Characteristics 36
4.2.1 Site Geometry 36
4.2.2 Road Lighting Geometry 37
4.3 Existing Data 37
4.3.1 Traffic Proportion 37
4.3.2 Peak Hour 38
4.3.2 Period for Comparison 40
4.4 Data Analysis 42
4.4.1 85th
and 15th
Percentile Speeds 42
4.4.2 Flow, Speed, Density of Traffic 45
4.4.3 Flow – Density Relationship During Day
Light
51
4.4.4 Flow – Density Relationship During
Road Lighting
54
4.4.5 Speed – Flow Relationship During Day
Light
57
4.4.6 Speed – Flow Relationship During Road
Lighting
59
4.5 Comparison of Model 61

xi
5 CONCLUSIONS AND RECOMMENDATIONS 68
5.1 Conclusions 68
5.2 Recommendations 69
REFERENCES 70
APPENDICES 72 - 80

xii
LIST OF TABLES
TABLE NO. TITLE PAGE
2.1 Absolute Minimum Setback 8
2.2 Projection Length 9
2.3 Conversion Factors to p.c.u 19
2.4 ARX Classification Scheme 19
2.5 Definition of level of service (LOS) for highways 21
3.1 Vehicle Classification 32
4.1 Selected Dates for Analysis 42
4.2 Speed Statistics for Day Light Condition 43
4.3 Speed Statistics for Road Light Condition 43
4.4 Speed Statistics 45
4.5 Speed – Flow – Density Data on May 31, 2010 46
4.6 Speed – Flow – Density Data on June 1, 2010 46
4.7 Speed – Flow – Density Data on June 2, 2010 46
4.8 Speed – Flow – Density Data on June 3, 2010 47
4.9 Speed – Flow – Density Data on June 4, 2010 47
4.10 Speed – Flow – Density Data on June 7, 2010 47

xiii
4.11 Speed – Flow – Density Data on June 8, 2010 48
4.12 Speed – Flow – Density Data on June 9, 2010 48
4.13 Speed – Flow – Density Data on June 10, 2010 48
4.14 Speed – Flow – Density Data on June 11, 2010 49
4.15 Speed – Flow – Density Data on June 14, 2010 49
4.16 Speed – Flow – Density Data on June 15, 2010 49
4.17 Speed – Flow – Density Data on June 16, 2010 50
4.18 Speed – Flow – Density Data on June 17, 2010 50
4.19 Speed – Flow – Density Data on June 18, 2010 50
4.20 Result of Statistical Test on 85th
Percentiles Speed 61
4.21 Result of Statistical Test on 15th
Percentiles Speed 62
4.22 Day Light VS Road Lighting 62
4.23 Result of Statistical Test Day Light VS Road Lighting 67

xiv
LIST OF FIGURES
FIGURE NO. TITLE PAGE
1.1 Site Map 4
2.1 Lantern Projection Length 9
2.2 Greenshield’s Speed – Density Model 15
2.3 Speed vs. Density Diagram 16
2.4 Flow vs. Density Diagram 16
2.5 Speed vs. Flow Diagram 17
3.1 Automatic Traffic Count (ATC) 30
3.2 ATC in Study Site 31
3.3 Flow – Density Relationship 34
3.4 Flow Chart of the Study 35
4.1 Traffic Proportion 38
4.2 AM Peak Hour 39
4.3 PM Peak Hour 40
4.4 Vehicle Flow 41
4.5 Vehicle Flow Typical Pattern 41
4.6 Comparative of Cumulative Speed Distribution Curve 44

xv
4.7 Regression Parameter of Flow – Density During Day Light 51
4.8 Flow – Density Diagram Day Light Condition 52
4.9 Flow – Density Scatter Diagram During Day Light
Condition
53
4.10 Flow – Density Relationship During Day Light Condition 53
4.11 Regression Parameter of Flow – Density During Road
Lighting
54
4.12 Flow – Density Diagram Road Lighting Condition 55
4.13 Flow – Density Scatter Diagram During Road Lighting
Condition
56
4.14 Flow – Density Relationship During Road Lighting
Condition
56
4.15 Speed – Density Relationship Under Day Light Condition 58
4.16 Speed – Flow Relationship During Day Light 59
4.17 Speed – Density Relationship Under Road Lighting
Condition
60
4.18 Speed – Flow Relationship During Road Lighting 61
4.19 Flow – Density Comparison 63
4.20 Transformation Diagram of Flow – Density 64
4.21 Speed – Flow Comparison 65
4.22 Acceptable Speed Range 66

xvi
LIST OF APPENDICES
APPENDIX TITLE PAGE
A ATC Data 72
B Vehicle Count 77
C Statistical Analysis 80

xvii
LIST OF SYMBOLS AND ABBREVIATIONS
a Deceleration rate
AASHTO American Association State Highway Transportation Officials
ADT Average Daily Traffic (veh)
ATC Automatic Traffic Count
B.S British Standards
cd Candela
CI Confidence Interval
d Distance travelled (km)
FFS Free-Flow Speed (km/h)
ft Foot
h hour
H1 Alternative hypothesis
HCM Highway Capacity Manual
HGV Heavy Goods Vehicle
Ho Null hypothesis
JKR Jabatan Kerja Raya
k Density (veh/km)
kc Critical density (veh/km)

xviii
kj Jam density (veh/km)
km Kilometer
lm Lumen
LOS Level of Service
lx Lux
m Meter
mi Mile
M.S Malaysian Standards
n Number of observed vehicles
PCE Passenger Car Equivalent
p.c.u Passenger Car Unit
PHF Peak-Hour Factor
PI Prediction Interval
q Flow (veh/h)
qm Maximum flow (veh/h)
SE Standard Error
ti Time for vehicle i to traverse d (h)
tp-r Perception-Reaction Time (sec)
TRRL Transport and Road Research Laboratory
u Speed (km/h)
uf Free-flow speed (km/h)
uo Optimum speed (km/h)

xix
Space mean speed (km/h)
Time mean speed (km/h)
UTM Universiti Teknologi Malaysia
Vd Design speed (km/h)
veh Vehicle
x Length of road (km)

CHAPTER 1
INTRODUCTION
1.1 Introduction
Highway is the important aspect in life because it supports people movement
to do their daily activity. It is also the important aspect in economic growth in a
country. Economic growth can be directly related to the highways such as
transportation of goods from factory to be distributed, people activity to go to work,
or even family trip to recreational place.
Road lighting is an important infrastructure facility. Initially, lighting was to
enable pedestrians to move about in cities at night without being attacked. Currently
road lighting installed because of its ability to reduce night time accident and driver
comfort (Holmes; 1997). Moreover, road lighting has function to illuminate
adequately the road surface and objects on the road and its surrounding areas to be
visible enough to ensure that the driving task is performed successfully (Aleksanteri
E. et al., 2008). From engineer’s point of view, primary object of road lighting is to
improve the safety of roads at night by providing good visibility conditions for all
road users.
A good highway makes it possible for user to ride safely and comfortably at
the design speed. The quality of road surface and its facility will relates to
performance evaluation, which traffic engineers can rate operating characteristics of
individual section of roadway and facilities as a whole in relative terms. Evaluation
relies on measures performance quality, often stated in level of service. The Highway

2
Capacity Manual (HCM) defines highway level of service as a qualitative measure
describing operational conditions within a traffic steam, as perceived by motorist
(Transportation Research Board; 2000). Level of service (LOS) divide into six levels,
which range from A to F, separated by different value of measurement which is
traffic density, volume-to-capacity (v/c) ratio, and average speed. However, the level
of which these level of service are according to motorists’ perception in USA. In
Malaysia, quality of service can be measured from speed – volume relationship. In
essence, by comparing 85th
and 15th
percentiles of cumulative speed distribution of
roadway under day light and road lighting condition, the quality of roadway service
can be estimated.
Greenshield (1934) method can be used to determine the optimum speed and
free-flow speed as the parameter to describe quality of roadway service. Traffic
condition and roadway condition have a strong influence on vehicles’ speed. One of
the most significant factors of road condition is visibility for the road user. Road light
has important part in night time to provide visibility.
1.2 Statement of the Problem
Activity of the people is not restricted only in daytime, but people still doing
their activity in night time. Night time driving can be a particularly problem. The US
Department of Transportation (USDOT) and The National Highway Transportation
Safety Administration (NHTSA) both report show that 27% of total crashes occur
under dark condition, 45% of fatalities occur under dark condition (NTHSA; 2003).
Those problems occur relates to good visibility for road user which can influence
driver’s behaviour. Previous study found no change in average speed when road
lighting was introduced, while other show contrary (Anais M. et al., 2010).
Most of previous study of road lighting usually related to traffic safety and
accident prevention. Only limited study has been made to investigate effect of road
lighting to the quality of roadway service (QRS). QRS should be considered under

3
road lighting condition to compare with the control QRS when it is under daylight
condition.
In a low traffic volume situation, driver’s selection of speed usually
influenced by factor such as the road geometry, lighting and weather condition,
(Othman C.P., 2004). The availability of road lighting in highway helps driver at
night time driving. Although vehicles have their own headlight, but road lighting still
needed. Road lighting provides visibility, helps driver to get enough visual
information throughout driving. Road lighting be expected can make road can be
functioned in night time as well as drive in daytime. Because of that, study will
mitigate the impact of road lighting on the QRS.
1.3 Aim and Objective of the Study
The aim of the study is to determine the extent of road lighting impact on the
quality of roadway service.
The objectives of this study are:
a) To determine the 85th
and 15th
percentile speed distribution for roadway with
and without road lighting.
b) To compare the outcomes from the two scenarios.
c) To determine speed / flow plot points from estimated flow / density functions.
d) To compare the outcomes from speed / flow graphs from the two scenarios.
1.4 Scope
Scope of the study will be focused to determine QRS of the section of
Skudai-Pontian Highway. QRS of highway section will be in two different
conditions, day light during day time and road lighting during night time, to know

4
the impact of road lighting. The study will provide traffic data including volume and
speed for that section of highway during 3 weeks continuously. Roadway type and
geometry, and other important information in study location shall be collected.
Section of highway for this study is started from interchange of Jalan
University and Skudai-Pontian highway and ended in Jalan Pontian Lama exit ramp.
This segment of road is 1.7 km length with no sharp curve.
Figure 1.1: Site Map
Site location should be based on criteria so that the data is not affected by other
factor. The criteria for site for this study are:
roadway should be in level terrain, not hilly terrain
roadway should not influenced by attractions and intersection
1.5 Significant of the Study
Result of this study will provide models of traffic pattern during daylight and
road lighting condition. Models will be use to verify whether road lighting has
impact on QRS, provided the road lighting are operated based on design standard and
road surface is free from surface defect.

REFERENCES
Ahmed F. Al-Khaisy et al. Effect of Darkness on the Capacity of Long Term
FreewayReconstruction Zones. Department of Civil Engineering McMaster
University, Ontario, Canada.
Aleksanteri Ekrias, Marjukka ELoholma, Liisa Halonen, Xian-Jie Song, Xin Zhang,
Yan Wen, Road Lighting and Headlights: Luminance Measurements and
Automobile Lighting Simulation, Journal of Building and Environment (43).
2008.
Anais Mayeur, Roland Bremond, J.M. Christian Bastien. Effect of the Viewing
Context on Target Detection. Implications for Road Lighting Design, Journal
of Applied Ergonomics (41). 2010.
Carlos Sun, Yi Hou, Praveen Edara. A Statical Test for 85th
and 15th
Percentile
Speeds Using the Asymptotic Distribution of Sample Quantiles. University of
Missouri – Columbia. 2011.
Hildebrand, E.D., et al. Speed Management Strategies for Rural Temporary Work
Zones. In Proceedings of Canadian Multidisciplinary Road Safety Conference
XIII, Banff, Alberta. June 8-11, 2003.
Institute of Transportation Engineers. Traffic Engineering Handbook 3rd
Edition.
Prentice-Hall, Pearson Education, NJ. 2004.
Jabatan Kerjaraya Malaysia. A Guide on Geometric Design of Roads. ArahanTeknik
(Jalan) 8/86.
71
Jiang Yongqin et al. Traffic Safety and Road Lighting Evenness Influence. Harbin
University of Science and Technology, Harbin. 2007.
Khisty, C. Jotin, B. Kent Lall. Transportation Engineering – An Introduction 2nd
Edition, Prentice-Hall. Pearson Education. NJ. 1998.
Mace, D.J., and Porter, R.L. Fixed Roadway Lighting: The Effect of Lighting
Geometry and Photometry on Target Visibility and Driver Comfort. Presented
at the 83rd
Transportation Research Board Annual Meeting, 2004.
Mattox, J.H. et al. Development and Evaluation of Speed-Activated Sign to Reduce
Speeds in Work Zones. In Transportation Research Record: Journal of the
Transportation Research Board, No. 2015, Transportation Research Board of
the National Academies, Washington, D.C., 2007.
Nicholas J. Garber, Lester A. Hoel. Traffic and Highway Engineering 3rd
Edition.
CL-Engineering 2001.
Othman Che Puan, Che Ros Ismail. Driver’s Car Following Headway on Single
Carriageway Roads. Universiti Teknologi Malaysia. 2004.
R. W. Holmes. The Purpose of Road Lighting. CIE Division 4, Department of
Transport, NASA Astophysics Data System.1997.
Transportation Research Board. Highway Capacity Manual. National Research
Council. Washington, D.C. 2000.
Technical Committee LGL/23, British Standard EN 5489-1 :Road Light Guide to the
General Principles,Bsi. 1998