f-2 sewer service report - los angeles department of city planning
TRANSCRIPT

F-2 SEWER SERVICE REPORT

1
SANITARY SEWER INFRASTRUCTURE REPORT
USC HEALTH SCIENCES CAMPUS PROJECT LOS ANGELES, CA KPFF Job # 104950
May 5, 2005
OWNER: PREPARED BY:
UNIVERSITY OF SOUTHERN CALIFORNIA 925 W 35th Street Los Angeles, CA 90089
KPFF Consulting Engineers 6080 Center Drive, Suite 750 Los Angeles, CA 90045 (310) 665-1536
2
TABLE OF CONTENTS
1.0 Description of Existing Sanitary Sewer Infrastructure.......................................... 3
1.1 Sewer Service for Development Site A.............................................................. 3
1.2 Sewer Service for Development Site B.............................................................. 4
1.3 Sewer Service for Development Site C.............................................................. 4
1.4 Sewer Service for Development Site D.............................................................. 4
1.5 Sewer Service for Development Site E .............................................................. 4
1.6 Sewer Service for Development Site F .............................................................. 4
1.7 Sewer Service for Development Site G.............................................................. 5
2.0 Forecast of the Project’s Sewage Generation.......................................................... 6
3.0 Existing Flow Levels and System Capacity ............................................................. 7
3.1 Example of sewer capacity analysis................................................................... 7
3.2 Analysis of Sewer Capacity ............................................................................... 8
4.0 System Improvements Required to Support the Project ..................................... 11
5.0 Mitigation Measures Recommended to Reduce Project Impacts........................ 11
6.0 Analysis of Cumulative Impacts ............................................................................. 12
7.0 References................................................................................................................. 12
ATTACHMENT A - Sewer Gauging Study
ATTACHMENT B - Haestad FlowMaster Calculation
ATTACHMENT C - Sewer Gauging Locations
3
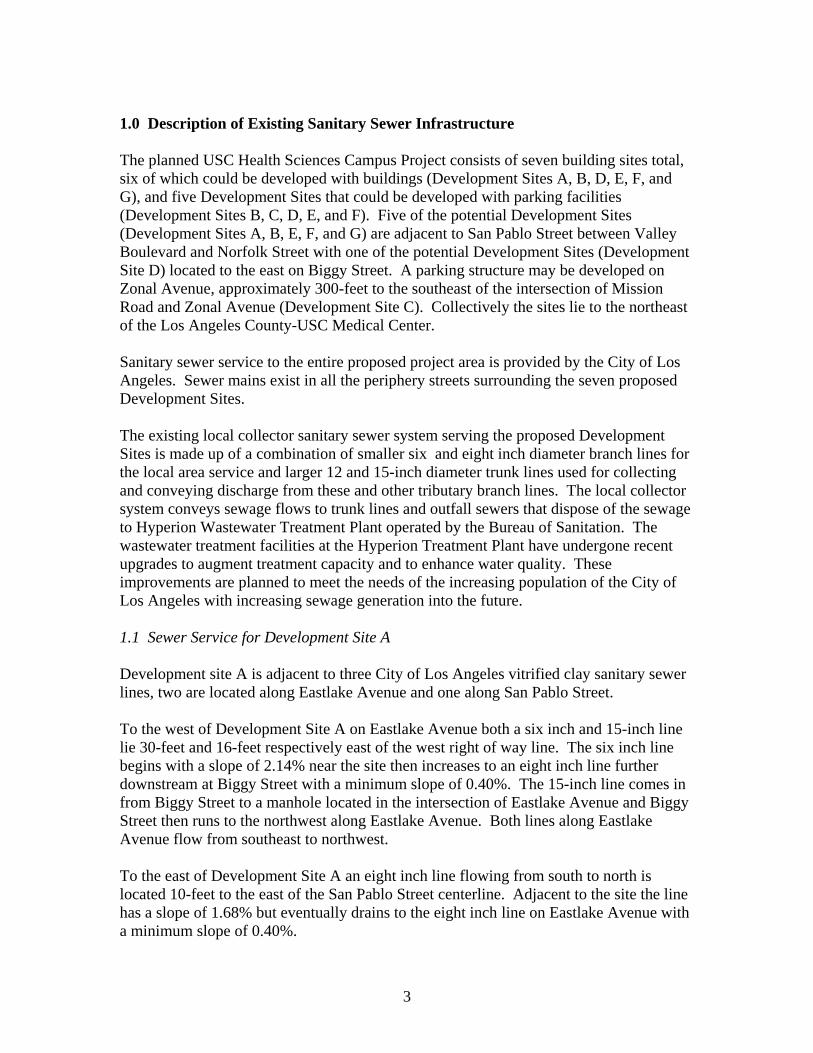
1.0 Description of Existing Sanitary Sewer Infrastructure The planned USC Health Sciences Campus Project consists of seven building sites total, six of which could be developed with buildings (Development Sites A, B, D, E, F, and G), and five Development Sites that could be developed with parking facilities (Development Sites B, C, D, E, and F). Five of the potential Development Sites (Development Sites A, B, E, F, and G) are adjacent to San Pablo Street between Valley Boulevard and Norfolk Street with one of the potential Development Sites (Development Site D) located to the east on Biggy Street. A parking structure may be developed on Zonal Avenue, approximately 300-feet to the southeast of the intersection of Mission Road and Zonal Avenue (Development Site C). Collectively the sites lie to the northeast of the Los Angeles County-USC Medical Center. Sanitary sewer service to the entire proposed project area is provided by the City of Los Angeles. Sewer mains exist in all the periphery streets surrounding the seven proposed Development Sites. The existing local collector sanitary sewer system serving the proposed Development Sites is made up of a combination of smaller six and eight inch diameter branch lines for the local area service and larger 12 and 15-inch diameter trunk lines used for collecting and conveying discharge from these and other tributary branch lines. The local collector system conveys sewage flows to trunk lines and outfall sewers that dispose of the sewage to Hyperion Wastewater Treatment Plant operated by the Bureau of Sanitation. The wastewater treatment facilities at the Hyperion Treatment Plant have undergone recent upgrades to augment treatment capacity and to enhance water quality. These improvements are planned to meet the needs of the increasing population of the City of Los Angeles with increasing sewage generation into the future. 1.1 Sewer Service for Development Site A Development site A is adjacent to three City of Los Angeles vitrified clay sanitary sewer lines, two are located along Eastlake Avenue and one along San Pablo Street. To the west of Development Site A on Eastlake Avenue both a six inch and 15-inch line lie 30-feet and 16-feet respectively east of the west right of way line. The six inch line begins with a slope of 2.14% near the site then increases to an eight inch line further downstream at Biggy Street with a minimum slope of 0.40%. The 15-inch line comes in from Biggy Street to a manhole located in the intersection of Eastlake Avenue and Biggy Street then runs to the northwest along Eastlake Avenue. Both lines along Eastlake Avenue flow from southeast to northwest. To the east of Development Site A an eight inch line flowing from south to north is located 10-feet to the east of the San Pablo Street centerline. Adjacent to the site the line has a slope of 1.68% but eventually drains to the eight inch line on Eastlake Avenue with a minimum slope of 0.40%.

4
1.2 Sewer Service for Development Site B Two City of Los Angeles vitrified clay pipe sanitary sewer lines are adjacent to development site B. One eight inch line located 10-feet east of the San Pablo Street centerline has a slope of 3.92% adjacent to the site and a minimum slope of 0.40% further downstream. This line is also adjacent to proposed Development Site A. A larger 15-inch line is located 20-feet north of the centerline along Alcazar Street. This line has a slope of 1.88% adjacent to the site and has a minimum slope of at least 0.62% further downstream where it drains to a 15-inch line on Eastlake Avenue. This line drains from east to west. 1.3 Sewer Service for Development Site C A parking structure providing up to 2800 parking spaces may be located on Development Site C , which lies adjacent to one 15-inch diameter vitrified clay sanitary sewer pipe. This pipe is located approximately 23.67-feet to the west of the eastern right-of-way of Zonal Avenue. The line flows from the south-east to the northwest along Zonal Avenue. 1.4 Sewer Service for Development Site D A single eight inch vitrified sanitary sewer exists adjacent to Development Site D. The sewer line is located 30-feet south of the north Biggy Street right-of-way line. The line flows from the west to the east towards Eastlake Avenue. The line has a minimum slope of at least 0.40%. 1.5 Sewer Service for Development Site E An existing eight inch diameter vitrified clay sanitary sewer line runs beneath Development Site E. The section of line running beneath Development Site E has a slope of 1.60%, further downstream it is found that the line increases to a 12-inch diameter line but the slope is reduced to 0.24%. Along Alcazar Street to the south of the site a 15-inch diameter vitrified clay pipe is located 20-feet south of the north right-of-way line. The slope of the pipe immediately adjacent to Development Site E is 1.88% with flow going to the west towards Eastlake Avenue. The line eventually ties into the 18-inch line in Eastlake Avenue where the slope drops to a minimum of 0.62%. 1.6 Sewer Service for Development Site F Development Site F is adjacent to San Pablo Street, which adjoins the easterly boundary of this Development Site. San Pablo Street does not have any existing public sewers along its right-of-way. The only available City of Los Angeles sewer in the vicinity is located in the southern portion of the site. This line is a 10-inch diameter vitrified clay pipe that is located approximately 150-feet north of the north Alcazar Street right-of-way. Directly adjacent to Development Site F this line has a slope of 0.68%. This line also

5
runs beneath Development Site E and as mentioned above this line increases in diameter further downstream but the slope drops to at least 0.24%. 1.7 Sewer Service for Development Site G A total of five City of Los Angeles vitrified clay pipe sanitary sewers are located around Development Site G; two are located to the west in Eastlake Avenue, two are located to the north in Alcazar Street, and one is located to the east in San Pablo Street. In Eastlake Avenue an eight inch line with a slope of 1.50% is located 16-feet east of the west Eastlake Avenue right-of-way line. The second line is a 15-inch diameter pipe located 30-feet east of the west Eastlake Avenue right-of-way line. Both lines also potentially serve Development Site A with minimum slopes of at least 0.40% and 0.62% encountered further downstream on the eight-inch and 15-inch diameter lines respectively. In Alcazar Street, an eight-inch diameter line and a 15-inch diameter line are located 30-feet north and 60-feet north of the Alcazar Street right-of-way. The eight inch line has a slope of 0.40% and connects to the eight inch diameter line in Eastlake Avenue. The 15-inch line has a slope of 1.88% and connects to the 15-inch diameter line in Eastlake Avenue. Both lines flow from east to west. The eight inch diameter line in San Pablo Street is located 30-feet west of the eastern San Pablo Street right-of-way line. This line has a slope of 3.92% adjacent to the proposed Development Site G and connects to the aforementioned eight inch line in Alcazar street. Table S1 – Summary of Nearby Sewer Service Lines
Street Diameter1 (inches) Pipe Material Location in
ROW2 Year Const. Sites
Potentially Served
Eastlake Avenue 6/8 VCP 30' E/W 1905 A,G Eastlake Avenue 15 VCP 16' E/W 1965 A,G San Pablo St 8 VCP 28.5’ W/E 1924 A San Pablo St 8 VCP 30' W/E 1905 B,G Alcazar Street 15 VCP 20' S/N 1965 B,E,G Alcazar Street 8 VCP 30' N/S 1905 G Alcazar Street3 8 VCP 150' N/N 1915 E Alcazar Street3 10 VCP 170' N/N 1915 F Biggy Street 8 VCP 30' S/N 1910 D Zonal Avenue 15 VCP 23.67' W/E 1974 C 1 All available diameters are listed for lines increasing in size adjacent to a given site, e.g. the six inch diameter line located in Eastlake Avenue increases to an eight inches further downstream. 2 Distance from street right of way (ROW) line, e.g. the 6-inch main in Eastlake Avenue lies 30-feet East of the Western right of way line. 3 Line runs adjacent to Alcazar Street but outside of right of way.
6
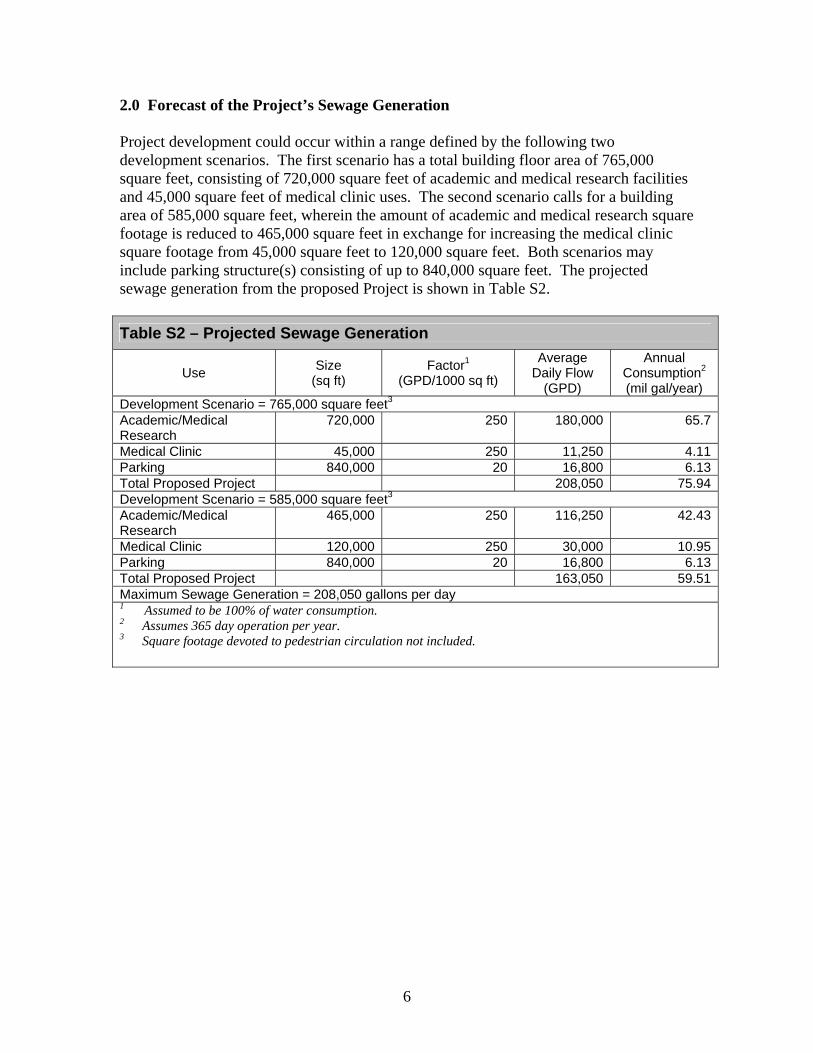
2.0 Forecast of the Project’s Sewage Generation Project development could occur within a range defined by the following two development scenarios. The first scenario has a total building floor area of 765,000 square feet, consisting of 720,000 square feet of academic and medical research facilities and 45,000 square feet of medical clinic uses. The second scenario calls for a building area of 585,000 square feet, wherein the amount of academic and medical research square footage is reduced to 465,000 square feet in exchange for increasing the medical clinic square footage from 45,000 square feet to 120,000 square feet. Both scenarios may include parking structure(s) consisting of up to 840,000 square feet. The projected sewage generation from the proposed Project is shown in Table S2.
Table S2 – Projected Sewage Generation
Use Size (sq ft)
Factor1 (GPD/1000 sq ft)
Average Daily Flow
(GPD)
Annual Consumption2
(mil gal/year) Development Scenario = 765,000 square feet3 Academic/Medical Research
720,000 250 180,000 65.7
Medical Clinic 45,000 250 11,250 4.11Parking 840,000 20 16,800 6.13Total Proposed Project 208,050 75.94Development Scenario = 585,000 square feet3 Academic/Medical Research
465,000 250 116,250 42.43
Medical Clinic 120,000 250 30,000 10.95Parking 840,000 20 16,800 6.13Total Proposed Project 163,050 59.51Maximum Sewage Generation = 208,050 gallons per day 1 Assumed to be 100% of water consumption. 2 Assumes 365 day operation per year. 3 Square footage devoted to pedestrian circulation not included.

7
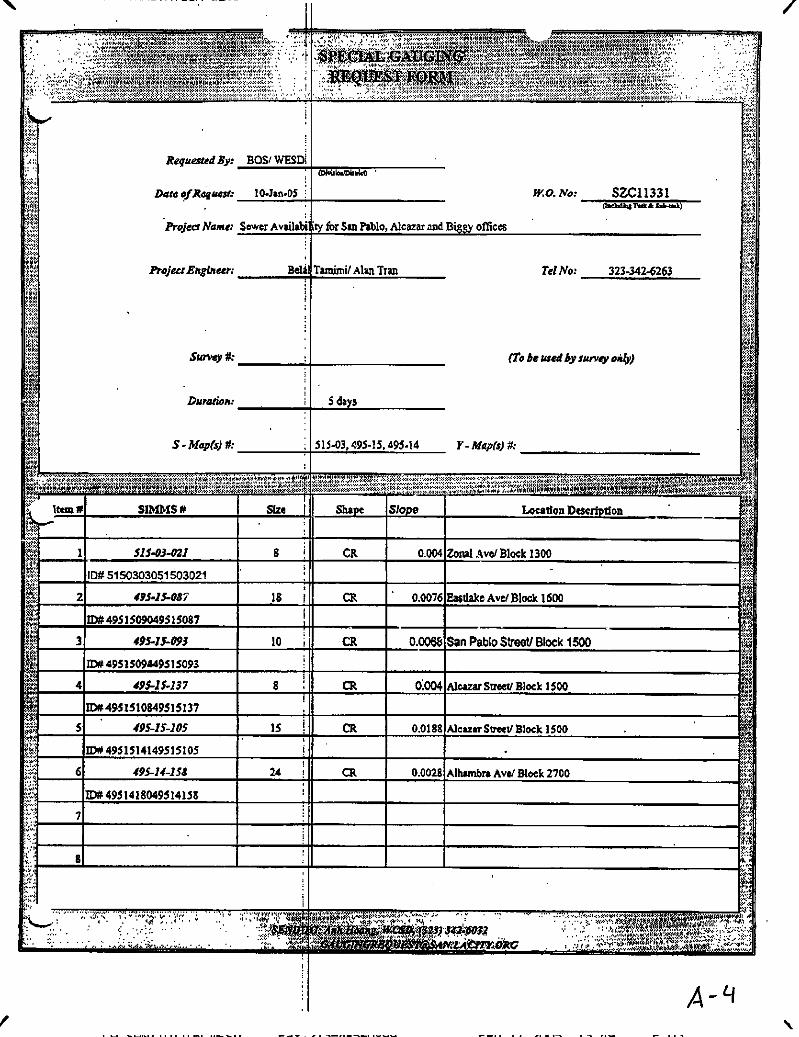
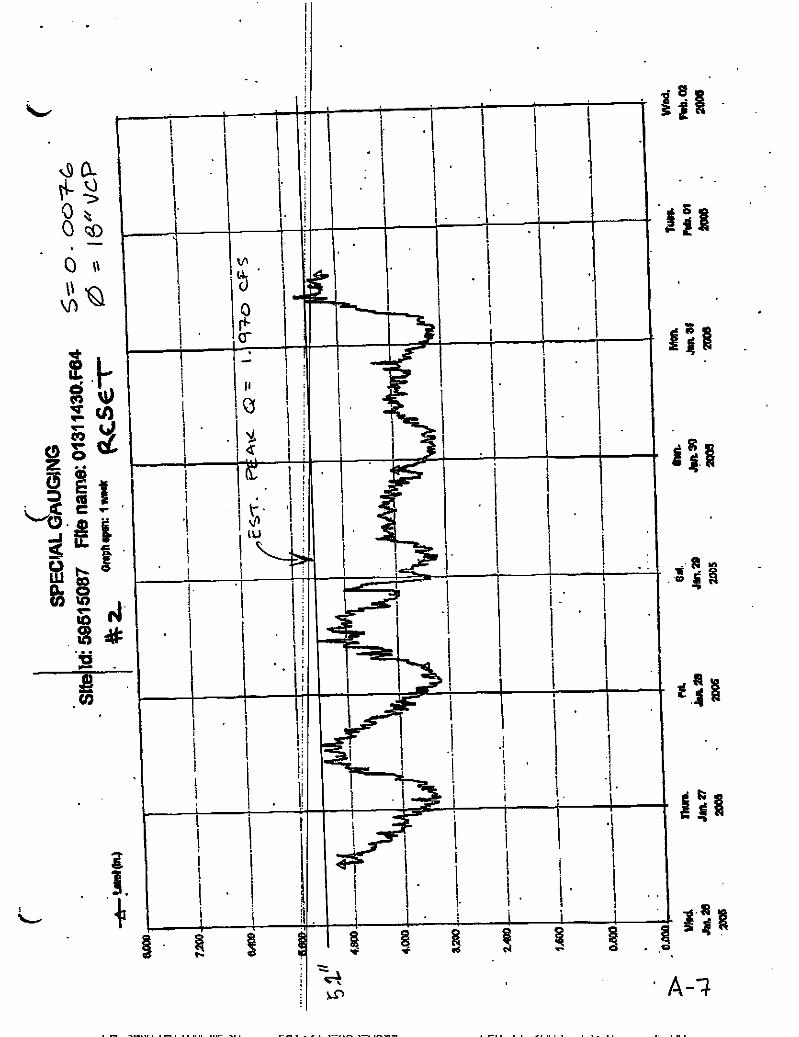
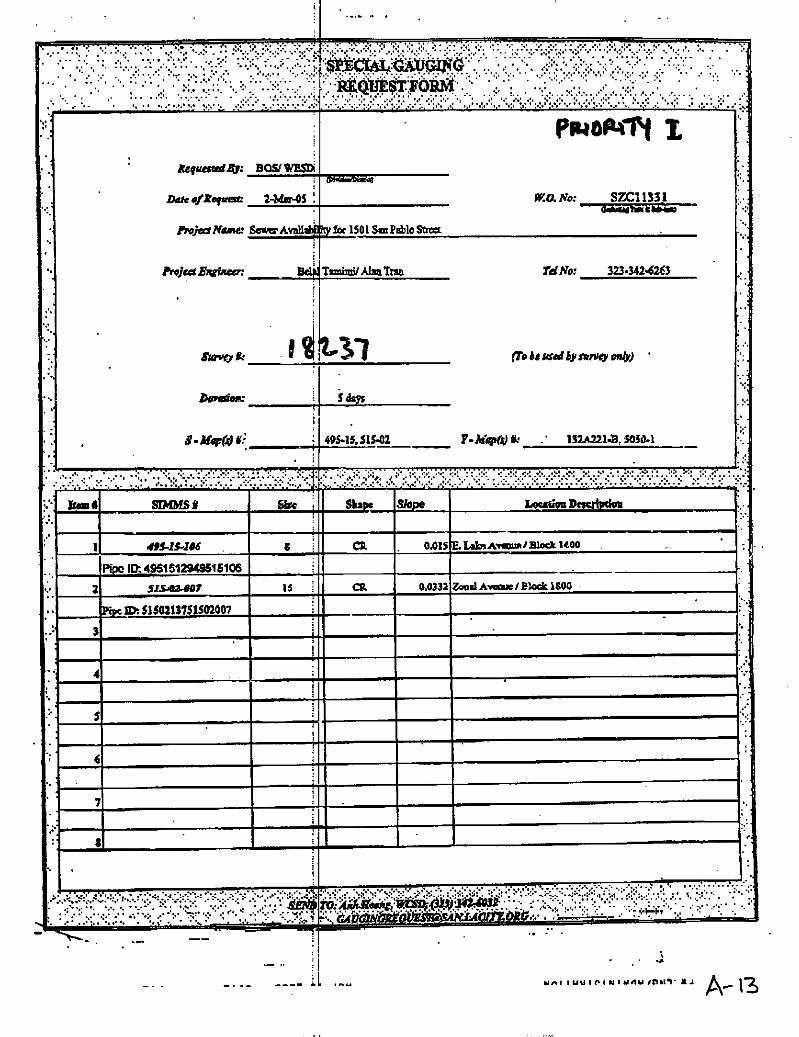
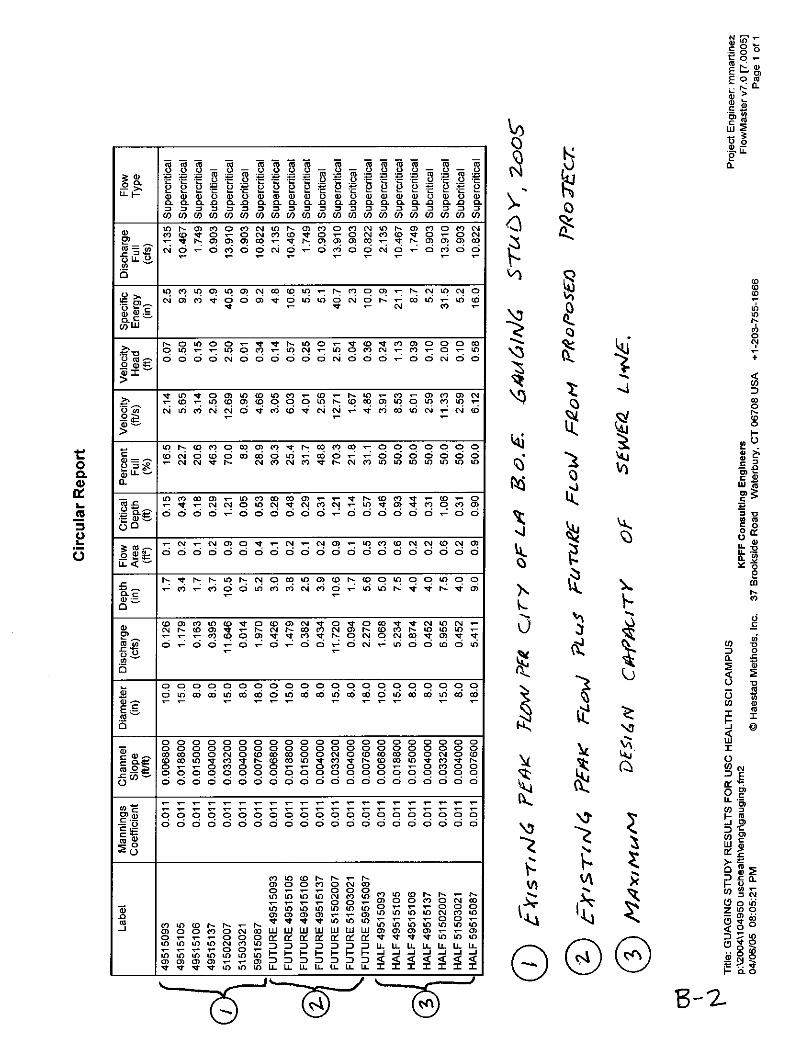
3.0 Existing Flow Levels and System Capacity Seven sewer availability requests were submitted to the City of Los Angeles Bureau of Engineering in January, 2005. Flow measurement studies were conducted on the various sewer lines that serve the Project site. These studies were performed by the City of Los Angeles Bureau of Engineering during January and March of 2005. The locations of these studies were chosen to provide information regarding the sewer lines that would serve the proposed Development Sites. The flow measurements for each manhole indicate typical flow depths within a given sewer line recorded over a five to seven day period. See Attachment A for the flow measurement study results. Peak flows within a particular sewer line are estimated by using Manning’s equation for open channel flow. Flow in a given line is back-calculated by considering the depth of flow (taken form the apparent peak recorded flow depth), the adjacent pipe slopes, and the assumed Manning’s roughness coefficient for vitrified clay sewer pipes (n = 0.011). These calculations were performed using Haestad Methods FlowMaster software. A summary of these calculations can be found in Attachment B. [Haestad, 1986] Per City of Los Angeles Bureau of Engineering sewer design criteria, flow within a given sewer line is acceptable when the depth of flow is 50 percent or less of the diameter of the line during peak flow periods. [LA BOE, 2005] The manhole locations where each of the flow measurement studies were performed are indicated on a map found in Attachment C. A summary of these flow measurement results can be found in Table S3. The following example is an analysis of the eight inch line in Eastlake Avenue. 3.1 Example of sewer capacity analysis A flow measurement study was done on the eight-inch line in Eastlake Avenue (SIMMS manhole no. 49515106. The manhole is located in the intersection of Eastlake Avenue and Alcazar Street and is therefore adjacent to or downstream of Development Sites A and G. Thus, sites A and G are potentially served by this line. From the flow measurement study it is found that the existing peak depth of flow is approximately 1.65-inches, or 21 percent of full pipe flow. Considering the adjacent pipe slope and assumed pipe roughness coefficient this translates into a flow rate within the sewer line of approximately 0.163 CFS. Considering an estimated sewage generation of 250 GPD per 1000 square feet of floor area, the maximum potential building floor area of 565,000 square feet on sites A and G would result in an additional sewage flow of 141,500 GPD or 0.219 CFS. Therefore the addition of this projected sewage flow on this sewer line would result in 0.382 CFS. Using Manning’s equation, this results in a potential flow depth of 2.5 inches and thus increasing the depth of flow within the pipe to 32 percent. This increase in flow depth due to the 565,000 square feet is acceptable by City of Los Angeles Bureau of
8
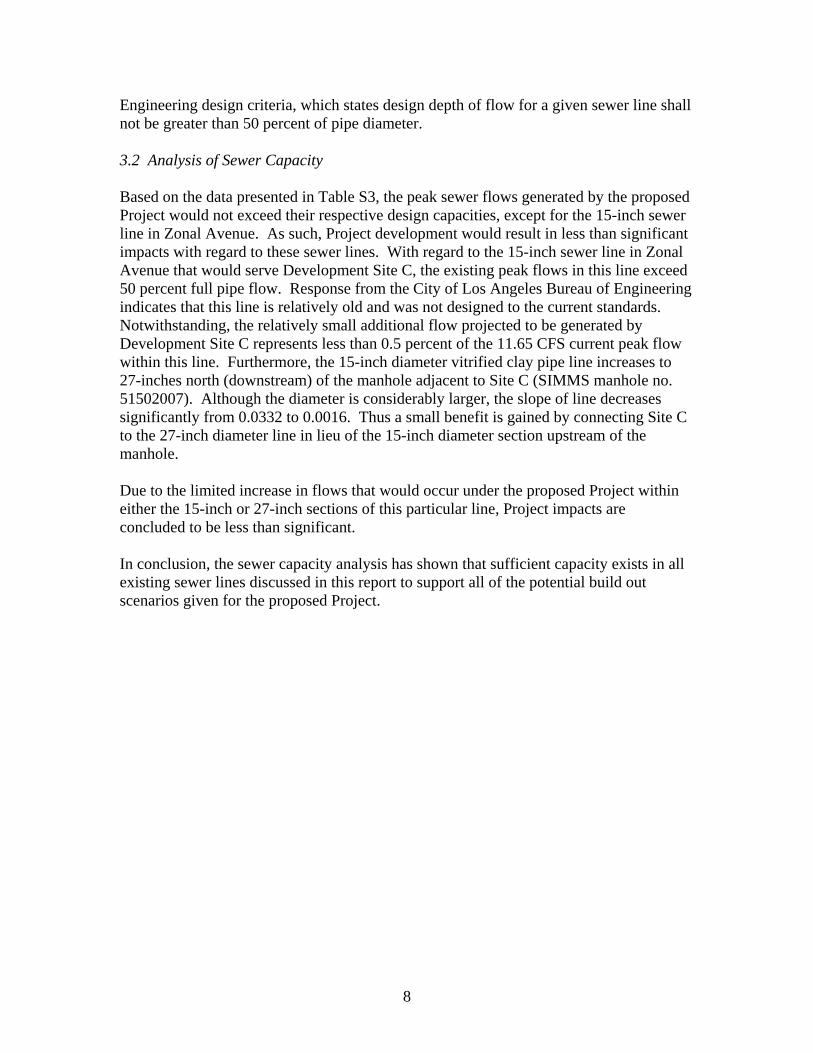
Engineering design criteria, which states design depth of flow for a given sewer line shall not be greater than 50 percent of pipe diameter. 3.2 Analysis of Sewer Capacity Based on the data presented in Table S3, the peak sewer flows generated by the proposed Project would not exceed their respective design capacities, except for the 15-inch sewer line in Zonal Avenue. As such, Project development would result in less than significant impacts with regard to these sewer lines. With regard to the 15-inch sewer line in Zonal Avenue that would serve Development Site C, the existing peak flows in this line exceed 50 percent full pipe flow. Response from the City of Los Angeles Bureau of Engineering indicates that this line is relatively old and was not designed to the current standards. Notwithstanding, the relatively small additional flow projected to be generated by Development Site C represents less than 0.5 percent of the 11.65 CFS current peak flow within this line. Furthermore, the 15-inch diameter vitrified clay pipe line increases to 27-inches north (downstream) of the manhole adjacent to Site C (SIMMS manhole no. 51502007). Although the diameter is considerably larger, the slope of line decreases significantly from 0.0332 to 0.0016. Thus a small benefit is gained by connecting Site C to the 27-inch diameter line in lieu of the 15-inch diameter section upstream of the manhole. Due to the limited increase in flows that would occur under the proposed Project within either the 15-inch or 27-inch sections of this particular line, Project impacts are concluded to be less than significant. In conclusion, the sewer capacity analysis has shown that sufficient capacity exists in all existing sewer lines discussed in this report to support all of the potential build out scenarios given for the proposed Project.

9
Table S3 - Analysis of Sewer Lines
Street Diameter (IN)
Sites served1
Max floor area (SF)
Sewage2 generation
(GDP/1,000SF)
Max estimated generation
(GPD)
Existing Flow (IN)
Existing Flow
(CFS)3
Design capacity (CFS)
Incremental increase (CFS)4
Future Flow (CFS)
Future Flow (IN)
Eastlake Avenue 18 A, B, E, F, G, 765,000 250 191,250 5.2 1.72 5.41 0.300 2.02 5.6
Biggy Street 8 D 200,000 250 50,000 0.7 0.011 0.45 0.080 0.091 1.7
Alcazar Street5 10 E & F 765,000 250 191,250 1.7 0.093 1.07 0.300 0.393 3.0
Alcazar Street 8 G 100,000 250 25,000 3.7 0.310 0.45 0.039 0.349 3.9
Alcazar Street 15 B, E, & G 765,000 250 191,250 3.4 0.930 5.23 0.300 1.23 3.8
Eastlake Avenue 8 A & G 565,000 250 141,250 1.7 0.163 0.87 0.219 0.382 2.5
Zonal Avenue 15 C 840,000 20 42,000 10.5 11.65 6.96 0.065 11.72 10.6 1 Maximum potential floor on each development site is used to present a conservative analysis for each line. The analysis is conservative in that the total Project
would not exceed 765,000 square feet. Table 3 also assumes that the maximum potential floor area for each development site would flow into only one line. However, depending on line capacity, where multiple lines serve a Development Site, sewage flow may be divided between the lines and the maximum flow into each line would be less than shown. For instance, the daily flow from Development Site A may be divided between lines in Eastlake Avenue and San Pablo Street and, as such, would generate less flow to each line than shown above.
2 GPD = Gallons Per Day (sewage generated daily) per 1000 square feet of floor space. 3 CFS = Cubic Feet per Second (the rate of flow in sewer mains) 4 CFS generated by the Project. 5 Sewer line runs adjacent to Alcazar Street approximately 150 feet to 170 feet to the north of the Alcazar Street right of way.

11
4.0 System Improvements Required to Support the Project The proposed Project would not require any system improvements to the public sanitary sewer system. The collection sewer mains adjoining the Seven Development Sites are adequately sized to serve the proposed Project. Although many of these collection mains are constructed on minimum slopes, the peak flows expected from the proposed Project would not cause the sewer system to flow more than half full. Considering the results of the sewer gauging study, construction of the proposed Development Sites at USC Health Sciences Campus would require only sewer laterals from the public sewers in the streets. Those portions of the sewer laterals constructed within the public right-of-way would be conducted in accordance with standard practices and procedures which would reduce potential impacts attributable to these improvements to less than significant levels. The proposed Project represents an incremental part of the increasing sewage flows provided for by the recent improvements to the Hyperion wastewater treatment facility. Regional wastewater facilities are at least partially funded through the collection of fees. The Sewerage Facilities Charge is collected by the City of Los Angeles from owners/developers of new land uses with the City. The University may be subject to the payment of a Sewerage Facilities Charge for the proposed Project. Fees may be offset by credits for any existing/prior uses. In conclusion, adequate capacity is available both in the sewer lines that would serve the Project Site and at the Hyperion wastewater treatment facility. Therefore, Project impacts on sewer capacity are less than significant. 5.0 Mitigation Measures Recommended to Reduce Project Impacts Although development of the proposed Project is not anticipated to produce significant impacts to sanitary sewer services, the following measures would ensure that sewage generation would be reduced to the extent possible:
1. Prior to the issuance of a certificate of occupancy, a determination shall be
made regarding the capacity of the sewer pipeline between each proposed Development Site and the trunk sewer. If service is discovered to be less than adequate, the Applicant shall be required to upgrade the connections to the mains and/or provide an alternative solution, in order to appropriately serve the Project.
12
2. The Applicant shall comply with procedural requirements of City ordinances regulating connections to the City sewer system
3. All necessary on-site infrastructure improvements shall be constructed to meet the requirements of the Department of Building and Safety.
4. The Applicant shall apply for and comply with all necessary permits, including Industrial Wastewater Discharge Permits, if required.
6.0 Analysis of Cumulative Impacts Related project development is situated such that sewage flows from the identified related projects would not utilize the sewer lines analyzed in Table S3. As such, no cumulative impacts would occur. In addition, sufficient capacity is available in the downstream sewer lines to accommodate the increase in sewage flows generated by related project development as well as development of the proposed Project. As such, cumulative impacts on the sewer lines that would serve the related projects and the proposed Project are less than significant. In relation to broad growth and demand, all related projects would be subject to the City’s Sewer Allocation program for the Hyperion Treatment System (HTS). This program limits additional discharge according to a pre-established percentage rate. The Los Angeles Department of Public Works must first determine if there is allotted sewer capacity available for any project prior to accepting building plans for approval. If the allotment for a particular time period is filled, the project is placed on a waiting list until adequate treatment capacity has been determined. Under the allocation program, HTS has capacity to serve a particular rate of growth and prevent the occurrence of significant cumulative impacts relative to treatment capacity. 7.0 References [Haestad, 1986] FlowMaster for Windows Version 6.1, Haestad Methods Inc., 1986. [LA BOE, 2005] Sewer Design Manual, City of Los Angeles Bureau of Engineering,
http://eng.lacity.org/techdocs/sewer-ma/index.htm , 2005.