f ast r esponse m easurements for the d ispersion of n anoparticles in v ehicle w ake and s treet c...
TRANSCRIPT

FAST RESPONSE MEASUREMENTS FOR THE DISPERSION OF NANOPARTICLES
IN VEHICLE WAKE AND STREET CANYON
89TH AMS MEETING, PHOENIX, 11-15 JANUARY 09
PRASHANT KUMAR
ALAN ROBINS
REX BRITTER

POINTS FOR DISCUSSION
BACKGROUND
MEASUREMENTS
Application of a DMS500 for ambient measurements
Street canyon measurements
Vehicle wake measurements
Hypothesis
SUMMARY AND CONCLUSIONS
ACKNOWLEDGEMENTS
PRASHANT KUMAR 89TH AMS MEETING, PHOENIX, 11-15 JANUARY 09 2

BACKGROUND
Stringent emissions: particle mass emissions (↓), number (↑)
Current regulations address atmospheric particulate matter as PM10, PM2.5 mass concentration; not number concentration (PNC)
Ultrafine particles (< 100 nm); main component of ambient particles by number, produced mainly by vehicles, contribute most to PNC but little to PMC; these
are more toxic than coarse particles per unit mass
Progress hampered by lack of proven methods and instrumentation to measure PNCs
1 of 1
This work addresses:
application of a fast response DMS500, its suitability and best operating conditions for the measurements of PNDs in operational (vehicle wake) and controlled (street canyons) conditions
to determine the time scale over which competing influences of transformation and dilution processes affect dispersion of nanoparticles
to discuss the importance of particle dynamics (hypothesis) during ambient measurements and modelling of nanoparticles
PRASHANT KUMAR 89TH AMS MEETING, PHOENIX, 11-15 JANUARY 09 3

MEASUREMENTS
Measurement Campaigns: Street canyon (Pembroke Street) Vehicle wake (Chemical Engineering Department)
Instrument: Differential Mobility Spectrometer (DMS500) Response: 10 Hz, real time continuous Sampling flow rate: 8.0 lpm at 250 mb for 5-1000 nm
2.5 lpm at 160 mb for 5-2738 nm
Movies: 2stroke-idle, diesel drive by
1 of 10
PRASHANT KUMAR 89TH AMS MEETING, PHOENIX, 11-15 JANUARY 09 4

APPLICATION OF DMS500
Check the sensitivity level of the instrument
Identify the suitable operating conditions (mainly sampling frequency) of the instrument which maximised its utility
2 of 10
PRASHANT KUMAR 89TH AMS MEETING, PHOENIX, 11-15 JANUARY 09 5
MEASUREMENTS
0.E+00
2.E+04
4.E+04
6.E+04
8.E+04
1.E+05
1 10 100 1000D p (nm)
0.1 s Av Noise (10 Hz)1 s Av Noise (1 Hz)10 s Av Noise (0.1 Hz)0.1 s Av Roadside background (10 Hz)0.1 s Roadside (10 Hz)
0.E+00
2.E+04
4.E+04
6.E+04
8.E+04
1.E+05
1 10 100 1000
dN/d
logD
p (#
cm
–3)
0.8
0.6
0.4
0.2
0.0
1.0 105
Sensitivity of the DMS500. Both typical roadside and background PNDs were measured at the fastest (10 Hz) sampling frequency.
Smaller (1 Hz or lower) rather than maximal (10 Hz) sampling frequencies found appropriate, unless experiments relied critically upon fast response data
Suggested sampling frequencies used in later experiments (Kumar et al., 2008a–e):
measured PNDs well above instrument’s noise level
reduced size of data files to manageable proportions

STREET CANYON 3 of 10
Site 1: Pembroke Street
Kerb
Winds from NW
1.60 m Traffic flow (down-canyon) W = 11.75 m
66 m
Chemical Engineering Department
Measurement siteH 11.60 m
2.60 m
2.50 m
(Figures not to scale)3-cup vortex anemometer
Leeward side Windward side
Pembroke College Building
L 167 m
NWNE
SE
SWWind16.60 m
PRASHANT KUMAR 89TH AMS MEETING, PHOENIX, 11-15 JANUARY 09 6
MEASUREMENTS
Among several objectives (Kumar et al. 2008a-e, 2009), the goal of present work is to measure the lapse time (i.e. time between vehicular emissions and measurements at roadside).

STREET CANYON 4 of 10
PRASHANT KUMAR 89TH AMS MEETING, PHOENIX, 11-15 JANUARY 09 7
0
20
40
60
80
100
0 10 20 30 40 50
Sample (Nos.)
Lap
se ti
me
(s)
Cars and Vans
Other vehicles
Sample measurements showing lapse time at Pembroke Street. Winds were calm ( 1.5 m s–1) during measurements.
Sample measurements: ~ 50 cars and vans and ~ 50 other vehicles (buses, trucks, LDVs) . Average speed of vehicle 30±7 km h–1.
Average lapse time 45±6.
MEASUREMENTS

VEHICLE WAKE
How does PNDs evolve in the vehicle wake?
Are the transformation processes important during street-scale measurements?
5 of 10
PRASHANT KUMAR 89TH AMS MEETING, PHOENIX, 11-15 JANUARY 09 8
DMS500
DMS500
DMS500
Pembroke College
Chemical Engineering
Road NMS Buildings
Pembroke Street11.75 m
10 m
15 m5 mSampling point
NW
SE
SW NE
Vehicles
(Figures not to scale)
Site 2: Schematic diagram of sampling site showing sampling position.
MEASUREMENTS

At t=1.6 sec.
0
4000
8000
12000
1 10 100 1000
0
0.00005
0.0001
0.00015
VEHICLE WAKE 6 of 10
dN/d
logD
p (#
cm
-3)
At t=0.2 sec.
0
4000
8000
12000
10 100 1000
0
0.00005
0.0001
0.00015At t=0.3 sec.
0
4000
8000
12000
1 10 100 1000
0
0.00005
0.0001
0.00015At t=0.4 sec.
0
4000
8000
12000
1 10 100 1000
0
0.00005
0.0001
0.00015At t=0.5 sec.
0
4000
8000
12000
1 10 100 1000
0
0.00005
0.0001
0.00015
At t=0.6 sec.
0
4000
8000
12000
1 10 100 1000
0
0.00005
0.0001
0.00015At t=0.9 sec.
0
4000
8000
12000
1 10 100 1000
0
0.00005
0.0001
0.00015At t=0.7 sec.
0
4000
8000
12000
1 10 100 1000
0
0.00005
0.0001
0.00015At t=0.8sec.
0
4000
8000
12000
1 10 100 1000
0
0.00005
0.0001
0.00015
dM/d
logD
p (μ
gm c
m-3) At t=0.1 sec.
0
4000
8000
12000
1 10 100 1000Dp (nm)
dN/d
ogD
p(#
cm-3
)
0
0.00005
0.0001
0.00015
dM/d
ogD
p(?
gm c
m-3
)
NumberMass
At t=0.1 sec.
0
4000
8000
12000
1 10 100 1000Dp (nm)
-
0
0.00005
0.0001
0.00015
dM/d
ogD
p(?
gm c
m-3
)
NumberMass
At t=0.1 sec.
0
4000
8000
12000
1 10 100 1000Dp (nm)
dN/d
ogD
p(#
cm-3
)
0
0.00005
0.0001
0.00015
dM/d
ogD
p(?
gm c
m-3
)
NumberMass
At t=0.1 sec.
0
4000
8000
12000
1 10 100 1000Dp (nm)
-
0
0.00005
0.0001
0.00015
dM/d
ogD
p(?
gm c
m-3
)
NumberMass
At t=0.2 sec.
0
4000
8000
12000
1 10 100 1000
0
0.00005
0.0001
0.00015
0
4000
8000
12000
1 10 100 1000
0
0.00005
0.0001
0.00015At t=0.4 sec.
0
4000
8000
12000
1 10 100 1000
0
0.00005
0.0001
0.00015At t=0.6 sec.
0
4000
8000
12000
1 10 100 1000
0
0.00005
0.0001
0.00015At t = 0.5 sec.
0
4000
8000
12000
1 10 100 1000
0
0.00005
0.0001
0.00015
Site background
Site background
t=–0.7s t=–0.6s t=–0.5s t=–0.4s t=–0.3s
t=– 0.2s t=–0.1s t=0.0s t=0.1s t=0.2s
t=0.3s t=0.4s t=0.5s t=0.6s t=0.7s
First evidence of exhaust emissions
Clear bi-modal distribution Peak (number and mass)
Evolution starts
1 10 100 1000 1 10 100 1000 1 10 100 1000 1 10 100 1000 1 10 100 1000
Dp (nm)
PRASHANT KUMAR 89TH AMS MEETING, PHOENIX, 11-15 JANUARY 09 9
MEASUREMENTS

At t=2.6 sec.
0
4000
8000
12000
1 10 100 1000
0
0.00005
0.0001
0.00015
At t=2.1 sec.
0
4000
8000
12000
1 10 100 1000
0
0.00005
0.0001
0.00015
At t=2.5 sec.
0
4000
8000
12000
1 10 100 1000
0
0.00005
0.0001
0.00015At t=2.4 sec.
0
4000
8000
12000
1 10 100 1000
0
0.00005
0.0001
0.00015
At t=2.3 sec.
0
4000
8000
12000
1 10 100 1000
0
0.00005
0.0001
0.00015
At t=2.2 sec.
0
4000
8000
12000
1 10 100 1000
0
0.00005
0.0001
0.00015
At t=2.0 sec.
0
4000
8000
12000
1 10 100 1000
0
0.00005
0.0001
0.00015
At t=1.9 sec.
0
4000
8000
12000
1 10 100 1000
0
0.00005
0.0001
0.00015
At=1.8 sec.
0
4000
8000
12000
1 10 100 1000
0
0.00005
0.0001
0.00015
At t=1.7 sec.
0
4000
8000
12000
1 10 100 1000
0
0.00005
0.0001
0.00015NumberMass
Vehicle Wake 7 of 10
dN/d
logD
p (#
cm
-3)
dM/d
logD
p (μ
gm c
m-3)
1 10 100 1000 1 10 100 1000 1 10 100 1000 1 10 100 1000 1 10 100 1000
Dp (nm)
Similar to site background
Rapid Evolution
t=0.8s t=0.9s t=1.0s t=1.1s t=1.2s
t=1.3s t=1.4s t=1.5s t=1.6s t=1.7s
Similar to site background
–0.7 s to 0.0 s (background PNC) – time to reach to DMS500
Evolution to reach to background takes 1.0 s
PRASHANT KUMAR 89TH AMS MEETING, PHOENIX, 11-15 JANUARY 09 10
MEASUREMENTS
-0.8 -0.5 -0.2 0.1 0.4 0.7 1.0 1.3 1.6 21.70.00E+00
3.00E-06
6.00E-06
9.00E-06
1.20E-05
1.50E-05
Time (s)
PMC (without background)PMC (total)
-0.8
-0.6
-0.4
-0.2 0.0
0.2
0.4
0.6
0.8
1.0
1.2
1.4
1.60.00E+00
3.00E-06
6.00E-06
9.00E-06
1.20E-05
1.50E-05
PM
C (
μgm
cm
–3)
10– 5
0.0
0.3
0.6
0.9
1.2
1.5
1 10 100 1000 10000
Post–evolutionPre–evolution Evolution
-0.8 -0.5 -0.2 0.1 0.4 0.7 1.0 1.3 1.6 21.70.00E+00
4.00E+04
8.00E+04
1.20E+05
1.60E+05
2.00E+05
Time (s)
PNC (without background)
PNC (total)
105
-0.8
-0.6
-0.4
-0.2 0.0
0.2
0.4
0.6
0.8
1.0
1.2
1.4
1.60.00E+00
4.00E+04
8.00E+04
1.20E+05
1.60E+05
2.00E+05
PN
C (
# cm
–3)
0.0
0.4
0.8
1.2
1.6
2.0
1 10 100 1000 10000
Post–evolutionPre–evolution Evolution
VEHICLE WAKE 8 of 10
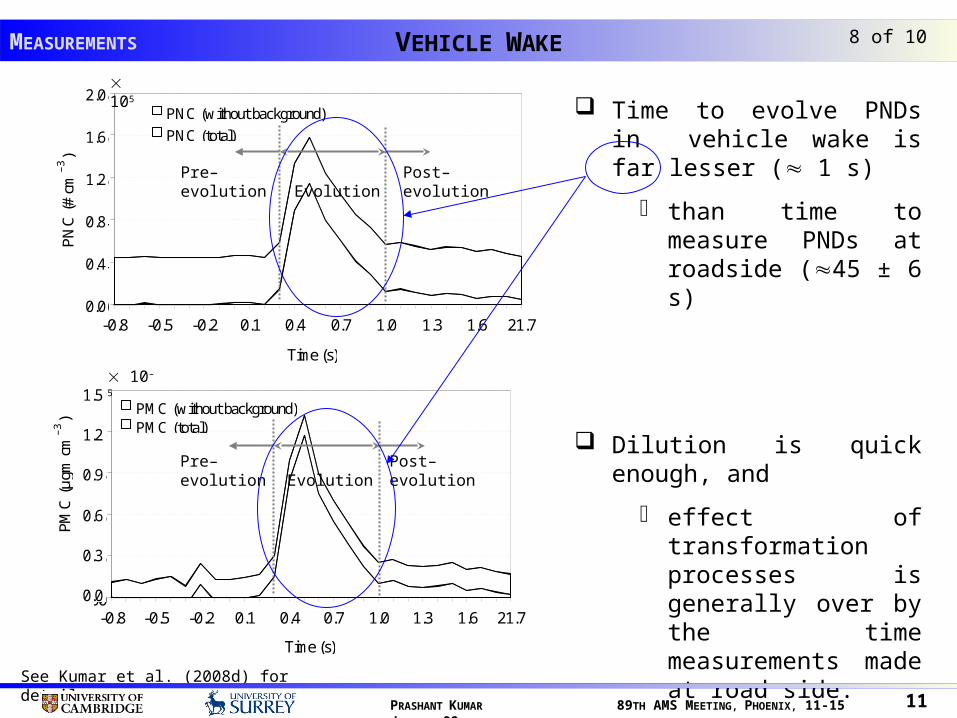
Time to evolve PNDs in vehicle wake is far lesser ( 1 s)
than time to measure PNDs at roadside (45 ± 6 s)
Dilution is quick enough, and
effect of transformation processes is generally over by the time measurements made at road side.
See Kumar et al. (2008d) for details
PRASHANT KUMAR 89TH AMS MEETING, PHOENIX, 11-15 JANUARY 09 11
MEASUREMENTS
14
15
16
17
18
19
20
-0.8 -0.5 -0.2 0.1 0.4 0.7 1.0 1.3 1.6
Time (s)
Pea
k di
stri
butio
n di
amet
er (
nm)
0
15
30
45
60
75
90
Pea
k di
stri
butio
n di
amet
er (
nm)
PDD (nucleation mode)PDD (accumulation mode)
VEHICLE WAKE 9 of 10
PRASHANT KUMAR 89TH AMS MEETING, PHOENIX, 11-15 JANUARY 09 12
MEASUREMENTS
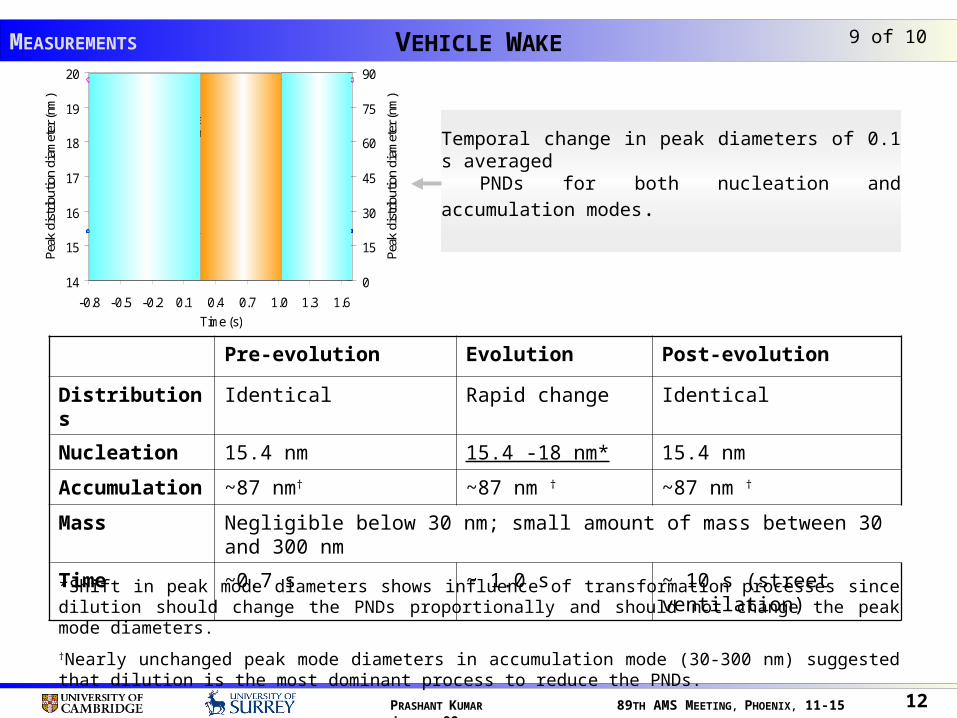
Pre-evolution Evolution Post-evolution
Distributions Identical Rapid change Identical
Nucleation 15.4 nm 15.4 -18 nm* 15.4 nm
Accumulation ~87 nm† ~87 nm † ~87 nm †
Mass Negligible below 30 nm; small amount of mass between 30 and 300 nm
Time ~0.7 s ~ 1.0 s ~ 10 s (street ventilation)
Temporal change in peak diameters of 0.1 s averaged
PNDs for both nucleation and accumulation modes.
*Shift in peak mode diameters shows influence of transformation processes since dilution should change the PNDs proportionally and should not change the peak mode diameters.
†Nearly unchanged peak mode diameters in accumulation mode (30-300 nm) suggested that dilution is the most dominant process to reduce the PNDs.

HYPOTHESIS 10 of 10
See Kumar et al. (2008b, c and d) for detailed testing of hypothesis
PRASHANT KUMAR 89TH AMS MEETING, PHOENIX, 11-15 JANUARY 09 13
“The effect of transformation processes on the particles is nearly over by
the time these particles are measured at roadside and total particle
numbers are then assumed to be conserved”.
MEASUREMENTS

SUMMARY AND CONCLUSIONS
An advanced particle spectrometer was successfully applied to measure PNDs and PNCs in street canyons and in vehicle wake where fast response nature of an instrument is essential.
Vehicle wake measurements showed that the PNDs evolved rapidly in the wake of a moving diesel car and became similar to background PNDs within 1 s.
This evolution was significantly smaller than the typical time ( 456 s) for traffic emissions to reach the roadside in a street canyon.
Comparison of these time scales suggested a hypothesis that the effect of transformation processes is generally complete by the time particles are measured at roadside and total particle numbers can then be assumed to be conserved.
The hypothesis allows to ignore the particle dynamics during street canyon measurements and found to be useful for the modelling of the dispersion of nanoparticles in street canyons (Kumar et al. 2008, 2009).
1 of 1
PRASHANT KUMAR 89TH AMS MEETING, PHOENIX, 11-15 JANUARY 09 14

RELATED ARTICLES FOR DETIALED INFORMATION 1 of 1
JOURNAL• Kumar, P., Garmory, A., Ketzel, M., Berkowicz, R., 2009. Comparative study of measured and modelled number concentration of nanoparticles in an urban street canyon. Atmospheric Environment 43, 949-958.• Kumar, P., Fennell, P., Symonds, J., Britter, R., 2008e. Treatment for the losses of ultrafine aerosol particles in long sampling
tubes during ambient measurements. Atmospheric Environment 42, 8831-8838.• Kumar, P., Fennell, P., Hayhurst, A., Britter, R., 2008d. Street versus rooftop level concentrations of fine particles in a Cambridge Street Canyon. Boundary–Layer Meteorology (in press, doi:10.1007/s10546-008-9300-3). • Kumar, P., Fennell, P., Britter, R., 2008c. Effect of wind direction and speed of the dispersion of nucleation and accumulation
mode particles in an urban street canyon. Science of the Total Environment 402, 82-94.• Kumar, P., Fennell, P., Britter, R., 2008b. Pseudo-simultaneous measurements for the vertical variation of coarse, fine and
ultrafine particles in an urban street canyon. Atmospheric Environment 42, 4304-4319.• Kumar, P., Fennell, P., Britter, R., 2008a. Measurements of the Particles in the 5-1000 nm range close to the road level in an
urban street canyon. Science of the Total Environment 390, 437-447.
CONFERENCE• Kumar, P., Ketzel, M., Robins, A., Britter, R., 2009. Street-scale modelling of nanoparticles using a simplified approach and an
operational model. 7th International Conference on Air Quality-Science and Application, Istanbul (Turkey), 24-27 March 2009.• Kumar, P., Fennell, P., Britter, R., 2008h. The influence of Ambient Meteorology on Nanoparticle Concentration in an Urban
Setting. Cambridge Particle meeting, Cambridge (UK), 16 May 2008.• Kumar, P., Britter, R., 2008g. Measurements and dispersion modelling on traffic-emitted particles in the urban environment .
National Environment Research Institute (Denmark), 7 May 2008. • Kumar, P., Fennell, P., Britter, R., 2007d. Measurement and dispersion behaviour of particles in various size (5 nm>Dp<1000
nm) ranges in a Cambridge Street Canyon. Proceedings of the 11th International Conference on Harmonisation within Atmospheric Dispersion Modelling for Regulatory Purposes, Cambridge (UK), 2-5 July 2007, pp. 368-372.
• Kumar, P., Fennell, P., Britter, R., 2007c. The measurement of fine particles for the study of their dispersion and of street-scale air quality. UK Atmospheric Aerosol Network (UKAAN) Workshop, University of Reading, Berkshire (UK), 6-7 June 2007.
• Kumar, P., Britter, R., 2007b. Particulate Matter: Importance, Regulations and Historical Perspective. ‘Nirmaan’, IIT Delhi Civil Engineering Society, Issue 2, May 2007 pp. 38-42.
• Kumar, P., Britter, R., Langley, D., 2007a. Street versus rooftop level concentrations of fine particles in a Cambridge Street Canyon. 6th International Conference on Urban Air Quality Limassol (Cyprus), 27-29 March 2007, pp. 135-138.
PRASHANT KUMAR 89TH AMS MEETING, PHOENIX, 11-15 JANUARY 09 15
ACKNOWLEDGEMENTS
University of Surrey
Cambridge University Department of Engineering
Cambridge Philosophical Society
Cambridge Commonwealth Trust
Pembroke College, Cambridge
Dr. Paul Fennell (Imperial College, London) – help during experiments
PRASHANT KUMAR 89TH AMS MEETING, PHOENIX, 11-15 JANUARY 09 16
TRAVEL GRANT
1 of 1
THANK YOU
CONTACT
PRASHANT KUMAR
Email: [email protected]
Webpage: http://people.pwf.cam.ac.uk/pp286

Vehicle Wake EXTRA SLIDE
PRASHANT KUMAR 89TH AMS MEETING, PHOENIX, 11-15 JANUARY 09 18
MEASUREMENTS
pp
p Dd
dNDM
Dd
dM
log)(
log
fDppp DCDM ')(
Estimation of PMDs
For dM/dlogDp in gm cm–3, M(Dp) is in Kg and Dp is in nm,
(C’ = 6.95 10–24) is a constant
p (= 1) is the assumed density of a particle in g cm–3
Df (= 3) is the fractal dimension for a spherical particle (Park et al. 2003).