f e monitoring- report ed - qs
TRANSCRIPT
Soya bean mealfrom around theworld
Salmonella contamination is low
Now even more detailed: Parametersin annual comparison
NEW CHALLENGES FOR THE FEED SECTOR? MOSH and MOAH keep the meat industry on its toes
CARRY-OVER OF MOSH AND MOAH INTO FOOD
Salmonella, dioxins, heavy metals and the like are among the common parameters found in residue analysis of feed. Inaddition, less familiar, but no less critical parameters have also shown up more recently and are forcing the industry tobe vigilant. MOSH (mineral oil saturated hydrocarbons) and MOAH (mineral oil aromatic hydrocarbons) are currently thesubject of much media attention. In particular the exact sources of MOSH and MOAH are so far unknown, promptingmuch speculation. For the purposes of objective classification, information is available in the following about currentknowledge surrounding MOSH and MOAH. Which pollutants have increased in animal feed and where the evidence hasdeclined can be read on page four.
We wish you interesting reading. Your QS Team
The editorial team would be delighted to receive your questions and suggestions regarding the QS Monitoring Report. Please submit these to [email protected] ■
The entire supply chain faces new challenges due to pos-sible contamination of packaged foods with hydrocarboncompounds – known as MOSH and MOAH. The causes foraromatic mineral oil transitions are not entirely clear todate. Printer inks, grease or exhaust gases from harvestingmachinery are just a few of the possible origins of conta-mination. We do know: MOSH and MOAH often occur inthe environment around feed and food, and now is thetime to clarify the exact causes of contamination and carry-over effects.
ANALYSIS RESULTS Classification of the analysis results is difficult, because thereare no validated methods and thus no comparability withother results is given. Also, there are no limit values for MOSHand MOAH residues in food or feed. Therefore, it is not cur-rently possible to draw any universal conclusions. Neverthe-less, the detected residue levels (e. g. from former foodstuff )appear too low to explain the high carry-over effects intomuscle meat.
Although currently no marketing restrictions exist, oil residuesin food are undesirable. In terms of preventive consumer andanimal protection, politics and the economy want to get tothe bottom of the causes of MOSH and MOAH and further in-vestigate the sources of contamination. Within the QS schemediscussions are ongoing as to where investigations on mine-ral oil residues are most appropriate.
EXCHANGE BETWEEN SECTORSThe European Commission has also taken up the subject.It has published recommendations on the monitoring of
mineral oil hydrocarbons in foods. Consequently, the EUreference laboratory, together with the Member States, isto draw up guidelines on sampling and analysis methods.In Germany, amongst others, the BLL (German Federationfor Food Law and Food Science) together with representa-tives from the feed monitoring programme, the Federal Mi-nistry of Food and Agriculture, the Federal Institute for RiskAssessment and various food and feed associations haveestablished a round table to come to an understandingabout the national implementation of these EU recommen-dations. ■
www.q-s.de
QS FEED MONITORING IN NUMBERS
Number of analyses 473,057
Number of samples 23,948
Number of exceedances* 205
Participants 4,889
Year Number of analyses
Number ofsamples
Pre 2011 319,492 40,830
2011 303,610 20,832
2012 394,139 23,046
2013 427,405 25,719
2014 450,615 26,820
2015 427,993 26,928
2016 463,478 24,891
2017 (up to 30/06/17) 206,426 10,397
Total 2,993,158 199,463
Period: 01/07/2016 – 30/06/2017
Period: 01/07/2016 – 30/06/2017
Period: 01/07/2016 – 30/06/2017
*Exceedances of maximum level, action limit or guideline value for undesirable substances
... since the last report
... overall totals
Exceedances in selected feeds
Feed Number of samples
Exceedances*
Feed material 14,914 1.21 %
…of which cereal 7,650 1.96 %
...of which oilseeds 2,263 0.40 %
Compound feed 8,778 0.23 %
...of which poultry 2,115 0.09 %
...of which pigs 3,206 0.47 %
…of which ruminants 2,897 0.10 %
…of which mineral feed 492 0.00 %
Premix 175 0.57 %
Feed additives 81 0.00 %
Total 23,948 0.86 %
KEEPING AN EYE ON THE LIMITS?
A risk-based sampling of feed is essential. The interactive world mapat www.q-s.de shows which raw materials in the QS scheme are obtained from which countries and what has been proven analytically.Use this for your risk assessment.
MONITORING-REPORTFeed Sector Edition 2017
FEED
Page 2 Page 3 Page 4

Monitoring-Report 2017 Feed
SOYA BEAN MEAL FROM AROUND THE WORLD
UNDESIRABLE SUBSTANCES: LITTLE POLLUTIONThere are no significant differences between soya products of diffe-rent origins – this is the results of current QS feed monitoring evaluations.
DIFFERENCE IN EXCEEDING OF GUIDANCE VALUESThe comparison between Germany and other countries shows that a measurement foran active substance is detected with almost equal frequency, meaning that a valueis above detection limit (Germany: approx. 45 %, other countries: around 40 %).Exceedances are fortunately found in only a very small number of cases. If we takea closer look, limit violations of maximum levels and guidance values for productsof German origin are lower to the power of ten than for feed materials from abroad:
the proportion in foreign products is a good 3 %, while the share is only 0.3 % infeed materials of German origin. ■
FEW IRREGULARITIESThe analysis results for on-farm mixtures made by poultry farmers are generally unremarkable. No limit valueshave been exceeded since collection of the data started in 2008. To generally estimate contamination levels, inaddition to the limit values, the values below the stipulated limits (≥ 50 % of the most stringent limit) are alsotaken into consideration. Here too, the values are fine. Only the analyses for dioxins show occasional increasedreadings just below the limit values. Apart from this, there was one value respectively for each of the heavy me-tals arsenic and lead exceeding 50 % of the permissible limit.
The analysis for pesticide residues determined an elevated value for the active substance mecarbam (insecticide)throughout the entire period. In addition, a single positive result for salmonella was detected among the totalof 274 samples. ■
COMPARISON OF GERMAN AND FOREIGN FEED MATERIAL
FARMERS HAVE ON-FARM MIXTURESFOR POULTRY UNDER CONTROL
*with reference to the raw material (soya beans)
Period: 01/01/16 – 30/06/2017
Germany 6,559 45.02 % 1 0.01 % 2 0.01 % 40 0.27 % 14,568
Other 2,853 39.61 % 2 0.03 % 7 0.10 % 229 3.18 % 7,202
Number ofsamples
Value measured Action threshold Maximum level Guidance value
in %Number ofsamples in %
Number ofsamples in %
Number ofsamples in % Total
Less than 8 % of the analyses revealed readings for any unwantedsubstance at all. This shows that irregularities were only establishedoccasionally and in exceptional cases. On examining this 8 % moreclosely, it becomes evident that an increased content of dioxin-likePCBs (dl PCB) and the plant protection product fludioxonil werefound in soya products from South America (Brazil). Samples withthe United States indicated as land of origin produced two positivesalmonella results. Soya products from Europe also reveal barely anyirregularities. In Serbia (Danube region), one single elevated valuefor the heavy metal nickel was found. In Spain, two feed sampleswere flagged as un acceptable due to salmonella along with a singlecase due to the plant protection product cypermethrin.
The high number of soya processing mills in Germany is the reasonthat for the majority of analyses in the QS database, Germany is re-corded as the country of origin. In actual fact, however, the country inwhich the product is farmed is defined as the origin and not the placewhere the product is processed. Although the processed product wasproduced in Germany, the origin of raw materials should be specifiedif known. Only in this way can conclusions be drawn regarding parti-cular places of origin. Currently, more than 4,000 analysis results existfor soya products originating in Germany. Only in one single samplewas the active substance deltamethrin found to exist in an elevatedconcentration.
By the way: The QS findings about different origins not resulting ina significant difference match those from other recognised standardsorganisations in the animal feed sector. ■
Results from soya products by origin
Exceedances for feed material: Germany vs. Rest of the World
Exceedance
Analyses on-farm mixtures – poultry
Dioxins 40 40 100.00 % 2 AGW: 0.5 ng/kg; HG:0.75 ng/kg
dl PCBs 19 18 94.74 % 0 AGW: 0.5 ng/kg
ndl PCBs 23 7 30.43 % 0 HG: 10 µg/kg
Arsenic 50 36 72.00 % 1 HG: 2 mg/kg
Lead 50 46 92.00 % 1 HG: 5 mg/kg
Cadmium 50 49 98.00 % 0 HG: 0.5 mg/kg
Mercury 50 7 14.00 % 0 HG: 0.1 mg/kg
Salmonellae 274 1 0.36 % 1 positiv
Plant protection products 1,854 9 0.49 % 1* HG: 0.01 mg/kg
Active antibiotic substances 41 0 0.00 % 0 positiv
On-farm mixturesfeed poultry
Number of Analyses
Values detected in %
Value ≥ 50% ofstrictest limit value Limit values
* active substance: mecarbam AGW: Action threshold HG: Limit value
Period
: 01
/01/20
08 –
30/06/20
17
Argentina 228 11.40 %
Brazil 896 5.25 % Dl PCB, fludioxonil* (each found in soya bean extraction meal)
Germany 4,507 4.57 % deltamethrin* (in soya beans, steam-heated)
Italy 3,414 7.23 %
Croatia 109 0.00 %
Austria 696 5.60 %
Paraguay 262 6.87 %
Poland 161 4.97 %
Romania 277 9.03 %
Switzerland 63 6.35 %
Serbia 124 14.52 % nickel (in soya cake)
Spain 1,293 10.90 % Cypermethrin*: Salmonellae (2x) (each found in soya bean extraction meal)
Hungary 261 6.90 %
USA 154 7.79 % Salmonellae (2x) (each found in soya bean extraction meal)
Total 12,445 7.02 %
Country oforigin
Number of analyses
Value detected
Values > 50% of strictest limit value
Period
: 01
/01/16
–30
/06/20
17
Number of samples
countries
Monitoring-Report 2017 Feed
HARVEST 2016: INCREASED MYCOTOXIN CONTAMINATIONS
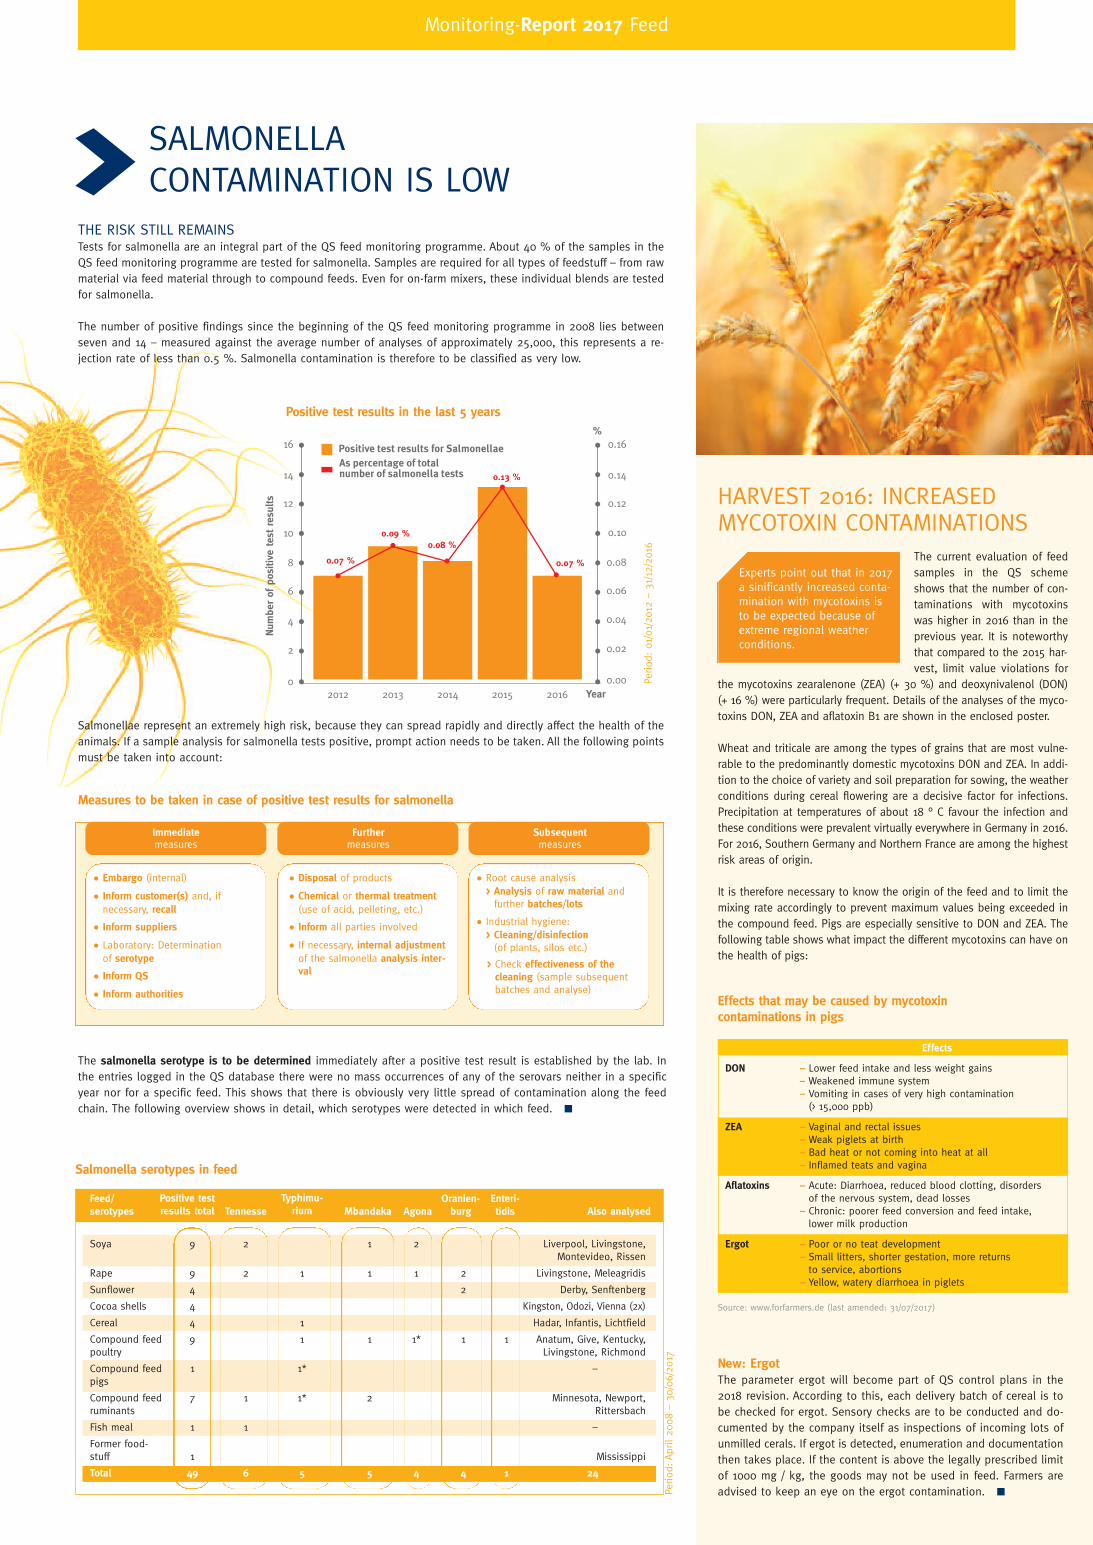
THE RISK STILL REMAINSTests for salmonella are an integral part of the QS feed monitoring programme. About 40 % of the samples in theQS feed monitoring programme are tested for salmonella. Samples are required for all types of feedstuff – from rawmaterial via feed material through to compound feeds. Even for on-farm mixers, these individual blends are testedfor salmonella.
The number of positive findings since the beginning of the QS feed monitoring programme in 2008 lies betweenseven and 14 – measured against the average number of analyses of approximately 25,000, this represents a re-jection rate of less than 0.5 %. Salmonella contamination is therefore to be classified as very low.
Salmonellae represent an extremely high risk, because they can spread rapidly and directly affect the health of theanimals. If a sample analysis for salmonella tests positive, prompt action needs to be taken. All the following pointsmust be taken into account:
The salmonella serotype is to be determined immediately after a positive test result is established by the lab. Inthe entries logged in the QS database there were no mass occurrences of any of the serovars neither in a specificyear nor for a specific feed. This shows that there is obviously very little spread of contamination along the feedchain. The following overview shows in detail, which serotypes were detected in which feed. ■
The current evaluation of feedsamples in the QS schemeshows that the number of con-taminations with mycotoxinswas higher in 2016 than in theprevious year. It is noteworthythat compared to the 2015 har-vest, limit value violations for
the mycotoxins zearalenone (ZEA) (+ 30 %) and deoxynivalenol (DON)(+ 16 %) were particularly frequent. Details of the analyses of the myco-toxins DON, ZEA and aflatoxin B1 are shown in the enclosed poster.
Wheat and triticale are among the types of grains that are most vulne-rable to the predominantly domestic mycotoxins DON and ZEA. In addi-tion to the choice of variety and soil preparation for sowing, the weatherconditions during cereal flowering are a decisive factor for infections.Precipitation at temperatures of about 18 ° C favour the infection andthese conditions were prevalent virtually everywhere in Germany in 2016.For 2016, Southern Germany and Northern France are among the highestrisk areas of origin.
It is therefore necessary to know the origin of the feed and to limit themixing rate accordingly to prevent maximum values being exceeded inthe compound feed. Pigs are especially sensitive to DON and ZEA. Thefollowing table shows what impact the different mycotoxins can have onthe health of pigs:
SALMONELLA CONTAMINATION IS LOW
Effects that may be caused by mycotoxin contaminations in pigs
DON – Lower feed intake and less weight gains– Weakened immune system– Vomiting in cases of very high contamination (> 15,000 ppb)
ZEA – Vaginal and rectal issues– Weak piglets at birth– Bad heat or not coming into heat at all– Inflamed teats and vagina
Aflatoxins – Acute: Diarrhoea, reduced blood clotting, disordersof the nervous system, dead losses
– Chronic: poorer feed conversion and feed intake,lower milk production
Ergot – Poor or no teat development– Small litters, shorter gestation, more returns to service, abortions
– Yellow, watery diarrhoea in piglets
Effects
New: ErgotThe parameter ergot will become part of QS control plans in the2018 revision. According to this, each delivery batch of cereal is tobe checked for ergot. Sensory checks are to be conducted and do-cumented by the company itself as inspections of incoming lots ofunmilled cerals. If ergot is detected, enumeration and documentationthen takes place. If the content is above the legally prescribed limitof 1000 mg / kg, the goods may not be used in feed. Farmers areadvised to keep an eye on the ergot contamination. ■
Source: www.forfarmers.de (last amended: 31/07/2017)
Num
ber
of p
ositi
ve tes
t re
sults
Year
0.07 % 0.07 %
0.09 %0.08 %
0.13 %
0
2
4
6
8
10
12
14
16
0.00
0.02
0.04
0.06
0.08
0.10
0.12
0.14
0.16
2012 2013 2014 2015 2016
Positive test results for SalmonellaeAs percentage of total number of salmonella tests
%
Positive test results in the last 5 years
Measures to be taken in case of positive test results for salmonella
Salmonella serotypes in feed
• Embargo (internal)
• Inform customer(s) and, if necessary, recall
• Inform suppliers
• Laboratory: Determination of serotype
• Inform QS
• Inform authorities
• Disposal of products
• Chemical or thermal treatment(use of acid, pelleting, etc.)
• Inform all parties involved
• If necessary, internal adjustmentof the salmonella analysis inter-val
Immediate measures
Furthermeasures
Soya 9 2 1 2 Liverpool, Livingstone, Montevideo, Rissen
Rape 9 2 1 1 1 2 Livingstone, Meleagridis
Sunflower 4 2 Derby, Senftenberg
Cocoa shells 4 Kingston, Odozi, Vienna (2x)
Cereal 4 1 Hadar, Infantis, Lichtfield
Compound feed 9 1 1 1* 1 1 Anatum, Give, Kentucky, poultry Livingstone, Richmond
Compound feed 1 1* –pigs
Compound feed 7 1 1* 2 Minnesota, Newport, ruminants Rittersbach
Fish meal 1 1 –
Former food-stuff 1 Mississippi
Total 49 6 5 5 4 4 1 24
Feed/serotypes
Positive testresults total Tennesse
Typhimu-rium Mbandaka Agona
Oranien-burg
Enteri-tidis Also analysed
Period
: Ap
ril 20
08 –
30/06/20
17
Period
: 01
/01/20
12 –
31/12/20
16
Experts point out that in 2017a sinificantly increased conta-mination with mycotoxins isto be expected because ofextreme regional weatherconditions.
• Root cause analysis> Analysis of raw material andfurther batches/lots
• Industrial hygiene: > Cleaning/disinfection (of plants, silos etc.)
> Check effectiveness of thecleaning (sample subsequentbatches and analyse)
Subsequent measures

NOW EVEN MORE DETAILED: PARAMETERS IN ANNUAL COMPARISON
VALUES FOR DIOXINS AND DIOXIN-LIKE PCBS HAVE DROPPED
The annual comparison of parameters was expanded: in addition to showing how often an undesirable substance was detected,the measurement range is now also shown. For this purpose, QS has set 50 % of the maximum content as a limit. Therefore,the table below shows by how many percentage points the value measured was above this 50 % limit value. The followingtrends are emerging for the 12 selected parameters:
Dioxins, dioxin-like PCBs (dl-PCB), as well as the sum of the two parameters were detected in 2015 and 2016 in effectivelyequal frequency. Contaminations therefore still exist as before. The content levels measured in the individual samples, however,have fallen significantly in 2016 compared to 2015 to 2014.
A more differentiated picture is to be seen regarding non-dioxin-like PCBs: the frequency of detection has increased in the lastthree years, whilst contamination has fallen with the content values being clearly below the limit values.
Contamination with the heavy metals arsenic, lead and mercury has increased in 2016 compared to the previous year. Whereas,for example, in 2015 the levels of mercury greater than or equal to 50 % of the limit value in the samples tested were at 9.07 %, the value in 2016 has risen more than two percentage points to 11.86 %.
After a peak of positive salmonella results in 2015, the value for the year 2016 has returned to the level of 2014. A look at thefigures for the first half of 2017, however, shows a renewed increase in positive results to 0.18 % – and this is also reflected inthe figures in the enclosed poster.
Regarding the detection of active antibiotic substances, there was a decrease in 2015, however there were more positive testresults in 2016, similar to 2014.
The two plant protection products, pirimiphos-methyl and chlorpyrifos-methyl were detected with increasing frequency from2014 through 2015 up to 2016. The pollution load is, however, declining - particularly in the case of chlorpyrifos-methyl. ■
ImprintEditor: QS Qualität und Sicherheit GmbHDr. Hermann-Josef Nienhoff, Managing DirectorSchedestr. 1–3D-53113 BonnPhone +49 228 35068-0Fax +49 228 35068-10E-Mail: [email protected]: Susanne Del Din (del din design, Siegburg)Pictures: QS Qualität und Sicherheit GmbH, ShutterstockData basis: Analysis results of QS feed monitoring from April 2008 to June 2017
THE EDITOR: WHO IS QS?
QS ensures food safety – from the farm to shop. 95 percent of the pork and poultrymeat from German production today comes from QS-certified businesses and theequivalent figure is 90 percent for beef. Approximately 75,000 livestock farmers par-ticipate directly in the QS scheme and 48,500 livestock farmers participate by usingmutual recognitions with other standard owners. The joint objective is consistent self-assessments and comprehensive assurance of processes and origins.Producers of fresh fruit, vegetables and potatoes are also involved. Within the QSscheme, they produce safe foods in line with clearly defined criteria with the sup-port of all upstream and downstream stages of the process.
Monitoring-Report 2017 FeedAs
of
Sept
embe
r 20
17
SAMPLE RELATED DATA NOWWITH INFORMATION ON THETYPE OF SAMPLE– AS PER CONTROL PLAN (REGULAR SAMPLE)– FROM GATE-KEEPING– FOR POSITIVE RELEASE SAMPLING– FOR SPECIAL APPROVAL– AS PER ADDITIONAL CONTROL PLAN– AS PER AD-HOC PLAN
Since July 2017 information on the type of sample has alsobeen collected when entering sample monitoring data in theQS database. A distinction is made between regular samples,samples for gate-keeping, additional control samples or ad-hoc samples. The sample types for approval testing and spe-cial approval are also available for selection, these beingrequired for certain fat and oil products. An even more so-phisticated analysis of monitoring data will be possible inthe future by gathering information on specimen type.
Analyses results for undesired substances in annual comparison
Dioxins 4,738 84.85 % 7.59 % 4,579 87.49 % 7.41 % 4,455 87.21 % 4.50 %
dl PCBs 4,520 82.08 % 6.01 % 4,387 85.82 % 6.53 % 4,237 85.58 % 3.78 %
Total Dioxins & dl PCBs 2,160 86.34 % 6.81 % 1,993 89.76 % 7.66 % 1,911 89.48 % 1.70 %
ndl PCBs 3,851 62.43 % 4.87 % 3,852 65.06 % 5.31 % 3,726 68.92 % 1.44 %
Arsenic 5,858 33.87 % 20.21 % 5,841 31.30 % 18.82 % 5,856 31.75 % 21.30 %
Lead 5,976 45.03 % 9.10 % 5,924 46.17 % 8.04 % 5,931 46.03 % 9.23 %
Cadmium 5,978 64.00 % 4.76 % 5,924 63.54 % 4.86 % 5,933 64.92 % 4.67 %
Mercury 5,871 9.59 % 10.30 % 5,851 6.03 % 9.07 % 5,858 7.34 % 11.86 %
Salmonellae* 10,010 0.08 % – 10,405 0.13 % – 10,114 0.07 % –
Active antibiotic substances 979 0.41 % – 905 0.22 % – 870 0.57 % –
Pirimiphos-methyl (Pesticide) 4,831 11.24 % 100.00 % 4,844 12.10 % 99.66 % 4,651 13.24 % 99.84 %
Chlorpyrifos-methyl (Pesticide) 4,832 2.59 % 71.20 % 4,845 2.70 % 77.10 % 4,651 3.23 % 63.33 %
Parameter Number of analyses
Value estab-lished
Value ≥ 50%of strictestlimit value
2014
Number of analyses
Value estab-lished
Value ≥ 50%of strictestlimit value
2015
Number of analyses
Value estab-lished
Value ≥ 50%of strictestlimit value
2016
Trend(Value
established)
Trend ≥50% ofstrictest
limit value
Trend
*only positive / negative results
NEW STATUS “SAMPLE RELATEDDATA CREATED”If a data record Is not fully created at the outset, but is savedfor subsequent processing, this will now automatically be al-located the status “Sample related data created”.
Please note: With this status, the chosen laboratory does notyet have access to the data record. During the next proces-sing stage, data records of this type can be unlocked for asampler via the button “Entrust Sampler” or, if internal pro-cessing is completed, transferred to the laboratory. In thiscase, the button “Entrust Laboratory” is to be selected. Onlywith the status “Laboratory commissioned” does the appoin-ted laboratory have access to the data record and can savethe results of the analysis. ■
Period: 1/1/2014 – 31/12/2016