fac meeting, december 2, 2011 - federal reserve system · economic uncertainties risk, ans d low...
TRANSCRIPT
AGENDA
Meeting of the Federal Advisory Council and the Board of Governors
Friday, December 2, 2011
Item 1: Current Market Conditions
What is the Council's view of the current condition of, and the outlook for, loan markets and financial markets generally?
Overview Substantial differences persist between conditions in regions of the country and loan products within regions. The continued challenges relating to high unemployment, weak housing markets and flagging consumer confidence have been exacerbated by negative developments in the Eurozone and inaction in Washington D.C. Economic uncertainties have caused many businesses and individuals to build cash balances and curtail capital investment. Nonetheless, commercial and industrial loan demand improved in some districts with growth concentrated in upper middle market and large corporate segments.
CFO Magazine's recent survey showed that 55% of CFOs surveyed plan to maintain their current liquidity levels for the next 12 months due to economic and political uncertainty.
Economic uncertainties, risks and low revenue growth are quashing more robust lending and investment spending, rather than the lack of credit availability. Loan demand remains flat for working capital financing, merger and acquisition activities, capital investment and capacity expansion.
With new credit demand still limited, lenders remain highly competitive, both in rate and in structure. Much of the loan activity is from refinancing transactions, rather than new business investment.
The combination of a sluggish economy and muted credit demand, very low interest rates, abundant bank capital and liquidity, reduced fee income and dramatically increased regulatory and compliance costs is causing some aggressive banks to lead a broader relaxation of risk/reward tolerances. The Council believes that aggressive pricing and looser underwriting, including extended terms and weaker transaction structures, are likely to persist and even get worse. These accumulating risks, including interest rate risk mismatches, will ultimately result in higher loan losses.
(A) Small Business Lending: Has credit availability for, and demand for credit from, small businesses changed significantly over the past three months? Have there been changes in lending standards for these borrowers?
• Members' views on small business lending are remarkably consistent between Districts. Political and economic uncertainties and weakness in the economy greatly affect small businesses. Generally, small businesses have not yet emerged from the "bunker mentality" of the past three years and many of these businesses continue to struggle to rebuild their businesses and balance sheets, further impacting demand for credit. Low customer demand and the disappearance of home equity as collateral are also depressing borrowing levels.
• Loan activity is little changed in the third quarter of 2011 but improved from a year ago. Much of this activity relates to opportunistic refinance transactions in the current low interest rate environment.
• Despite price competition, Council members state that their underwriting standards are stable.
• A recent PNC Small Business Economic Outlook Survey showed continued low demand for credit and pessimism regarding the U.S. economy. The majority of respondents cited the negative economic effects anticipated from the U.S. debt limit deal and the S&P ratings downgrade. Eighty-two percent of those surveyed said they will probably or definitely not take out a new loan or line of credit in the next six months, up from 76% a year ago.
• The National Federation of Independent Business' survey showed that the vast majority of small business owners' (91%) credit needs are being met or that they are not interested in borrowing.
(B) Update on Commercial Real Estate Lending: Have there been any changes in the Council's view of the challenges in the commercial real estate market in the past three months? How are commercial real estate loans performing compared to your expectations?
• Generally, the commercial real estate market appears to be stabilizing in all Districts. Stress factors, such as foreclosures and short sales, in the single-family housing market have caused an increase in demand for rental units, particularly in urban areas. As a result, rents are increasing and demand for quality properties is improving even as cap rates are declining. However, low cap rates may not be sustainable in a higher interest rate environment and property values could fall should rents fail to keep pace with increased debt service costs. Risks remain elevated in high vacancy markets, such as suburban office and retail properties. The recovery in commercial real estate remains fragile and fragmented.
• Loan performance has generally been stable to modestly improving in all Districts, except the Southeast. Weak demographics and valuation shortfalls have curtailed lending, as lending standards have remained constant.
• CRE loan performance continues to show solid improvement. Non-performing assets continue to decline quarter over quarter for the past year. There has been relatively steady improvement in all asset classes, with land loans remaining the weakest.
• The low interest rate environment is allowing many over-levered borrowers additional time and cash flow to de-lever. However, many loans still need to be recapitalized to meet current underwriting guidelines.
• Effective rents for retail, office and industrial properties are stable in many areas, but vacancy rates remain near cyclical highs.

• Delinquency rates remain high; however, they have peaked and the expectation is for continued improvement in 2012. Multi-family apartments are showing particular strength, including improvement in value, as prior homeowners are becoming renters again.
• Debt and equity markets for public real estate companies have been very active in 2011. Public real estate companies continue to access these markets and use the proceeds to pay down debt and acquire properties.
• CRE investors continue to search and pay for yields which are considered stable and safe. Those assets, such as infill apartments in major metropolitan areas of California or long-term credit tenant lease deals, continue to command very high prices (4-6% cap rates versus historic averages of 200 basis points higher). Other assets experience a gap between the "bid and ask." That is, buyers are demanding higher pro forma returns than possible given the sale prices. Accordingly, market activity for these properties is slow.
(C) Construction Lending: What is the Council's view of the availability of credit for construction and development projects? Has the Council seen any changes in the demand for construction loans in the past three months?
• Generally, construction loan availability is limited to non-speculative projects. Transaction characteristics include cash equity, pre leasing with financially strong tenants, pre sales or high quality borrowers. Currently, property types associated with new construction include multi-family, CVS or Walgreens type projects, professional services offices (owner-occupied), hospital expansions, other owner-occupied warehouse/office, niche office location and government buildings.
• Demand by multi-family developers is clearly the strongest in this sector, and banks are actively working with well-respected and trusted developers.
• There is almost no reported appetite for lending to single-family residential construction projects. Housing starts are at historic lows, while housing permits issued continue to trail historic averages. The foreclosure shadow market will dampen new construction until the high inventory levels are absorbed.
• Demand for Acquisition, Construction & Development loans remains weak in most Districts. There is limited new activity in select markets like Washington, DC and NYC. Developers and lenders alike will not risk capital unless the property is pre leased or there are signs of strong demand.
• There is limited availability of credit for land development projects. Most lenders continue to recover from weak CRE construction performance and remain hesitant to return to this space. Furthermore, banks continue to realize charge off on CRE loans caused by declining values. A few markets are showing signs of stabilization for some property types; thus, new construction may make sense in some niche locations for well-defined projects. However, there continue to be many commercial properties available at prices far below current construction costs. Until the excess inventory of under performing properties is absorbed or repositioned, new construction opportunities will remain limited.
(D) Agricultural Lending: Have there been any recent changes in agricultural lending?
• Members with active agricultural lending books report robust supply conditions for grain, livestock and commodities financing. Demand centers around ethanol and feed financing. Several members observed rising land prices, which is attracting new investors, though some question if this could lead to a bubble in the sector. Delinquencies on farm loans continue to decline or stabilize.
• The Council had mixed views on agriculture lending driven by cattle farming, depending upon location and drought conditions. In some instances, banks are seeing continued pay-downs of outstanding credit lines as beef producers retire or leave the market due to declining margins as a result of high feed costs. Producers in geographies less affected by the drought are seeking expanded credit lines.
• Most operators have had a very solid year as commodity prices are at (or near) all-time highs.
• According to the Federal Reserve Bank of Kansas City, agricultural lending in the third quarter of 2011 was boosted by large bank rate cuts.
• The California agricultural lending market remains strong with solid fundamentals, particularly in the fruits, nuts, vegetables and other miscellaneous row crops sectors. The general strength in food and basic commodities prices continues to buoy food market performance and farmland real estate values.
• There also appears to be strong agricultural lending performance in other parts of the country, with some food price inflation occurring globally and domestically (currently running at 5-7% versus normal food inflation of 2.5%). While this is increasingly an issue at the retail "sell-through" level, it is (so far) not manifest at the production end of the food channel for the above referenced products, which are in high demand both domestically (flight-to-quality) and internationally (higher emerging-market disposable incomes).
(E) Update on Consumer Lending: What changes have you seen in consumer lending?
• Consumer lending is gradually improving. Much of the growth has been concentrated in non-revolving credit categories, such as auto loans, while growth in revolving credit (credit cards, HELOCs) has remained weaker as consumers remain cautious. Auto sales are recovering in part due to postponed purchases during the recession, driving the increase in auto loans. Student loan growth is being driven by increased enrollments and federal loan limits and rising costs of education. A recent increase in reported federal student loan delinquencies and charge-offs is symptomatic of a serious emerging problem.
• Credit card losses have improved steadily over the past year and a half. Bankruptcies, recoveries and delinquency flow rates all continue to improve. Council members, however, expect little further improvement.
• Credit card debt continued to fall at a slow pace in the industry with year-over-year growth only coming from a couple of large issuers. Despite the improving credit performance, card loan demand still has much room to improve as growth is coming primarily from a return of Travel &Entertainment spending and the most affluent consumers.

• As mortgage rates remain at historic lows, first mortgages continue to be an attractive choice for those able to afford the down payment and monthly payments. Home equity lending, both term and lines, continues to be the primary source of consumer loan growth for banks. Depressed home prices and sales, backlogs in sales of distressed properties and overall economic conditions have negatively affected appraisals and valuations of home prices, thereby limiting the equity available as a base from which consumers can borrow.
• Generally, consumers remain cautious due to unemployment and market performance. Consumers are rate shopping and refinancing debt at lower costs. No significant new borrowing is being seen and borrowing under existing lines of credit has actually ebbed.
(F) Update on Home Mortgage Lending: What changes have you seen in the home mortgage market in the past three months?
• A majority of members noted that the decline of mortgage rates to historic lows in the third quarter triggered an increase in refinance activity, accounting for 75% to 80% of originations. There was limited to no increase in purchase mortgage applications. In some markets, high inventory and declining housing market values have made it difficult for borrowers to refinance. Home prices are stable, soft or declining depending on the markets and types of home. Prices may continue to fall as "shadow inventory" is absorbed by the market. Members cite changed conforming loan limits, increased mortgage insurance rates (HUD doubled the monthly mortgage insurance rate for FHA loans, reducing FHA refinancing activity), increased mortgage servicing expenses and regulatory induced limits on banks' risk appetite as factors negatively affecting the home mortgage market.
• Refinance activity, which is already at least 60% of mortgage lending activity, is expected to increase as banks gear up for HARP II. Bank resources dedicated to such programs are already strained. It also appears that Freddie Mac and Fannie Mae struggle to implement program guidelines required by the FHFA by December 1, 2011. For instance, the GSEs have not yet committed to pricing the HARP II program and there is much confusion regarding the representations and warranty provisions. Unless clarified, this may introduce greater risk to the mortgage system. Without regulatory relief, many banks will be hard-pressed to meet the intentions of the HARP II program or offer the program at all.
(G) Mortgage Foreclosures: What changes has the Council seen in the pace of mortgage foreclosures during the past three months?
• Generally, foreclosures increased slightly in the quarter. While the slowdown in the processing of filings in the wake of the robosigning scandal is gradually reversing, previously observed impediments remain. Banks face increased regulatory scrutiny as federal and state agencies investigate foreclosure practices and create new state and local laws adding loss mitigation and foreclosure requirements. In addition, banks must submit to audits of servicers' foreclosure processes and procedures, including vendor management and title documentation.
Item 2: Recent Changes in Government Mortgage Refinancing Programs
Will the recent changes in the Home Affordable Refinance Program (HARP) result in substantially higher levels of mortgage refinancing? What type of borrower is most affected by these changes?
• Council members responded unanimously that the revisions to HARP (now known as HARP 2.0) will result in modest increases in refinancing. The revised parameters of the program(s) are tailored for a relatively narrow class of mortgagees who are current in their payments but have negative equity in their home. These are borrowers who have so far evidenced an aversion to defaulting on their mortgage and a long-term commitment to their neighborhoods. The programs' elimination of the cap at 125% LTV should allow these borrowers to refinance at today's lower rates and improve their personal cash flows. It is hoped that the programs will prevent further strategic defaults and foreclosures in an already weak market. The programs are offered to borrowers with conventional mortgages that were sold to Fannie Mae or Freddie Mac before May 31, 2009, and have not been previously refinanced under HARP. It is not available to those with FHA or VA insured mortgages or for those with private mortgages. While there are some differences between the new programs supported by Fannie and Freddie, the general features of HARP 2.0 are as follows:
•The borrower must be current in their payments. • The borrower must have had no late payments within the past six months.
•The borrower may not have had more than one payment being more than 30 days past due within the last 12 months. For a fixed rate mortgage with a maximum term of 30 years, there will be no maximum CLTV.
• For a fixed rate mortgage with a term greater than 30 years and less than 40 years, the maximum CLTV is 105%.
• For adjustable rate mortgages, the maximum CLTV is 105% • For originators, future repurchase risk may be lessened due to a reduction in some
representations and warranties that were required in the original mortgage. • For borrowers and originators, refinancings with minimal increases indicated in
monthly payments, there can be a reduction in the types of qualifying documentation required by Fannie and Freddie.
• For borrowers, the programs remove the 2- to 4-year waiting periods to re-establish credit after a prior bankruptcy or foreclosure.
• For borrowers, it eliminates certain mandatory risk-factor pricing adjustments. • F H F A estimates the program will potentially help 1 million borrowers. The program is
considered a "tune up" rather than an overhaul. The programs are voluntary to banks and they may participate as they wish.
Obstacles • I t should be noted that by encouraging borrowers to refinance at lower rates, existing
investors (including banks) in Fannie or Freddie securitizations may see prepayment speeds increase and the value of their investments diminished. Several additional obstacles have been discussed by the mortgage industry that may impact the effectiveness of the program.
• One of the main Council's concerns is the adherence and strength of the policies around the elimination and/or reduction of the original loans' representations and warranties. Fannie Mae has provided some additional clarity for its standards, but originators are still somewhat uncertain. Lenders are concerned that the modified loans could be classified as high risk, which would trigger scrutiny from the GSE's and, potentially, revoke guarantees.
•Lenders may choose not to participate unless they currently service the loan. Lenders may not want to take on another lender's origination issues.
• Lenders may overlay additional guidelines negating the flexibility of the program. • Freddie Mac's version provides much less benefit if the servicer is different. • It is not clear if second mortgage lenders will choose to subordinate to the new first
liens with high CLTVs. Certain private securitizations limit the subordination to a maximum CLTV of 100% or pool triggers may be invoked. With the refinance programs' elimination of the 125% cap the possibility these pool triggers are hit is increased.
•The programs do not address the difficulties in having an existing mortgage insurance company provide coverage when there is a change in the servicer. This potentially increases the fee cost to borrowers in coursing a new insurance provider.
• T h e s e programs can help a number of current pay borrowers who were previously unable to refinance due to insufficient equity to take advantage of the lower rate environment. For those borrowers, it will decrease their monthly cash outflows, but the program may have minimal economic impact if the number of borrowers able to refinance is low.
Item 3: REO Disposition
The government owns large numbers of foreclosed single-family properties. Many banks own large numbers of such properties as well. What government actions would be most helpful in promoting the disposition of REO and stabilizing housing markets?
Encourage and incent investors to enter the market: • F a c i l i t a t e bulk purchases of geographically concentrated properties by providing
conservative but attractive financing • R e l a x underwriting parameters for Fannie and Freddie loans to facilitate the sale of REO • P r o v i d e incentives, such as tax breaks and subsidized mortgages, to investors in geographic
regions where inventory to sales ratios are out of balance • M a k e FHA funding available to investors

Promote home ownership for individuals: • Provide incentives, such as tax breaks and subsidized mortgages, to individuals who
purchase foreclosed homes; perhaps, greater incentives for first-time home buyers • Remove or reduce the post-foreclosure waiting period before a borrower becomes eligible
for a GSE loan based on the circumstances of the original default • Amend the proposed QRM (Qualified Residential Mortgage) rules, which have the
potential to restrict availability and increase the cost of home mortgages • Extend the super conforming loan limits for another year to keep liquidity in the markets • Review all loan programs for opportunities to introduce bank judgment for certain "near-
qualified" borrowers
Develop a professionally managed, large-scale program to rent REO properties: • Provide financing to support an affiliation of REO property owners, large professional
property managers and traditional housing finance investors to develop a large-scale rental market for REO properties
• In order to avoid creating additional market disruption, this action should be considered only in markets where adding significant housing stock will not put further long-term pressure on home valuations
Create more transparency and efficiency to promote awareness and encourage confidence: • Mandate that all servicers must register foreclosures with a central clearinghouse and that
servicers keep a sign posted on every foreclosed property, disclosing contact information for the servicer and the deed holder of the property
• Develop direct marketing and sales channels to broaden the buyer market and promote fair pricing
Take steps to allow foreclosures to come to market sooner: • There should be a deadline for the completion of audits and remediation for banks subject
to the OCC Consent Order. The standard for "financial harm" and "remediation" should be narrowly defined with the focus on substantive servicing deficiencies directly resulting in substantive harm to borrowers. Borrowers who are in default and did not qualify for loan payment assistance should proceed to foreclosure without delay.
• Mandate uniformity of state foreclosure rules and processes • Evaluate the role of the courts in the foreclosure process
Establish higher standards for deed holders of foreclosed properties: • Require that all foreclosed properties be brought to code and sold in a reasonable period
of time, or • If a property is not brought to code (after some determined period of time), require that it
be razed.

Item 4: Federal Reserve MBS Purchases
What is the Council's view on the effects of Federal Reserve MBS purchases on primary and secondary mortgage markets?
• The consensus of Council members is that the Federal Reserve's MBS purchases associated with QE1 and QE2 had the desired effect of stabilizing spreads and reducing mortgage rates to historic lows, now in the 4% range for a 30 year fixed-rate mortgage. According to TD Economics, the Federal Reserve's MBS purchases made as part of the first round of quantitative easing compressed spreads to Treasuries by approximately 120 basis points.
• There is uncertainty and concern regarding the impact that the eventual unwinding of these investments will have on financial markets.
• The Fed's actions have also demonstrated support for MBS as an asset class which has had a number of important effects including: creating a stabilizing effect from a global investor's point of view, providing much-needed liquidity, and reducing overall volatility in the market.
• With respect to the Fed's recent decision to hold steady the size of their MBS portfolio, it appears that the market had anticipated the announcement and that the decision has contributed to keeping rates at historic lows. However, it is difficult to isolate the impact of the Fed's actions as other factors, such as the European debt crisis, have had an impact on rates and spreads as well.
In terms of the impact of the Fed's actions on the overall housing market, declining home prices, high unemployment, litigation faced by banks and general risk aversion has made it difficult for millions of Americans to take advantage of these historically low interest rates to either purchase a home or refinance an existing mortgage.
Item 5: Retail Banking
Given recent and highly publicized increases in fees for consumer transaction products, what is the outlook for retail banking at the largest commercial banks?
The retail banking business model is being transformed by the financial crisis, new regulation, consolidation and the digital revolution.
• R e t a i l banks will face significant cyclical headwinds that are likely to persist for an extended period of time: • A very low interest rate environment combined with a flat yield curve • Anemic loan demand as businesses and consumers de-lever • The continued recovery from high credit losses sustained during the Great Recession
• E v e n as these cyclical headwinds eventually abate, the industry faces long term structural pressures as well: • Curtailment of fee revenues, which McKinsey estimates will make 40% of retail
banking customers no longer profitable to serve • Significantly increased regulatory and compliance costs • Higher required capital levels and other comprehensive income (OCI) volatility
• Accelerating investment requirements in new technologies and capabilities to remain competitive, which to date have yielded little cost substitution away from branches
•Limited access to quality assets due to consolidation of consumer lending and continued encroachment of GSEs and FHA
With dramatically increased regulations, accelerating technology investments and limited access to quality assets, retail banks will evolve to a new reality. Over time, we will see:
• M o r e transparency in the products, pricing and practices of the regulated banking industry • O p e r a t i n g cost reductions, lower service levels and branch closures • L o w e r rates on deposits • H i g h e r account maintenance fees and other fees and higher minimum balance
requirements, although the timing of these fee increases may be delayed by public pressure • These changes will be felt disproportionately by mass market customers who will pay
more for banking services than in recent years • M i g r a t i o n of many lower-end customers out of the traditional, regulated banking system to
the shadow banking system and its less regulated products, practices and disclosures •Acce le ra t ion in the demise of many small banks, who
• Especially lack access to enough quality assets, and often default to making loans that other banks will not make
• Lack the necessary scale to afford higher regulatory and compliance costs • Can be disproportionately vulnerable to OCI capital volatility
• M o r e consolidation • A protracted period of significantly depressed returns, on the way to a new equilibrium of
lower returns consistent with reduced levels of risk and higher capital
Item 6: Loan Classifications
Is there a need to update or change the framework used by the financial institutions regulatory agencies to assess the loss potential of bank assets? In particular, should the definitions used by the agencies to classify loans be changed? If so, what changes would the Council recommend?
Overview Fundamental changes to the general regulatory classification framework (special mention, sub-standard, doubtful and loss) is not necessary, as this framework is familiar to banking organizations, supervisors and market participants. However, the Council believes additional clarity in several areas would make the existing framework more risk-sensitive and better aligned with accounting and other regulatory standards. Additional clarity also would promote the important goal of uniform application of the framework by all agencies.
• T h e current classification system focuses heavily on probability of default (PD), and gives too little consideration and guidance to loss given default (LGD), expected loss (EL) and factors that may reduce LGD and EL, such as collateral, guarantees or transaction structure. The focus just on PD means that two different assets may be placed in the same risk category even if the assets present very different risk of loss to the bank.

• For example, OCC circular 2004-25 requires that all sub-investment grade and unrated securities (other than those held in trading accounts) be classified Substandard. However, senior securitization tranches typically have a significantly lower loss expectation than junior or first-loss tranches due to the subordination and enhancements inherent in the transaction structure. Securities should be subject to the bank's risk rating system in a fashion similar to loans and not automatically be rated Substandard.
• Under the current system, loans to single-asset and asset-based borrowers may be considered potentially weak and criticized without adequate consideration of associated guarantees or transaction features that significantly limit the bank's risk of loss. A corporate or personal guarantee from a financially responsible guarantor may be a critical feature in the sound underwriting of these loans, yet the current classification system is relatively silent on how such guarantees will be treated. Asset-based facilities often are fully secured by working capital assets and subject to frequent monitoring as well as cash dominion requirements, features that have helped these facilities show very low levels of losses even through 2009 and 2010. As such, we recommend that the strength of the transaction structure be given much greater consideration in the classification. • Incorporating LGD and EL concepts more explicitly in the framework (such as, by having asset quality evaluated, subject to appropriate guidance, on the combination of the obligor's rating and the facility's estimated loss severity) would improve transparency and better align the framework with Basel II and ALLL determinations.
• T h e inconsistency between accounting standards (ASC Sub-Topic 310-30, formerly SOP 03-3), which require the recording of loans at fair value on the day of an acquisition, and regulatory classifications, which are based on contractual obligations, also is creating conflicting views of bank credit quality. The regulatory agencies require that acquired loans be classified based on the borrower's contractual obligation despite the fact that the GAAP balance sheet recorded investment in the loan is generally lower due to the purchase accounting discount mark. Because this discounting removes much of the financial risk, acquired loans impaired under SOP 03-3 should not be deemed criticized absent other factors.
• T h e agencies should use illustrative scenarios, like those included in the agencies' 2009 Policy Statement on Commercial Real Estate Loan Workouts, more frequently to promote greater clarity and a consistent understanding of classification standards.
Item 7: Economic Discussion
(A) What does the Council believe to be the reasons for the pace of the economic recovery?
Members noted that, despite unprecedented fiscal and monetary stimulus, the recovery remains anemic, and inflation continues to decline. Members provided numerous reasons for the unusually anemic recovery, including:

• Wealth destruction. During the global financial crisis, the U.S. household sector lost approximately $16 trillion in net worth, about half of which was in housing. This led to higher saving rates and balance sheet repair, which retarded consumer spending. Part of the reduction in consumer debt is due to charge-off, but part is due to changes in attitude, as indicated by increased savings rates.
• Excess supply of housing. Robust construction during the run-up to the recession has left the U.S. with an excess of housing units. Based on vacancy rates, one could argue that there are about 3.2 million excess houses available. The problem of excess supply is compounded by a marked decline in housing demand, as household formations have fallen to about one half of their normal pace.
• Fiscal drag. Cutbacks in the state and local government sector are shrinking public sector demand and employment. Potential cuts to Federal spending could contribute to reduced public sector demand, particularly in areas such as defense and education. Under funding of pension plans, due to low interest rates resulting from current monetary policy, are particularly acute in the public sector, draining funds from potential public works projects.
• Poor business, consumer and investor confidence. Consumer confidence and small business optimism sit well below the corresponding troughs of the last recession and have dropped since early 2011. Businesses remain cautious about hiring. The demand for credit, not availability, continues to be the main reason for lack of loan growth. Lingering memories of the stock market crash and fear of another contribute to limiting consumer spending, loan demand and investment.
• Concern over U.S. Federal and EU government debt. Businesses are concerned by continued instability in financial markets and the potential for tax increases. Numerous Council members are highly critical of U.S. efforts to address Federal fiscal issues. Customers are increasingly aware of risks posed by the ongoing EU debt crisis.
• Regulatory uncertainty. Businesses are concerned by the potential impact of the Federal health care law and the regulatory burden that will be created on financial firms by the Dodd-Frank Act. Regulatory uncertainty has contributed to corporate managers relegating business investment to the sidelines while waiting for "the smoke to clear."
• Nature of Crisis. Recovery is likely to be slower due to the nature of the financial crisis. Research has found that recessions caused by banking / financial crises are deeper and longer, and recoveries are much slower, typically taking four to five years. Other academic research has found that recoveries following credit bubbles are almost always lackluster.
(B) How would you assess overall economic conditions in your region? Are there significant differences across sections or regions?
Most Districts reported slow growth. Unemployment rates in several districts (Districts 1 (Boston), 5 (Richmond), 10 (Kansas City) and 11 (Dallas)) were below the national rate. Wages have shown little growth and hiring is generally subdued. Most Districts reported some variation across sections and regions. Sectors reporting growth included energy, agriculture, military-based economies, tourism, residential and commercial construction, residential and commercial real estate, professional services, manufacturing, mining, logging and high tech.
• According to a recent forecast from the New England Economic Partnership (NEEP), the New England economy is expected to grow slowly through 2012 and not to pick up momentum and strength until well into 2013. The region is not expected to return to its pre recession employment level until the second quarter of 2015, which is two quarters after the expected recovery of jobs lost nationally in the recession. Declining or flat median housing prices are expected to continue until early 2013 and then increase only modestly. The regional unemployment rate is expected to remain below the US average, but still above 8 percent until late 2013. The region will continue to see significant variation in economic performance, with Vermont and New Hampshire expected to have the strongest employment growth in the region. Maine and Connecticut are expected to have the lowest employment growth. Rhode Island is expected to continue to have the highest unemployment rate in the region.
• District 3 (Philadelphia) cites several factors weighing heavily on regional growth. First, uncertainty about the fiscal outlook in D.C. has hurt business across Virginia and Maryland (although some of Maryland's advanced technical industries are still faring well). Second, the Beige Book reports that non-tourism consumer spending growth is languishing. Third, demand for "lower-tech" non-transportation manufacturing activity (like textiles) appears to be weak.
• District 5 (Richmond) is at or better on most economic metrics than the U.S. as a whole. While the region remains diverse, the general trend has been very similar to the U.S. Washington, DC remains stronger than the nation as a whole with a lower unemployment rates, higher retail sales and a stronger housing market. An unemployment rate of 6.2% is well below the national average of 9.0%, though the proposed reductions in the federal budget may increase layoffs and the recent rise in the unemployment rate from 5.8% in June to 6.2% in September may be the beginning of further weakness to come. In 2010, employment growth in the Washington metropolitan area averaged 1,700 per month, but so far in 2011 it has averaged only 1,400 per month.
• The economy in District 6 (Atlanta) continues to expand at a slow pace. Information obtained from the Regional Economic Information Network (REIN) shows a stable employment picture, but few states have any meaningful job growth. Unemployment rates in most southeastern states, with the exception of Louisiana (6.9%), are above the U.S. rate. Although these rates remain high for most states, there are areas beginning to show improvement, such as Florida and Tennessee. The energy sector continues to show improvement for Louisiana and most of the Gulf South. While consumer confidence remains low, sales tax revenues have increased across the region.
• District 7 (Chicago) experienced below average growth in the third quarter, but was more in-line with national trends, according to the Midwest Economy Index. District contacts remain uncertain about the economic outlook and have expressed concern about the recent financial market developments.
• Individual banking markets in District 8 (St. Louis) are generally tracking U.S. averages. There is some strength in areas with predominantly military-based local economies. Agricultural activity is continuing to positively influence local economies in many areas. Respondents note anecdotally that small plant closings are having a concentrated effect on rural and smaller communities.
• District 9's (Minneapolis) economy increased modestly in recent months. Increased activity was noted in consumer spending, tourism, residential and commercial construction, residential and commercial real estate, professional services, manufacturing, energy and mining. Hiring at district companies increased slightly, while wage pressures remained generally subdued.
• Banks in District 10 (Kansas City) had a much milder recession than the rest of the country because of their lower concentration of commercial real estate loans and sub prime mortgages and higher concentration of energy and agriculture businesses. Banks are perhaps more exposed to commodity prices. Home prices have declined less than national averages and are leveling consistent with national trends. Oklahoma home prices have actually appreciated slightly. Arizona saw the steepest price decline year-over-year at 14.9% but only 4.5% quarter-over-quarter. Unemployment rates continue to be below the U.S. national average. Oklahoma, Arkansas and New Mexico are near "full employment" (5-6% unemployment) in major markets. Colorado has among the highest unemployment in the District at 8.6% as of September 30, 2011, but has shown continued job growth quarter-over-quarter. Wages are still virtually flat, 1.8% increase year-over-year.
• In District 11 (Dallas), uncertainty and over regulation are affecting all parts of the economy. Texas appears to be doing better than most areas of the country. In October, it added 13,500 private sector jobs, bringing the total non farm employment gains to over 231,600 for the year. Job growth has averaged over 2.0% for the past five consecutive months, leaving the overall unemployment rate in the state at 8.4%, a .1% improvement over September. The unemployment rate is largely the result of sidelined corporate investment. The private sector is leading the charge in the state job growth rate, adding 286,200 jobs over the past year. The public sector is still being pared back. Mining and logging, which includes oil and gas drilling activities, have added jobs at a 20.5% rate during the year.
• Markets in District 12 (San Francisco) appear to have stabilized and are showing some signs of modest improvement. However, business owners are still cautious. This reluctance to spend money on plants or people is pervasive, though it has not changed over the past three months. Growth is coming from high-tech, knowledge-based companies and those businesses with ties to Asian economies, agriculture and tourism. The California business environment appears stabilized. Earnings continue to be supported through expense cutting rather than revenue growth. While most regions are relatively stable, certain areas like the San Francisco Bay Area and Orange County appear to be ahead of the other regions in regards to financial performance and growth. Nevada, Arizona and inland parts of California continue to be in economic duress, particularly in real estate. In general, those areas in which housing was substantially overbuilt are recovering the most slowly and are not yet seeing fully stabilized home prices.
Item 8: Particular Indicators
(A) Inflation: Are the prices of products and services rising more or less quickly (or declining more) than in the recent past? Are the prices for the products and services you purchase rising more or less quickly?

• Prices have been rising less quickly than in the recent past, principally because gasoline prices have declined from their peak. Prices of consumer goods and services held steady in recent months. The U.S. Consumer Price Index (October 2011 from October 2010) increased 3.5%, as shown in Chart 1. However, the CPI excluding food and energy increased just 2.1% during this period.
Chart 1 - U.S. CPI (October 2010 - 2011)
Spread between U.S. Consumer Price Index (October 2011 from October 2010). Data plotted as a curve. Units in percentage points. In October 2010 curve started on about 1.25%. In November 2010 curve on about 1.05%. In December 2010 curve on about 1.5%. In January 2011 curve on about 1.6%. In February 2011 curve on about 2.25%. In March 2011 curve on about 2.75%. In April 2011 curve on about 3.3%. In May 2011 curve on about 3.6%. In June 2011 curve on about 3.6%. In July 2011 curve on about 3.6%. In August 2011 curve on about 3.8%. In September curve on about 3.9%. In October 2011 curve ends on about 3.5%
• The CPI dropped in October 2011 as compared to the three months prior, as illustrated in Chart 2. Transportation costs trended down month-to-month, and only medical costs were slightly higher.
• Prices for the primary products and services banks purchase (primarily labor and technology) also held fairly steady the past few months. Total compensation costs across all private industry segments increased 2.1% for the 12 months ending September 30, 2011 and 0.4% for the three months ending September 30, 2011.
• Health care and benefit costs are rising more rapidly than wages - a difficult trend for employers and employees. Information and information processing costs across private segments declined 2.3% for the 12 months ending September 30, 2011 and declined 0.5% for the three months ending September 30, 2011, as companies continue to trim costs. Banks, however, are experiencing increasing technology costs, as they implement technology to support the requirements of new regulation.
Chart 2 - U.S. CPI Expenditure Categories (Month-to-Month)
Spread between U.S. Consumer Price Index Expenditure Categories (Month-to-Month) Data plotted as a four curves. As shown in the figure curves are expressed in basis points. As shown in the figure curves started in early June 2011. Curve"Food and Beverages"on about 0.2%.Curve"Housing" on about 1.5%. Curve""Transportation" -1.6%.Curve"Medical Care"1.4%. In July 2011.Curve"Food and Beverages"on about 0.5%. Curve"Housing" on about 0.4%.Curve""Transportation" -0.2%. Curve"Medical Care"0.4%.In August 2011. Curve"Food and Beverages"on about 0.6%.Curve"Housing" on about 0.2%. Curve""Transportation" 0%.Curve"Medical Care"0.3%.In September 2011. Curve"Food and Beverages"on about 0.5%.Curve"Housing" on about 0%. Curve""Transportation" -0.3%.Curve"Medical Care"0.2%. All curves ended in October 2011.Curve"Food and Beverages"on about 0.3%. Curve"Housing" on about -0.2%.Curve""Transportation" -1.4%.Curve"Medical Care"0.3%.
• Members noted weakening global growth prospects and persistent softness in the U.S. economy will reduce the likelihood of core price growth. Rental rates for housing have increased in most markets, and it was reported that food prices in some regions have not leveled off as much as national trends. We expect core inflation to remain around the Federal Reserve's implicit 2% target.
(B) The Valuation of the Dollar: How have recent changes in the value of the dollar affected your business or your customers' businesses?
• The recent improvements in the value of the dollar have not materially affected our businesses. For the past 12 months, the broad trade-weighted value of the U.S. dollar has been nearly unchanged. Since reaching a cyclical low in August, the dollar has appreciated nearly 4% on a nominal trade-weighted basis owing to global macro economic uncertainties and financial market volatility. Appreciation in the U.S. dollar relative to emerging market countries (excluding China) has been more significant.
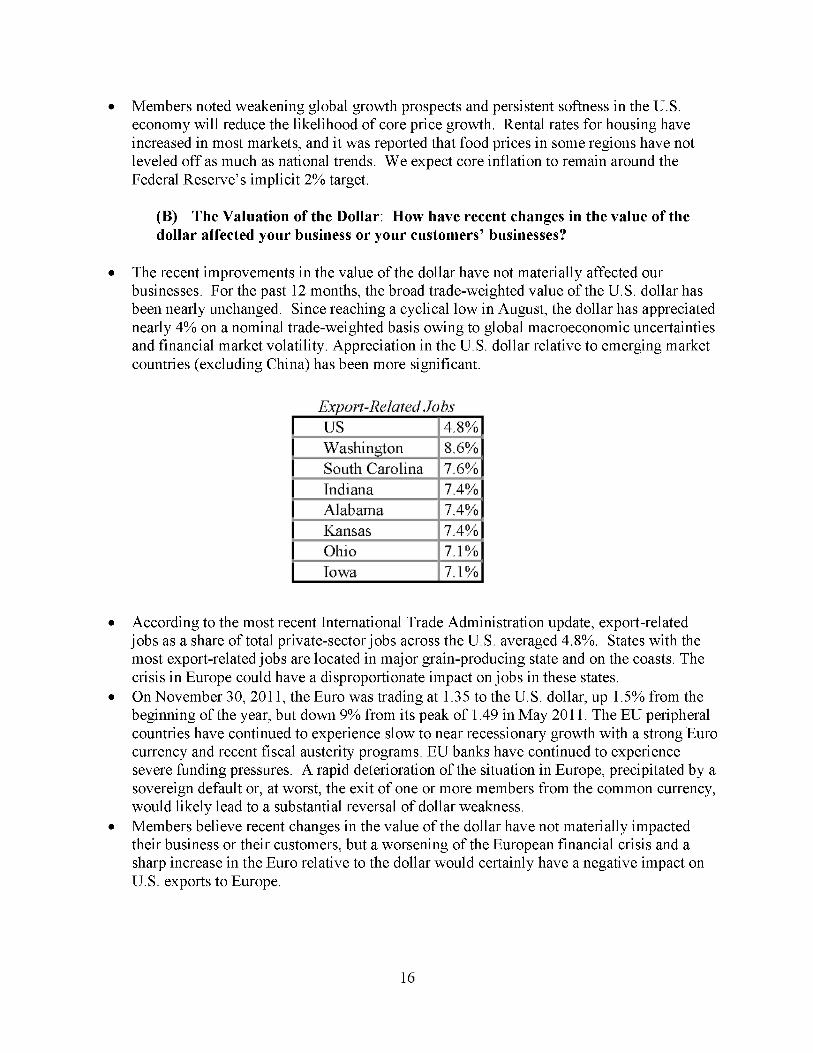
Export-Related Jobs: US 4.8%;Washington 8.6% South Carolina 7.6%;Indiana 7.4% Alabama 7.4%;Kansas 7.4% Ohio 7.1%;Iowa 7.1%
• According to the most recent International Trade Administration update, export-related jobs as a share of total private-sector jobs across the U.S. averaged 4.8%. States with the most export-related jobs are located in major grain-producing state and on the coasts. The crisis in Europe could have a disproportionate impact on jobs in these states.
• On November 30, 2011, the Euro was trading at 1.35 to the U.S. dollar, up 1.5% from the beginning of the year, but down 9% from its peak of 1.49 in May 2011. The EU peripheral countries have continued to experience slow to near recessionary growth with a strong Euro currency and recent fiscal austerity programs. EU banks have continued to experience severe funding pressures. A rapid deterioration of the situation in Europe, precipitated by a sovereign default or, at worst, the exit of one or more members from the common currency, would likely lead to a substantial reversal of dollar weakness.
• Members believe recent changes in the value of the dollar have not materially impacted their business or their customers, but a worsening of the European financial crisis and a sharp increase in the Euro relative to the dollar would certainly have a negative impact on U.S. exports to Europe.

(C) Housing: How have house prices changed in recent months? Have there been any changes in housing activity overall in your region?
• U.S. Home prices continued to fall through the first half of the year, but appeared to stabilize.
• The South and Midwest, in particular, have shown noticeable improvements within major MSAs, particularly in Michigan, Indiana and Wisconsin. Oklahoma home prices were up for the first time since the beginning of the recession.
• The pipeline of foreclosures and distressed sales are continuing to negatively impact home values.
Figure of Change in Median Sales Price September 30, 2011.United States in one year period on about -4%; United States in one quarter period on about 0%;Northeast(Footnote 1 The Mid Atlantic states have shown more improvement than South Atlantic states. New England, especially Boston, prices appear to be holding. The foreclosure pipelines in New York and New Jersey are daunting end footnote) in one year period on about -7%;Northeas in one quarter period on about -3%; Midwest in one year period on about-2%;Midwest in one quarter period on about 2%; South in one year period on about-2%;South in one quarter period on about 1%; West(Footnote 2 In California, middle market and luxury market are continuing to be soft, while low end and high market are leveling. Nevada and Arizona are still in decline, with some signs of leveling end footnote)in one year period on about -9%; West in one quarter period on about-5%.
• The National Association of Realtors recently released positive news regarding existing home sales volumes. Nationwide existing home sales rose 1.4% in October. The Northeast remains the weakest region with a 5.1% decline in October sales from September and the West saw the biggest increase, up 4.4% from September. The remaining regions also posted solid gains.
• Mortgage refinancing activity has nearly doubled since the first quarter of 2011 with near record low mortgage interest rates. Mortgage refinance activity is still below the record levels reached during the first quarter 2009 and the fourth quarter 2010.
• On November 8, 2011, Zillow reported that 28.6% of homeowners with mortgages have negative equity in their homes (up from 26.8% in the second quarter).
• Construction contracts and single family housing permits have been flat across the nation. One member reported builders are buying raw land at distressed prices for new construction and are able to under-cut prices of existing homes.
• Many community banks and independent mortgage companies have decided to exit the mortgage business. The effect of consolidation and competition will create incredible challenges and opportunities for some in the industry. Larger banks are faced with enforcement actions, while mortgage lenders are struggling to keep pace with the requirements of new regulation.
• These distractions and burdens will have a negative impact on the successful implementation of HARP II. Banking regulators should consider extending deadlines for the implementation of new regulations which will have no material impact on systemic risk or consumer protection.
(D) Labor Markets: How have the labor markets in which you operate changed in recent months? In particular, assess the degree of job loss (how much and in which industries). Has there been any significant job creation? What changes to wages have Council members observed since the last meeting?
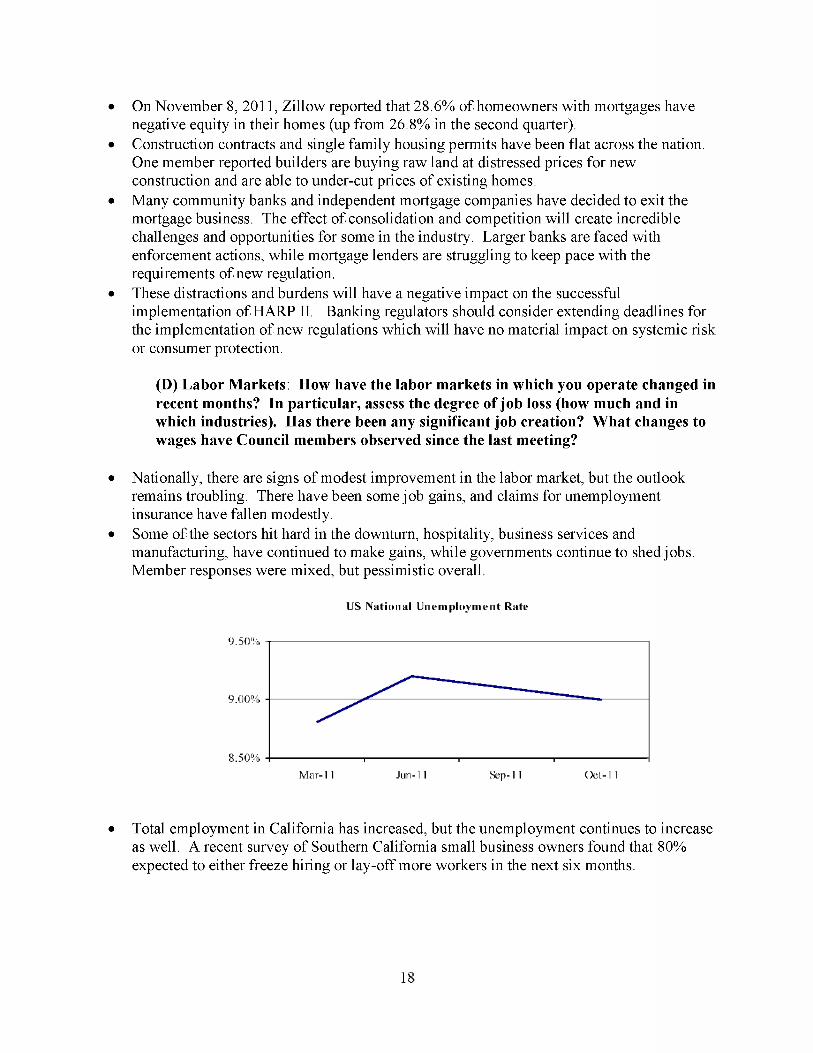
• Nationally, there are signs of modest improvement in the labor market, but the outlook remains troubling. There have been some job gains, and claims for unemployment insurance have fallen modestly.
• Some of the sectors hit hard in the downturn, hospitality, business services and manufacturing, have continued to make gains, while governments continue to shed jobs. Member responses were mixed, but pessimistic overall.
Spread between US National Unemployment Rate. Data plotted as a curve. Units are percentage points. As shown in the figure curve started in March 2011 on about 8.75%, reduced quickly and reached about 9.25% in June 2011. Then curve started going down spread on about 9.1% on September 2011.In October curve ended on about 9% level.
• Total employment in California has increased, but the unemployment continues to increase as well. A recent survey of Southern California small business owners found that 80% expected to either freeze hiring or lay-off more workers in the next six months.
• The South Atlantic remains weak and New England and Mid-Atlantic states are showing signs of weakening. Georgia lost 27,000 jobs over the last five months in leisure, hospitality and government, while unemployment rose to 10.2%. By contrast, Louisiana had broad job gains and reduced unemployment to 6.9%.
• Year-over-year improvements can be seen in Nevada, Michigan, Rhode Island, Florida and Oregon.
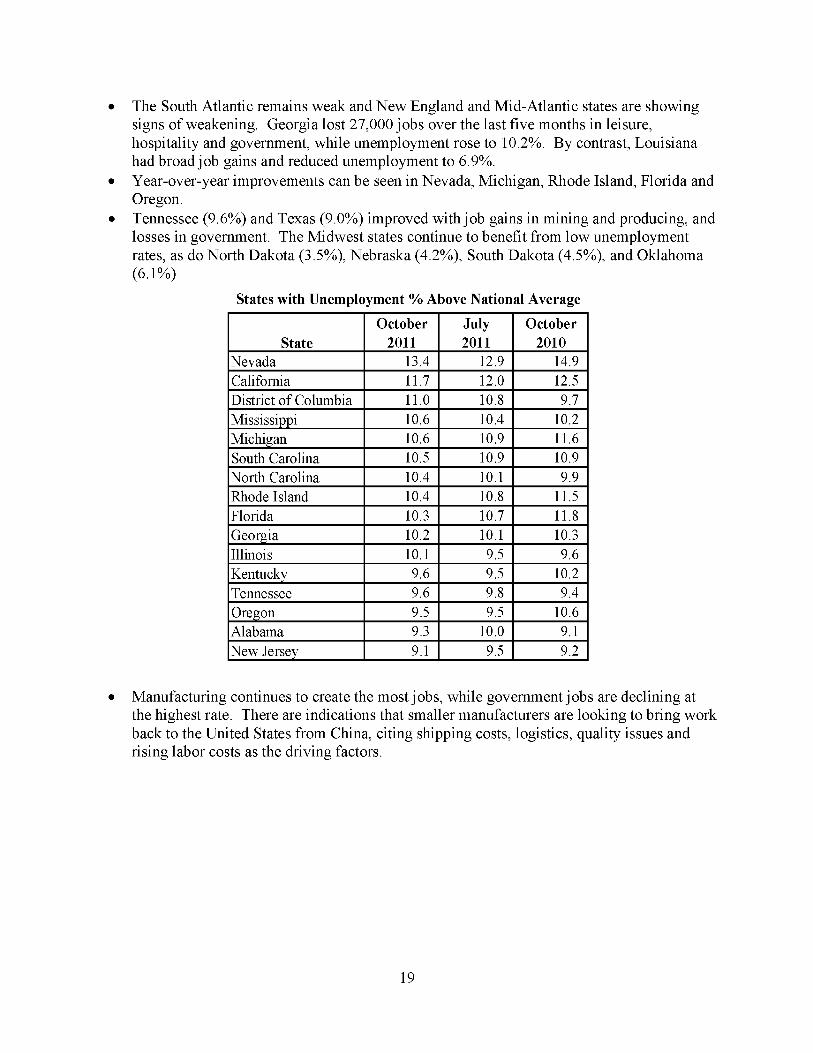
• Tennessee (9.6%) and Texas (9.0%) improved with job gains in mining and producing, and losses in government. The Midwest states continue to benefit from low unemployment rates, as do North Dakota (3.5%), Nebraska (4.2%), South Dakota (4.5%), and Oklahoma (6.1%)
States with Unemployment % Above National Average Heading row column 1 State column 2 October 2011 column 3 July 2011 column 4 October 2010 end heading row State:Nevada October 2011:13.4 July 2011:12.9 October 2010:14.9 State:California October 2011:11.7 July 2011:12.0 October 2010:12.5 State:District of Columbia October 2011:11.0 July 2011:10.8 October 2010:9.7 State:Mississippi October 2011:10.6 July 2011:10.4 October 2010:10.2 State:Michigan October 2011:10.6 July 2011:10.9 October 2010:11.6 State:South Carolina October 2011:10.5 July 2011:10.9 October 2010:10.9 State:North Carolina October 2011:10.4 July 2011:10.1 October 2010:9.9 State:Rhode Island October 2011:10.4 July 2011:10.8 October 2010:11.5 State:Florida October 2011:10.3 July 2011:10.7 October 2010:11.8 State:Georgia October 2011:10.2 July 2011:10.1 October 2010:10.3 State:Illinois October 2011:10.1 July 2011:9.5 October 2010:9.6 State:Kentucky October 2011:9.6 July 2011:9.5 October 2010:10.2 State:Tennessee October 2011:9.6 July 2011:9.8 October 2010:9.4 State:Oregon October 2011:9.5 July 2011:9.5 October 2010:10.6 State:Alabama October 2011:9.3 July 2011:10.0 October 2010:9.1 State:New Jersey October 2011:9.1 July 2011:9.5 October 2010:9.2
• Manufacturing continues to create the most jobs, while government jobs are declining at the highest rate. There are indications that smaller manufacturers are looking to bring work back to the United States from China, citing shipping costs, logistics, quality issues and rising labor costs as the driving factors.

National Cumulat ive N u m b e r of Employees C h a n g e (1000's)
Figure of National Cumulative Number of Employees Change (1000's). March 2011:Construction on about 10 level;Finance on about -5 level; Government on about -100 level;Manufacturingon about 130 level; September2011:Construction on about 30 level; Finance on about -5 level;Government on about -175 level; Manufacturing on about 80level;
(E) Consumer Confidence: Is the Council seeing signs of improved consumer confidence and increased consumer spending? What is the outlook for consumer credit losses?
• C o n s u m e r confidence rebounded as the Conference Board reported that the consumer confidence index increased to 56.0, after falling sharply through most of the year to an August low of 44.5.
• W h i l e still at distressed levels, more consumers were more optimistic that the economy and their personal finances were improving.
• M e m b e r s observed that: • Domestic real personal consumption improved in the third quarter of 2011. • The savings rate declined in the third quarter of 2011 to near pre recession levels. • Wages are not keeping pace with spending growth. • Consumers are procrastinating on major purchases and investments. • Auto sales (in most areas) have moderated as demand is fulfilled. • Further job losses are expected. • New England was among the bright spots in consumer confidence surveys. • More consumers are planning to tighten their holiday spending budgets. • The political climate in Washington, D.C. is having a significant negative impact on
confidence. • Business confidence is low as well. • Low interest rates and loan demand and increasing regulation add pressure on banks
and other businesses to control expenses. • Members reported a stable to improving outlook for consumer credit, including auto loans
and credit cards. Delinquency rates, bankruptcies and recoveries are all continuing to improve in the most recent data. Much of this improvement is tied to portfolio seasoning and low debt service burdens.
Item 9: Monetary Policy
How would the Council assess the current stance of monetary policy?
Overview All Council members agree that current monetary policy is highly accommodative. Most members believe the current level of accommodation to be appropriate given modest inflation and significant growth, employment, and housing challenges. Further accommodation (e.g., QE3) is available though not supported absent additional deterioration, potentially as a result of contagion from the European crises. Some members noted that the recent "operation twist" and additional transparency seem to be having their intended effect in terms of lower long-term interest rates. Several members cautioned that the current high level of accommodation is likely delaying necessary de-leveraging and full recovery. One member feels the policy has been largely ineffective and the unforeseen costs will impact the economy for generations.
Council members expressed several concerns: • Housing continues to drag heavily on the economy.
o Mortgage rates are already at record low levels and the ability to drive rates even lower in the primary mortgage market for loan originations depends on originators' ability to process increased volume. In the past, originator capacity constraints have been binding, and there is little reason to believe that this would not be the case under a QE3 MBS based buying program.
o The beneficial impact for consumers from the accommodative monetary policy and other housing-related regulatory changes seems modest at best. Even though home prices are relatively low, buyers remain on the sidelines due to fears of continued price declines, concerns about job security and stricter underwriting. Only those consumers that are in a reasonably strong position (i.e., adequate equity in the home, ability to furnish full income documentation, etc.) are able to obtain low-cost financing. Therefore, a "transmission problem" exists between the policy intentions and the ability of many consumers to benefit from those policies.
• Fiscal and regulatory efforts need to become more supportive of the current highly accommodative money policy.
o The vast amount of recently released and currently proposed regulations has caused tremendous uncertainty for financial institutions.
o The inability by Congress to establish confidence in effective fiscal policy creation exacerbates business and household reluctance to borrow/spend.