facies analysis of an upper jurassic carbonate geothermal
TRANSCRIPT

European Geothermal Congress 2019
Den Haag, The Netherlands, 11-14 June 2019
1
Facies Analysis of an Upper Jurassic Carbonate Geothermal Reservoir
Hartwig von Hartmann1, Vladimir Shipilin1, Ernesto Meneses Rioseco1, Hermann Buness1
1 Leibniz-Institute for Applied Geophysics, Stilleweg 2, 30655 Hannover
Keywords: carbonates, wavelet transform, attribute
classification, seismic sequence stratigraphy
ABSTRACT
The exploration of deep geothermal reservoirs is still a
challenge. Therefore actual exploration procedures
from the hydrocarbon industry are adopted. The aim is
to improve reservoir models by facies prediction and
support better well paths planning. The background for
this study is a project of the “Stadtwerke München” to
supply their district heating net with geothermal energy.
This programme replaces conventional energy for
500.000 inhabitants by the year 2040. We applied
frequency blending, attribute classification and seismic
sequence stratigraphy to 170 km2 large seismic survey.
The survey aimed at exploring an Upper Jurassic
carbonate platform. Using these methods, we visualised
the heterogeneity of the carbonate platform,
constructed facies models and developed a zonation of
the reservoir, which served as a base for a numerical
reservoir model.
1. INTRODUCTION
Carbonate layers are favourable reservoirs for
geothermal use. In Europe, these are the Dogger aquifer
in the Paris Basin (Jaudin et al. 2009), the Dinantian
carbonates in the Netherlands (Reijmer et al. 2017) and
the Upper Jurassic carbonate platform in Southern
Germany (Lüschen et al. 2011). There are several
reasons for an enhanced permeability of carbonates.
The brittle deformation and low shale content cause
open fracture zones in the vicinity of faults. Karst
features develop during terrestrial conditions.
Dolomitization occurs during the subsequent burying
process and leads to secondary porosity. Finally, the
facies, depending on the local sedimentary
environment, govern primary porosity and have an
impact on the dolomitization process.
In this study, we analysed the facies distribution of the
Upper Jurassic carbonate platform in the South German
Molasse Basin. Especially we investigated if seismic
sequence stratigraphy can be a useful tool to distinguish
between different carbonate facies. Which methods can
be used or are useful and can we improve the
construction of geothermal reservoirs.
The Molasse Basin of Southern Germany is the main
area of geothermal energy production by deep wells.
The warm water is produced from the 600 m thick
carbonates. The main exploration targets up to now are
prominent faults, which strike subparallel the Alpine
front and were successively active during the formation
of the basin. In 2014, the local energy supplier
‘Stadtwerke München’ started a project to provide the
district heating net with geothermal energy. In this
project, there will be approximately 20 wells at 5
locations drilled into the carbonate platform. The well
paths will penetrate the platform within an area of about
170 km2. A seismic survey covering this area should
provide information to place the well paths at
favourable locations. These comprise a major fault
system within the subsurface of Munich and so-called
carbonate build-ups. The latter consist of massif
carbonate rocks, which are mostly dolomitized and are
separated from each other by troughs filled with
carbonate mudstones (Pawellek and Aigner 2003).
A 2500 m thick sedimentary pile of Tertiary marine and
fluviatile sediments covers the carbonate platform in
the area of Munich. The stratigraphy of the platform is
divided according to the dominant fauna (Schmid et al.
2005), but the overall development shows a successive
shallowing upward of the sedimentary environment
which has a strong impact on the size and distribution
of the build-ups. It seems that patch-reefs had
developed only at the latest stage of the building of the
platform (Meyer and Schmidt-Kahler 1989).
2. METHODS
Outcrop studies 100 km north of the survey area and
sparsely distributed wells within the Molasse basin
constrain the facies interpretation (Pawellek and Aigner
2003). Here we analysed of a 170 km2 large 3D-seismic
survey for facies interpretation. CRS (common
reflection surface) (Menyoli et al. 2004) processing and
a PSDM (prestack depth migration) enhanced the
quality of the data substantially. We applied several
methods during the interpretation process. Because of
the strong faulting we use a flattening to reconstruct the
former geometry of the platform. Therefore, we used a
Tertiary key reflector above the platform, the so-called
Lithotaminion limestone, besides Cretaceous sediments
cover the carbonate platform partly toward the south.
The Upper Jurassic Purbeck reflector marks the top of
the platform but is less appropriate for flattening
because of erosional structures. The most vertical fault
plains facilitate the flatting without producing a broad
strip of deformed signals near the faults. In this way,
reflection could be correlated laterally and showed the
Von Hartmann et al.
2
reflectivity distribution within the carbonate platform
before the structural deformation. A similar procedure
is the definition of horizons parallel to the
Lithotaminion limestone within the carbonate platform.
The horizons are called phantom horizons. Mapping on
these horizons also compensates for the faulting. A
reflection series above the crystalline basement mark
the base of the platform. We defined eight layers
between the top of the platform and the base by dividing
it into equal intervals. The top of the layers therefore
run subparallel to the Purbeck reflector and the top of
the crystalline basement. Each of these methods are to
compensate for faulting consider different aspects. The
flatting helps for the interpretation of seismic sections,
the phantom horizons compensate the faulting for
mapping, and the layer construction guides the analysis
of the internal composition of the platform.
Important information of the seismic signal resides in
the local frequency content. The frequency spectra from
the wavelet transformation visualise the frequency
content on planes within the platform. (Satinder and
Marfurt 2008). Red, green and blue colours represent
three spectral amplitudes. The resulting colour shows
the frequency distribution by mixing of different
colours. These images on six so-called phantom
horizons show the heterogeneity and zonation within
the platform.
More seismic attributes were used to construct a layer
model of the platform. Therefore we used the eight
layers described above. We calculated the average
seismic amplitude, the main frequency, and the average
similarity within each of these layers. A classification
scheme combined these attributes into 18 classes. The
average amplitudes and the main frequencies were
divided into three intervals and the average similarity
into two intervals. The combination of these intervals
resulted in 18 classes. In comparison to the wavelet
transform the definition of classes there is a better
separation of different areas within the survey. On the
basis of the classification, similar areas were defined on
top of each layer with a geographic information system.
Horizon tracking also was applied to map coherent
reflections within the carbonate platform. The tracking
was possible only in some parts of the survey. Also, the
number of reflectors changes laterally. Therefore, we
used these reflections to construct a sequence
stratigraphy model at distinct seismic sections (Emery
and Myers 1996). Very prominent reflections were used
to divide the platform into layers. In contrast to the
former partitioning according to the top and base of the
reservoir, in high reflectivity areas, the layer is linked
to a local maximum or minimum reflections. Besides at
the top and base of the platform these reflections
terminates, because they dip out or they stopped a
diffuse or chaotic reflection area.
On the other hand, single reflectors split into a
reflection series. The seismic stratigraphy method
intends to map the stratigraphically correct plane within
these seismic patterns. The supposed sedimentary
process must correlate with the seismic reflectivity. In
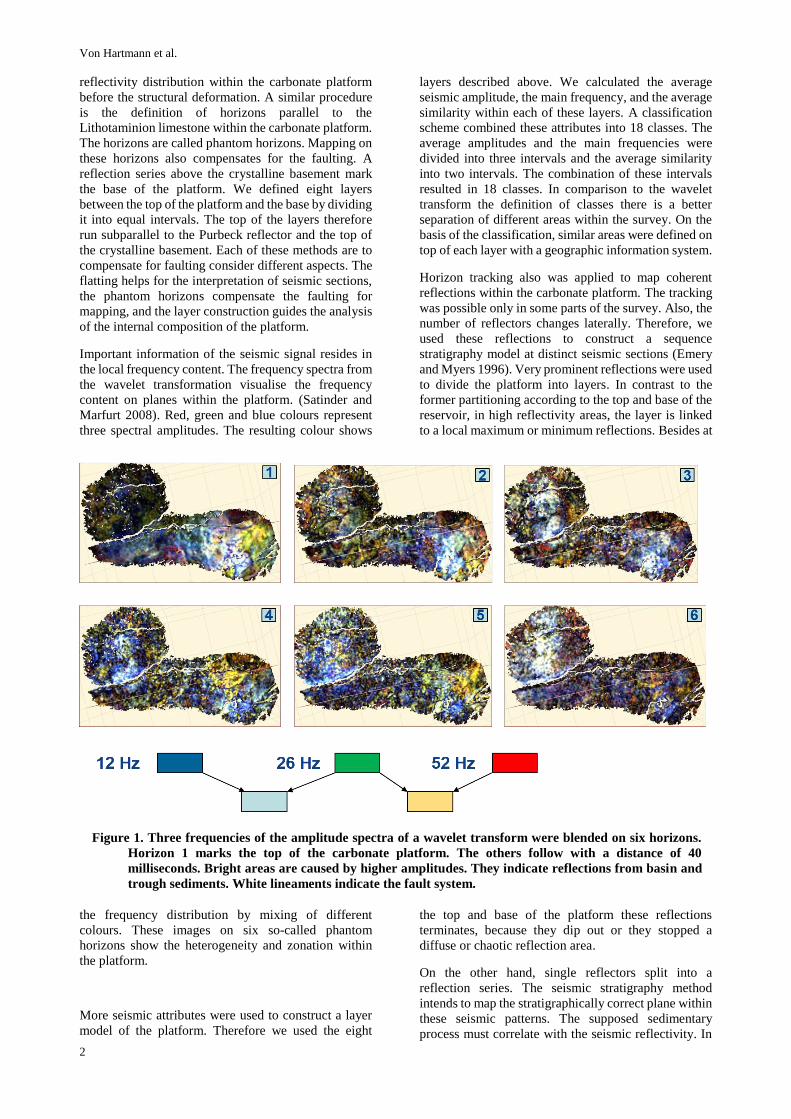
Figure 1. Three frequencies of the amplitude spectra of a wavelet transform were blended on six horizons.
Horizon 1 marks the top of the carbonate platform. The others follow with a distance of 40
milliseconds. Bright areas are caused by higher amplitudes. They indicate reflections from basin and
trough sediments. White lineaments indicate the fault system.

Von Hartmann et al.
3
this way, horizons were defined at seismic sections in
respect not only to sharp reflections but which also cut
diffusive and chaotic parts.
The mapping with seismic attributes and the
interpretation at the seismic section were together
interpreted to get a picture about the sedimentary
processes at this site and define the facies distribution.
3. RESULTS
The blending of three frequencies of the wavelet-
transforms shows the lateral and vertical distribution of
the reflectivity (Figure 1) Light colours show areas with
high amplitudes and the colours themselves are a
measure of the frequency content. The images show the
blended frequencies on six phantom horizons from top
of the platform downwards in a travel time distance of
40 ms, which means approximately 100 m. The general
trend of the reflectivity distribution is in a west-east
direction. The western and eastern parts of the seismic
survey show areas of higher amplitudes, where the
frequency distribution is smoother and more connected.
In the middle of the survey and in areas to the high
amplitude parts, the darker areas show a more stippled,
i.e. heterogeneous frequency distribution. The overall
frequency distribution changes significantly from
horizon 6 to Horizon 1, but between the single horizons,
the change is gradual.
Figure 2 shows the classification of a layer in the
middle of the platform, which top coincide
approximately with phantom horizon 4 of Figure 1. The
amplitude distribution is comparable to this horizon.
Lower amplitude parts in general, have a very
heterogeneous frequency distribution. There are some
circular low amplitude areas, surrounded by higher
amplitudes.
Figure 3 shows an interpreted seismic section, which
runs in an east-west direction. The white lines mark
seismic sequence borders. These lines follow
prominent reflections, reflection series and mark the top
and bottom of different seismic patterns. The
description of sections follows this partitioning for
better clearness. There are different groups of seismic
patterns: a) Coherent, subparallel reflections, with a
length of several kilometres and with strong
amplitudes, b) subparallel, sharp reflections with lower
amplitudes, c) diffuse and chaotic reflections, d) small
clinoforms, e) larger sigmoidal reflections. In the first
stratigraphic layer, count from the bottom subparallel
reflections dominate. The reflection amplitudes
decrease in the eastern part. In the next layer a strong
reflection band marks the top of this layer. In the middle
of the section, a diffusive and chaotic part is visible. In
the west of this structure, several clinoforms are
dipping in the western direction, which is bordered by
a ramp-like structure which dips in the opposite
direction. At this slope, small triangle structures exist.
In the most western part, a subparallel reflection series
appears. Within the upper part, i.e. the uppermost layer
divergent reflections, small triangles, and subparallel
reflections appear.
Figure 2. Classification map of three seismic attributes. The horizons runs approximately in the middle of
the carbonate platform. The redline show the location of the seismic section of figure 3.
Fre
qu
en
cy
Sim
ila
rity
Platform
Clinoforms
Trough
Basin

Von Hartmann et al.
4
4. INTERPRETATION
The seismic facies distribution within the survey area is
locally very heterogeneous, but also larger parts show a
similar seismic attribute classification. In this way one
can define areas were a special kind of carbonate
sedimentation is dominant. We interpreted four kinds
of carbonate sedimentation environments. These are
basins and troughs, platforms, carbonate mounds, and
ramps or slopes. The interpretation is based on the
seismic sections and maps from the attribute
classification. The seismic sections show the
sedimentary process by the kind and distribution of
seismic patterns and the map indicates the lateral extent
of the signals characterised by their attributes. Strong
reflections mark significant changes in carbonate
precipitation. Sealevel changes cause this alteration in
carbonate sedimentation. The number of reflections in
a reflection series is an indication for the water depth.
Shallow areas are more sensitive to sea level changes
than deeper ones. Single reflection bands, therefore,
hint to larger water depth in contrast to multiple
reflections. Shingled, chaotic and more transparent
reflections are seismic characteristics of carbonate
mounds. Dipping reflections, clinoforms and sigmoidal
structures indicate slopes and ramps. In this context,
these both terms help to differentiate between two
sedimentary processes. The ramp is a link between a
platform and the adjacent trough. It can be recognised
by a lateral change of reflection patterns, dipping
reflection and termination of reflections at the ramp.
Successive ramps form the shape of a sigmoidal
pattern. Slopes in the form of the clinoforms indicate
local sediment transport form higher areas into the
basin. The clinoforms comprise in general vertically
less than one wavelength of the seismic signals. Strong
reflections were used to divide the platform into four
seismic stratigraphic layers; besides that, these
reflections cannot be tracked continuously across the
whole survey. There are several reasons for this.
Reflection characteristics change across major faults,
whereby near the faults often the coherency of
reflections is disturbed. Single reflection also split into
two or more reflections or the shape, i.e. the phase and
amplitude of the signals changes. Missing appropriate
reflections may be caused by a hiatus. In the areas
where carbonate build-ups were identified the boundary
take internal reflection groups into account. There are
also dipping reflection, accompanied by small triangles.
This reflection pattern was interpreted as the border of
an isolated platform. In this case, the sequence
boundary follows the dipping reflection upward.
Besides the vertical subdivision, there are also lateral
differences in the seismic reflections. One can define
five parts in the seismic section. In the eastern part,
strong subparallel reflections dominate, which are
bordered by more chaotic reflections. Inclined
reflections and clinoforms and subparallel thin
reflection band follow in in the most western part. The
build-ups in the middle divide the platform into an
eastern and a western part. These larger mud mounds
are dominant in the second and third stratigraphic layer.
Clinoforms are interpreted as transport of carbonate
mud away from the mounds. The occurrence of these
clinoforms more on the western side of the mounds is a
hint of the sedimentation processes. One can
differentiate between a leeward and a windward side.
Erosion from the mounts fills an adjacent trough,
leading to the clinoforms structures. Precipitation of
carbonates, which lead to subparallel layers, filled a
deeper basin on the eastern side.
The classification map shows the attribute distribution
approximately near the top of the second stratigraphic
layer. The carbonate build-up stretches over a large area
in the middle of the survey, indicated by low
amplitudes. Surrounding parts, with erosional fans or
Figure 3. Interpretation of a seismic section. The seismic was flattened at the Lithotamien chalk near the
top of the carbonate platform. White lines indicate sequence boundaries. Blue lines: platform
mudstone, yellow lines: grainstone, gray lines: basinal mudstone, green areas: boundstone. The
letters indicate different sedimentary environments, which are dominant. A: platform, B. slope, C:
trough, D: mud-mounds, E: Basin.

Von Hartmann et al.
5
slopes, have low to middle attributes which small
patches. The basin in the eastern part has high and
connected amplitudes. The trough shows middle
amplitudes and high similarity. The frequency
distribution helps to visualise the heterogeneity. The
ramp-like structure west to the trough, for example,
shows small amplitudes but a continuous frequency
distribution. Circular low amplitude distributions were
interpreted as smaller build-ups, which are distributed
within the trough and basin areas.
From the local sedimentary environment, one can
conclude on the facies at this place. In the western part
subparallel fine laminations are platform mudstones.
This area is bordered towards the east by grainstones at
the edge of the platform. The adjacent trough is filled
by a succession of mudstones and grainstones,
depending on the erosion of the platform sediments.
The mud mounts are built from mud- and boundstones.
The basin sediments inherit different types of
mudstones.
5. CONCLUSIONS
Different methods were used to visualise a
heterogeneous carbonate environment: Blending of
amplitude spectra analysed by the wavelet transform,
classification by seismic attributes and the
interpretation by the seismic sequence stratigraphy
method. The latter provides hints to different
sedimentary facies within the carbonate platform. The
others show the areal distribution of the local carbonate
environments. These are build-ups, which are carbonate
mud mounds of different sizes, basin, troughs and local
platforms with stratified sedimentation. From this
analysis, lithological facies and distribution of reservoir
quality can be derived. The construction of a reservoir
model should account for the facies distribution by
dividing the platform into several layers with lateral
varying properties. Also, a statistical model is useful to
consider a finer vertical layering. A reservoir
incorporates these results, which is based on the layers
of the classification scheme and take account of the
facies distribution by defining a larger zone of similar
reservoir properties. By this, the energy production of
this reservoir is evaluated.
REFERENCES
Jaudin,F, Le Brun, M, Bouchet, V. and Dezaye, C.:
French geothermal resource survey, BRGM,
(2009) 33p.
Reijmer, J.J.G., ten Veen, J.H., Jaarsma, B. and Boots
R.: Seismic stratigraphy of Dinantian carbonates in
the southern Netherlands and northern Belgium,
Netherlands Journal of Geoscience, (2017), 96.4,
353- 379.
Lüschen, E., Dussel, M. Thomas, R, and Schulz R.: 3D
seismic survey for geothermal exploration at
Unterhaching, Munich, Germany, First Break,
(2011), 29.1, 45 - 54
Pawellek, T., Aigner, T.:Apparently homogenous
“reef”-limestone built by high-freqiency cycles:
Upper Jurassic, SW-Germany, Sedimentary
Geology, (2003), 160.1-3, 259-284.
Schmid, D.U., Leinfelder, R.R. and Schweigert, G.:
Stratigraphy and Paleoenvironment of the Upper
Jurassic of Southern Germany- A Review, (2005),
Zitteliana, B26, München, 31-41.
Meyer R.K. and Schmidt-Kahler H.:
Paläogographischer Atlas des süddeutschen
Oberjura (Malm), Geologisches Jahrbuch, Reihe
A, 115, (1989) Hannover.
Pawellek, T. and Aigner T.: Stratigraphic architecture
and gamma ray logs of deeper ramp carbonates
(Upper Jurassic, SW Germany), Sedimentary
Geology, (2003), 159.3-4, 203-240.
Menyoli, E. Gajewski, D and Hübscher C.: Imaging of
complex basin structures with the common
reflection surface (CRS) stack method,
Geophysical Journal International, (2004), 157.3,
1206-1216.
Satinder, C. and Marfurt, K., J.: Seismic Attribute for
Prospect Identification and reservoir
Characterization, SEG Geophysical Developments
Series No. 11, (2008), 464 p..
Emery D. and Myers, K.J.: Sequence Stratigraphy,
Blackwell Science (1996), 295 p..
Acknowledgements
The project was funded by the German Federal
Ministry of Economic Affairs and Energy. We also
thank the partners involved in this project: Stadtwerke
München, DMT and Erdwerk GmbH.