factor index performance under different macroeconomic regimes...
TRANSCRIPT

©2014 MSCI Inc. All rights reserved. msci.com
msci.com
Factor Index Performance Under Different Macroeconomic Regimes September 2014
©2014 MSCI Inc. All rights reserved. msci.com
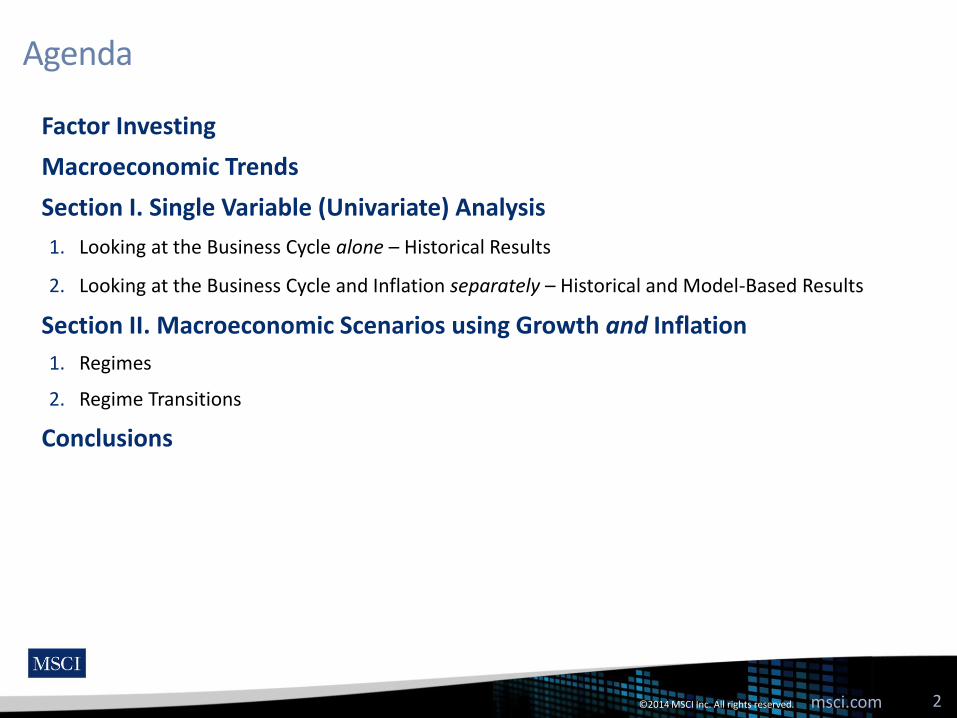
Agenda
Factor Investing
Macroeconomic Trends
Section I. Single Variable (Univariate) Analysis
1. Looking at the Business Cycle alone – Historical Results
2. Looking at the Business Cycle and Inflation separately – Historical and Model-Based Results
Section II. Macroeconomic Scenarios using Growth and Inflation
1. Regimes
2. Regime Transitions
Conclusions
2

©2014 MSCI Inc. All rights reserved. msci.com
Today’s alpha is tomorrow’s beta …
Alpha
Broad Market
Beta
Portfolio Return
=
Sector Beta
Beta
Alpha
Factor Beta
Alpha
=
Country Beta
1970s 1980s 2000s
Regional Beta
3

©2014 MSCI Inc. All rights reserved. msci.com
Factor investing is the investment process that harvests risk premia through exposure to factors
A large body of academic research highlights that long term equity portfolio performance can be explained by systematic factors. Some factors represent exposure to systematic risk and have historically earned a long term risk premium
We currently identify six risk premia factors. They are grounded in academic research and have solid explanations as to why they have provided a premium
What is Factor Investing?
4
Value Low Size
Quality Momentum
Low Volatility Yield
6 KEY FACTORS
©2014 MSCI Inc. All rights reserved. msci.com
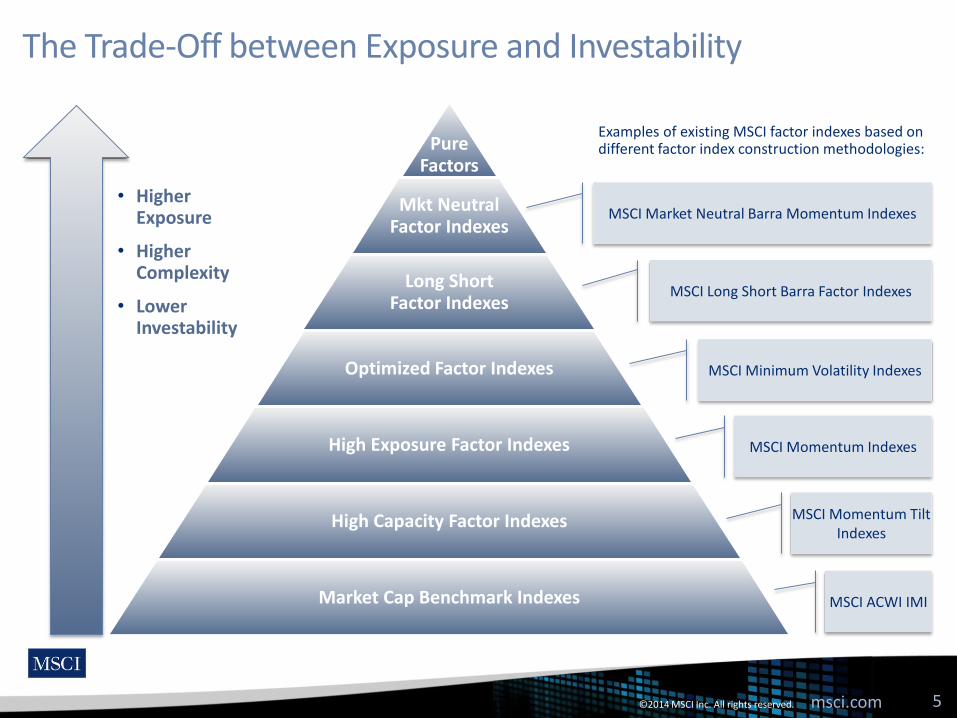
The Trade-Off between Exposure and Investability
5
Pure Factors
Mkt Neutral Factor Indexes
Long Short Factor Indexes
Optimized Factor Indexes
High Exposure Factor Indexes
High Capacity Factor Indexes
Market Cap Benchmark Indexes
• Higher Exposure
• Higher Complexity
• Lower Investability
MSCI Market Neutral Barra Momentum Indexes
MSCI Long Short Barra Factor Indexes
MSCI Momentum Indexes
MSCI Momentum Tilt Indexes
MSCI ACWI IMI
MSCI Minimum Volatility Indexes
Examples of existing MSCI factor indexes based on different factor index construction methodologies:

©2014 MSCI Inc. All rights reserved. msci.com
What Attracts Investors to Factor Investing?
6
MSCI World
Equal Weighted
Risk Weighted
Momentum
High Dividend Yield
Value Weighted
Quality
Minimum Volatility
Quality Mix
6%
7%
8%
9%
10%
11%
12%
10% 11% 12% 13% 14% 15% 16% 17%
An
nu
ali
sed
Re
turn
Annualised Risk
Performance Characteristics(May 88 to July 2014) (Gross Total Return in USD)
LOW RISK & HIGH RETURN HIGH RISK & HIGH RETURN
HIGH RISK & LOW RETURNLOW RISK & LOW RETURN

©2014 MSCI Inc. All rights reserved. msci.com
Factor Index Performance Over The Past 40 Years
7
©2014 MSCI Inc. All rights reserved. msci.com
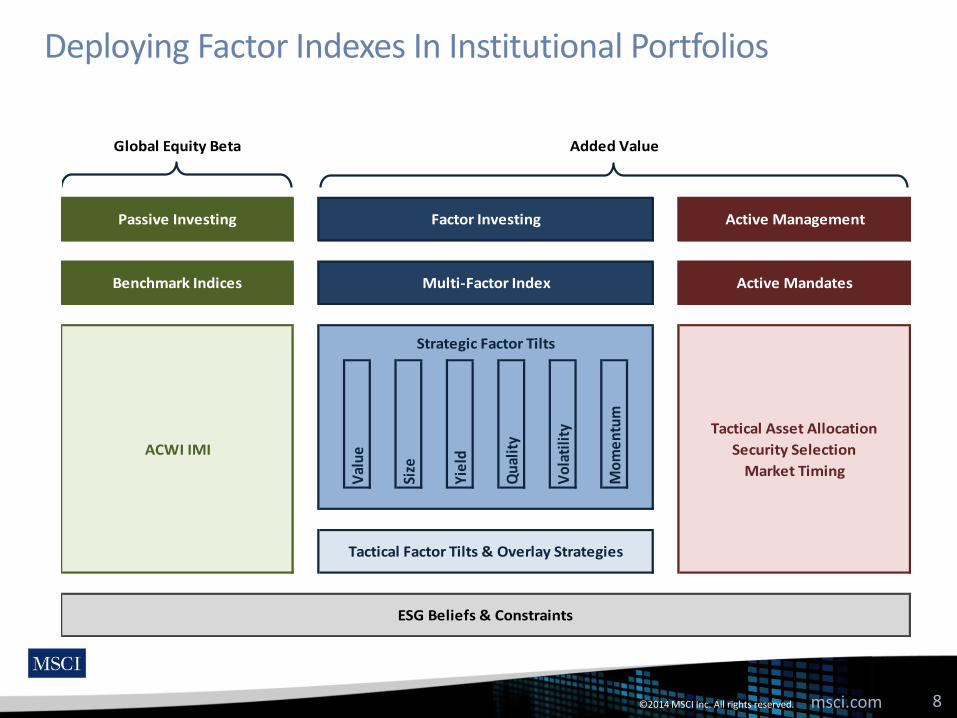
Deploying Factor Indexes In Institutional Portfolios
8
Global Equity Beta Added Value
Strategic Factor Tilts
Passive Investing Factor Investing Active Management
Benchmark Indices Multi-Factor Index Active Mandates
ESG Beliefs & Constraints
Tactical Factor Tilts & Overlay Strategies
ACWI IMI
Tactical Asset Allocation
Security Selection
Market Timing
Val
ue
Size
Yie
ld
Qu
alit
y
Vo
lati
lity
Mo
me
ntu
m
©2014 MSCI Inc. All rights reserved. msci.com
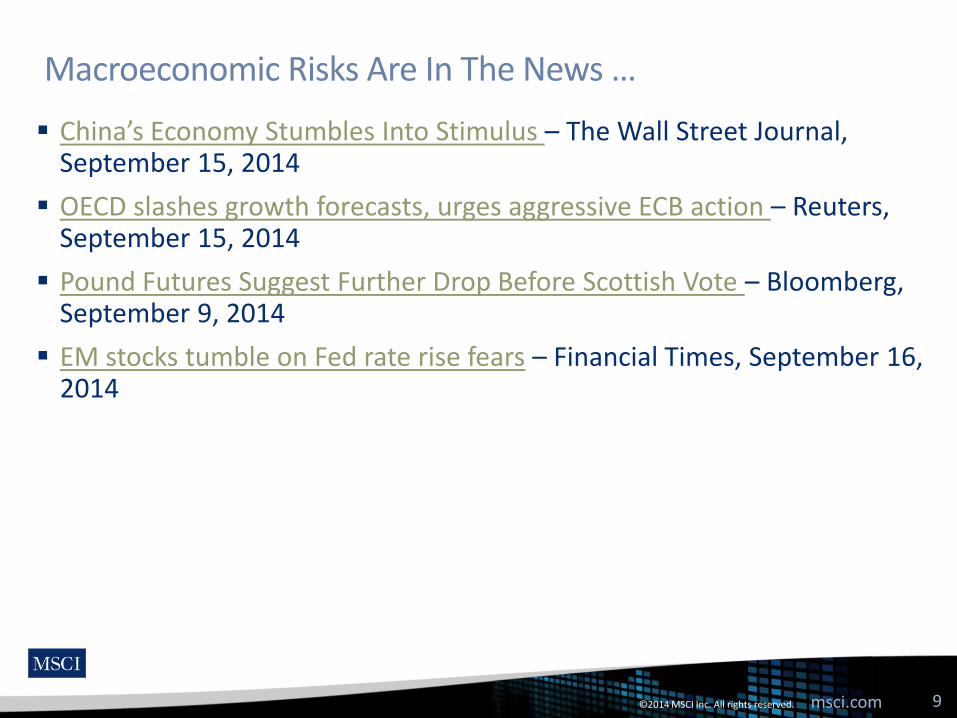
Macroeconomic Risks Are In The News …
China’s Economy Stumbles Into Stimulus – The Wall Street Journal, September 15, 2014
OECD slashes growth forecasts, urges aggressive ECB action – Reuters, September 15, 2014
Pound Futures Suggest Further Drop Before Scottish Vote – Bloomberg, September 9, 2014
EM stocks tumble on Fed rate rise fears – Financial Times, September 16, 2014
9
©2014 MSCI Inc. All rights reserved. msci.com
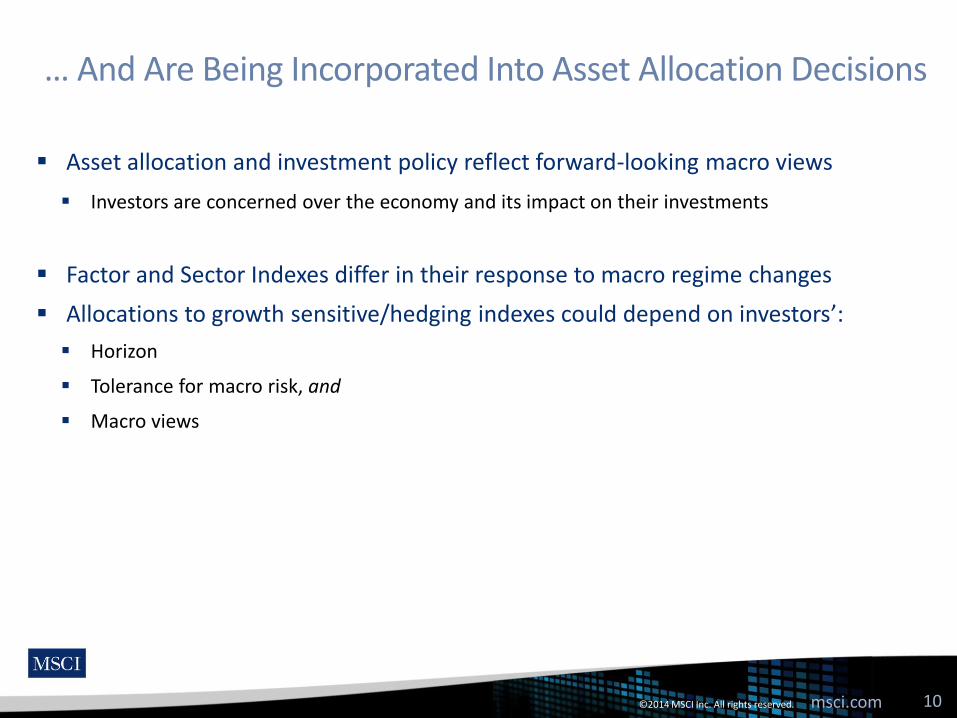
… And Are Being Incorporated Into Asset Allocation Decisions
Asset allocation and investment policy reflect forward-looking macro views
Investors are concerned over the economy and its impact on their investments
Factor and Sector Indexes differ in their response to macro regime changes
Allocations to growth sensitive/hedging indexes could depend on investors’:
Horizon
Tolerance for macro risk, and
Macro views
10

©2014 MSCI Inc. All rights reserved. msci.com
Motivation and Applications of this Analysis
1. Asset Owners:
Asset owners who can tolerate macro risk could tilt towards growth sensitive/hedging indexes which align with their economic views over the medium term.
2. Asset Managers:
Asset managers could create index-based products to facilitate short-term tactical asset allocation.
3. Risk Managers:
Risk managers gain understanding as to how factor and sector biases affect portfolio risk and return under various macroeconomic scenarios, and over different horizons
11

©2014 MSCI Inc. All rights reserved. msci.com
msci.com 12
Section I. Single Variable (Univariate) Analysis
1. Looking at the Business Cycle alone
2. Looking at the Business Cycle and Inflation separately

©2014 MSCI Inc. All rights reserved. msci.com
Looking at the Business Cycle alone
For MSCI World Factor and Sector Indexes look at correlation between YoY relative performance with its parent index and the YoY change of the CLI
MSCI World Universe – Correlation with OECD – Total CLI
13
** Based on official Index Levels from May 1988; Low Volatility Tilt Index prior to that Includes simulated data. Please refer to Appendix for details of exact start dates and simulation dates of the index data used
Sectors Correlation Factors Correlation
Energy -0.24 Equal Weighted 0.14
Materials 0.23 High Dividend Yield -0.25
Industrials 0.36 Minimum Volatility** -0.50
Consumer Discretionary 0.27 Momentum -0.11
Consumer Staples -0.51 Quality -0.43
Health Care -0.57 Risk Weighted -0.19
Financials 0.12 Value Weighted 0.05
IT 0.25
Telecom -0.19
Utilities -0.47

©2014 MSCI Inc. All rights reserved. msci.com
Looking at the Business Cycle and Inflation separately
Split history into states where the CLI is Rising/Falling:
** Based on official Index Levels from May 1988; Low Volatility Tilt Index prior to that Includes simulated data. Please refer to Appendix for details of exact start dates and simulation dates of the index data used
Univariate Analysis CLI
Test for whether variable is Rising/Falling MoM Change
14
Index – MSCI World (%) CLI Decreasing CLI Increasing
Minimum Volatility ** 0.3 (0.3)
Quality 0.3 (0.1)
… … …
Value Weighted 0.0 0.2
Equal Weighted 0.0 0.3
©2014 MSCI Inc. All rights reserved. msci.com
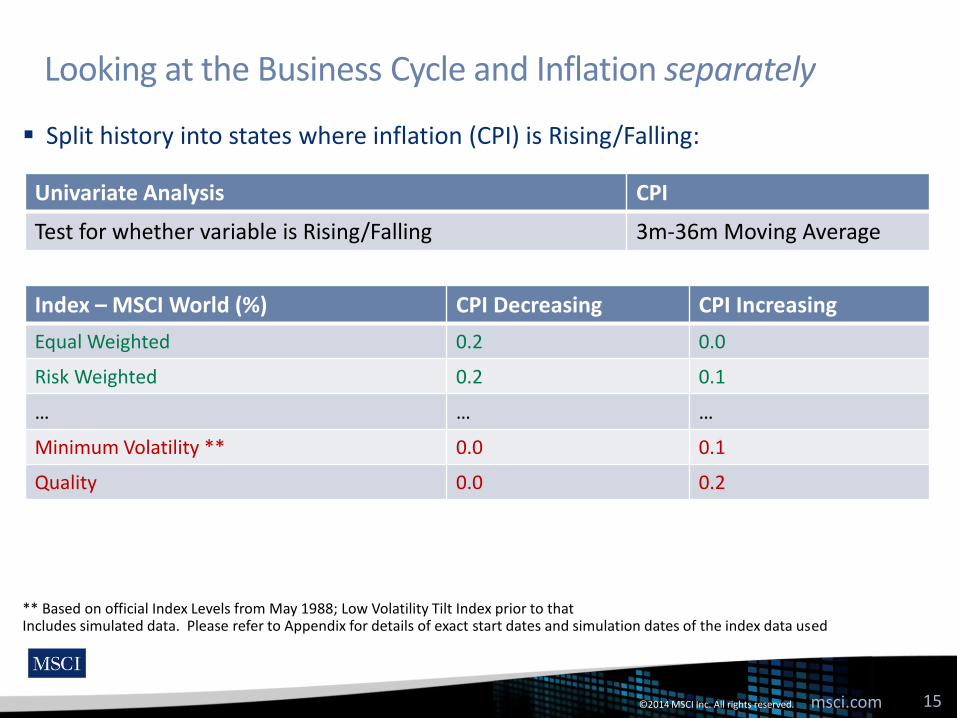
Looking at the Business Cycle and Inflation separately
Split history into states where inflation (CPI) is Rising/Falling:
** Based on official Index Levels from May 1988; Low Volatility Tilt Index prior to that Includes simulated data. Please refer to Appendix for details of exact start dates and simulation dates of the index data used
Univariate Analysis CPI
Test for whether variable is Rising/Falling 3m-36m Moving Average
15
Index – MSCI World (%) CPI Decreasing CPI Increasing
Equal Weighted 0.2 0.0
Risk Weighted 0.2 0.1
… … …
Minimum Volatility ** 0.0 0.1
Quality 0.0 0.2

©2014 MSCI Inc. All rights reserved. msci.com
Looking at the Business Cycle and Inflation separately
Split history into states where the CLI is Rising/Falling:
Includes simulated data. Please refer to Appendix for details of exact start dates and simulation dates of the index data used
Univariate Analysis CLI
Test for whether variable is Rising/Falling MoM Change
16
Index – MSCI World (%) CLI Decreasing CLI Increasing
Utilities 0.8 (0.7)
Consumer Staples 0.8 (0.4)
Health Care 0.8 (0.4)
… … …
Industrials (0.3) 0.2
Materials (0.3) 0.3
Information Technology (0.4) 0.5
©2014 MSCI Inc. All rights reserved. msci.com
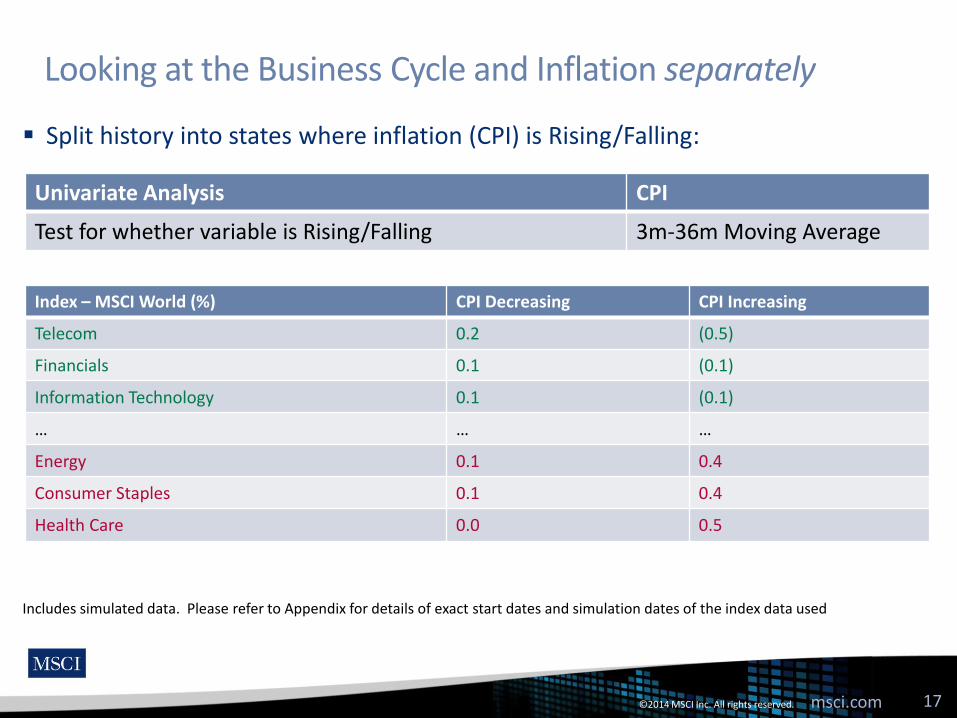
Looking at the Business Cycle and Inflation separately
Split history into states where inflation (CPI) is Rising/Falling:
Includes simulated data. Please refer to Appendix for details of exact start dates and simulation dates of the index data used
Univariate Analysis CPI
Test for whether variable is Rising/Falling 3m-36m Moving Average
17
Index – MSCI World (%) CPI Decreasing CPI Increasing
Telecom 0.2 (0.5)
Financials 0.1 (0.1)
Information Technology 0.1 (0.1)
… … …
Energy 0.1 0.4
Consumer Staples 0.1 0.4
Health Care 0.0 0.5

©2014 MSCI Inc. All rights reserved. msci.com
Using the Long-Term MSCI Asset Pricing Model
18
Macro Risk
Growth/Inflation Sensitive Indexes
Growth/Inflation Hedging Indexes
Growth Sensitive Growth Hedging
Real GDP Growth Risk
Equal Weighted High Dividend Yield
Momentum Quality
Risk Weighted Minimum Volatility
Value Weighted Energy
Small Cap Industrials
Materials Consumer Staples
Consumer Discr Healthcare
Financials Information Tech
Telecom Svc
Utilities
Inflation Sensitive Inflation Hedging
Equal Weighted Energy
Momentum Financials
Inflation Risk
High Dividend Yield Telecom Svc
Quality Utilities
Risk Weighted Minimum Volatility
Small Cap
Materials Industrials
Consumer Discr
Consumer Stapes
Healthcare
Information Tech
Equity strategies exhibit varied long-run sensitivity to macroeconomic risk
The table classifies the MSCI World Factor and Sector Indexes along their positive or negative sensitivity to real GDP growth and inflation over long horizons, relative to the MSCI World Index.

©2014 MSCI Inc. All rights reserved. msci.com
msci.com 19
Section II. Looking at Growth and Inflation together (Bivariate) Analysis
1. Regimes
2. Regime Transitions

©2014 MSCI Inc. All rights reserved. msci.com
Classifying Economic Regimes Into Four States
Heating Up
GoldilocksSlow Growth
Stagflation
Rising Inflation
Falling Inflation
Rising GrowthSlowing GrowthIncrease in CLI (MoM)
3m avg Inflation < 3 yr Inflation Moving Average
3m avg Inflation > 3 yr Inflation Moving Average
Decrease in CLI (MoM)
Using the same definitions for “Rising”/”Falling” CLI/CPI as before:
20
©2014 MSCI Inc. All rights reserved. msci.com
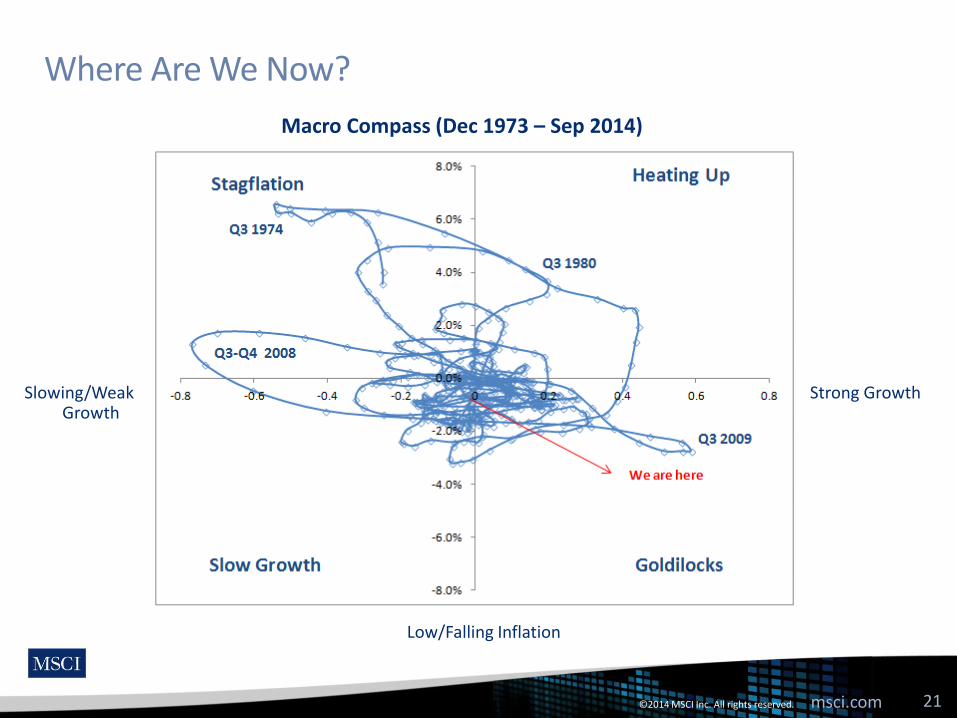
Where Are We Now?
Strong Growth Slowing/Weak Growth
High/Rising Inflation
Low/Falling Inflation
Macro Compass (Dec 1973 – Sep 2014)
21

©2014 MSCI Inc. All rights reserved. msci.com
How frequent have these Regimes been Historically?
“Goldilocks” is the most common, “Heating Up” the least
Macro-Economic States State Likelihood
Heating Up 11%
Goldilocks 40%
Slow Growth 32%
Stagflation 17%
0
1
2
3
4
De
c-7
5
De
c-7
7
De
c-7
9
De
c-8
1
De
c-8
3
De
c-8
5
De
c-8
7
De
c-8
9
De
c-9
1
De
c-9
3
De
c-9
5
De
c-9
7
De
c-9
9
De
c-0
1
De
c-0
3
De
c-0
5
De
c-0
7
De
c-0
9
De
c-1
1
De
c-1
3
1 - Heating Up 2 - Goldilocks 3 - Slow Growth 4 - Stagflation
22

©2014 MSCI Inc. All rights reserved. msci.com
Bivariate Regime Results:
Bivariate Analysis Index - MSCI World Heating Up Goldilocks Slow Growth Stagflation
Equal Weighted 0.2%
0.4%
0.0%
-0.1%
High Dividend Yield 0.0% 0.1% 0.2%
0.2%
Minimum Volatility** -0.4%
-0.3%
0.3%
0.4%
Momentum 0.3%
0.3%
0.2%
0.3%
Quality 0.1%
-0.1%
0.3%
0.3%
Risk Weighted 0.0%
0.2%
0.2%
0.1%
Value Weighted 0.1% 0.2% 0.1% -0.1%
Energy -0.1%
0.3%
-0.2%
0.9%
Materials 0.5%
0.3%
-0.4%
-0.4%
Industrials 0.2%
0.2%
-0.3%
-0.2%
Consumer Discr 0.2%
0.1%
0.0%
-0.5%
Consumer Staples 0.0%
-0.5%
0.8%
0.6%
Health Care 0.2%
-0.5%
0.8%
0.6%
Financials -0.1%
0.0%
0.3%
-0.2%
Information Tech 0.3%
0.6%
-0.4%
-0.4%
Telecom Svc -0.5%
-0.2%
0.6%
-0.4%
Utilities -1.0% -0.5% 0.8% 0.6%
Average Monthly Gross Active Returns relative to MSCI World from Dec 1975 to Dec 2013
** Based on official Index Levels from May 1988; Low Volatility Tilt Index prior to that Includes simulated data. Please refer to Appendix for details of exact start dates and simulation dates of the index data used.
23

©2014 MSCI Inc. All rights reserved. msci.com
Moving from Regime to Regime
Looking at Index Returns through Regime Transitions can provide insight:
Staying in the same regime is the most common ‘Transition’
And some regime transitions have historically been extremely infrequent
Likelihood of transitioning between regimes over 3 months
TO
Heating Up Goldilocks Slow Growth Stagflation
FROM Heating Up 55% 6% 11% 28%
Goldilocks 3% 73% 20% 3%
Slow Growth 0% 27% 65% 8%
Stagflation 23% 8% 12% 58%
24

©2014 MSCI Inc. All rights reserved. msci.com
Example Regime Transition Results
Starting in “Goldilocks”
Includes simulated data. Please refer to Appendix for details of exact start dates and simulation dates of the index data used.
Heating Up Goldilocks Slow Growth Stagflation
Equal Weighted -0.4% 1.1% -0.5% -0.9%
High Dividend Yield -1.2% -0.3% 1.3% 1.4%
Minimum Volati l i ty** -2.4% -0.8% 1.9% 0.5%
Momentum -0.4% 1.0% 0.7% -2.8%
Qual i ty -3.8% -0.7% 2.0% 1.9%
Risk Weighted -1.4% 0.5% 0.8% -0.8%
Value Weighted -0.7% 0.3% 0.1% 0.6%
Energy 6.0% 0.7% 1.8% 3.4%
Materia ls 2.6% 0.8% -2.0% 0.6%
Industria ls -0.5% 0.7% -0.3% -2.7%
Consumer Discr -1.8% 0.1% -1.3% -2.3%
Consumer Staples -1.9% -1.3% 3.3% 0.1%
Health Care -2.4% -1.3% 3.3% 3.2%
Financia ls 2.7% 0.0% 0.0% -1.3%
Information Tech -0.6% 1.7% -1.5% 4.1%
Telecom Svc -2.5% -0.9% 1.0% -1.3%
Uti l i ties -8.9% -1.8% 2.9% -1.6%
From Goldilocks to
Average of Quarterly Gross Active returns relative to MSCI World for period Feb 1976 to Dec 2013
** Based on official Index Levels from May 1988; Low Volatility Tilt Index prior to that
25
©2014 MSCI Inc. All rights reserved. msci.com
Conclusions
Investor’s exposure to factor investing is increasing in complexity from single factor strategies to multi-factor and dynamically changing models
Investors are concerned over the future economic situation and its impact on their investments
Factor and Sector Indexes differ in their response to macro regimes and changes between these regimes
Allows investors to exploit their views on future economic developments
Further research will explore cost effective implementations of macro-sensitive strategies based on MSCI Factor, Sector, and Thematic Indexes
26
©2014 MSCI Inc. All rights reserved. msci.com
msci.com 27
MSCI 24 Hour Global Client Service
Asia Pacific
China North 10800.852.1032 (toll free)
China South 10800.152.1032 (toll free)
Hong Kong +852.2844.9333
Seoul 00798.8521.3392 (toll free)
Singapore 800.852.3749 (toll free)
Sydney +61.2.9033.9333
Taipei 008.0112.7513 (toll free)
Tokyo +81.3.5290.1555
Europe, Middle East & Africa
Cape Town +27.21.673.0100
Frankfurt +49.69.133.859.00
Geneva +41.22.817.9777
London +44.20.7618.2222
Milan +39.02.5849.0415
Paris 0800.91.59.17 (toll free)
Americas
Americas 1.888.588.4567 (toll free)
Atlanta +1.404.551.3212
Boston +1.617.532.0920
Chicago +1.312.706.4999
Monterrey +52.81.1253.4020
New York +1.212.804.3901
San Francisco +1.415.836.8800
São Paulo +55.11.3706.1360
Toronto +1.416.628.1007
[email protected] | www.msci.com

©2014 MSCI Inc. All rights reserved. msci.com
msci.com 28
Notice and Disclaimer This document and all of the information contained in it, including without limitation all text, data, graphs, charts (collectively, the “Information”) is the property of MSCI Inc. or its subsidiaries
(collectively, “MSCI”), or MSCI’s licensors, direct or indirect suppliers or any third party involved in making or compiling any Information (collectively, with MSCI, the “Information Providers”) and is provided for informational purposes only. The Information may not be reproduced or redisseminated in whole or in part without prior written permission from MSCI.
The Information may not be used to create derivative works or to verify or correct other data or information. For example (but without limitation), the Information may not be used to create indexes, databases, risk models, analytics, software, or in connection with the issuing, offering, sponsoring, managing or marketing of any securities, portfolios, financial products or other investment vehicles utilizing or based on, linked to, tracking or otherwise derived from the Information or any other MSCI data, information, products or services.
The user of the Information assumes the entire risk of any use it may make or permit to be made of the Information. NONE OF THE INFORMATION PROVIDERS MAKES ANY EXPRESS OR IMPLIED WARRANTIES OR REPRESENTATIONS WITH RESPECT TO THE INFORMATION (OR THE RESULTS TO BE OBTAINED BY THE USE THEREOF), AND TO THE MAXIMUM EXTENT PERMITTED BY APPLICABLE LAW, EACH INFORMATION PROVIDER EXPRESSLY DISCLAIMS ALL IMPLIED WARRANTIES (INCLUDING, WITHOUT LIMITATION, ANY IMPLIED WARRANTIES OF ORIGINALITY, ACCURACY, TIMELINESS, NON-INFRINGEMENT, COMPLETENESS, MERCHANTABILITY AND FITNESS FOR A PARTICULAR PURPOSE) WITH RESPECT TO ANY OF THE INFORMATION.
Without limiting any of the foregoing and to the maximum extent permitted by applicable law, in no event shall any Information Provider have any liability regarding any of the Information for any direct, indirect, special, punitive, consequential (including lost profits) or any other damages even if notified of the possibility of such damages. The foregoing shall not exclude or limit any liability that may not by applicable law be excluded or limited, including without limitation (as applicable), any liability for death or personal injury to the extent that such injury results from the negligence or willful default of itself, its servants, agents or sub-contractors.
Information containing any historical information, data or analysis should not be taken as an indication or guarantee of any future performance, analysis, forecast or prediction. Past performance does not guarantee future results.
None of the Information constitutes an offer to sell (or a solicitation of an offer to buy), any security, financial product or other investment vehicle or any trading strategy.
You cannot invest in an index. MSCI does not issue, sponsor, endorse, market, offer, review or otherwise express any opinion regarding any investment or financial product that may be based on or linked to the performance of any MSCI index.
MSCI’s subsidiaries Institutional Shareholder Services Inc. (“ISS”) and MSCI ESG Research Inc. are Registered Investment Advisers under the Investment Advisers Act of 1940. Except with respect to any applicable products or services from ISS or MSCI ESG Research, neither MSCI nor any of its products or services recommends, endorses, approves or otherwise expresses any opinion regarding any issuer, securities, financial products or instruments or trading strategies and neither MSCI nor any of its products or services is intended to constitute investment advice or a recommendation to make (or refrain from making) any kind of investment decision and may not be relied on as such.
The MSCI ESG Indexes use ratings and other data, analysis and information produced by MSCI ESG Research Inc. Issuers mentioned or included in any MSCI ESG Research materials may be a client of MSCI, ISS, or another MSCI subsidiary, or the parent of, or affiliated with, a client of MSCI, and may also purchase research or tools from MSCI ESG Research Inc. MSCI ESG Research materials, including materials utilized in any MSCI ESG Indexes or other products, have not been submitted to, nor received approval from, the United States Securities and Exchange Commission or any other regulatory body.
Any use of or access to products, services or information of MSCI requires a license from MSCI. MSCI, Barra, RiskMetrics, IPD, FEA, InvestorForce, and other MSCI brands and product names are the trademarks, service marks, or registered trademarks of MSCI or its subsidiaries in the United States and other jurisdictions. The Global Industry Classification Standard (GICS) was developed by and is the exclusive property of MSCI and Standard & Poor’s. “Global Industry Classification Standard (GICS)” is a service mark of MSCI and Standard & Poor’s.
© 2014 MSCI Inc. All rights reserved. Feb 2014