factors affecting escherichia ' . -. concentrations at ... · graphs showing mean...
TRANSCRIPT

science for a changing world
In cooperation with thdOhio Water Development Authority,Northeast Ohio Regional Sewer District, Ohio Lake Erie Office,Cuyahoga County Sanitary Engineers, and Cuyahoga River CommunityPlanning Organization
Factors Affecting Escherichia *Jr ' . -.
Concentrations at Lake Erie Public Bathing Beaches
Water-Resources Investigations Report 98-4241
U.S. Department oHhe Interior U.S. Geological Survey

COVER: USGS scientists collect and record turbidity and wave height data at Sims Park, Euclid, Ohio.

U.S. Department of the Interior U.S. Geological Survey
Factors Affecting Escherichia coli Concentrations at Lake Erie Public Bathing Beaches
By Donna S. Francy and Robert A. Darner
Water-Resources Investigations Report 98-4241
In Cooperation with theOhio Water Development Authority, Northeast Ohio Regional Sewer District, Ohio Lake Erie Office, Cuyahoga County Board of Health, Cuyahoga County Sanitary Engineers, and Cuyahoga River Community Planning Organization

U.S. Department of the InteriorBruce Babbitt, Secretary
U.S. Geological SurveyCharles G. Groat, Director
Any use of trade, product, or firm names is for descriptive purposes only and does not imply endorsement by the U.S. Government.
For additional information write to:
District Chief U.S. Geological Survey 975 West Third Avenue Columbus, OH 43212-3192
Copies of this report can be purchased from:
U.S.Geological Survey Branch of Information Survices Box 25286 Denver, CO 80225-0286

CONTENTS
Abstract................................................................................................................................................................................. 1Introduction .......................................................................................................................................................................... 2
Purpose and scope ...................................................................................................................................................... 3Previous studies .......................................................................................................................................................... 3Acknowledgments ...................................................................................................................................................... 4
Methods of study .................................................................................................................................................................. 4Site selection and sampling frequency ....................................................................................................................... 4Collection of water and sediment samples ................................................................................................................. 7Analysis of water and sediment samples .................................................................................................................... 8Collection and compilation of ancillary information ................................................................................................. 9Statistical methods ...................................................................................................................................................... 10Quality-assurance and quality-control practices ......................................................................................................... 11
Factors affecting Escherichia coli concentrations in water and lake-bottom sediments ...................................................... 12Relations between Escherichia coli concentrations and environmental or water-quality variables ........................... 20Prediction of Escherichia coli concentrations from environmental and water-quality variables ............................... 24
Prediction of Escherichia coli concentrations from turbidity simple linear regression ................................ 24Prediction of Escherichia coli concentrations from several environmental and water-quality
factors multiple linear regression .............................................................................................................. 26Comparison of multiple-linear-regression model to current methods for evaluating beach water quality ................. 28
Summary and conclusions .................................................................................................................................................... 30References cited .................................................................................................................................................................... 32Appendix A Evaluation of methods for enumeration of fecal-indicator bacteria in lake-bottom sediment ..................... 34Appendix B Variability of Escherichia coli concentrations in water and sediment .......................................................... 36
FIGURES
1. Map showing locations of beach study sites Edgewater Park, Villa Angela, and Sims Park in theCleveland, Ohio, metropolitan area, 1997 ................................................................................................................ 5
2. Map showing sampling areas at (A) Edgewater Park and (B) Villa Angela, Cleveland, Ohio,and (C) Sims Park, Euclid, Ohio............................................................................................................................... 6
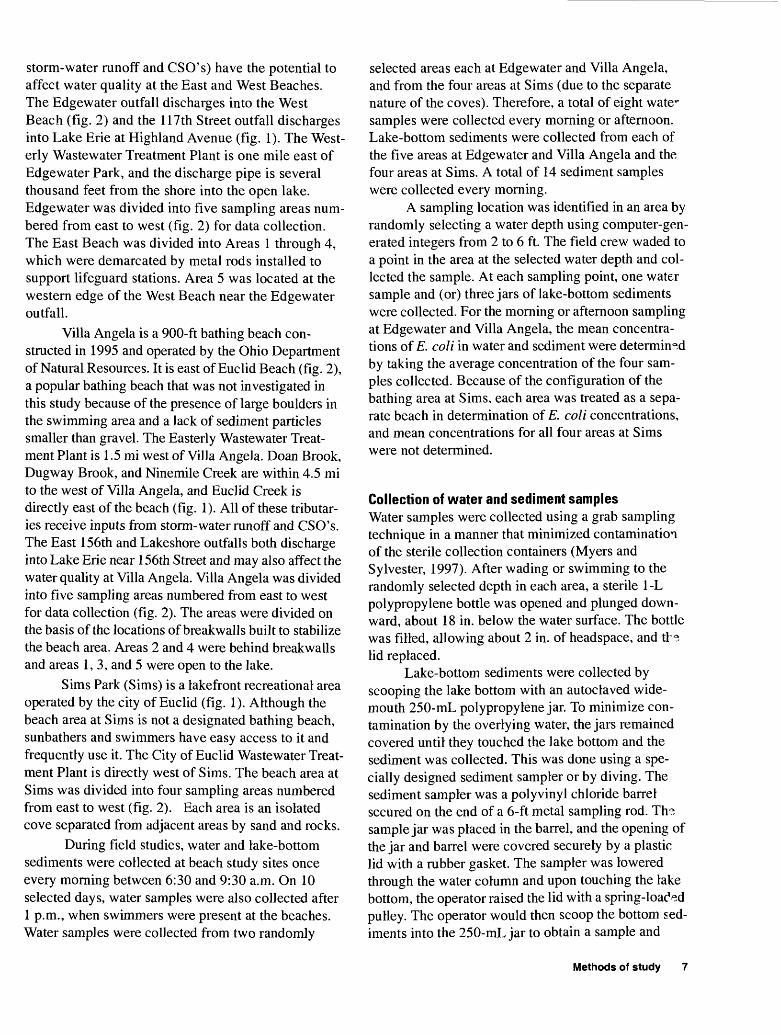
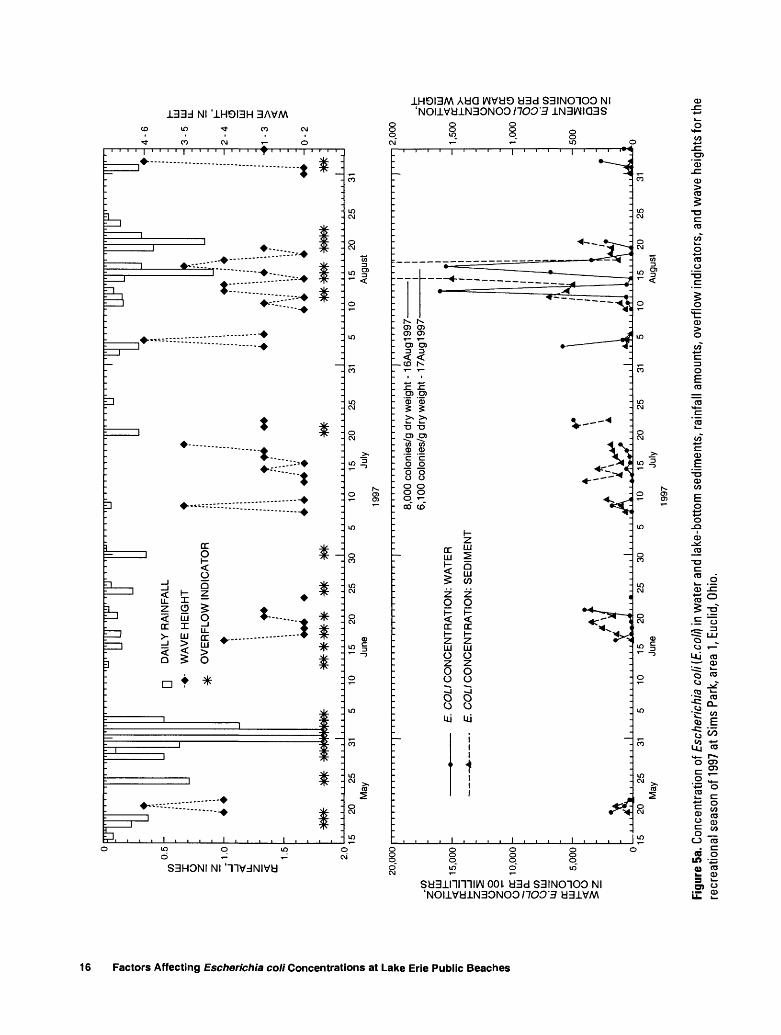
3-5. Graphs showing mean concentrations of Escherichia coli in water and lake-bottom sediments, rainfall amounts, overflow indicators, and wave heights for the recreational season of 1997:
3. Edgewater Park................................................................................................................................................. 144. Villa Angela ......................................................................................................................................^ 155. Sims Park
a. Area 1...................................................................................................................................................... 16b. Area2......................................^ 17c. Area 3 ...................................................................................................................................................... 18d.Area4.................................................................._ 19
6-7. Graphs showing Escherichia coli concentrations in water at Lake Erie beaches, May-September 1997:6. By wind direction ............................................................................................................................................. 237. By wave height ................................................................................................................................................. 23
8. Graphs showing regression relations between Escherichia coli concentrations and turbidity at (A) Edgewater Park, (B) Villa Angela, Cleveland, Ohio, and (C) Sims Park, Euclid, Ohio, and (D) for all data combined, 1997................................................................................................................................. 25
Contents III
FIGURES-continued
Al-2. Graphs showing concentrations of fecal coliforms recovered from Lake Erie bottom sediments:Al. Sims Park, both recovery methods .................................................................................................................. 35A2. Standard method, various beaches................................................................................................................... 36
Bl-2. Graphs showing differences between quality-control replicate samples for concentrations of Escherichia coli in (A) water and (B) sediment:
Bl. Percent differences ........................................................................................................................................... 38B2. Absolute value log 10 differences ..................................................................................................................... 39
TABLES
1. Constituents determined on water and lake-bottom sediment samples collected during field studiesfrom May through September 1997 at three Lake Erie beaches............................................................................... 8
2. Concentrations of Escherichia coli in water and lake-bottom sediments collected at three Lake Eriebeaches on 41 selected mornings from May through September 1997 .................................................................... 12
3. Particle-size analysis and total organic carbon concentrations in lake-bottom sediments collectedat three Lake Erie beaches, 1997 .............................................................................................................................. 13
4. Summary of correlations between Iog 10 Escherichia coli concentrations in water and environmentalor water-quality factors at three Lake Erie beaches, May-September 1997 ............................................................. 22
5. Temporal difference in Escherichia coli concentrations in water and the relation to number of swimmerson 10 selected days, June-September 1997, at three Lake Erie beaches .................................................................. 24
6. Regression statistics for Iog 10 Escherichia coli concentrations and logio turbidities............................................... 267. Prediction of Escherichia coli concentrations using the multiple-linear-regression model
and different combinations of randomly selected explanatory variables.................................................................. 288. Classification table for predictions of current recreational water-quality conditions using antecedent
Escherichia coli concentrations for Edgewater Park, Cleveland, Ohio, May-September 1997............................... 299. Results of classification tables comparing the proportions of correct and incorrect predicted
recreational water-quality conditions using antecedent Escherichia coli concentrations and a multiple-linear-regression model for Lake Erie beaches, May-September 1997 ..................................................... 30
Bl. Summary statistics for within-bottle and between-bottle differences of replicate quality-controlsamples for concentrations of Escherichia coli ........................................................................................................ 40
B2. Statistical analysis of between-bottle and within-bottle differences of replicate quality-controlsamples grouped by magnitude of concentration and by beach................................................................................ 41
IV Contents

CONVERSION FACTORS AND ABBREVIATED WATER-QUALITY UNITS
Multiply
micrometer (pim)millimeter (mm)
foot (ft)mile (mi)
milliliter (mL)liter (L)
gallon per minute (gal/min)million gallons per day (Mgal/d)
gram (g)
By
0.000039370.039370.30481.6090.061020.035313.785
3,7850.03527
To obtain
inchinchmeterkilometercubic inchcubic footliter per minutecubic meter per dayounce
Temperature: Temperature is given in degrees Celsius (°C), which can be converted to degrees Fahrenheit (°F) by use of the follow^g equation:
°F=1.8(°C) + 32
Abbreviated water-quality units used in this report: Chemical concentrations in water are reported in milligrams per liter (mg/L). Milligrams per liter is a unit expressing the concentration of chemical constituents as weight (milligrams) of chemical per unit volume (liter) of water.
Abbreviated sediment-quality units used in this report: Chemical concentrations in sediment are reported in milligrams per kilo gram (mg/kg).
Concentrations of bacteria in water are reported in colonies per 100 milliliters (col/100 mL).
Concentrations of bacteria in sediment are reported in colonies per gram of (dry weight) sediment (col/gdw).
Turbidity is reported in Nephelometric Turbidity Units (NTU's).
Contents

Factors Affecting Escherichia coli Concentrations at Lake Erie Public Bathing Beachesfix Donna S. Francy and Robert A. Darner
Abstract
The environmental and water-quality factors that affect concentrations of Escherichia coli (E. coli) in water and sediment were investigated at three public bathing beaches Edgewater Park, Villa Angela, and Sims Park in the Cleveland, Ohio metropolitan area. This study was done to aid in the determination of safe recreational use and to help water-resource managers assess more quickly and accurately the degradation of recre ational water quality.
Water and lake-bottom sediments were col lected and ancillary environmental data were compiled for 41 days from May through Septem ber 1997. Water samples were analyzed for E. coli concentrations, suspended sediment con centrations, and turbidity. Lake-bottom sediment samples from the beach area were analyzed for E. coli concentrations and percent dry weight. Concentrations of E. coli were higher and more variable at Sims Park than at Villa Angela or Edgewater Park; concentrations were lowest at Edgewater Park. Time-series plots showed that short-term storage (less than one week) of E. coli in lake-bottom sediments may have occurred, although no evidence for long-term storage was found during the sampling period. E. coli concen trations in water were found to increase with increasing wave height, but the resuspension of E. coli from lake-bottom sediments by wave
action could not be adequately assessed; higher wave heights were often associated with the dis charge of sewage containing E. coli during or after a rainfall and wastewater-treatment plant overflow.
Multiple linear regression (MLR) was used to develop models to predict recreational water quality at the three beaches using the variables shown to be related to E. coli concentrations in water. The related variables included turbidity, antecedent rainfall, antecedent weighted rainfall, volumes of wastewater-treatment plant overflows and metered outfalls (composed of storm-water runoff and combined-sewer overflows), a resus pension index, and wave heights. For the beacre-s in this study, wind speed, wind direction, water temperature, and the presence of swimmers we^e not included in the model because they were shown to be statistically unrelated to E. coli con centrations.
From the several models developed, one model was chosen that accounted for 58 percert of the variability in E. coli concentrations. The chosen MLR model contained weighted categori cal rainfall, beach-specific turbidity, wave height, and terms to correct for the different magnitudes of E. coli concentrations among the three beaches. For 1997, the MLR model predicted the recre ational water quality as well as, and in some cases better than, antecedent E. coli concentrations (the current method). The MLR model improved the
Abstract 1

sensitivity of the prediction and the percentage of correct predictions over the current method; how ever, the MLR model predictions still erred to a similar degree as the current method with regard to false negatives. A false negative would allow swimming when, in fact, the bathing water stan dard was exceeded.
More work needs to be done to validate the MLR model with data collected during other rec reational seasons, especially during a season with a greater frequency and intensity of summer rains. Studies could focus on adding to the MLR model other environmental and water-quality variables that improve the predictive ability of the model. These variables might include concentrations of E. coli in deeper sediments outside the bathing area, the direction of lake currents, site-specific- rainfall amounts, time-of-day information on overflows and metered outfalls, concentrations of E. coli in treated wastewater-treatment plant effluents, and occurrences of sewage-line breaks. Rapid biological or chemical methods for deter mination of recreational water quality could also be used as variables in model refinements. Possi ble methods include the use of experimental rapid assay methods for determination of E. coli con centrations or other fecal indicators and the use of chemical tracers for fecal contamination, such as coprostanol (a degradation product of cholesterol) or caffeine.
Introduction
Lake Erie is a valuable resource for the people of Ohio and nearby states for swimming, boating, and fishing. Water-quality advisories and beach closings because of sewage contamination are common at Lake Erie beaches in Ohio and other beaches in the United States. During 1995, United States ocean, bay, and Great Lakes beaches were closed or advisories were issued against swimming on more than 3,522 occa sions (Natural Resources Defense Council, 1996). Fecal-coliform concentrations in excess of Ohio's bathing-water standard (geometric mean of 200 colo nies per 100 milliliters) resulted in 65 beach advisories in 1990 and 34 in 1991 at state-park beaches along
Lake Erie and at inland reservoirs and Irkes (Ohio Environmental Protection Agency, 1992).
Most states have adopted recreational water- quality standards based on concentrations of fecal- indicator bacteria to protect citizens from the risk of contracting waterborne disease from exposure to sew age-contaminated waters. Fecal-indicatcr bacteria are not typically disease causing (pathogeni~), but they indicate the possible presence of pathogenic organ isms. In the United States, the U.S. Environmental Protection Agency (USEPA) recommends the use of Escherichia coli (E. coli) or enterococci as the pre ferred and most useful fecal indicators of the quality of freshwater recreational waters for body contact. A direct relation has been demonstrated in freshwater between the rate of gastroenteritis among swimmers and the concentrations of E. coli or ente~ococci, but not fecal coliforms (Dufour, 1984).
In Ohio, water-resource managers have the choice of using E. coli or fecal colifornr? as the basis for recreational water-quality standards (Ohio Envi ronmental Protection Agency, 1992). If concentrations of either E. coli or fecal-coliform bacteria exceed the state standard, then beach managers, at their discre tion, may post the beach with a water-quality advisory. A factor complicating the assessment of recreational water quality is that standard tests for determining concentrations of fecal indicators, including E. coli, take at least 24 hours to complete. The e'apsed time between the occurrence and detection of elevated fecal-indicator concentrations is too long to take ade quate control measures in a timely manrer; conse quently, concentrations may change dramatically between the time of sampling and the reporting of results.
One alternative to waiting 24 hours for results of fecal-indicator concentrations is to use vater-quality and environmental surrogates to predict recreational water quality. For example, waters at public bathing beaches frequently contain concentrations of fecal- indicator bacteria that exceed bathing-water standards during periods of rainfall and runoff. In Ohio, sources of these bacteria include street refuse, animal waste, sanitary sewer overflows, and combined-sewer over flows (CSO's) that occur when the capacity of the sewage-collection system is exceeded (Myers, 1992). In the United States, officials cited rain as the cause of 371 beach closings during 1995; however, 510 beach closings during the same year were not associated with rain, and the specific source of pollution was reported
Factors Affecting Escherichia coli Concentrations at Lake Erie Public Beaches

as unknown (Natural Resources Defense Council, 1996). Therefore, other factors that affect fecal-indica tor concentrations need to be examined. There is spec ulation that one mechanism of contamination is the resuspension of bacteria previously deposited into lake-bottom sediments from CSO's and other sources.
To better understand the water-quality and envi ronmental factors that affect the degradation of recre ational water quality, the U.S. Geological Survey (USGS), in cooperation with the Ohio Water Develop ment Authority, Northeast Ohio Regional Sewer Dis trict, Cuyahoga County Board of Health, Cuyahoga County Sanitary Engineers, Cuyahoga River Commu nity Planning Organization, and the Ohio Lake Erie Office, studied the occurrence of E. coli in water and lake-bottom sediments and the environmental and water-quality factors that affected E. coli concentra tions at Lake Erie public bathing beaches in Ohio.
Purpose and scopeThis report describes field studies done throughout the recreational season of 1997 (May through September) at three public bathing beaches in the Cleveland, Ohio, metropolitan area. Concentrations of E. coli were determined in water and lake-bottom sediments col lected during a variety of environmental condi tions during dry, calm weather; before, during, and after rainfall; for various increased wave heights; and before and after heavy recreational use. The concen trations of E. coli in water and lake-bottom sediments were plotted as a function of time along with wave heights, occurrence of wastewater-treatment plant overflows, and rainfall amounts. These plots were examined qualitatively to determine if these factors affected E. coli concentrations in water and sediment. Statistical methods were used to evaluate quantita tively the relations between E. coli concentrations in water and several measured variables rainfall amount, volumes of wastewater-treatment plant over flows and metered outfalls (composed of storm-water runoff and CSO's), wind speed and direction, a resus pension indicator, turbidity, suspended-sediment con centration, water temperature, wave height, and number of swimmers. Regression techniques were then used to develop a predictive model for E. coli concentrations in water at the beaches studied; the best predictive model contained terms for turbidity, ante cedent rainfall, and wave height.
This report provides water-resource managers with information on the water-quality and environ
mental factors that affect fecal-indicator concentra tions at three Lake Erie beaches. It also provides evidence that predictive models may be developed to help water-resource managers more quickly and accu rately assess the degradation of recreational water quality to protect the public health.
Previous studiesEnvironmental factors have been shown to be related to concentrations of fecal-indicator bacteria in recre ational waters. Several studies showed that a reservoir of sediment-stored fecal-indicator bacteria may be returned to the water column by physical disturbances of bottom sediments; this included dredging (Grimes, 1980), wind and wave actions (Lehman and Fogel, 1976), and disturbance of sediments by swimmers or boaters (Bromel and others, 1978). In two studies (Sherer and others, 1988; Stephenson and Rychert, 1982), investigators found that by disturbing the s*re- ambed sediments with a rake, fecal coliforms could be resuspended in the water column and detected down stream. Aldom and others (1998) found a relation between E. coli concentrations and wind speed, wind direction, and wave height at Lake Huron bathing beaches. They suggested that these factors may be used to develop models to predict E. coli concentra tions.
Several investigators examined the relation between fecal-indicator concentrations and water- quality variables. Grimes (1980) found fecal-indicator concentrations to be highly correlated with turbidity at a Mississippi River site downstream from dredging operations. In contrast, in a study of canals along the Texas Coast (Goyal and others, 1977), investigators found no statistically significant relation between fecal-indicator concentrations and temperature, pH, turbidity, or suspended solids concentrations. Tunnic- liff and Brickler (1984) found a statistically significant correlation between turbidities and fecal-coliform con centrations in samples collected during storm events but not for samples collected during base flow.
Because bacteria survive longer in sediments than in water, a process affecting concentrations of fecal indicators may be the resuspension of accurru- lated bacteria from bottom sediments (Marino and Gannon, 1991). The large surface area for attachment and the nutrient-rich environment that sediments pro vide have been shown to promote survival of bacteria (Burton and others, 1987; LaLiberte and Grimes, 1982; Matson and others, 1978; Sherer and others.
Introduction

1992). Gerba and McLeod (1976) attributed the longer survival of E. coli in sediment than in water to the higher content of organic matter in the sediment. In addition, bacteria sorbed to sediments may be pro tected from attack by predators and bactericidal fac tors such as ultraviolet radiation (Davies and others, 1995; Pommepuy and others, 1992). LaLiberte and Grimes (1982) investigated the survival of E. coli in bottom sediments in dialysis bags in a Wisconsin lake and found that sand and mud sediments supported the survival of E. coli for the length of the study, 4 days. In another study, Davies and others (1995) used mem brane diffusion chambers placed at a river site in Aus tralia. Fecal coliforms survived in freshwater sediments for up to 60 days, although their numbers decreased 2-3 orders of magnitude after 29 days and then stabilized. In laboratory experiments (Sherer and others, 1992), half-lives of fecal coliforms ranged from 11 to 30 days in fine and coarse sediments; the half-life of fecal coliforms in the overlying water was only 2.8 days. According to Marino and Gannon (1991), storm-drain sediments were acting as reser voirs of fecal indicators during warm, dry weather periods for up to 6 days.
Because of the extended survival of bacteria in sediments, LaLiberte and Grimes (1982) suggested that the enumeration of sediment-associated fecal bac teria in recreational areas is as important as the enu meration of fecal bacteria in the water column. However, there is no available information on the occurrence of stored fecal-indicator bacteria in lake- bottom sediments at Lake Erie beaches. More infor mation is needed about the role of physical distur bances on the resuspension of sediment-stored bacteria and about the importance of other environmental and water-quality factors on the concentrations of fecal- indicator bacteria in relation to degradation of recre ational waters.
AcknowledgmentsThe authors thank Eva Roller, Lester Stumpe, Keith Linn, and Frank Foley of the Northeast Ohio Regional Sewer District for their assistance during data-collec tion and report-review phases of the project. The authors also acknowledge the assistance of others in the planning and implementation of this project Wayne Holmes and Thomas Filbert of the Ohio Department of Natural Resources, Robert Gall of the City of Euclid, and Donald Killinger of the Cuya- hoga County Health Department. The authors thank Donna Childs and Timothy Gallagher of the Cuyahoga
County Health Department for help with sampling and analysis and Gary Tasker of the USGS fcr assistance with the statistical modeling. A special thanks is extended to the management and staff of the Cuyahoga County Sanitary Engineers Ruth Langsner, John Campbell, Ann McCready-Gliha, and Suzanne Oravec for the use of their laboratory facilities and assistance with laboratory activities.
Methods of study
Data were collected during eight field studies through out the 1997 recreational season May through Sep tember. The duration of each study ranged from 3 to 14 days, totaling 41 days of data collection. The field studies were done during a range of conditions dur ing dry, calm weather; before, during, anc1 after rain fall; during increased wave heights; and before and after heavy recreational use.
In this investigation, E. coli concentrations were used to monitor recreational water quality because E. coli is better than fecal coliforms as an indicator of the risk of swimming in fecal-contaminated waters. For E. coli, the Ohio geometric-mean bathing-water stan dard is 126 colonies per 100 mL (col/100 mL); the sin gle-sample bathing water standard is 235 col/100 mL. The geometric mean is based on a minimum of five samples collected in a 30-day period, and it is used in this report to evaluate median E. coli concentrations in terms of recreational water quality. The single-sample bathing-water standard is used in this report to evaluate recreational water quality on any given day and cannot be exceeded in more than 10 percent of th^ samples collected in a 30-day period.
Site selection and sampling frequencyWater and lake-bottom sediment samples were col lected and ancillary environmental data w Q.re compiled during field studies at three public bathing beaches in the Cleveland, Ohio, metropolitan area (f g. 1): Edge- water Park, Villa Angela, and Sims Park.
Edgewater Park (Edgewater), operated by the Ohio Department of Natural Resources, is midway between Rocky River and Cuyahoga River. The East Beach of Edgewater includes 900 ft of guarded beach that is used heavily during the recreational season, and the West Beach is unguarded and used primarily by boaters (fig. 2). Lake currents are generally west to east, so that two metered outfalls (composed of
Factors Affecting Escherichia coli Concentrations at Lake Erie Public Beaches

81°5
2'30
" 41
°37'
30"
81°5
0'81
°47'
30"
81°4
5'81
°42'
30"
81°4
0'81
°37'
30"
81°3
5'81
°32'
30"
81°3
0'
41°3
5'
4r3
2'3
0"
41°3
0'
41°2
7'30
"
Euc
lid W
aste
wat
er
Trea
tmen
t P
lant
LAK
E E
RIE
Eas
t 15
6th
and
Lake
shor
e ou
tfalls
V
ILLA
,E
aste
rly \ A
NG
xEl
Was
tew
ater
Tr
eatm
ent
Pla
nt-
117t
h S
treet
ou
tfall E
DG
EW
ATE
R
PA
RK
Wes
terly
Was
tew
ater
Trea
tmen
tP
lant
Bas
e m
ap f
rom
U
.S.
Geo
logi
cal
Sur
vey
E.
Cle
vela
nd
1963
, ph
otor
evis
ed
1979
; La
kew
ood
1963
, ph
otor
evis
ed
1979
; C
leve
land
S
outh
19
63,
phot
orev
ised
19
79;
Cle
vela
nd
Nor
th
1963
, ph
otor
evis
ed
1973
.
Stu
dy A
rea
2 M
ILE
S
2 K
ILO
ME
TER
SO
HIO
a (0 O^ (0 «<
Figu
re 1
. Loc
atio
ns o
f bea
ch s
tudy
site
s E
dgew
ater
Par
k, V
illa A
ngel
a, a
nd S
ims
Pa
rk in
the
Cle
vela
nd, O
hio,
met
ropo
litan
are
a, 1
997.

100 METERS
EDGEWATER PARK
0 100200 300 400 FEET
East Beach
Euclid Beach
0 50 100 150 200 FEET
I I I I
0 50 METERS
0 50 100 150 200 FEET
I I I I
0 50 METERS
Figure 2. Sampling areas at (A) Edgewater Park and (B) Villa Angela, Cleveland, Ohio,and (C) Sims Park, Euclid, Ohio.
6 Factors Affecting Escherichia co//Concentrations at Lake Erie Public Beaches
storm-water runoff and CSO's) have the potential to affect water quality at the East and West Beaches. The Edgewater outfall discharges into the West Beach (fig. 2) and the 117th Street outfall discharges into Lake Erie at Highland Avenue (fig. 1). The West erly Wastewater Treatment Plant is one mile east of Edgewater Park, and the discharge pipe is several thousand feet from the shore into the open lake. Edgewater was divided into five sampling areas num bered from east to west (fig. 2) for data collection. The East Beach was divided into Areas 1 through 4, which were demarcated by metal rods installed to support lifeguard stations. Area 5 was located at the western edge of the West Beach near the Edgewater outfall.
Villa Angela is a 900-ft bathing beach con structed in 1995 and operated by the Ohio Department of Natural Resources. It is east of Euclid Beach (fig. 2), a popular bathing beach that was not investigated in this study because of the presence of large boulders in the swimming area and a lack of sediment particles smaller than gravel. The Easterly Wastewater Treat ment Plant is 1.5 mi west of Villa Angela. Doan Brook, Dugway Brook, and Ninemile Creek are within 4.5 mi to the west of Villa Angela, and Euclid Creek is directly east of the beach (fig. 1). All of these tributar ies receive inputs from storm-water runoff and CSO's. The East 156th and Lakeshore outfalls both discharge into Lake Erie near 156th Street and may also affect the water quality at Villa Angela. Villa Angela was divided into five sampling areas numbered from east to west for data collection (fig. 2). The areas were divided on the basis of the locations of breakwalls built to stabilize the beach area. Areas 2 and 4 were behind breakwalls and areas 1,3, and 5 were open to the lake.
Sims Park (Sims) is a lakefront recreational area operated by the city of Euclid (fig. 1). Although the beach area at Sims is not a designated bathing beach, sunbathers and swimmers have easy access to it and frequently use it. The City of Euclid Wastewater Treat ment Plant is directly west of Sims. The beach area at Sims was divided into four sampling areas numbered from east to west (fig. 2). Each area is an isolated cove separated from adjacent areas by sand and rocks.
During field studies, water and lake-bottom sediments were collected at beach study sites once every morning between 6:30 and 9:30 a.m. On 10 selected days, water samples were also collected after 1 p.m., when swimmers were present at the beaches. Water samples were collected from two randomly
selected areas each at Edgewater and Villa Angela, and from the four areas at Sims (due to the separate nature of the coves). Therefore, a total of eight watev samples were collected every morning or afternoon. Lake-bottom sediments were collected from each of the five areas at Edgewater and Villa Angela and the four areas at Sims. A total of 14 sediment samples were collected every morning.
A sampling location was identified in an area by randomly selecting a water depth using computer-gen erated integers from 2 to 6 ft. The field crew waded to a point in the area at the selected water depth and col lected the sample. At each sampling point, one water sample and (or) three jars of lake-bottom sediments were collected. For the morning or afternoon sampling at Edgewater and Villa Angela, the mean concentra tions of E. coli in water and sediment were determined by taking the average concentration of the four sam ples collected. Because of the configuration of the bathing area at Sims, each area was treated as a sepa rate beach in determination of E. coli concentrations, and mean concentrations for all four areas at Sims were not determined.
Collection of water and sediment samplesWater samples were collected using a grab sampling technique in a manner that minimized contamination of the sterile collection containers (Myers and Sylvester, 1997). After wading or swimming to the randomly selected depth in each area, a sterile 1-L polypropylene bottle was opened and plunged down ward, about 18 in. below the water surface. The bottle was filled, allowing about 2 in. of headspace, and the lid replaced.
Lake-bottom sediments were collected by scooping the lake bottom with an autoclaved wide- mouth 250-mL polypropylene jar. To minimize con tamination by the overlying water, the jars remained covered until they touched the lake bottom and the sediment was collected. This was done using a spe cially designed sediment sampler or by diving. The sediment sampler was a polyvinyl chloride barrel secured on the end of a 6-ft metal sampling rod. The sample jar was placed in the barrel, and the opening of the jar and barrel were covered securely by a plastic lid with a rubber gasket. The sampler was lowered through the water column and upon touching the lake bottom, the operator raised the lid with a spring-loaded pulley. The operator would then scoop the bottom sed iments into the 250-mL jar to obtain a sample and
Methods of study

close the lid before raising the sampler to the surface. This method proved difficult to use, especially when waves were high. Alternatively, sediment samples were collected by diving and using the same principle as the sediment sampler. The diver secured the lid on the sampling jar, opened the lid upon reaching the lake bottom, and scooped the bottom sediments to obtain a sample. As with the sediment sampler, the lid of the jar was closed before the diver surfaced. Because of the spatial heterogeneity of bacteria concentrations in sed iment, three sediment samples were collected from each area at the same depth and composited.
Water and lake-bottom sediment samples were placed on ice and transported to the laboratory for pro cessing within 6 hours of sample collection.
Analysis of water and sediment samplesAt the time of sample collection, a four-parameter water-quality meter was used to make field measure ments of specific conductance, pH, temperature, and concentrations of dissolved oxygen. The meter was lowered to a point about 18 in. below the water's sur
face at a water depth of 3 ft in the middle area of each beach. These measurements are reported in Shindel and others (1998), and only the temperature data were used in the data analysis for this report. Water and sed iment samples were processed by USGS employees at the Cuyahoga County Sanitary Engineers Laboratory in Valley View, Ohio. The constituents anc1 methods of analysis, along with analyzing laboratory, frequency of analysis, and minimum detection limits are listed in table 1.
All water samples were analyzed for turbidity and E. coli concentrations within 6 hours of sample collection; 60 percent of water samples were analyzed for suspended-sediment concentrations. After process ing water samples for E. coli, turbidity wa s measured by use of a Hach Model 2100P portable turbidimeter (Hach Company, Loveland, Colo.). The remaining water sample was carefully poured into a disposable polypropylene bottle and shipped to the USGS Iowa District Sediment Laboratory, Iowa City, Iowa, for determination of suspended-sediment concentration. Suspended-sediment concentrations were determined by use of the filtration method described ir Guy (1969, p. 11-13)
Table 1. Constituents determined on water and lake-bottom sediment samples collected during field studies from May through September 1997 at three Lake Erie beaches
[mL, milliliters; gDW, gram-dry weight of sediment; mg/L, milligrams per liter; NTU, Nephelometric Turbidity Unit; g/kg, grams per kilog'am; USGS, U.S. Geological Survey; USEPA, U.S. Environmental Protection Agency; NEORSD, Northeast Ohio Regional Sewer District]
Constituent or determination
Escherichia coli in water
Escherichia coli in sediment
Suspended-sediment concentration in water
Turbidity in water
Total organic carbon of sediment
Analyzing agency
USGS, Ohio District
USGS, Ohio District
USGS, Iowa District
USGS, Ohio District
NEORSD
Frequency of analysis
Every sample
Every sample
Every other day or when environmental conditions changed
Every sample
1 sample/study" or when environmental conditions
Method and (reference)
USEPA 1103.1 (USEPA, 1985)
Modified from USEPA 1 103.1 (USEPA, 1985)
(Guy, 1969, p. 11-13).
Hach Company, Loveland, Colorado
USEPA, 9060A (USEPA, 1986)
Detection limit
1 co'ony/100 mL
1 co'ony/ gDW
l.Ong/L
0.01 NTU
0.1 g/kg
changed
Percent dry weight of sediment
Particle size of sediment
USGS Ohi Every sample (American Society of . ' . Agronomy, 1982, District p. 790-791)
IT«<-« OK 1 sample/study" or when (Guy, 1969, p. 47-51) u j\jj, vjnio . , -. . _ . . environmental conditionsDlstnct change
Not applicable
Not applicable
"Eight studies were done, ranging from 3 to 14 days for each study.
8 Factors Affecting Escherichia coli Concentrations at Lake Erie Public Beaches

Water samples were analyzed for concentrations of E. coli by use of the mTEC agar membrane-filtration (MF) method (U.S. Environmental ProtectionAgency, 1985). In this method, plates were incubated on mTEC agar for 2 hours at 35°C and then for 20-22 hours at 44.5°C. After incubation, the membranes containing yellow colonies were placed in a urea broth for 15 to 20 minutes. The colonies remaining yellow, indicating a negative test for the enzyme, urease, were counted as E. coli. Concentrations of E. coli were calculated as described in Myers and Sylvester (1997) and expressed as colonies per 100 milliliters (col/100 mL).
Unlike water, standard methods for enumeration of fecal-indicator bacteria in sediments are not well established. Several treatments for the separation of bacteria from Lake Erie bottom sediments were tested for use in field studies. After a series of experiments, described in Appendix A, a protocol for determination of E. coli concentrations in sediments was established for field studies. Fifty grams of sediment were asepti- cally removed from each of three replicate sample jars and composited into a sterile 1-L jar. Twenty grams of the mixed sediment was then placed into a bottle con taining 200 mL of saline buffer (U.S. Environmental Protection Agency, 1985). The bottle containing the sediment/buffer mixture was placed on a wrist-action shaker for 45 minutes. After shaking, the bottle was allowed to settle for 30 seconds, the liquid phase was poured into a second sterile bottle, and the remaining sediment was discarded. Concentrations of E. coli were determined in the liquid phase by use of the mTEC agar method, described previously for analysis of water samples.
Concentrations of E. coli in sediment were reported as colonies per gram of dry weight sediment (col/gdw). Several values were determined to complete this calculation. Percent dry weights were determined by placing about 25 g of composited sediment in a tared metal dish. After drying for 24 hours at 105°C, the sediment weight was recorded and percent dry weights were calculated. A sediment dilution factor was also determined. Because 20 g of dry or wet sedi ment displaces approximately 10 mL of buffer, the total volume of the sediment/buffer mixture was 210 mL. The dilution factor of the sediment sample was there fore, 10.5 mL/g (210 mL / 20 g).
The equation used to determine concentrations of E. coli in lake-bottom sediment was modified from American Society of Agronomy, Inc., and Soil Science
Society of America, Inc. (1982, p. 790-791), as fol lows:
col/gdw = ((pc x 10.5) * (volume x dw)), where col/gdw is colonies/gram of (dry weight) sedi ment, pc is plate count, 10.5 is sediment dilution fac tor, volume is volume of sample plated, and dw is percent dry weight of sediment.
Some sediment samples were analyzed for total organic carbon and particle-size distribution. For these analyses, six replicate jars (instead of three jars) were collected at each location to ensure a sufficient amount of sediment for analysis. For total organic carbon anal ysis, equal amounts of sample from each replicate jar were composited to obtain more than 500 mL of sedi ment. The composited sediment was then processed through a 2 mm stainless steel sieve using lake water as a rinse. The less-than-2-mm fraction was trans ported in a cooler to the Northeast Ohio Regional Sewer District laboratory, Cuyahoga Heights, Ohio, for determination of total organic carbon. The remain der of the sediment in the six jars was composited and particle-size analysis was done at the USGS Ohio District Laboratory, Columbus, Ohio.
Collection and compilation of ancillary informationAncillary environmental data were collected by the USGS or compiled from a variety of sources. Wind speed and direction were measured at the National Oceanic and Atmospheric Administration (NOAA) Surface Airways Station at Burke Lakefront Airport, Cleveland, Ohio, and archived by the Great Lakes Environmental Research Laboratory, National Oce anic and Atmospheric Administration Coast Watcl Program (George Leshkevich, NOAA, written com- mun., 1997). The number of swimmers and wave heights were estimated by USGS personnel at the t : me of sample collection. Information on flow and duration of wastewater treatment plant overflows and metered outfalls was obtained from the Northeast Ohio Regional Sewer District (Eva Roller, Northeast Ohio Regional Sewer District, written commun., 1997). This included sewage-treatment plant overflows at the Easterly and Westerly Wastewater Treatment Plants and overflows from the Edge water, West 117th Street, East 156th, and Lakeshore metered outfalls. Informa tion on flow and duration of effluent that was diverted to the City of Euclid's wet-weather treatment facility was obtained from the City of Euclid (Robert Gall, City of Euclid, written commun., 1997). Daily rairfall amounts were measured by NEORSD at the Easterly
Methods of study

and Westerly Wastewater Treatment Plants (Ruth Crowl, Northeast Ohio Regional Sewer District, writ ten commun., 1997). Westerly rainfall data were used at Edgewater Park, and Easterly rainfall data were used at Villa Angela and Sims Park.
Statistical methodsAnalysis of variance (ANOVA) was used to compare more than two groups of data. Histograms and the Sha- piro-Wilk test (Wilk and Shapiro, 1968) were used to determine the normality of the distribution of Iog 10- transformed bacteria concentrations. For small data sets or if the data were still not normally distributed after a Iog 10-transformation, the nonparametric rank transform test was done instead of the parametric ANOVA. In the rank transform test, all data are com bined and ranked from lowest to highest value, and an ANOVA is computed on the ranks. The parametric and nonparametric ANOVA determines whether the mean or median, respectively, differs between groups. The null hypothesis is that each group mean or median is the same; the alternative hypothesis is that at least one is different. If ANOVA showed differences among groups, the Tukey-Kramer multiple comparison test was used to determine which groups differed from each other (Helsel and Hirsch, 1992, p. 198-200). The level of significance for ANOVA was set at cc=0.05, unless specified otherwise.
Correlation coefficients were calculated to determine the strength of association between two continuous variables. Correlation coefficients are a measure of the strength of the monotonic relation y generally increases or decreases as x increases. Pear- son's r is a correlation coefficient that measures the linear association between two variables and is com puted using means and standard deviations directly from the observed data. Spearman's rho, another cor relation coefficient, measures the monotonic relation (nonlinear or linear) between two variables and is computed on the ranks of the data. If the data lie exactly along a straight line with positive slope, then the correlation coefficient is equal to one (Helsel and Hirsch, 1992, p. 209-218). The more the correlation coefficient deviates from 1 or -1 and approaches zero, the weaker the relation. Correlation coefficients were considered statistically significant if the p-value was less than 0.05.
Linear regression analysis was used to predict E. coli concentrations in water from one or more explanatory variables. Simple linear regression (SLR)
was used to describe the relation between E. coli con centrations and one explanatory variable. Multiple lin ear regression (MLR) is the extension of SLR to the case of multiple explanatory variables (Helsel and Hir sch, 1992, p. 295).
For MLR, models were chosen among all possi ble variable combinations to maximize the coefficient
^of determination (R~) and minimize the Mallows' Cp statistic (Mallows, 1973). The R" of the model is the fraction of the variation in the dependent variable (E. coli concentrations) that can be explained by a combination of explanatory variables. T^e Cp statistic is a measure of the standard error and the bias intro duced by not including important variables in a model. The Cp statistic is designed to achieve a workable compromise between the desire to explain as much variance in E. coli concentrations as possible (mini mizing bias) by including all relevant variables and to minimize the standard error by keeping the number of variables small (Helsel and Hirsch, 1992, p. 312-313). When several models had nearly equal P~ and Cp val ues, a model was chosen on the basis of reduced multi- collinearity (where at least one explanatory variable is related to one or more other explanatory variables) and cost of data collection.
To evaluate how well E. coli concentrations can be predicted from MLR equations, prediction intervals were determined from a randomly chosen set of values for explanatory variables. Prediction intervals were used to estimate the range of predicted E. coli concen trations that result given a particular level of uncer tainty. Given a single set of explanatory variables, a 90-percent prediction interval represents the range of values a single E. coli concentration is expected to assume that includes the true E. coli con centration 90 percent of the time.
Because prediction intervals are used to predict a single E. coli concentration, they are generally too wide to offer a reasonable prediction of recreational water quality. Alternatively, the probability of exceed ing a threshold value in this case, the r ingle-sample bathing-water standard of 235 col/100 mL was used to assess usefulness of the MLR model. The error associated with a predicted E. coli concentration for a given set of explanatory variables was used to estimate the probability that the true E. coli concentration would exceed 235 col/100 mL.
Another way to examine a model's ability to accurately predict E. coli concentrations is to use clas sification tables. Classification tables compare the pro-
10 Factors Affecting Escherichia coli Concentrations at Lake Erie Public Beaches

portions of correct and incorrect predictions. A classification table is a 2 by 2 frequency table of observed and predicted events and nonevent responses. An event was defined as a sample with an E. coli concentration equal to or exceeding the single- sample bathing-water standard; a nonevent was defined as a sample with an E. coli concentration less than the single-sample bathing-water standard. Sensi tivity was the proportion of event responses that were predicted correctly as events. Specificity was the pro portion of nonevent responses that were correctly pre dicted as nonevents. The false positive rate was the proportion of predicted events that were observed as nonevents, and the false negative rate was the propor tion of predicted nonevents that were observed as events (SAS Institute, 1990).
One way the chosen MLR model was tested was by developing and comparing two classification tables. The first classification table was generated from all of the data used to develop the MLR model without removing any portion of the data set. For the second classification table, the data were ranked by wave height and were randomly divided into three data sets. The data were sorted by wave height to ensure that each data set contained a reasonable repre sentation of the overall data. The MLR model was then run three times with two data sets each, omitting a different data set each time. A classification table was obtained by summing the results of the three runs. The model was considered to be reasonable if the second classification table was similar to the classification table produced from all of the data used to develop the MLR model (the first classification table).
Quality-assurance and quality-control practicesQuality-assurance and quality-control (QA/QC) prac tices were followed for all phases of data collection, analysis, and data validation. Field and laboratory pro tocols were written and distributed to ensure that pro cedures were performed according to established methods and in a uniform manner by all personnel.
The spatial heterogeneity of E. coli concentra tions in lake-bottom sediments and water was investi gated before field studies. The results of these investigations were considered while designing sam pling protocols and identifying sampling points in field studies. These protocols are described in a previ ous section of this report.
Spatial heterogeneity of E. coli concentrations in water were found to be less than in sediment at
Edgewater and Villa Angela, but not at Sims. For sedi ments collected at the three beaches, 10-fold to 15-fold differences in E. coli concentrations were often found between samples collected from different areas at the same beach, from below different water depths in the same area, and from the same area at the same water depth. At Edgewater and Villa Angela, 2-fold differ ences in E. coli concentrations were found in water samples collected from different areas at the same beach; most differences were considerably less thrn 2-fold. At Sims, however, the differences in E. coli concentrations between water samples collected from different areas were considerably greater than at the other two beaches; for example, in one morning sam pling, a 20-fold difference was found.
Quality-control samples were collected to trea sure sampling variability and analytical bias and to ensure that data satisfied the project objectives. Vari ability is the degree of variation in independent mea surements as the result of repeated application of the measurement process under specified conditions. Pias is a systematic error inherent in a method or caused by some artifact or property of the measurement system. Bias may be either positive (from contamination) or negative (from loss, degradation, or poor method recovery) (Schertz and others, 1998). The following quality-control samples were collected:
1. Turbidity turbidity measurements were taken in duplicate by measuring two aliquots of water from the sample bottle. Measurements that did not agree within 10 percent were repeated.
2. Suspended-sediment concentrations approxi mately 5 percent of the suspended-sediment samples collected were analyzed in duplicate.
3. Percent dry weights approximately 10 pe~- cent of percent-dry-weight determinations were done in duplicate.
4. E. coli concentrations eleven percent of the water samples and 7 percent of the sediment samples were collected in a nested replicate design. Two water samples were collected in two different bottles or two sediment sam ples were mixed with saline buffer in two different bottles (replicate sample bottles). Each water or sediment replicate bottle was then plated in duplicate (split samples) for concentrations of E. coli. Results of quality- control replicate samples were used to
Methods of study 11

determine sampling and analytical variability and are described in Appendix B.
In the laboratory, equipment and supplies were regularly checked to ensure proper performance. The incubators were monitored throughout experiments and field studies to ensure that temperatures were 35°C ± 0.5°C or 44.5°C ± 0.2°C. The sterility of the buffer water and media were tested by use of blanks aliquots of buffer water filtered before each sample. Sample results were rejected if incubator tem peratures were outside acceptable ranges or quality- control testing showed contaminated blanks. The auto clave operating temperature and pressure were checked for each run, and heat-indicating tape was used to identify supplies that had been sterilized. Other standard laboratory practices cleanliness, safety practices, procedures for media preparation, specifica tions for reagent water quality were adopted by
USGS employees as set forth by American Public Health Association and others (1995, section 9020) and Britton and Greeson (1989).
Factors affecting Escherichia coliconcentrations in water and lake-bottom sediments
Summary statistics of E. coli concentrations in water and lake-bottom sediments collected during morning sampling events on 41 days throughout the 1997 recre ational season are shown in table 2. Concentrations of E. coli were lowest at Edgewater among the three beaches, and bacterial water quality was generally good at Edgewater, exceeding the single-sample bath ing water standard on only 7 of the 41 days sampled. Concentrations of E. coli in the four areas of Sims were higher and more variable than at either
Table 2. Concentrations of Escherichia coli in water and lake-bottom sediments collected at three Lake Erie beaches on 41 selected mornings from May through September 1997
[For Edgewater Park and Villa Angela, the daily concentration was determined by calculating the mean of two water samples or five lake-bottom sediment samples; NA, not applicable]
Beach Median Minimum MaximumNumber of days bathing-
water standard 8 was exceeded
Waterb
Edgewater
Villa Angela
Sims 1
Sims 2
Sims 3
Sims 4
86
150
400
450
390
400
9
13
20
21
10
13
830
8,100
16,000
19,000
36,000
29,000
7
17
23
24
27
27
Sediment0
Edgewater
Villa Angela
Sims 1
Sims 2
Sims 3
Sims 4
7
35
150
130
72
34
1
5
2
4
2
4
38
170
8,000
2,600
7,200
750
NA
NA
NA
NA
NA
NA
aNumber of days the concentration of Escherichia coli in water exceeded the single-sample bathing-water standard of 235 colonies per 100 milliliters, out of 41 days sampled.
bColonies per 100 milliliters. cColonies per gram dry weight of sediment.
12 Factors Affecting Escherichia coli Concentrations at Lake Erie Public Beaches

Edgewater or Villa Angela, except for concentrations of E. coli in sediments at Sims area 4.
To characterize the sediment quality at each beach and aid in data interpretation, particle-size anal ysis and total organic carbon concentrations were determined in lake-bottom sediments collected on selected sampling days (table 3). Finer sediments were found at Edgewater than at Villa Angela or Sims; at Edgewater, most of the sediments were classified as medium to fine sands (63 to 250 |nm). The sediments collected at the beaches at Villa Angela and Sims var ied considerably in particle size; most were classified as medium sands to gravels (250 to greater than 1,000
|Lim). Total organic carbon concentrations in sedinent ranged from 0.5 to 3.2 mg/kg; not enough data were collected to examine total organic carbon concentra tion as a factor affecting E. coli concentrations in sedi ment.
Data collected each morning at the beaches at Edgewater, Villa Angela, and Sims are shown in fig ures 3 through 5. Concentrations of E. coli in water and lake-bottom sediments and the physical distur bances that were expected to affect those concent-a- tions rainfall, wastewater-treatment plant overflows, and wave heights are included.
Table 3. Particle-size analysis and total organic carbon concentrations in lake-bottom sediments collected at three Lake Erie beaches, 1997
[ND, not determined]
Dates Sampling area
Samplingdepth (feet)
Percent finer than (micrometers)
1,000 250 63
Total organic carbon (milligrams
per kilogram)
Edgewater Park
6-18
6-20
6-20
7-09
8-11
8-18
4
3
4
3
2
3
4
5
2
6
3
4
98.8
99.6
99.2
99.5
99.6
99.8
88.3
96.6
89.0
96.4
98.3
98.3
0.1
0.5
0.2
0.5
1.0
0.5
2.1
ND
ND
0.8
3.2
0.8
Villa Angela
6-18
6-20
6-20
7-9
8-12
8-18
3
3
5
5
4
4
4
6
2
6
2
5
55.1
99.9
47.6
62.6
29.0
99.5
0.7
59.7
1.2
10.2
0.2
10.0
0.1
0.3
0.2
0.1
0.1
0.2
1.4
ND
ND
1.4
2.4
0.6
Sims Park
6-18
6-20
6-20
7-09
8-12
8-18
1
2
3
2
1
1
4
6
2
5
5
4
26.7
86.7
77.5
39.5
18.3
8.6
5.9
13.2
4.3
4.2
6.4
1.2
3.4
6.4
0.1
0.1
3.8
0.3
0.5
ND
ND
3.2
1.0
1.9
Factors affecting Escherichia coli concentrations in water and lake-bottom sediments 13

(Q
JTl
I (B
u
02
0.4
CO LU 0 0
.6
-.0
8
_1 |l.O
DC1.
2
1.4
1 K
p., - - _ - _
t '; 1 I ; '.
1 i
ii
-
'-'
_
' 1 J
J LU u
LT L 1 -I
1 '
' 'U
1 '
Ilul
' J
""^
'
[J
DA
ILY
RA
INF
ALL
- *-
W
AV
E H
EIG
HT
:
^
OV
ER
FL
OW
IN
DIC
AT
OR
<
" #
*
xxx
'.,,,,.,,.,,,,,,, I,.
,.,,
,,,,
t <
', ,'
_ J
w
i^ t
_ ,'
\ ;
it
^
-
I
i '
_
' '
' '
' '
' 1
. ; - -
-t - - _ -
i
^
*
f«*
t
*
t f*
!
i
» * i
/ \ /
W
', \ 4± ~
, ',
W(.
X>
'IN
,' ; i \L*L
>
~tti
§ j i
~ .W
-
H*
^"
,,,,,,,,,
,,!,
,,-
4-6
1- LLJ
3-5
LU LL
Z h-
"
2-4
X O LU I
1 -3
> ^
0-2
15
20
25
31
5 10
15
20
25
30
5 10
15
20
25
31
5 10
15Ma
y Ju
ne
July
August
1997
20
2531
l.U
UU
s* Ow
goo
h-t
<
-"
ERE.COL/CONCENTR )
LONIES
PER
100
MILL
6
§ o o
\ N
-1 <
0
200
£z
0
,,,,
,,.,
,,.,
....
I ......,,.,,,,,..,...,.,,,.,..
I ,.,.,,,,,,,,,,,,,,..,,,,,,,,,,
I ,,,
,,,,
,,,,
,,,,
,,,,
,,,,
,,,,
,,,
I ,,,
E.
CO
L/ C
ON
CE
NT
RA
TIO
N:
WA
TE
R
T
*,
.
E.
CO
L/ C
ON
CE
NT
RA
TIO
N:
SE
DIM
EN
T
~
4-
* \r
SIN
GL
E-S
AM
PL
E
|j ^
i A
A
] "
! B
AT
HIN
G-W
AT
ER
ji
/»
» k'R
/ ft
\ S
TA
ND
AR
D
4
j /
I ti
K
U
I ..
....
...L
....
....
....
....
....
....
....
....
....
....
....
....
.I..
.._
_^^
\ *
* 4
^ A
w ^
\
:
x ,
o ,
, v
J v ^
, ^
^
,1 :
15
20
25
31
5 10
15
20
25
30
5
10
15
20
25
31
5 10
15
20
25
31
M
ay
June
Ju
ly
Aug
ust
4U
-l-
ZI
OO
h-L
U
30 £
S
-L l\3 0
0
ENT
E.COL/
CONCENT ONIE
S PER
GRAM
DRV
to
So
coz
0
Figu
re 3
. Mea
n co
ncen
trat
ion
of E
sche
richi
a co
ll (E
. col
l) in
wat
er a
nd la
ke-b
otto
m s
edim
ents
, rai
nfal
l am
ount
s, o
verf
low
indi
cato
rs,
and
wav
e he
ight
s fo
r the
rec
reat
iona
l sea
son
of 1
997
at E
dgew
ater
Par
k, C
leve
land
, O
hio.

rn
0.5
-
r1.
0 -
1.5
-
2.0
I"" - - " -
t
-
: ;+
V
*
*
**
......
......
..^
..^|
I[]
DA
ILY
RA
INF
ALL
- *-
W
AV
E H
EIG
HT
*.
OV
ER
FLO
W I
ND
ICA
TO
Rt
f\
'
!
A ^^
^ ,*
^^
'
>' i'i
**
i *
i * I
X^^
^k
^L ^^
^^^ ^k
^W
^r
^r ^r
^^^ ^r
11
* *
*,,,,...,,.,. 1 .,
,.,,
,,.,
..,,
,,.,
,,,,
..,.
,,,
U
l[
*^ ,,,,
,,,,
,.!,
.
j m
A
J[F
. - -
1 f
_
^ ^
'* *.
'\ ; ,
; '.
;
: f : i f i
-;
| ;'i
; '.
; '
i i
/ ' i
' : '
ii *i
i
'+> «>
-$
%
Wfc
X
%.
;
,,,,,,,,,,..,...,..,,,,,.,,, 1
,,,
,,,,
-
4-6
tDq .
c
yj
J
S
UJ Z
2-4
I O UJ I
1-3
£ i
0-2
15
20
25
31
5 10
15
20
25
30
5
10
15
20
25
31
5 10
15
20
25
31
5
Ma
y Ju
ne
July
A
ugust
1997
-W
§£
2,5
00
DC
lit
2,0
00
§1 Orr
-1-5
00
OU
J
aiz
1,00
0£§ I O
50
Sz:
50
0
_ - -
jy
1 00
colo
nies
71 0
0 m
L -
20M
ay1
997
6,00
0 co
loni
es 7
1 00
mL
- 21
Aug
1 99
7
8,1
00 c
olon
ies
71 0
0 m
L-0
3S
ep 1
997
.
E. C
OL/
CO
NC
EN
TR
AT
ION
: W
AT
ER
.
E. C
OL/
CO
NC
EN
TR
AT
ION
: S
ED
IME
NT
T ^
I M
l\
f
f 4
I if
! ^
II
AJL
SIN
GLE
-SA
MP
LE
A
f
' I
/ JM
BA
TH
ING
-WA
TE
R
I A
f 4
' Vi
4
I *L
f I
L \f
*
A
^jy
v
/*?
V
r^ j
1
1
. i i i
t
- . _ - - -
t : - -j
! ,,*,,,
JU
U
-HZ
I
25
0
QtD
HU
J
H>
9nn
ZD
C^O
U
UJQ ol
150 ^ O
o!
100
|_U
J^ s
mg
50
g
ow
z
n15
20
25
M
ay
3110
15
20
2
5
30
5 10
15
20
25
Ju
ne
July
1997
31
5 10
15
20
25
A
ugus
t31
Figu
re 4
. Mea
n co
ncen
tratio
n of
Esc
heric
hia
co'i(
E.c
o'i)
in w
ater
and
lake
-bot
tom
sed
imen
ts, r
ainf
all a
mou
nts,
ove
rflow
indi
cato
rs, a
nd w
ava
heig
hts
for
the
recr
eatio
nal s
easo
n of
199
7 at
Vill
a A
ngel
a, C
leve
land
, Ohi
o.
I (Q
0.5
-
1.5
-
2.0
1.
-
Jt ;i
....
.. 1 -
j ';
** *
3
........
.......
.^ w
.
-J fj
DA
ILY
RA
INF
ALL
-4-
WA
VE
HE
IGH
T
...... .J.J.
.........
.
U
l[[IP
[t
^
OV
ER
FL
OW
IN
DIC
AT
OR
j
t
t ? ^ .
vp.
^^T
*'r'IV
Tvr«
T1'
"T^T
" -T
' "T
VT
" -T
' "T
^T"
"1
j ;
*f
4 i
W 4
*
4 * *
t
-^ , 1 ;
IT
j-
t-
f* I
ti
J !
i t!
f it
.,,,,,
,,...,
,...,,
......
,,, i ,
_ - - . <
4-6
LU
3-5
UJ Z
2-4
I
0 LU
1-3
£
0-2
OLD
i^IJ
15,
000
trlj
15
20
25
31
5 10
15
20
25
30
5
10
15
20
25
31
5 10
15
20
25
31
M
ay
June
Ju
ly
Aug
ust
1997
8,0
00 c
olo
nie
s/g d
ry w
eig
ht
- 1
6A
ug
19
97
6,1
00 c
olo
nie
s/g d
ry w
eig
ht
- 1
7A
ug
19
97
. E.
CO
LI C
ON
CE
NT
RA
TIO
N:
WA
TE
R
A
. .
E.
CO
LI C
ON
CE
NT
RA
TIO
N:
SE
DIM
EN
TLU
*51
i§ 8 £
10,0
00
Ow
O
liJU
JZtr
OLU
pJ
5,00
0 |-
Ol J
** \
2,00
0
ZI
oo
HliJ
- 1,
500
zee
LUO
- 1,
000
15
20
25
31
5 10
15
20
25
30
5
10
15
20
25
31
5 10
15
20
25
31
M
ay
June
Ju
ly
Aug
ust
1997
- 50
0
^*0
UJW
ZZ
58
Ljj
Ow
z
Figu
re 5
a. C
once
ntra
tion
of E
sche
richi
a co
li(E
.col
i) in
wat
er a
nd la
ke-b
otto
m s
edim
ents
, rai
nfal
l am
ount
s, o
verfl
ow in
dica
tors
, an
d w
ave
heig
hts
for t
he
recr
eatio
nal s
easo
n of
199
7 at
Sim
s Pa
rk, a
rea
1, Eu
clid
, Ohi
o.

u
co05
LJUI
O 2 2 -.1.
0
< LL 2 < DC
T,
1-5
u a o
T
""'"'
: - 1 f; i
; ; ;
- 4
4
" - _ " ***
**
^W
it
......
......
.. ^
......
......
......
...
,.,.....
,u
U u
U
4
Q
DA
ILY
RA
INF
ALL
-4-
WA
VE
HE
IGH
T
4
4
#
OV
ER
FLO
W I
ND
ICA
TO
R
| l4
: ft
; ,'
!
! '
'
1 ^^
TT
^^
^^
^^ ^^
^^
{ 1
'
i '
/'
/ ''i
' '
/
1 '
;\;
' '>
' /'
t '
n
i '*
i'
A^^
^ ^^
^L
^L
^^fe
^^
^L J
^ ^L
*^
^^^^ ^
^
^
^^
| i «t *t ^
> 4
1
;/ j(f ^iO
i ^
^ ^
IT
'J
;
4^ : - " i . - \ 4 . _
^
_ ;
,,,,,,,,,, i
, . ,'
4-6
UJ
3-5
U
J
Z j_"
2-4
I
CD UJI
>1 -3
> ^ 5
0-2
ffl
1-1 g
....
s*
' 15
20
25
31
5
10
15
20
25
30
5 10
15
20
25
31
5
10
15
20
25
31<o
M
ay
June
Ju
ly
Aug
ust
rti
1997
55 2.
20,0
00 i
I Q. 5 -c
o0)
2(T
SO
WjZ
h-
*s
5^ 1
5,000
O
n-
~~.
0
K^
o
Z-5
fD
LLJ
^^
S "S
s 2
°=
RD
C 10
,000
O
J^U
J/A
""J ^~
1 8ff
iS
U
J2
S
trO
* yd
5'00
0»
<
0
Q.
52
5"
2,6
00 c
olo
nie
s/g d
ry w
eig
ht
- 1
7A
ug
19
97
-^^^ f
. E.
CO
L/ C
ON
CE
NT
RA
TIO
N:
WA
TE
R
I
-A
- E.
CO
L/ C
ON
CE
NT
RA
TIO
N:
SE
DIM
EN
T
II J
_
I
L:
A;
t ,
N;
, /]
[ \
. ^
\ JH
ij I 8
t /i " * *
11 "
"
i "
_ - - - - - - .
h -, :
1' l
\ ;^.
, \j\j\j
.h-Z
IO
CD
t-U
J
1,5
00
CC
^
2D
CLU
j ^>
g<
1,00
0 ^?
tDP
JDC
Oo.
Uic
oh-
m22
500
!^jg 38 C
02
k
3
°15
20
25
31
5 10
15
20
25
30
5
10
15
20
25
31
5 10
15
20
25
31
2
May
Ju
ne
July
A
ugus
tI
1997
9 a. 3 <D 3
Figu
re 5
b. C
once
ntra
tion
of E
sche
richi
a co
li(E
.col
i) in
wat
er a
nd la
ke-b
otto
m s
edim
ents
, rai
nfal
l am
ount
s, o
verfl
ow in
dica
tors
, an
d w
ave
heig
hts
for t
he
recr
eatio
nal s
easo
n of
199
7 at
Sim
s Pa
rk, a
rea
2, E
uclid
, Ohi
o.
_k
U
09 31 o 5
0.5
<n
W
>
£
! i
3
Z(0
1
Q
ta
__
1
f)
*£
31
LL
S
?5-
<3
- DC
5'
1.5
a o_ o o o A
r\
f\
1 - _ "-1
£
..\J
~
15s o'
20,0
00
0) m
o LU
» tii
15,00
0"^
(T
"~
ic
H^i
2
z
O'
LU
^m
O
* '
^H
^£
f"
>
A
^ -
i-fi)
O
o XD
C 10
,000
3-
^LU
*
~jD
-O
(/3
CJ
LUU
JZ
o:O
^^
5,0
00
<o
§ 2
!
t 1' i 1 1 ; I ; |
; ',
^ ^
*
^1
T"
T
_
-
W|C
7M
WR
«
...........
..
^
U
fj
DA
ILY
RA
INF
ALL
-*-
WA
VE
HE
IGH
T
U t
4
-....u
.....
r Ut
*
OV
ER
FL
OW
IN
DIC
AT
OR
ii
|
t j ; i «
;; '; ^ ^
V]V
|VJ\
/]V
]\
/]\
/]V
]\
/]N
1
,,
;
ii '
', .
;
'. ;
: tfi
'
/' ;'
i '.
» i »
/ \;
+ v
^^ ; ,' .'
**
ii
fi
^,';
,'
/ ' i
'
' 1
'
^ i
+
- > ; ; >
-
, 4- ; if ;
.' jj ^
......
. uf: - - -
.. _ - - - 4 - -
^^
- -
&
-^
^^|e
|e|f
)|o|o|o
|< ^i
20
25
31
5 10
15
20
25
30
5
10
15
20M
ay
June
....
....
....
....
1 ..
....
....
....
....
.
July
1997
.......... 1 .,.....,..,...
25
31
5 10
15
1
4-6
h- LU
3-5
LU Z h-
"
2-4
I O LU I < §
0-2
20
25
31
Augu
st
. .
. .
. .
i .
. .
I .
. i
i .
. .
. .
. .
36
,00
0 c
olo
nie
s/g 1
00
mL
- 13A
ug1997
*
F C
OL/C
ON
CE
NT
RA
Tin
N-
WA
TF
R
A
. -
E.
CO
LI C
ON
CE
NT
RA
TIO
N:
SE
DIM
EN
T
II
^I V
' \
I l\
j .4
/\
./
' 1 i 1 I I
\l i.
^ Ii i
i i
i i
! i
i i
i 1
i i
i 1
*> A
nn
7,20
0 co
loni
es/g
dry
weght-
16A
ug19
97
i t l * f\ .,'1 r\
- - - " - " - - .
*
-
£.,
\J\J
\J
-H
ZI
OO
h-L
U
1,50
0 o:^
i _ >
-Z
DC
LU
Q
Z<
O ^
"
1,00
0 ^.^
OLU
Oo
.U
JCO
|_ L
Uzz
500
^O
Q°
So
CO
Z
1997
Figu
re 5
c. C
once
ntra
tion
of E
sche
richi
a co
li(E
.col
i) in
wat
er a
nd la
ke-b
otto
m s
edim
ents
, rai
nfal
l am
ount
s, o
verfl
ow in
dica
tors
, and
wav
e he
ight
s fo
r the
re
crea
tiona
l sea
son
of 1
997
at S
ims
Park
, are
a 3,
Euc
lid, O
hio.

0.5
-
1.5
-
i(D O 5' (Q m % o 1 & 8 5;
o O 3 O (D 1 D)
6'
3 <A 5' 1 D) <D D) a 5T 3T 9 ? § 3 <A & 3 (D 1
o|
<^
DC
iF~
i
^^ ^
z1 1
1 ^>
z§
O"~
^.
UJ
n°"
Om .
o:0
UJQ
^Z _
2.0
15,0
00
10,0
00
5,00
0 0
;L - - - - - - -
:
' I
u
; **
*
*l*O
> sl
/OsL
J,
U
-1 fj
DA
ILY
RA
INF
ALL
-4-
WA
VE
HE
IGH
T
4-
f
^
OV
ER
FLO
W I
ND
ICA
TO
R
t
f*
tf*
j /
/' /
\&-
vr\
u.....
. J
U4 ;
_ t ;'.
r iy - -
_44
;:i
-
i ;:
':44
44
4 'i if
^
.' I
' '. ;
4' 4
i
4
44
-
4-6
H3-5
UJ Z
2-4
X
O LU X
'1-3
^ s
0-2
15
20
25
31
5 10
15
20
25
30
5
10
15
20
25
31
5 10
15
20
25
M
ay
June
Ju
ly
Aug
ust
1997
1997
31
111
1 ....................
- _ - " \
V^
"....A
A.........I...............V
&/M
15
20
25
31
5 10
15
20
May
Ju
ne
\ 2
9,0
00
colo
nie
s/100 m
L -
22
Jun
19
97
/
22
,00
0 c
olo
nie
s/100 m
L -
13A
ug1997'
. F
C
OL
/ C
ON
CE
NT
RA
TIO
N;
WA
TF
R
A.
.
E C
OL
/ CO
NC
EN
TR
AT
ION
: S
ED
IME
NT
t 1
25
30
5 10
15
20
25
31
5
10Ju
ly
' - - _
,t ;
M
:-A
....
. ....
..:
15
20
25
31A
ugus
t
i=y
1,50
0
Oir
1,00
0
500
Oui
CJQ
-
i-uj
UJ2
.
Figu
re 5
d. C
once
ntra
tion
of E
sche
richi
a co
li(E
.col
i) in
wat
er a
nd la
ke-b
otto
m s
edim
ents
, rai
nfal
l am
ount
s, o
verfl
ow in
dica
tors
, and
wav
e he
ight
s fo
r the
re
crea
tiona
l sea
son
of 1
997
at S
ims
Park
, are
a 4,
Euc
lid, O
hio.

These plots suggest some general patterns found at all three beaches (figs. 3-5). Peak E. coli concentra tions in water samples occurred either during or imme diately following rainfall or wastewater-treatment plant overflows, with a few exceptions. Higher con centrations of E. coli in water were also found when wave heights were 2 to 4 ft or higher; these higher wave heights usually occurred during or after rainfall. Sediment E. coli concentrations generally increased at the same time or after a peak in water E. coli concen trations.
Exceptions to these generalities can be found upon closer examination of the plots for each beach. These exceptions were examined to provide some insight into the extent of storage of E. coli in lake-bot tom sediments during this sampling period. Periods of storage in sediments occur when sediment concentra tions increase as water concentrations decrease or fluc tuate.
At Edgewater, from August 15 through 21, sedi ment E. coli concentrations increased gradually while water concentrations fluctuated (fig. 3). During this period, there may have been short-term storage of E. coli in sediments; water and sediment concentra tions were still somewhat elevated on September 1. Earlier that summer on July 8 and 10, sediment E. coli concentrations were the highest among the samples collected at Edgewater; this occurred when water E. coli concentrations remained low. A closer exami nation of the data revealed that sediment E. coli con centrations were considerably higher in samples collected at only one of the five areas of the beach on each of those two days, and concentrations were not higher at the same area on both days. These high unex plained E. coli concentrations in sediments may be due to temporary storage of E. coli in isolated loca tions.
At Villa Angela, E. coli concentrations in water were elevated on May 20 and 21, but concentrations in the sediment remained low (fig. 4). This sampling was early in the season, and storage of E. coli in sediments was not apparent. Storage of E. coli in sediments may have occurred from July 13 through 16 and again from August 13 through 20 at Villa Angela. In addition, from July 13 through 16, concentrations of E. coli in water generally increased when wave heights increased; this occurred in the absence of rainfall or overflows. This increase may have been due to resus- pension of E. coli from lake-bottom sediments in the nearshore area or recirculation of E. coli from deeper
sediments outside the bathing area, perhns from a shift in the direction of lake currents. (The directions of lake currents were not investigated du-ing this study). On July 16, E. coli concentrations in the sedi ments peaked due to extremely high concentrations found in individual samples from areas 1 and 2.
At Sims (figs. 5a-5d), temporary storage of E. coli in sediments may have occurred in some areas in June and July, but sediment concentrat : ons followed the same patterns as water concentrations during August. On June 17-20 in areas 1 and 2, sediment E. coli concentrations increased while water concen trations and wave heights decreased (figs1 . 5a and 5b). From July 14 through 19, various degree? of E. coli storage in sediments may have occurred in areas 1, 2, and 3, but not in area 4, even though this period was dry and no wastewater-treatment-plant overflows occurred. Perhaps the elevated E. coli concentration in water at area 1 on July 19 was due to resuspension from lake-bottom sediments; wave heights were 3-5 ft on that day. On July 15, an unexplained peak E. coli concentration in sediment occurred in area 3 at Sims; similar peaks were found at the other two beaches, and may be due to temporary storage of bacteria in sedi ments at isolated locations.
Data collected at the three beaches indicate that short-term storage (less than one week) cf E. coli in lake-bottom sediments may have occurred. Although there is no direct evidence for long-term storage of E. coli, concentrations in water were found to increase with increasing wave height. Unfortunately, the resus- pension of E. coli from lake-bottom sediments by wave actions could not be adequately assessed because higher wave heights usually occurred during or after a rainfall or wastewater-treatmert-plant over flow. At Edgewater, sediment particle sizes were the smallest among the three beaches, which makes more surface area available for bacterial attachment, set tling, and resuspension. The bacterial water quality at Edgewater was generally good during the. sampling period, so it was difficult to investigate thoroughly the storage and resuspension of E. coli in the sediments most likely to have attached bacteria.
Relations between Escherichia coli concentrations and environmental or water-quality variablesStatistical tests were done to evaluate quantitatively the relations between environmental or water-quality factors and E. coli concentrations in water.
20 Factors Affecting Escherichia coli Concentrations at Lake Erie Public Beaches

Pearson and Spearman's correlation coefficients were computed to assess the linear and monotonic relation, respectively, between E. coli concentrations and other continuous variables. Continuous variables describing environmental or water-quality factors were (1) turbidity, (2) suspended-sediment concentra tion, (3) 24-hour antecedent rainfall (rainfall), (4) weighted antecedent rainfall (weighted rainfall), (5) 24-hour antecedent wastewater-treatment plant over flow, (6) wind speed, (7) water temperature, and (8) a resuspension index. Rainfall was defined as the amount of rain in inches that fell in the 24-hour period preceding the 6:30 a.m. sampling. The weighted rain fall was computed from the rainfall amounts that occurred in the 72-hour period preceding the 6:30 a.m. sampling, with the most recent rainfall receiving the highest weight. Rainfall amounts for the 24-hour ante cedent period were multiplied by a factor of three. Rainfall amounts in the greater than 24- to 48-hour antecedent period were multiplied by two, and rainfall amounts in the greater than 48- to 72-hour antecedent period were multiplied by one. The three weighted terms were then summed to provide weighted rainfall for the time of sampling. The overflow was defined as the amount of wastewater-treatment-plant overflow, in million gallons, that occurred on the previous day. The resuspension index was computed by multiplying the mean concentration of E. coli in sediment found on the previous day by the wave height on the current day.
Pearson's r and Spearman's rho correlation coefficients are shown in table 4 for all data, for data grouped by beach, and for data grouped by area at Sims. Statistically significant correlations were found for all relations between E. coli concentrations and tur bidity, rainfall, and weighted rainfall. Statistically sig nificant correlations were found for the relations between E. coli concentrations and wastewater-treat ment-plant overflows, except for the linear relation (Pearson's r) at Villa Angela, and the resuspension index except for linear relation at Edgewater and two areas at Sims. Statistically significant correlations ranged from 0.341 to 0.708, and the highest correla tion coefficient was found for E. coli concentrations and rainfall at Sims area 3. Correlation coefficients by area for Sims were not much different from those found for all Sims areas combined. Relations between E. coli concentrations and wind speed or water tem perature were weak or not statistically significant.
Analysis of variance was used to assess the rela tions between categorical environmental variables (wind direction or wave height) and E. coli concentra
tions in water. For wind direction, data on logjo E. coli concentrations were placed into four groups based on wind direction in degrees clockwise from north (NE, 1-90°; SE, 91-180°; SW, 181-270°; and NW, 271- 360°) (fig. 6). When winds were from the SE at th? time of sample collection, significantly lower mean E. coli concentrations were found than when winds were from the NE or NW. However, no statistically significant differences were found in E. coli concen trations when wind directions were from the SW (when most samples were collected) than when winds were from the other three categories.
Patterns of waves on any body of water exposed to winds generally contain waves of different periods and amplitudes (U.S. Army Corps of Engineers, 1984). These different patterns of waves are known as a wave train. The minimum and maximum wave heights within each wave train were used to categonze wave height into the following categories: (1) a mini mum of 0 to a maximum of 2 ft, (2) a minimum of 1 to a maximum of 3 ft, (3) a minimum of 2 to a maximum of 4 ft, (4) a minimum of 3 to a maximum of 5 ft, and (5) a minimum of 4 to a maximum of 6 ft.
Log^E. coli concentrations were placed into five groups based on wave heights, and an analysis of variance was done to determine the relation between wave height and E. coli concentrations (fig. 7). With the exception of wave-height category 1, median E. coli concentrations for wave height categories exceeded the geometric mean bathing-water standard of 126 col/100 mL. Except for wave height category 5, median E. coli concentrations generally increased vith increasing wave height. Statistically significant differ ences were found among some of the wave-height cat egories. Because categories 4 and 5 had relatively small data sets and were not statistically different, cat egory 5 was combined with category 4. This new wave-height category 4 contained waves with a mini mum height of 3 ft to a maximum height of 6 ft.
The effect of recreational use on E. coli concen trations in water was investigated by collecting mcrn- ing and afternoon samples on 10 days at three Lake Erie beaches. The difference in E. coli concentration found in the afternoon sample (when swimmers were present) and the concentration found in the morning sample (when no swimmers were present) was calcu lated (table 5). On days when few (less than 20) or many (greater than 20) swimmers were present during the afternoon sampling, median E. coli concentrations were higher in the morning than in the afternoon;
Factors affecting Escherichia coli concentrations in water and lake-bottom sediments 21

Table 4. Summary of correlations between Iog 10 Escherichia coli concentrations in water and environmental o r water-quality factors at three Lake Erie beaches, May-September 1997
[NS, is not statistically significant at a = 0.05; all other relations were statistically significant; n is the number of samples]
Suspended_ ...._ sediment Turbidity
concentration
Rainfall 3Weighted
. b Overflow0 rainfall 0
Wind speedWater
temperatureResuspension
indexd
All data
Pearson's r
Spearman's rho
n
.443 NS
.571 .586
121 82
.391
.358
121
.393
.368
121
.385
.447
121
.182
.243
119
NS
NS
116
.599
.540
29
Edgewater Park
Pearson's r
Spearman's rho
n
.392 .175
.427 NS
39 27
.420
.321
39
.552
.516
39
.355
.387
39
NS
NS
39
NS
NS
39
NS
.330
39
Villa Angela
Pearson's r
Spearman's rho
n
.645 .485
.591 .761
41 27
.477
.463
41
.510
.522
41
NS
.314
41
.320
.388
40
NS
NS
39
.421
.433
41
Sims Park- all areas
Pearson's r
Spearman's rho
n
.354 NS
.540 .522
41 28
.576
.697
41
.542
.607
41
.463
.511
41
NS
.341
40
NS
NS
38
.400
.679
41
Sims Park area 1
Pearson's r
Spearman's rho
n
.405 NS
.676 .502
41 27
.646
.656
41
.605
.613
41
.515
.448
41
NS
NS
39
NS
NS
39
.477
.611
40
Sims Park area 2
Pearson's r
Spearman's rho
n
.346 NS
.505 .528
41 27
.601
.607
41
.589
.586
41
.508
.475
41
NS
NS
40
NS
NS
39
.480
.444
40
Sims Park area 3
Pearson's r
Spearman's rho
n
.341 NS
.577 .657
41 28
.529
.708
41
.482
.558
41
.445
.491
41
NS
NS
40
NS
NS
39
NS
.498
40
Sims Park area 4
Pearson's r
Spearman's rho
n
.368 .362
.493 .505
39 25
.489
.545
39
.453
.473
39
.399
.421
39
NS
.389
38
NS
NS
37
NS
NS
38
aRainfall was the amount in inches that occurred in the 24-hour period preceding the 6:30 a.m. sampling.bWeighted rainfall was the amount in inches that occurred in the 72-hour period preceding the 6:30 a.m. sampling, with the most recent rainfall
receiving the highest weight.cOverflow was the amount in million gallons of wastwater-treament overflow that occurred on the previous day.Resuspension index was computed by miltiplying the mean concentration of Escherichia coli in sediment found on the previous diy by the wave
height on the current day.
22 Factors Affecting Escherichia coli Concentrations at Lake Erie Public Beaches

B AB50,000
20,000 wZ 10,000O coP gj 5,000
£d 2,000
0 ^ 1 ,000
O g 5000°
ggj 200
|| 50
£3 onHiO 20 5° 10COLU 5
2
1
j-
1 (1
: ~-
-
-
-
n;--
(6)
'--
\
1:
1
\
*)
(2 ^: ;.
(6^
1)K
[h [
-0) -
--;
-
-
-
.
-
-I 1
-
-
:-
-
EXPLANATION
0 6) Number of observations ^ Outlier data value less than or equal to 3
and more than 1.5 times the interquartilerange outside the quartile
Data value less than or equal to 1.5 times the interquartile range outside the quarti'"*
75th percentileMedian25th percentile
GEOMETRIC-MEAN BATHING-WATER STANDARD 126 colonies per 100 milliliters
NE NW SE
WIND DIRECTION
SW
Figure 6. Escherichia coli concentrations in water by wind direction at Lake Erie beaches, May-September 1997. (Resultr of Tukey's test are presented as letters, and concentrations with at least one letter in common do not differ significantly.)
B BC BC50,000
20,000
^ 10,000
pec 5,000
££J-5 2,000
^d 1,000
QO 500 0°
8£ 20°
11 50
LU o 20
O mCO 1ULU
5
2
1
i i i i
7 (19)1 (36)
r
7
1 (52)
[
-
-
_
I -]
(8)
I
- I[
-
i i i
i
-
-
(6) -
pi _
br
-
-
_;
~
-
1
EXPLANATION
Number of observations Data value less than or equal to 1.5 times the interquartile range outside the quartih
75th percentileMedian25th percentile
GEOMETRIC-MEAN BATHING-WATERSTANDARD 126 colonies per 100 milliliters
0-2 1-3 2-4 3-5 WAVE HEIGHT, IN FEET
4-6
Figure 7. Escherichia coli concentrations in water by wave height at Lake Erie beaches, May-September 1997. (Resuts of Tukey's test are presented as letters, and concentrations with at least one letter in common do not differ significantly.)
Factors affecting Escherichia coli concentrations in water and lake-bottom sediments 23

Table 5. Temporal difference in Escherichia coli concentrations in water and the relation to number of swimmers on 10 selected days, June-September 1997, at three Lake Erie beaches
Few (<20)
Many (>20)
Median
33 -0.176
39 -0.123
Difference*1
Minimum
-0.845
-1.43
Maximum
1.26
1.22
"Swimmers present during afternoon sampling.Difference logio Escherichia coli concentration found in the afternoon sample (when swimmers were present)
and logio Escherichia coli concentration found in the morning sample (when no swimmers were present).
increased recreation was not generally associated with increased E. coli concentrations in the water. A closer examination of the data revealed that on only one day, August 10, E. coli concentrations at Villa Angela and Sims were noticeably higher in the afternoon than in the morning (data not shown). Washed-up debris was reported at Villa Angela and Sims at the time of the afternoon sampling. Samples were not collected on August 10 at Edge water because the beach was closed due to a large public event. Because samples were col lected only during the afternoon on 10 days during 1997, more data are needed to thoroughly determine the effect of recreational use on bacterial water quality.
Prediction of Escherichia coli concentrations from environmental and water-quality variablesEnvironmental and water-quality variables found to be related to E. coli concentrations were used to develop statistical models that may be used to predict E. coli concentrations more quickly and easily than the bacte ria-culture methods currently used.
Prediction of Escherichia coli concentrations from turbidity simple linear regression. Turbidity is an easily measured water-quality characteristic. Tur bidity values can be obtained within 5 minutes, whereas determining E. coli concentrations with cur rent methods takes 24 hours. Simple linear-regression analysis was done to determine the possibility of using turbidity as a predictor of E. coli concentrations at the beaches studied.
The data representing the linear-regression rela tion between E. coli concentrations and turbidity by beach and for all data combined are shown in figure 8. The Iog 10- transformed E. coli concentrations are lin early related to log^- transformed turbidities; how ever, much scatter is present in the relations.
Regression diagnostics were computed and plots of residuals against predicted values were examined for curvature and heteroscedasticity. The analysis did not indicate any problems with the transformation of the variables.
Regression statistics for E. coli concentrations and turbidity are shown in table 6. The standard error of the regression (S) measures the degree of deviation of observed values from the regression line and is an indicator of the level of uncertainty associated with a prediction, expressed as a percentage of the predicted mean. Standard errors ranged from 46.2 percent at Edgewater to 62.7 percent at Sims.
The slope of the regression line is a measure of the rate of change in Iog 10 E. coli with change in log lfj turbidity. Although the slopes were all positive, the magnitude of the slope values were quite different among the four data sets (table 6). For Villa Angela data, the rate of change of E. coli concentration with changes in turbidity was nearly 1.0, whereas for Sims data, the rate of change was considerafry less than 1.0.
The y-intercept is the value for logio & co^ that corresponds to a zero value for logjo turbidity. The y- intercepts from all data sets were positive values, and t-tests on the y-intercepts indicated that they were not significantly different from zero (p<O.C001).
The coefficient of determination (R~) is the frac tion of the variation in logio E. C°H concentrations that can be explained by logio turbidity concentrations. For
>*)
example, an R~ of 0.37 for all data indicates that 37 percent of the variation in the logio E- co^ concen trations can be explained by Iog 10 turbidity (table 6). Different amounts of the variation in E. coli concentra tions at each beach could be explained by turbidity, with Villa Angela having the highest R~ and Edgewa ter having the lowest R~. This variation could be caused by the different physical characteristics of each
24 Factors Affecting Escherichia coli Concentrations at Lake Erie Public Beaches

A. EDGEWATER PARK B. VILLA ANGELA BEACH
ent (r < LU
ii 8sSffiO Q_Sen
. ocO£o pofflLLJ
50,000
10,000
5,000
1,000
500
100
50
10
5
Iog 10 EC = 0.708 + 1.26 (Iog10 NTU)
EC Escherichia coli NTU Turbidity
50,000
10,000
5,000
1,000
500
100
50
10
5
i i i i I i i r
' Iog 10 EC = 1.30 + 1.14 (Iog 10 NTU)
5 10 50 100 500 5 10 50 100 500
C. SIMS PARK D. ALL DATA COMBINED50,000
10,000
5,000co
£cc
ii 1,000O=!
O o GO
Sw3; UJ^Z OCO
0005LU
500
100
50
10
5
1 i ' ] ^ T i i Iog 10 EC = 1.84 + 0.677 (Iog 10 NTU)
5 10 50 100 TURBIDITY, NTU
500
50,000
10,000
5,000
1,000
500
100
50
10
5
Iog 10 EC = 1.35 + 0.933 (Iog10 NTU)
5 10 50 100 500 TURBIDITY, NTU
Figure 8. Regression relations between Escherichia coli concentrations and turbidity at (A) Edgewater Park, (B) Villa Angela, Cleveland, Ohio, and (C) Sims Park, Euclid, Ohio, and (D) for all data combined, 1997.
Factors affecting Escherichia coli concentrations in water and lake-bottom sediments 25

/")
beach. In addition, the low R~ values found for the relations between E. coli concentrations and turbidity indicate that there may be other factors that can help explain the variability in E. coli concentrations.
Prediction of Escherichia coli concentrations from several environmental and water-quality fac tors multiple linear regression. Multiple linear regression (MLR) expands simple linear regression by adding multiple explanatory variables. This allows the model to explain more of the variation in E. coli con centrations, leaving as little variation as possible to unexplained "noise" (Helsel and Hirsch, 1992, p. 295).
Environmental and water-quality variables found in this study to be related to E. coli concentra tions were considered for inclusion in the MLR model. Variables were added to the model in two steps: (1) easy-to-measure variables that are determined rou tinely by local agencies or can be determined without much additional work turbidity, rainfall, weighted rainfall, wastewater-treatment plant overflow, and wave height; and (2) a hard-to-measure variable that is not routinely determined and requires additional time and quality-control checks the resuspension index. Wind speed and direction, water temperature, and number of swimmers were shown to be weakly related or not related to E. coli concentrations and were not considered for inclusion in the model. Suspended-sed iment concentration was not considered for inclusion in the model because it takes longer to determine than turbidity and was found to correlate with turbidity (Pearson's rho=0.425). Different combinations of these variables were used for model development to try to explain the maximum amount of variation in E. coli concentrations. Categorical rainfall variables were
developed and included in MLR models to account for the days when rainfall amounts were zero.
The simple-linear regression model with turbid ity as the independent variable indicated that the
'-)
slopes, y-intercepts, and R~ values differed among the three beaches (table 6). To account for the effects that turbidity has on the E. coli concentrations at the differ ent sites, beach-specific turbidity values were added to the model.
Rainfall was added to the model us-ing four dif ferent types of variables: (1) rainfall, (2) weighted rainfall, (3) categorical rainfall, and (4) categorical weighted rainfall. The rainfall and weighted rainfall were used as continuous variables in the model and are described in a previous section of this report. From the rainfall, a categorical variable was defined (cate gorical rainfall) containing the following groups; RAINCAT1 was antecedent rainfall greater than 0 to less than 0.2 in. and RAINCAT2 was antecedent rain fall greater than or equal to 0.2 in. An implied third group would be antecedent rainfall of zero. From the weighted rainfall, a categorical variable was defined (categorical weighted rainfall) containing the follow ing groups: R4CAT1 was weighted antecedent rainfall greater than 0.0 and less than 0.5 in., R4CAT2 was weighted antecedent rainfall greater than or equal to 0.5 in., and an implied third group of weighted ante cedent rainfall of zero.
Overflow data on metered outfalls were only available for Villa Angela. Wastewater-treatment plant overflows and metered outfalls were combined into a new variable, "overflows and metered outfalls." Because the start times and duration of tf e flows were unavailable, the flow for the entire previous day was
Table 6. Regression statistics for Iog 10 Escherichia coli(E. coli\ concentrations and log^ turbidities
[The standard error of the regression (S) is the degree of uncertainty associated with a prediction of E. coli concentrations from turbidities. The p-value of t-tests on the slopes of the regresssion lines is the probability that the null hypothesis (the slope is equal to zero) is true (cc=0.05). The p-value of t-tests on the y intercepts of the regression lines is the probability that the null hypothesis (the y-intercept is equal to zero) is true (cc=0.05). The coefficient of determination (R") is the fraction of the variation in E. coli concentration that can be explained by turbidity]
Data set
Edgewater Park
Villa Angela
Sims Park
All data
Sample size
39
41
41
121
S (percent)
46.2
52.7
62.7
58.7
Slope
0.708
1.14
.677
.933
p-value for t- tests on slope
0.0063
<.0001
.0006
<.0001
y-intercept
1.26
1.30
1.84
1.35
p-value fort- tests on y intercept
< 0.0001
<.0001
<.0001
<.0001
R2
0.185
.466
.261
.370
26 Factors Affecting Escherichia coli Concentrations at Lake Erie Public Beaches

used as the overflow and metered outfall variable in the MLR analysis.
In the first step of model construction, easy-to- measure variables were entered into the model and regression analysis was done using Mallows' Cp to help determine the best set of explanatory variables. From the 50 models with the lowest Cp, 10 that had the highest R~ values and contained variables that were not colinear were chosen for further analysis. Because there were four related rainfall variables, the regression was done four times with a single but dif ferent rainfall variable each time, using Mallows' Cp to determine which rainfall variable produced the best- fit models. At the conclusion of the first step of the MLR, one model was chosen on the basis of a low
r\
Mallows' Cp, high R~ values, reduced multicolinear- ity, and cost of data collection. This model best repre sented the system and accounted for the most variability in E. coli concentrations. In the second step, resuspension index, the hard-to-measure variable, was added. The resuspension index did not significantly improve the model and was eliminated.
The chosen model contained three explanatc^ variables: weighted categorical rainfall, beach-specific turbidity, and wave height. Also included were y-inter- cept terms to correct for the different magnitudes cf E. coli concentrations among the three beaches. Tl is model explained 58 percent of the variability (R~ = 0.58) in logjo E. coli concentrations. This is an improvement over turbidity as the sole explanatory
^variable, wherein the R" was only 0.37 percent for all beaches combined. Weighted categorical rainfall was used because it produced the lowest Mallows' Cp and highest R2 values among the four different rainfall variables. Overflows and metered outfalls for the 1997 recreational season were not statistically significart and therefore were not included in the model. This variable may be better represented by including time- of-day information, which was not available for this study. The model could also be improved by expand ing the data set to include concentrations of E. coli in treated wastewater-treatment-plant effluents and occurrences of sewage-line breaks.
The equations to predict E. coli concentrations using the chosen model for each beach are as follows: For Edgewater Park,
log 10£C = 0.922 + 0.310(/?4Om) + 0.523(/?4C4r2) + Q.214(WAVEHT)+ 0.16S(AITURB) (1) or
£C = 8.36x2.04*4CAn x3.33*4CA72x l.64WAVEHT x IA1AITURB. (2)
For Villa Angela,Iog 10 EC =1.09 + 0.310(K4CAn ) + 0.523(/?4CA72) + Q.214(WAVEHT) +0.584(A2TURB) (3)
orEC = 12.3 x 2MR4CATl x 3.33*4CA72x \MmvEin x 3.Z4A2TURB . (4)
For Sims Park,log 10£C = 1.83 + 0.310(K4CAn) + 0.523(K4CA72) + 0.214(WAVEHT)+ Q.iii(A3TURB) (5)
orEC = 67.6 x 2.04R4CATl x 3.33*4CA72x 1.64^ "x \.2^TURB . (6)
In all these equations,EC is the Escherichia coli concentration, in colonies per 100 mL,R4CAT1 is 1 if the 3-day weighted antecedent rainfall was greater than 0 in. but less than 0.5 in. and 0 if
the 3-day weighted antecedent rainfall was greater than 0.5 in. R4CAT2 is 0 if the 3-day weighted antecedent rainfall was greater than 0 in. but less than 0.5 in. and 1 if
the 3-day weighted antecedent rainfall was greater than 0.5 in. WAVEHTis assigned a value of 1, 2, 3, or 4 according to the following characteristics:
1 when wave heights within a series vary between a minimum 0 and a maximum of 2 ft.2 when wave heights within a series vary between a minimum 1 and a maximum of 3 ft.3 when wave heights within a series vary between a minimum 2 and a maximum of 4 ft.4 when wave heights within a series vary between a minimum 3 and a maximum of 6 ft.
AITURB is the Iog 10 of the turbidity in NTU's at Edgewater Park. A2TURB is the Iog 10 of the turbidity in NTU's at Villa Angela. AITURB is the Iog 10 of the turbidity in NTU's at Sims Park.
Factors affecting Escherichia coli concentrations in water and lake-bottom sediments 27

Table 7. Prediction of Escherichia coli(E. coli) concentrations using the multiple linear regression model and different combinations of randomly selected explanatory variables
[NTU, Nephelometric Turbidity Unit; mL is milliliters; col/100 mL is colonies per 100 milliliters]
Wave height (feet)
Model-input variables
Weighted categorical rainfall (inches)
Turbidity (NTU)
concentration (col/ 100 ml)
90-percent prediction interval
(col/ 100 ml)
Probability that true concentration is
greater than ?35 col/100 ml
(percent)
Edgewater Park
2-4
0-2
1 -3
>0 to 0.5
>0.5
0
25
10
30
130
68
40
9-1,870
10 - 470
6-260
36
14
6
Sims Park
3-5
1 -3
0-2
2-4
>0 to 0.5
>0 to 0.5
0
>0.5
45
17
5
30
1,500
510
130
1,500
67 -34,000
45-5,800
16-1,100
100-20,000
84
70
33
87
Villa Angela
3-5
1 -3
1-3
>0 to 0.5
>0.5
0
40
10
7
1,600
430
100
52 - 48,000
40 - 4,500
23 - 2,200
82
66
49
The MLR model was used to compute 90-per cent prediction intervals for£. coli concentrations from different combinations of randomly selected explana tory variables (table 7). Ninety-percent prediction intervals were fairly wide because they represent the range of values that the true E. coli concentration is expected to assume 90 percent of the time, given a sin gle instance of predictor-variable attributes. More important for assessing recreational water quality are the probabilities of E. coli concentrations being greater than 235 col/100 mL, the single-sample bathing-water standard. Knowledge of these probabilities may aid the beach manager in deciding when to post a beach by quantifying the level of uncertainty associated with a prediction. For example, at Edgewater, if wave heights are 2-4 ft, weighted categorical rainfall is > 0 to 0.5 in., and turbidity is 25 NTU, the predicted E. coli concen tration is 130 col/100 mL. Although the 90-percent pre diction interval is quite wide, there is a 36 percent chance that the true E. coli concentration exceeds the single-sample bathing-water standard. Conversely, at Sims, if wave heights are 3-5 ft, weighted categorical
rainfall is > 0 to 0.5 in., and turbidity is 45 NTU, the predicted E. coli concentration is 1,500 col/1 OOmL; there is an 84 percent chance that the true E. coli con centration exceeds the single-sample bathing water standard. With experience and a well-tested model, this could be an effective tool to aid beach managers.
Comparison of multiple-linear-regressic n model to current methods for evaluating beach water qualityA commonly used method for determining whether to post a beach is to examine the E. coli concentration determined from samples collected on tH previous day (antecedent E. coli concentration). If antecedent E. coli concentration is greater than the single-sample bathing-water standard (the standard), the beach is posted with a water-quality advisory; if antecedent E. coli concentration is less than the stardard, the beach is not posted. This method of determining cur rent recreational water-quality conditions from ante cedent E. coli concentrations does not take into account changes in water quality that oc~ur between
28 Factors Affecting Escherichia coli Concentrations at Lake Erie Public Beaches

the time of sampling on the previous day and the time sample results are complete.
The accuracy of predicting current recreational water-quality conditions using antecedent E. coli con centrations was examined for Edgewater using data determined by NEORSD during the 1997 recreational season (Eva Roller, Northeast Ohio Regional Sewer District, written commun., 1997). Table 8 shows a classification table that compares the observed beach condition (current) to the predicted beach condition (based on antecedent E. coli concentrations). Using this method, Edgewater Beach would have been cor rectly posted on 5 of the 21 days (24 percent) when the standard was actually exceeded; this is the sensitivity of the prediction. The beach would not have been posted on 63 of the 79 days (80 percent) when the standard was not exceeded; this is the specificity. The false positive rate indicates that on 16 of the 21 days (76 percent) that the model predicted an exceedance of the standard, the observed E. coli concentration did not exceed the standard. The false negative rate indi cates that on 16 of the 79 days (20 percent) the model predicted that the standard was not exceeded; the observed E. coli concentration exceeded the standard. These percentages are summarized in the first column of table 9.
The accuracy of predicting recreational water- quality conditions was determined for all three beaches using the MLR model and USGS-collected
data. Two summaries of classification tables are pre sented in the second and third columns of table 9; (1) the percentages based on all data used to develop the MLR model without removing any portion of tie data set, and (2) the percentages based on the test data set. The test data set was created by splitting the data set into three smaller data sets, ensuring that each smaller set contained a balance of each wave-height category. The MLR model was used on each of the smaller data sets, and the results were combined to form a second classification table. The percentages in these two classification tables were similar, indicating that the model was not biased to a portion of the over all data. This is not a validation of the model, but a test to ensure that one portion of the data does not control the regression. More work needs to be done to validate the MLR, especially during seasons that more typi cally represent meteorological conditions in the area for example, a greater frequency and intensity of summer rains.
An accurate model is one that maximizes sersi- tivity and specificity while minimizing the false po^- tive and negative rates. Table 9 shows that during 1997, the MLR model would have performed as well as, and in some cases better than, the use of antecedent E. coli concentrations (the current method) to predict recreational water quality. The use of the MLR model
Table 8. Classification table for predictions of current recreational water-quality conditions using antecedent Escherichia coli(E. coli) concentrations for Edgewater Park, Cleveland, Ohio, May-September 1997
[Antecendent E. coli concentrations were determined by the Northeast Ohio Regional Sewer District, Cuyahoga Heights, Ohio (Eva Roller, written commun., 1997)]
PredictedTotal
Event8 Noneventb
Event
Nonevent
Total
16
21
16
63
79
21
79
100
Sensitivityc = 24% Specificityd = 80% Correct = 68% False positive6 = 76% False negativef = 20%
aAn event occurs when the E. coli concentration exceeds the single-standard bathing-water standard of 235 colonies per 100 milliliters.A nonevent occurs when the E. coli concentration is less than the single-standard bathing-water standard of 235 colonies per 100 milliliters.
cSensitivity was the proportion of event responses that were predicted correctly as events. dSpecificity was the proportion of nonevent responses that were correctly predicted as nonevents. eThe false positive rate was the proportion of predicted events that were observed as nonevents.The false negative rate was the proportion of predicted nonevents that were observed as events.
Factors affecting Escherichia coli concentrations in water and lake-bottom sediments 29

Table 9. Results of classification tables comparing the proportions of correct and incorrect predicted recreational water-quality conditions using antecedent Escherichia coli concentrations and a multiple-linear-regression (MLR) model for Lake Erie beaches, May-September 1997
[NEORSD is Northeast Ohio Regional Sewer District, Cuyahoga Heights, Ohio (Eva Roller, written commun., 1997); USGS is U.S. Geological Survey]
Predictions based on
Model evaluation
Edgewater Park - NEORSD data (percentage)
All beaches - USGS data (percentage)
Sensitivity11
Specificityc
Correct
False positive*3
False negativee
Antecedent Escherichia coli concentrations
24
80
68
76
20
MLR all data
75
81
85
25
19
MLR
test data3
71
81
76
27
21
aData sets were developed so that data used to develop the multiple linear-regression model were not used to test the model.
Sensitivity was the proportion of event responses that were correctly predicted as events. cSpecificity was the proportion of nonevents responses that were correctly predicted as nonevents.The false positive rate was the proportion of predicted events that were observed as nonevents.
eThe false negative rate was the proportion of predicted nonevents that were observed as events.
improved the sensitivity of the prediction and the per centage of correct predictions over using antecedent E. coli concentrations. The MLR predictions still erred to a similar degree as the current method with regard to false negatives and specificity. A false nega tive would allow swimming when, in fact, the bath ing-water standard was exceeded. Nevertheless, this investigation shows that the use of a MLR model based on water-quality and environmental factors to predict E. coli concentrations is feasible and fairly accurate in its predictive ability.
Future research could focus on improving and validating MLR models to predict recreational water quality. To improve the predictive ability of the MLR models and, in particular, to improve the specificity, studies should focus on adding to the model other envi ronmental and water-quality variables that may affect E. coli concentrations and better represent the variables on a beach-specific basis. Other environmental and water-quality factors that should be investigated or for which additional data are needed include (1) the effect of E. coli in sediments from the nearshore bathing area on the rate of improvement of recreational water qual ity after wet-weather events, (2) recirculation of E. coli from deeper sediments outside the bathing area (to
help explain increases in E. coli concentrations in the absence of rainfall or wastewater-treatma.nt-plant over flows), (3) recreational use, (4) directior of lake cur rents, (5) site-specific rainfall amounts, and (6) time- of-day information on overflows and metered outfalls. To help improve the specificity of MLR models, one may consider the inclusion of variables for concentra tions of E. coli in treated waste water-tre?tment-plant effluents and occurrences of sewage-line breaks. In addition, the use of several rapid methods for determi nation of recreational water quality could be used as additional variables in model refinements or as a sub stitute for current bacterial-culture assays. Possible methods include the use of experimental rapid assay methods for determination of E. coli corcentrations or other fecal indicators and the use of chemical tracers for fecal contamination, such as coprostanol (a degra dation product of cholesterol) or caffeine.
Summary and conclusions
Water-quality advisories and beach closings because of sewage contamination are common at Lake Erie beaches in Ohio and other beaches in th? United
30 Factors Affecting Escherichia coli Concentrations at Lake Erie Public Beaches

States. These advisories are issued on the basis of established state recreational water-quality standards for concentrations of fecal-indicator bacteria, such as Escherichia coli. Little is known, however, about the environmental and water-quality factors that affect concentrations of fecal indicators at beaches. The study described here was done to obtain more infor mation on the effect of these factors so that water- resource managers may be able to assess recreational water quality more quickly and accurately than is pro vided by current bacterial-culture methods.
Data were collected during eight field studies throughout the 1997 recreational season (May through September) at three public bathing beaches in the Cleveland, Ohio, metropolitan area Edgewater Park, Villa Angela, and Sims Park. Water and lake-bottom sediments were collected each morning during a vari ety of environmental conditions during dry, calm weather; before, during, and after rainfall; during increased wave heights; and before and after heavy recreational use. On 10 selected days, water samples were also collected after 1 p.m., when swimmers were present at the beaches. Water samples were analyzed for E. coli, suspended-sediment concentrations, and turbidity. Ancillary environmental data compiled or collected included water temperature, wind speed and direction, number of swimmers, wave heights, vol umes of effluent from wastewater-treatment-plant overflows and metered outfalls, and daily rainfall amounts. Lake-bottom sediment samples were ana lyzed for E. coli concentrations and percent dry weight. A special protocol was tested and developed for removal of E. coli from sediment before determin ing E. coli concentrations. Some sediment samples were also analyzed for total organic carbon and parti cle-size distribution.
Concentrations of E. coli in water and lake-bot tom sediments were lowest at Edgewater Park among the three beaches. Concentrations of E. coli in the four areas of Sims Park were higher and more variable than at either Edgewater Park or Villa Angela. Of the 41 days sampled, concentrations of E. coli in water exceeded the single-sample bathing-water standard of 235 col/100 mL at Edgewater Park on 7 days, at Villa Angela on 17 days, and at Sims Park on 23 to 27 days.
Finer sediments were found at Edgewater than at Villa Angela or Sims; at Edgewater, most of the sed iments were classified as medium to fine sands. The sediments collected at the beaches at Villa Angela and Sims Park varied considerably in particle sizes; most
were classified as medium sands to gravels. Total organic carbon concentrations in sediment ranged from 0.8 to 3.2 mg/kg; however, not enough data w?.re collected to examine total organic carbon concentre - tion as a factor affecting E. coli concentrations in sedi ment.
Plots showing concentrations of E. coli in water and lake-bottom sediments and wave heights, volumes of wastewater-treatment-plant overflows, and rainfall amounts throughout the summer were examined to determine what factors affected E. coli concentrations in water and sediment. Peak E. coli concentrations in water samples occurred either during or immediately following rainfall or wastewater-treatment-plant over flows. Higher concentrations of E. coli in water we~e also found when wave heights were 2-4 ft or greater, although these same periods were usually during or after rainfall. Sediment E. coli concentrations gener ally increased at the same time or after a peak in water E. coli concentrations.
Data collected at the three beaches showed that short-term storage (less than one week) of E. coli ir lake-bottom sediments may have occurred, although there was no direct evidence for long-term storage of E. coli. Unfortunately, the resuspension of E1. coli from lake-bottom sediments by wave actions could not b~. adequately assessed because higher wave heights usu ally occurred during or after a rainfall or wastewater- treatment-plant overflow, and bacterial water quality at Edgewater was usually good during the sampling period.
Correlation analysis was used to measure the relations between E. coli concentrations and other con tinuous variables. Statistically significant correlations were found between E. coli concentrations and turbid ity, rainfall, weighted rainfall, wastewater-treatment- plant overflows, and the resuspension index. Relations between E. coli concentrations and wind speed or water temperature were weak or not statistically sig nificant.
Analysis of variance was used to measure the relations between E. coli concentrations and categori cal variables. Wave height was found to be more use ful in assessing recreational water quality than wind direction or the presence of swimmers. Median E. coli concentrations generally increased with increasing wave height, and statistically significant differences were found among some of the wave-height catego ries. With the exception of wave-height category 1 (minimum of 0 to maximum of 2 ft waves), median
Summary and conclusions 31

E. coli concentrations for wave-height categories exceeded the geometric mean bathing-water standard of 126 col/100 mL.
Because turbidity results can be obtained within 5 minutes, simple linear-regression analysis was done to determine the possibility of using turbidity as a pre dictor of E. coli concentrations at the beaches studied. The regression relation was statistically significant, and the slopes and y-intercepts were significant and reasonable in sign and magnitude. However, small val ues for the coefficient of determinations for the rela tions by beach and for all data combined (R2 = 0.185 to 0.466), indicated that there may be other factors that can help explain the variability in E. coli concentra tions.
Environmental and water-quality variables that were shown to be related to E. coli concentrations were considered for inclusion in a multiple linear regression (MLR) model. One model was chosen that contained easy-to-measure variables, most reasonably represented the system, and accounted for the most variability in E. coli concentrations. This model con tained y-intercept terms to correct for the different magnitudes of E. coli concentrations among the three beaches, weighted categorical rainfall, beach-specific turbidity, and wave height. These explanatory vari ables explained 58 percent of the variability (R2 = 0.58) in E. coli concentrations. The MLR model improved the sensitivity of the prediction and the per centage of correct predictions over using antecedent E. coli concentrations (the current method); however, the MLR predictions still erred to a similar degree as the current method with regard to false negatives and specificity.
Future research could focus on improving and validating MLR models to predict recreational water quality. More work needs to be done to validate the MLR from data collected during other recreational seasons, especially during a season with a greater fre quency and intensity of summer rains. To improve the predictive ability of the MLR models, studies should focus on adding to the model other environmental and water-quality variables that may affect E. coli concen trations and better represent the variables on a beach- specific basis. In addition, experimental rapid biologi cal or chemical methods for determination of recre ational water quality could be used as additional variables in model refinements or as a substitute for current bacterial-culture assays.
References cited
Aldom, J., Jamieson, E., Prout, T., Walsh, M., Van Bakel, D., Griffiths, R., and Palmateer, G., 1998, Rapid fecal coliform and Escherichia coli detection in the recre ational waters of Lake Huron beaches and an inland beach in 1997: London, Ontario, AusableBayfield Conservation Authority, 32 p.
American Public Health Association, American Water Works Association, and Water Pollution Control Fed eration, 1995, Standard methods for the analysis of water and wastewater (19th ed.): Washington, D.C., American Public Health Association [variously paged].
American Society of Agronomy, Inc., and Toil ScienceSociety of America, Inc., 1982, Methcds of soil analy sis, Part 2 Chemical and microbiological properties (2d ed.): Madison, Wis., American Society of Agron omy, Inc., p. 790-791.
Britton, L.J., and Greeson, P.E., eds., 1989, Methods for col lection and analysis of aquatic biological and microbi ological samples: U.S. Geological Survey Techniques of Water-Resources Investigations, book 5, chap. A4, 363 p.
Bromel, M., Saylor, G., Coles, F, Zimmernan, J., and Johnson, K., 1978, Bacteriological analyses of Lake Metigoshe water and sediments: Fargo, N.D., North Dakota State University, Agricultural Experiment Sta tion Bulletin 507, 14 p.
Burton, G.A., Jr., Gunnison, D., and Lanza. G.R., 1987, Survival of pathogenic bacteria in various freshwater sediments: Applied and Environmental Microbiology, v. 53, no. 4, p. 633-638.
Davies, C.M., Long, J.A.H., Donald, M., ard Ashbolt, N.J., 1995, Survival of fecal microorganisms in marine and freshwater sediments: Applied and Environmental Microbiology, v. 61, no. 5, p. 1888-1896.
Dufour, A.P., 1984, Health effects criteria for fresh recre ational waters: Cincinnati, Ohio, U.S. Environmental Protection Agency, EPA-600/1-84-00^, 33 p.
Dutka, B.J., Bell, J.B., and Liu, L.S., 1972, Microbiological examination of offshore Lake Erie sediments: Journal Fisheries Research Board of Canada, v. 31, no. 3, p. 299-308.
Francy, D.S., Hart, T., and Virosteck, C.M., 1996, Effects of receiving-water quality and wastewater treatment on injury, survival, and regrowth of fecal-indicator bacte ria and implications for assessment of recreational water quality: U.S. Geological Survey Water- Resources Investigations Report 96-4199, 42 p.
Gannon, J.J., Busse, M.K., and Schillinger, J.E., 1983, Fecal coliform disappearance in a river impcundment: Water Research, v. 17, no. 11, p. 1595-1601.
Geldreich, E.E., Nash, H.D., Spino, D.F, and Reasoner, D.J.,1980, Bacterial dynamics in a water supply
32 Factors Affecting Escherichia coli Concentrations at Lake Erie Public Beaches

fecal-indicator bacteria and implications for assess ment of recreational water quality: U.S. Geological Survey Water-Resources Investigations Report 96- 4199, 42 p.
Gannon, J.J., Busse, M.K., and Schillinger, I.E., 1983, Fecal coliform disappearance in a river impoundment: Water Research, v. 17, no. 11, p. 1595-1601.
Geldreich, E.E., Nash, H.D., Spino, D.F., and Reasoner, D.J.,1980, Bacterial dynamics in a water supply reservoir A case study: Journal of American Water Works Association, v. 72, p. 31-40.
Gerba, C.P., and McLeod, J.S., 1976, Effect of sediments on the survival of Escherichia coli in marine waters: Applied and Environmental Microbiology, v. 32, no.l, p. 114-120.
Ghiorse, W.C., and Balkwill, D.L., 1983, Enumeration and morphological characterization of bacteria indigenous to subsurface environments: Developments in Indus trial Microbiology, v. 24, p. 213-224.
Goyal, S.M., Gerba, C.P., and Melnick, J.L., 1977, Occur rence and distribution of bacterial indicators and pathogens in canal communities along the Texas coast: Applied and Environmental Microbiology, v. 34, no. 2, p. 139-149.
Grimes, D.J., 1980, Bacteriological water quality effects of hydraulically dredging contaminated upper Mississippi River bottom sediment: Applied and Environmental Microbiology, v. 39, no. 4, p. 782-789.
Guy, H.P., 1969, Laboratory theory and methods for sedi ment analysis: U.S. Geological Survey Techniques of Water-Resources Investigations, book 5, chap. Cl [variously paged].
Helsel, D.R., and Hirsch, R.M., 1992, Statistical methods in water resources: New York, Elsevier Science Publish ing Company [variously paged].
LaLiberte, P., and Grimes, D.J., 1982, Survival of Escheri chia coli in lake bottom sediment: Applied and Envi ronmental Microbiology, v. 43, no. 3, p. 623-628.
Lehman, G.S., and Fogel, M.M., 1976, Investigation of bac teriological pollution of recreational waters in Arizona: Tucson, Ariz., University of Arizona Department of Watershed Management and University of Arizona School of Renewable Natural Resources.
Mallows, C.L., 1973, Some comments on Cp: Technomet- rics, v. 15, p. 661-675.
Marino, R.P. and Gannon, J.J., 1991, Survival of fecal coliforms and fecal streptococci in storm drain sedi ment: Water Research, v. 25, no. 9, p. 1089-1098.
Matson, E.A., Hornor, S.G., and Buck, J.D., 1978, Pollution indicators and other microorganisms in river sediment: Journal of Water Pollution Control Federation, v. 50, p. 13-19.
Myers, D.N., 1992, Distribution and variability of fecal- indicator bacteria in Scioto and Olentangy Rivers in
the Columbus, Ohio, area: U.S. Geological Survey Water-Resources Investigations Report 92-4130, 61 p.
Myers, D.N., and Sylvester, F.D., 1997, National field man ual for the collection of water-quality data Biological indicators: U.S. Geological Survey Techniques of Water-Resources Investigations, book 9, chap. A7, 38 p.
Natural Resources Defense Council, 1996, Testing the waters Volume VI: New York, 116 p.
Ohio Environmental Protection Agency, 1990, Numerical and narrative criteria for recreational use designation?: Ohio Administrative Code, chap. 3745-1, May 1, 1990, p. 07-07 and 07-34.
1992, Ohio water resource inventory: Columbus, Ohio, Division of Water Quality Planning & Assess ment, Ecological Assessment Section, p. 121-122.
Pommepuy, M., Guillaud, J.F., Dupray, E., Derrien, A., Guyader, F.L., and Cornier, M., 1992, Enteric bacteria survival factors: Water Science Technology, v. 25, no. 12, p. 93-103.
SAS Institute, Inc., 1990, SAS/STAT User's guide, version 6, fourth edition, volume 2: Cary, N.C., p. 1071-1126.
Sherer, B.M., Miner, J.R., Moore, J.A., and Buckhouse, J.C., 1988, Resuspending organisms from a rangeland stream bottom: Transactions of the American Society of Agricultural Engineers, v. 31, no. 4, p. 1217-1222.
1992, Indicator bacterial survival in stream sedi ments: Journal of Environmental Quality, v. 21, p. 591-595.
Schertz, T.L., Childress, C, Kelly, V, O'Brien, M., and Pederson, G. 1998, Workbook for preparing a district quality-assurance plan for water-quality activities: U.S. Geological Survey Open-File Report 98-98 [various!" paged].
Shindel, H.L., Mangus, J.P., and Trimble, L.E., 1998, Water resources data, Ohio, water year 1997, Volume 2: Columbus, Ohio, U.S. Geological Survey Water Datr Report OH-97-2, p. 396-411.
Stephenson, G.R. and Rychert, R.C., 1982, Bottom sedi ment A reservoir of Escherichia coli in rangeland streams: Journal of Range Management, v. 35, no. 1, p. 119-123.
Tunnicliff, B., and Brickler, S., 1984, Recreational water quality analyses of the Colorado River corridor in Grand Canyon: Applied and Environmental Microbiol ogy, v. 48, no. 5, p. 909-917.
U.S. Army Corps of Engineers, 1984, Shore protection manual, volume 1: Washington, D.C., p. 3-2.
U.S. Environmental Protection Agency, 1985, Test methods for Escherichia coli and enterococci in water by the membrane-filter procedure: Cincinnati, Ohio, EPA- 600/4-85-076, 24 p.
1986, Test methods for evaluating solidwaste physical/chemical methods, Laboratory Man ual v., section C, SW-846.
References cited 33

APPENDIX A Evaluation of methods for enumeration of fecal-indicator bacteria in lake- bottom sediment
Unlike water samples, standard methods for enumeration of fecal-indicator bacteria in sediment samples are not well established. The American Public Health Association (1995, section 9221 A) recommends the use of most-proba ble number (MPN) methods for solid or semisolid samples instead of membrane-filtration (MF) methods. However, MF methods are more precise than MPN methods and are easier to use on a large-scale study such as this one. In fact, the MF method has been used by several investigators in enumerating fecal-indicator bacteria in sediment (Gannon and others, 1983; Geldreich and others, 1980; Grimes, 1980; Van Donsel and Geldreich, 1971; Davies and others, 1995).
Because sediment can clog the membrane filter and interfere with colony differentiation, the bacteria must be separated from the solid phase before MF analysis. Investi gators have used various methods to detach bacteria from sediments including agitation, surfactant application, soni- cation, and blending. In a study of bottom sediments in the Mississippi River, Grimes (1980) made a sediment/buffer mixture, which was mixed on a platform shaker for 30 min utes and allowed to settle for 1 hour. The resultant liquid phase was then used for MF analysis. In studying bacteria in subsurface sediments, mild surfactants were used to remove cells from sediment particles (Ghiorse and Balkwill, 1983). In a study on the survival of fecal coliforms in marine and freshwater sediments, sonication was shown to be a suitable method for separating bacteria from sediment particles for subsequent MF (Davies and others, 1995). Dutka and others (1972) combined Lake Erie bottom sediments and buffered water in a blender for 1 minute at moderate speed. The blended sample was used to enumerate several different groups of bacteria.
Methods. Several treatments for the separation of fecal-indicator bacteria from Lake Erie bottom sediments were tested to determine whether they were suitable for use in the field studies described in this report. A suitable method is relatively easy to use, has the highest and least variable recoveries of fecal-indicator bacteria from sedi ments among the treatments tested, and does not cause injury to cells. Fecal coliforms were used instead of E. coli because an enhanced-recovery method for injured fecal coliforms was previously tested, and determination of the proportion of injured cells was necessary to adequately evaluate the treatments. Because it was beyond the scope of this project to determine the actual numbers of bacteria sep arated from sediments, relative recoveries of bacteria were determined by enumerating fecal coliforms in the liquid phase after treatment.
Lake Erie bottom sediments were collected using the methods described in this report. Replicate aliquots of sedi ment were diluted in sterile saline buffer and the sediment/ buffer mixtures received one or more of the following treat ments: (1) shaking on a wrist-action shaker with and with out Tween 80 (Sigma, St. Louis, Mo.), a commonly-used surfactant, (2) blending at 8,000 revolutions per minute for 30 seconds, and (3) sonicating at 100 watts for 30 seconds. After treatment, the sediment/buffer mixture was allowed to settle for 30 seconds, and the liquid phase was poured off into a second bottle. The liquid phase was plated by use of the standard mFC agar method for fecal coliforms (Britton and Greeson, 1989) and (or) the enhanced-recovery mFC agar method for recovery of injured fecal coliforms (Francy and others, 1996). In most experiments, each treatment was tested by determining mean (or median) recovery of fecal coliforms in at least three sediment/buffer replicate mix tures.
Results and conclusions. Two replicate jars of lake- bottom sediments were collected from the East Beach at Edgewater Park and composited to qualitatively evaluate the use of surfactants for recovery of fecal coliforms. The addition of two drops of Tween 80 to the sediment/buffer mixture before shaking was not more effective (mean=34 col/100 mL) than shaking alone (mean=33 col/100 mL) in recovery of fecal coliforms from sediment. The addition of five drops of Tween 80 resulted in lower recoveries of fecal coliforms by use of the standard method (mean=15 col/ 100 mL) than by use of the enhanced-recovery method (83 col/100 mL). Because enhanced-recovery methods detect both healthy and injured organisms ard standard methods detect only healthy organisms, the results suggest that Tween 80 added in larger quantities may cause injury or death to cells or otherwise inhibit their growth. Based on these tests, it was decided to not use a surfactant to remove bacteria from lake-bottom sediments during the field stud ies.
The use of blending, sonicating, and shaking was evaluated statistically to determine their relative effective ness in the recovery of fecal coliforms from lake-bottom sediments. In the first experiment, a lake-bottom sediment sample was collected from area 3 at Sims (fig. Al). Repli cate sediment/buffer mixtures were prepared and treated by blending, sonicating, or shaking; concentrations of fecal coliforms were determined by use of both standard and enhanced-recovery methods. Overall, blending of lake-bot tom sediments resulted in the lowest recoveries of fecal coliforms and sonicating resulted in the most variable recoveries. When the standard method was u^ed, analysis of variance indicated that recovery of fecal coliforms by blending was significantly lower (cc=0.05) than recovery by shaking or sonicating sediments. However, when the enhanced-recovery method was used, no statistically signif icant differences in recoveries of fecal coliforms were found between treatments. This suggests that blenc* ; ng may have
34 Factors Affecting Escherichia coli Concentrations at Lake Erie Public Beaches

A. STANDARD METHOD ABB
8 £ 1 ,000<E b:DC =!
o| 800
S LU
0 Si 600Lj_ LU
o 3< 8 400LU ^ LL
200
-
(4)
(4)
(4) ^
Blend Sonicate Shake
TREATMENT
1,200
1,000
800
600
400
200
B. ENHANCED-RECOVERY METHODA A A
(4)
(4)
(4)
Blend Sonicate
TREATMENT
Shake
EXPLANATION
(4) Number of observations
Data value less than or equal to 1.5 times the interquartile range outside the quartile
75th percentileMedian25th percentile
Figure A1. Concentrations of fecal coliforms recovered from Lake Erie bottom sediments collected at Sims Park, Euclid, 01 : o, and determined by use of (A) standard and (B) enhanced-recovery methods. (Results of Tukey's test are presented as letters, and treatments with one letter in common were not significantly different.)
caused injury to cells so that they were able to be cultured by the enhanced-recovery method but not by the standard method.
In the second experiment, sediment/buffer mixtures were treated three ways, and recoveries of fecal coliforms from sediments collected at Edgewater (West Beach and East Beach) and Sims were determined by use of the stan dard method only (fig. A2). The only statistically significant difference found between median recoveries (a=0.05) was between shaking and blending of sediments collected at West Beach. Generally, blending resulted in the recovery of fewer fecal coliforms from sediments than shaking or soni cating. Sonicating resulted in more variable recoveries than shaking; that may be because it was often difficult to main tain a consistent output of sound waves throughout the sam ple. The motion of the water, the physical and magnetic barriers created by the stir bar, and the distribution of sedi ment in the sample affected the conduction of sound waves throughout the sample. Based on the results of these studies, shaking was selected as the treatment method for removal of bacteria from lake-bottom sediments during field studies.
Further work was done to refine the shaking protocol for removal of bacteria from sediment. In a series of experi
ments, concentrations of fecal coliforms were determined in sediments collected at Edgewater, Villa Angela, and Sim- after shake times of 15 or 45 minutes. Shaking for 45 min utes resulted in statistically higher recoveries than shakirs for 15 minutes for most samples (data not shown). Experi ments also were done to determine the effect of decanting or not decanting the liquid phase before plating for fecal coliforms. Using sediments collected at Edgewater, which were considerably finer than sediments from Villa Angela or Sims, not decanting the liquid phase resulted in interfer ence of bacterial growth on culture plates by sediments. Decanting and plating the liquid phase resulted in distinct colonies and enhanced differentiation and enumeration of target colonies. In contrast, using sediments collected at Sims, not decanting resulted in higher recoveries than decanting in one study and no difference in recoveries in another. Based on the results of these experiments, a con"is- tent protocol was established for recovery of E. coll frorr sediments collected from all three beaches for use during field studies. In this protocol, the sediment/buffer mixture was placed on a shaker for 45 minutes and the liquid pha^e was decanted before plating for concentrations of bacteria.
APPENDIX A Evaluation of methods for enumeration of fecal-indicator bacteria in lake-bottom sediment 35

zfO
A. EDGEWATER-EAST BEACH
A A Aouu
700
600
500
400
300
onn
-
-
-
1
(4)
I
3=
|
(4)
T
I
i
i
(4) ;
=c :.
-J
iBlend Sonicate
B. SIMS PARK
Shake
800
700
600
500
400
300
200
5|3E 18,000
0 16,000
8 14,000
g 12,000 u_^ 10,000O^ 8,0000 £ 6,000
4,000
9 nnn
Ai
-
(4)
-
: IT
-
A
(5)
be
A
(4) :-^ :
-_
~
-
i
TREATMENT
C. EDGEWATER-WEST BEACH
A AB B
(4)
(4)
Blend Sonicate
TREATMENT
Shake
EXPLANATION
(16) Number of observations
Data value less than or equal to 1.5 times the interquartile range outside the quartile
75th percentileMedian25th percentile
Figure A2. Concentrations of fecal coliforms obtained by use of the standard method recovered from Lake Erie bottom sediments collected at (A) Edgewater-East Beach, (B) Sims Park, and (C) Edgewater-West Beach. (Results of Tukey'stest are presented as letters, and treatments with one letter in common were not significantly different)
APPENDIX B. Variability of Escherichia coll concentrations in water and sediment
Approximately 14 percent of water and 7 percent of sedi ment samples analyzed for E. coli concentrations in this study were quality-assurance replicates. Replicate samples were collected to gain insight into the variability of E. coli concentrations in water and sediment samples at recre ational beaches, something for which there is little pub lished data. Results from comparison of replicates will aid in the design of future projects and in the interpretation of bacterial water-quality differences in beach-monitoring projects.
Two replicate water or sediment boHes (bottles 1 and 2) were plated for E. coli concentration in duplicate to assess sampling (water samples) or subsampling (sediment samples) and analytical variability. The resultant four repli cate platings were called A (regular sample from bottle 1), B (split regular sample from bottle 1), C (replicate sample from bottle 2), and D (split replicate sample from bottle 2). Within-bottle differences were calculated fir the following replicate pairs: A-B and C-D; between-bottle differences were calculated for these replicate pairs: A-C, A-D, B-C, B-D.
Between-bottle and within-bottle differences in E. coli concentrations for water and sediment samples were determined by using two calculated parameters: (1) the
36 Factors Affecting Escherichia coli Concentrations at Lake Erie Public Beaches

absolute value of the percent difference (PD) of raw data and (2) the absolute value of the Iogj 0 difference (AVLD). The PD was calculated by dividing the concentration differ ence between each replicate pair by the average concentra tion of the same replicate pair and taking the absolute value. To get the AVLD, the concentration data were logjQ trans formed and the absolute value of the difference between each replicate pair was taken. Absolute values were used because the A, B, C, and D designations were randomly assigned, and the amount of difference rather than the direc tion of change was of interest.
The within- and between-bottle PD's and AVLD's for water and sediment samples are shown in figs. B1 and B2. Generally, within-bottle PD's and AVLD's were less than between-bottle values. The PD's and AVLD's were evenly distributed among the range of E. coli concentrations in water; however, for E. coli concentrations greater than 50 col/gdw, the PD's and AVLD's decreased as E. coli concen trations increased.
Summary statistics for PD's and AVLD's are shown in table Bl. Median within- and between-bottle PD's and AVLD's for water samples were lower than for sediment samples. For both water and sediment samples, between- bottle PD's and AVLD's (which include sampling and ana lytical variability) were only slightly higher than within- bottle PD's and AVLD's (which include only analytical variability). When these data were examined by use of t-tests on the ranked data, statistically significant differ ences were found between within-bottle and between-bottle PD's and AVLD's for sediment samples, but not for water samples (cc=0.05). This result indicates that most of the variability in water E. coli concentrations was due to analyt ical variability but that subsampling variability was a signif icant component of the variability in sediment E. coli concentrations. Therefore, in order to obtain the best esti mate of E. coli concentrations in the water, it is more impor tant to plate bottles in replicate than to collect bottles in replicate. For sediment samples, however, replicate subsam- ples and replicate platings should be done.
The 90-percent upper confidence limits for the 95- percent quantile is an important statistic in the design of future beach-monitoring projects. This statistic may be used to interpret differences between E. coli concentrations in two water samples to satisfy project objectives and to deter mine whether the differences are real or due to sampling and analytical variability. For example, the 95-percent quantiles (and 90-percent upper confidence limits) for between-bottle PD's and AVLD's for water samples were 77 percent (79 percent) and 0.35 Iog 10 col/100 mL (0.36 Iogj 0 col/ 100 mL), respectively. This means that if the PD or AVDL between water sample 1 and water sample 2 was equal to or greater than 79 percent or 0.36 Iog10 col/100 mL, one can say with 90 percent confidence that there is only a 5 percent or less chance that the difference between water sample 1 and water sample 2 is due to sampling and analytical vari
ability alone. In this case, one would be able to say with confidence that the concentration found in water sample 1 is different from the concentration found in water sample 2.
The water and sediment data were then grouped by two factors: (1) magnitude of E. coli concentration in repl; - cate A and (2) beach, as shown in table B2. Separate ANOVA and Tukey's tests were done for within-bottle and between-bottle PD's and AVLD's on water and sediment samples to determine the effect of these factors on the PD's and AVLD's. No statistically significant differences were found for data on between- or within-bottle water or sedi ment samples grouped by magnitude of the E. coli concen tration. For data grouped by beach, the only statistically significant difference among beaches was found for sedi ment data, where between-bottle differences were statisti cally lower at Edgewater Park than at Villa Angela or Sirrs Park. This difference suggests that in designing future projects, subsampling protocols may need to be changed TO as to make between-bottle PD's and AVLD's indistinguish able among sites. For example, subsampling protocols may need to be different for sediments collected at Edgewater (fine to medium sand) than for Villa Angela Sims (coarse sand to fine gravel).
In summary, PD's and AVLD's can be used to exam ine quality-assurance data on the variability of E. coli con centrations in water and sediment. The results were the same whether examining the PD or AVLD, and either paramete- may be used in data-analysis procedures or data interpreta tions. The choice of which one to use is based on project objectives and the personal preference of the investigator.
APPENDIX B. Variability of Escherichia coli concentrations in water and sediment 37

A. WATER SAMPLES1 .f
1.2
LU 0 1.0
LUDChe 0.8LL
QI _Z 0.6LU ODC£ 0.4
0.2
0 = =
i | , | . i . , | , | , , | , i i i | , | , . | i i i . | . | . | . . . r
A WITHIN BOTTLE
BETWEEN BOTTLE ~
- A
A
A .
A A ' * ' ' . . A
~ . A
- A : A . . .; A-A A ' A A A A A A A -
A ! .- A ' ' A A A A ^A " * A ^%A A^
A A A A 'A A&. AAA.A * A A "A ~ . /%£» ^^AAA/sj^ '^v\ A A o\
. 1 . i 1 . A i i 1 i 1 . "V^ 1 f^^ ..I i 1 AA i -^N i i i i 1 i |^Jf , , 1 i i i i
1 2 5 10 20 50 100 200 500 1,000 2,000 5,000 10,000
ESCHERICHIA COLI CONCENTRATION, COLONIES PER 100 MILLILITERS
B. SEDIMENT SAMPLES1 .4
1.2
LU0 1.0LUDC LU LL 0.8
Q
Z 0.6LU0DC
% 0.4
0.2
0
_ _
"
: '_ ' A A '_
' .
A - -A A ' A A
^^ A ^^ A *' A £A " '
A "^ "
A A IA: Ayv ?» /\ * » .
A A\ f~~* . . : ,
- ^ A A ^^A : A /?\ A _
, A A A A . , , i 1 T T , A^ ' A >^' ... 1 A | . , '| , . , , I , I , , 1 , , , A
2 5 10 20 50 100 200 500 1,000 2,000 5,000 10,000
ESCHERICHIA COLI CONCENTRATION, COLONIES PER GRAM (DRY WEIGHT) OF SEDIMENT
Figure B1. Percent differences (PD) between quality-control replicate samples for concentrations of Escherichia coli'm (A) water and (B) sediment.
APPENDIX B. Variability of Escherichia coll concentrations in water and sediment 38

A. WATER SAMPLES0.8
LU OzLU DCS o.eLL
LU0.4
0.2
A
A .
A ' "
A : A . . :A : A A A A AA
A WITHIN BOTTLE
BETWEEN BOTTLE
A
5 10 20 50 100 200 500 1,000 2,000 5,000 10,000
ESCHERICHIA COLI CONCENTRATION, COLONIES PER 100 MILLILITERS
B. SEDIMENT SAMPLES
LU
0.8
0.6
0.4
0.2
* A
A -
AA
A
. ^A \ . . i A i . . , A2 5 10 20 50 100 200 500 1,000 2,000 5,000 10,000
ESCHERICHIA COLI CONCENTRATION, COLONIES PER GRAM (DRY WEIGHT) OF SEDIMENT
Figure 62. Absolute value Iog 10 differences (AVLD) between quality-control replicate samples for concentrations of Escherichia coli'm (A) water and (B) sediment.
39 Factors Affecting Escherichia coli Concentrations at Lake Erie Public Beaches

Table B1. Summary statistics for with in-bottle and between-bottle differences of replicate quality-control samples for concentrations of Escherichia coll. (Results of Tu key's test on the ranks are presented as letters, and medians with at least one letter in common do not differ significantly at a = 0.05)
Variability type Number of samples
Mean (standard deviation)
Median Minimum.- . 95-prrcent Maximum .. quaTtile
Percent differences between sample pairs
Water3
Within bottle
Between bottle
81
142
24(21)
29 (26)
17 A
21 A
0
0
100 63
130 77
Sediment5
Within bottle
Between bottle
79
156
24(21)
34(28)
20 A
26 B
0
0
86 67
110 93
Absolute-value Iog10 differences between sample pairs
Water3
Within bottle
Between bottle
81
142
0.11 (.09)
0.13 (.12)
0.07 A
0.09 A
0
0
0.49 0 28
0.65 0 35
Sedimentb
Within bottle
Between bottle
79
156
0.11 (.09)
0.15 (.13)
0.09 A
0.12B
0
0
0.40 0.30
0.56 0.44
aColonies per 100 milliliters. Colonies per gram (dry weight) of sediment.
APPENDIX B. Variability of Escherichia colt concentrations in water and sediment 40

Table B2. Statistical analysis of between-bottle and within-bottle differences of replicate quality-control samples grouped by magnitude of concentration and by beach. (Results of Tukey's test are presented as letters, and differences with at least one letter in common do not differ significantly at a = 0.05)
Sample type Data Set
Median percent differences between sample pairs
Between bottle Within bottle
Median absolute-value Iog10 differences between sample pairs
Between bottle Within bottle
Magnitude of concentration
Water3 <50
50 - 235
>235
Sediment5 <10
10-50
>50
22 A
21 A
17A
29 A
24 A
30 A
16A
16A
22 A
29 A
13 A
16 A
.10A
.09 A
.07 A
.12A
.11 A
.13A
.07 A
.07 A
.09 A
.12A
.06 A
.07 A
Beach
Water3 Edgewater
Villa Angela
Sims
Sediment5 Edgewater
Villa Angela
Sims
ISA
25 A
22 A
ISA
29 B
39 B
ISA
22 A
17A
22 A
10 A
22 A
.08 A
.11 A
.10A
.08 A
.12B
.178
.07 A
.09 A
.08 A
.10A
.05 A
.10A
Colonies per 100 milliliters.bColonies per gram (dry weight) of sediment.
41 Factors Affecting Escherichia coli Concentrations at Lake Erie Public Beaches