factors affecting nest success of colonial nesting
TRANSCRIPT

Louisiana State UniversityLSU Digital Commons
LSU Master's Theses Graduate School
July 2019
Factors affecting nest success of colonial nestingwaterbirds in Southwest LouisianaKaris A. RitenourLouisiana State University and Agricultural and Mechanical College, [email protected]
Follow this and additional works at: https://digitalcommons.lsu.edu/gradschool_theses
Part of the Ecology and Evolutionary Biology Commons, and the Ornithology Commons
This Thesis is brought to you for free and open access by the Graduate School at LSU Digital Commons. It has been accepted for inclusion in LSUMaster's Theses by an authorized graduate school editor of LSU Digital Commons. For more information, please contact [email protected].
Recommended CitationRitenour, Karis A., "Factors affecting nest success of colonial nesting waterbirds in Southwest Louisiana" (2019). LSU Master's Theses.4981.https://digitalcommons.lsu.edu/gradschool_theses/4981

FACTORS AFFECTING NEST SUCCESS OF COLONIAL NESTING
WATERBIRDS IN SOUTHWEST LOUISIANA
A Thesis
Submitted to the Graduate Faculty of the
Louisiana State University and
Agricultural and Mechanical College
in partial fulfillment of the
requirements for the degree of
Master of Science
in
The School of Renewable Natural Resources
by
Karis Amanda Ritenour
B.S., Beloit College, 2011
August 2019

ii
Acknowledgements
Thank you to the Louisiana Department of Wildlife and Fisheries and the Louisiana State
University School of Renewable Resources for the funds that made this project possible.
I would like to thank Dr. Sammy King for his wealth of knowledge and insight as well as his
kindness, compassion, and patience. I would also like to thank my committee members, Dr.
Andy Nyman and Dr. Mike Kaller for their support, especially Dr. Kaller for answering endless
statistical questions. I am grateful for the extensive field assistance and good company of
Samantha Collins, Madie McFarland, Sadie Buller, Whitney Kroschel, Mary Grace Lemon,
Maggie MacPherson, Stephanie Moothart, and Gabe Giffin. Thank you to Ashley Booth and
Lizzi Bonczek for moral support, as well as Emerson Fuller, Jenny Brinkmeier, and Lizzie
Jenkins for helping me stay relatively sane. Sincere thanks to Dr. Liz Smith for her mentorship
and for setting me on a course for LSU. Most importantly, I could not have accomplished any of
this without the tremendous support of my family: Gordon Levine, Andrea Levine, Caitlin Lill,
Gaea Dill-D’Ascoli, Julie Ritenour, Russ Ritenour, and Fitzwilliam. Jason Ritenour, I wish you
were here.

iii
Table of Contents
Acknowledgements ......................................................................................................................... ii
Abstract .......................................................................................................................................... iv
Chapter 1. ........................................................................................................................................ 1 Introduction ................................................................................................................................. 1 Methods ....................................................................................................................................... 7
Results ....................................................................................................................................... 13 Discussion ................................................................................................................................. 37
Chapter 2. ...................................................................................................................................... 45 Methods ..................................................................................................................................... 45 Results and Discussion .............................................................................................................. 46
Appendix A. Rabbit Island Vegetation Data for Chapter 1 .......................................................... 53
Appendix B. Rabbit Island Soil Characteristics Data for Chapter 1 ............................................. 55
References ..................................................................................................................................... 56
Vita ................................................................................................................................................ 62

iv
Abstract
As the coastline of Louisiana shifts with global climate change, subsidence, and accelerated sea
level rise, important breeding islands for colonial nesting waterbirds are disappearing. In many
recent studies flooding has been a leading cause of nest failure for a variety of species, especially
those that nest on the ground. I examined the nest success of four species of colonial nesting
waterbirds with various nesting strategies on Rabbit Island in southwestern Louisiana during
2017 and2018 by determining nest and fledging success. I monitored 855 nests, including 457
Brown Pelicans nests with an estimated hatch probability of 70%, 270 Forster’s Terns with an
estimated 12% hatch likelihood, 92 Tricolored Herons at a hatch success rate of 77%, and 36
Roseate Spoonbills with the highest hatch rate at 70%. My findings indicate that nest strategy
and nest timing have a significant impact on survival rate, however the effect is mediated by
conditions within a specific breeding season. The largest cause of nest failure was flooding for
all species except Tricolored Herons, indicating that the island may currently be too low for
small differences in elevation between nest sites to impact survival. Increasing island elevation
could reduce the probability of nest failure due to overwash, but increased elevation may also
lead to island abandonment or reduced nest success due to increased chance of island
colonization by rank woody vegetation, mammalian predators, and/or fire ants.

1
Chapter 1.
Introduction
Habitat loss is a primary factor for species decline in many habitats globally. This is
especially true in coastal wetlands and island habitats, threatened the world over by accelerated
sea level rise due to global climate change (e.g., Deaton et al. 2017). Researchers often focus on
modeling availability of current and future nesting habitat area (Sims et al. 2013) and analyzing
the success of nesting sites by tracking the number of pairs within the area (Leburg et al. 1995,
Raynor et al. 2013, Yeai et al. 2014, Selman et al. 2016). Less emphasis has thus far been put on
the success of nesting waterbirds, not just their presence or absence. This metric is important to
population growth, especially in Species of Concern, such as Brown Pelicans (Pelecanus
occidentalis), reintroduced to Louisiana in the 1970s and removed from the Federal Endangered
Species List in 2009 (USFWS 2009).
In Louisiana, many waterbirds nest on coastal islands, a habitat quickly disappearing due
to erosion, subsidence, sea level rise, and frequent hurricanes (Visser et al. 2005). Selman et al.
(2016) surveyed Brown Pelican nesting sites on islands in coastal Louisiana and found that the
average island size decreased by 68.6% from 1998 to 2010, with one third of the islands they
surveyed disappearing entirely. Island size and the size of Brown Pelican colonies were
positively correlated, so carrying capacity decreased throughout the study (Selman et al. 2016).
They predicted that Rabbit Island, the only inland island in the study, would be the most crucial
habitat for Brown Pelicans going forward. This inland island was more stable than the barrier
islands, primarily because it was protected from direct wave action in the Gulf of Mexico
(Selman et al. 2016).

2
As islands disappear, subsidence and increased wave action increases overwashing – an
event in which sea water floods at least part of the island. Often overwash occurs during storms
or as a result of wave action and can completely destroy nests or colonies (Visser and Peterson
1994, Leburg et al. 1995). It can also cause prolonged flooding, especially on islands and marsh
habitat. As a result, eggs or chicks can get wet and cold enough that they die, even if the nest
stays intact. Owen and Pierce (2013) found that flooding was a main cause of nest failure for
barrier island nesting Black Skimmers (Rynchops niger), with nest loss ranging from 8% in 2009
to 22% in 2010. Similarly, Brooks et al. (2014), also studying Black Skimmers on small islands,
found that overwash was the most common cause of nest failure (approximately 33% over two
years) and that the chance of nest survival decreased by 33% for each 10-cm gain in estimated
tide height.
One solution to frequent overwash of nesting bird colonies is to use dredge spoil from a
nearby channel to increase the elevation of nest sites on the island (Selman and Davis 2015).
This is a costly and disruptive process, especially for islands that are remote and therefore
difficult and expensive to access with dredging equipment. One estimate from an employee of
the Louisiana Department of Wildlife and Fisheries for Rabbit Island was nearly $30 million just
to get the dredge to the site, before any pumping took place (pers. communication). However,
dredging costs tend to decrease as the volume of the material dredged increases (Turner and
Streever 2002). Because of the high cost of the enterprise and the financial benefits of using
more material, it may seem cost-effective to increase elevation drastically rather than
conservatively. Birds can benefit from increased elevation; Fern et al. (2016) found that there
was a correlation between nest success of Forster’s Terns (Sterna forsteri) and elevation across

3
several small island sites in the Gulf of Mexico. However, none of the islands in their study had
an elevation higher than one meter.
While overwash and subsidence are dangerous to nesting waterbirds, increasing elevation
too much can cause new habitat problems. Periodic flooding can minimize cover of woody,
invasive, and overly thick vegetation, all of which can interfere with nesting. Leberg et al. (1995)
found that the colonial nesting waterbirds that they studied only used dredge spoil islands for
nesting in the first spring following their creation. They hypothesized that thick vegetation at
ground level after the first growing season made the islands less suitable for nesting (Leberg et
al. 1995).
Most woody trees and shrubs decrease nesting area for the majority of colonial nesting
waterbirds; however, mangroves are one exception. Black mangroves (Avicennia germinans)
have had a fairly limited range in Louisiana but they have been expanding northward into
Spartina alterniflora-dominated saltmarsh as winter temperatures rise with climate change (Perry
and Mendelssohn 2009). Walter et al. (2013) found that Brown Pelicans preferentially nested in
mangroves and even marsh elder (Iva frutescens) when they were available on Raccoon and
Wine Islands, both barrier islands in Louisiana. While mangroves reduce or eliminate nesting
habitat for terns and other obligate ground-nesters, they could potentially improve nesting habitat
for some colonial nesting waterbirds. However, habitat that facilitates growth of black mangrove
is also a delicate balance. Guo et al. (2013) showed that mangroves did not do well in low-
elevation marshes due to too frequent flooding, while in high-elevation salt marsh the soil
moisture was too low to promote growth. Mangroves did best at an intermediate elevation, which
Guo defined as the area of the marsh where Batis maritima was the dominant vegetation.
Although they do not specify the exact elevation at which mangroves grew best, they do say that

4
the difference between the low, intermediate, and high marsh can be as little as 2.5 cm (Guo et
al. 2013). Marsh elder requires even higher elevation, high enough to avoid prolonged root
flooding (Miller 2002).
Increasing elevation of dredge spoil islands has led to an increase in mammalian nest
predators (Erwin et al. 2003, Visser et al. 2005). On barrier islands in both Virginia and Alaska,
increases in woody habitat have been linked to expansion of mammalian predators (Erwin et al.
2001, Lantz et al. 2015). Mesopredators are devastating to ground and over-water nesting birds
of many species. They are the leading cause of nest failure in many ground-nesting birds. In a
study by Meckstroth and Miles (2005), 94 out of 102 artificial nests were depredated, most by
striped skunks (Mephitis mephitis). One study showed that as raccoons (Procyon lotor) and
foxes (Vulpes vulpes) expanded onto new barrier islands in Virginia sea bird nesting colonies
decreased in size or disappeared entirely from those islands (Erwin et al. 2001). On an Australian
Pelican (Pelecanus conspicillatus) breeding island in Australia introduced European foxes
decreased both the nest success and the population of breeding birds on the island. Additionally,
in drought years when pelicans were already stressed, foxes caused both larger numbers and a
higher percentage of egg mortalities (Johnston 2016). In addition to direct effects on nest
success, Fontaine and Martin (2006) demonstrated that parents of twelve species of nesting
passerines invested more in their offspring when predation rates were lower. In areas with
decreased predation, eggs were significantly larger, males fed incubating females more often,
and both parents fed nestlings with greater frequency (Fontaine and Martin 2006).
Relatively frequent island flooding may also decrease the ability of invasive fire ants
(Solenopsis invicta) to establish a foothold on colonial nesting islands. Fire ants have been
documented to swarm and kill a variety of chicks in ground nests, as well as causing erratic

5
behavior in incubating adults (Suarez et al. 2005). Even when they do not directly cause chick
deaths, they can cause problems for developing chicks. Plentovich et al. (2009) observed eggs
and chicks predated by ants, as well as chicks with mild to severe injuries from ant bites. They
showed that those with more severe injuries grew significantly slower than those with mild or no
injuries. DeFisher and Bronter (2013) found that Herring Gull chicks in high ant activity areas
did not experience greater predation rates, but did exhibit lower growth rates, which can affect
their survival in both the short and long-term. Multiple studies of terrestrial ant species in
floodplain systems showed that flooding could be catastrophic to the population without
available refugia for the survivors to migrate to and then recolonize from (Adis and Junk 2002,
Ballinger et al 2007). It is possible that periodic complete overwash of these island sites may be
the lynchpin to keeping invasive ant species at bay.
When multiple waterbird species nest within the same area they usually occupy different
ecological niches. One of the most visible methods of niche differentiation is the difference in
vertical stratification among species (Maxwell and Kale 1977). While Brown Pelicans are known
to seek out and nest in woody vegetation at some sites, the number of nests on the ground and in
grasses increases when there is no woody vegetation available (Walter et al. 2013). While Brown
Pelicans build their nests up when they are on the ground, Forster’s Terns tend to barely
construct nests at all. They are commonly found on muskrat mounds and dead vegetation mats,
either floating or on land (Bergman et al. 1970, Storey 1987). Tricolored Herons (Egretta
tricolor) and Roseate Spoonbills (Platalea ajaja) may nest alongside Brown Pelicans and
Forster’s Terns but they build nesting platforms off the ground in vegetation (Strong et al. 1997,
Lorenz et al. 2009). These differences in nesting strategy along with other factors such as
elevation at the nest site can affect the likelihood of nest flooding, predation, and overwash.

6
The ideal elevation for a thriving population of colonial nesting waterbirds is a balance of
trade-offs. Waterbirds are fairly long-lived group, with maximum lifespans recorded from fifteen
years (Forster’s Terns, Roseate Spoonbills) to over 40 years (Brown Pelicans) (Simons and
O’Connor 2012, Lutmerding and Love 2015). It is not necessary for every pair to reproduce
successfully every year to maintain and even increase their population levels. However, merely
providing more island habitat, or even ensuring that a variety of colonial nesting waterbirds are
present and/or nesting on an island is not enough to ensure that the population is sustainable. An
island can appear to be a thriving colony over several years, but all eggs or chicks could fail to
reach fledging age due either to regular flooding events or to high levels of predation, the two
most common causes of death in previous studies of nesting success (Raynor et al. 2012, Owen
and Pierce 2013).
I investigated nesting success of several species of colonial nesting waterbirds on an
inland coastal marsh island in southwestern Louisiana that is subject to flooding events. Rabbit
Island is the only Brown Pelican nesting island in southwestern Louisiana and, while it is
sheltered from the wave action barrier islands are subjected to, it decreased in land area
approximately 6.5% from 1998 to 2010, compared for around 68% for islands in Louisiana’s
coast during the same time period (Selman et al. 2016). Due to its relative isolation and shelter
from the Gulf of Mexico, Rabbit Island was the site used for translocation of 182 oil-
rehabilitated Brown Pelicans after the 2010 Deepwater Horizon Oil Spill so that they would not
re-enter the oil (Selman et al. 2012). It is slated for dredge spoil restoration to increase the
elevation and reduce land loss. Little quantitative data exists on actual nesting success but based
on casual observations of previous overwash events, it is speculated that flood events are
preventing nest success of several colonial waterbird species. Thus, the island was targeted for a

7
restoration project designed to increase island elevation. Due to high rates of subsidence and
relative sea level rise in the area (Visser et al 2005) and to the tremendous cost of dredge spoil
restoration, increasing the island the maximum amount that would allow for successful colonial
waterbird nesting without invasion by predators and fire ants would be advantageous.
The objectives of my study were to 1) determine hatch and chick success for several
breeding waterbirds; 2) determine the effects of elevation on nest success of several waterbird
species with a variety of nesting strategies; 3) compare predator presence on Rabbit Island to the
surrounding dredge spoil islands, and 4) determine the frequency of overwash events based on
long-term hydrologic records from the nearest tidal gauge.
I expected that elevation would drive nest success, especially for ground-nesting birds
such as Forster’s Terns and Brown Pelicans. I predicted that flooding and overwash would be the
largest cause of nest failure, but that the species that nest on elevated platforms (i.e., Roseate
Spoonbills and Tricolored Herons) would not be as impacted by it as the ground-nesting species.
I expected the nearby dredge spoil islands to contain a greater number and diversity of mammals
than Rabbit Island.
Methods
Study Area
My study site is Rabbit Island in Cameron Parish, Louisiana. It is located within
Calcasieu Lake, sheltered from the Gulf of Mexico but still saline because the Calcasieu Ship
Channel cuts from the Gulf northward through the middle of the lake allowing saltwater
intrusion. The island is primarily tidal marsh habitat, the dominant plant species include Spartina
alterniflora, S. patens, Juncus roemerianus, and Distichlis spicata. Island elevation ranges from

8
about 0.3-0.5 m above mean sea level, including both ephemeral and permanent ponds used by
foraging birds. Due to the unique marsh hydrology and permeable substrate on this island,
flooding can occur and persist even without strong storm events. It is a breeding location for at
least 20 species of waterbirds, including 1500 breeding pairs of Brown Pelicans as of 2011
(Selman et al. 2016) and 12 other Species of Conservation Concern designated by the Louisiana
Wildlife Action Plan (Holcomb et al. 2015). There are no known records of mammalian
predators, alligators, or invasive fire ants on this island within the last decade. I observed this
island in the breeding season (February-June) in both 2017 and 2018.
Hydrology
To determine the effects of flooding on nests, I established two HOBO U20 Water Level
Loggers in monitoring wells (WRAP 2000) at sites within highly populated nesting areas in the
first breeding season and at least 3 m from the shore (2017). These were deployed in August
2017, outside of breeding season so as not to disturb nesting. Data were retrieved from the water
level recorders 5 times throughout 2018, approximately every 2-3 months.
In order to measure the similarity between my water loggers and the nearby long-term
water monitoring systems, I obtained the data from both the nearest NOAA station (CAPL1,
located at 29.768 N 93.343 W) and the nearest CRMS station (CRMS0685-H01, located at 29.89
N 93.39 W). I ran a cross-correlation between one of my water loggers and the mean high high
water level from the NOAA gauge as well as to the adjusted water level to marsh from the
CRMS station using Program R, vers. 3.5.1 (base package; R Core Team 2019). I determined
the critical water depth at which major overwash/flooding events occurred in 2017 and 2018
using both the NOAA and CRMS station. I then used past data from each station to determine
the probability of this water level being exceeded for each day during the nesting season.

9
Nest Monitoring
Once nesting began, I systematically established 1-m wide transects within colonies,
spaced at least 2m apart from each other. In the case of very small/compact colonies I marked
every nest. New nests and transects were added opportunistically throughout the breeding season
as the colonies expanded and new colonies formed. I counted new nesting efforts on old nests or
nest platforms as renests, although it was impossible to know whether the new eggs were laid by
the same parents as the original nest. Each nest was monitored on average between 6.1 and 7.4
days apart (Table 1), with variation depending on the weather, to limit researcher disturbance as
much as possible. Observations ended when nests were no longer active.
Table 1. Distribution of observations throughout nesting seasons for each species by year.
2017
# of
Observations
First
Observation
Last
Observation
# Days in
Nesting
Season
Average # of
Days Between
Observations
Brown Pelican 20 2/24/2017 6/25/2017 121 6.1
Forster's Tern 11 4/16/2017 6/25/2017 70 6.4
Roseate Spoonbill 9 4/27/2017 6/25/2017 59 6.6
Tricolored Heron 15 3/26/2017 6/25/2017 91 6.1
2018
Brown Pelican 15 3/7/2018 6/26/2018 111 7.4
Forster's Tern 8 5/8/2018 6/26/2018 49 6.1
Roseate Spoonbill 8 4/18/2018 6/12/2018 55 6.9
Tricolored Heron 9 4/18/2018 6/21/2018 64 7.1
At each nest, I counted the number of eggs and/or chicks and made note of anything
unusual, e.g. dead chicks in or around the nest, eggs or shell fragments outside the nest bowl. I
also made note of any eggs pipping or in the process of hatching.
I analyzed both hatch success and chick success. Hatch success required a sighting of at
least one chick at the nest. I recorded chick success instead of fledging success, because

10
waterbird chicks leave the nest before they are capable of flight. Chick success is defined in this
study as at least one chick surviving past the nestling stage as defined in the literature; Brown
Pelicans, 28 to 35 days (Blus and Keahey, 1978); Tricolored Herons (Frederick et al. 1992) and
Roseate Spoonbills (White 1982), 14 days. Forster’s Tern chicks are more mobile and able to
leave the nest within a couple of days after hatch however, chick success does not occur until 15
days (Cuthbert and Louis 1993). I thoroughly searched each Forster’s Tern nest site for nearby
chicks but unless they were large enough to hold a leg band it became impossible to link a chick
to one specific nest.
In some nests, at least one chick hatched but reached the end of their nestling phase
between observations. Unless these chicks were seen at the next observation date or definitive
proof of nest failure was found, the fate of these nests was recorded as “unknown”. In 2017,
researchers observed multiple injuries to Brown Pelican chicks, usually inflicted by an adult on a
chick, when large groups of mobile chicks fled as the researchers approached. To avoid this
obvious detrimental disturbance in 2018, once the majority of chicks within Brown Pelican
transects reached the end of their nestling phase and became large and mobile, researchers
discontinued monitoring of that transect. I banded as many chicks as possible and monitored
chicks with bands from outside the transect using binoculars. Chicks within those transects that
had not reached the end of nestling phase were marked as unknown outcome.
Finally, failed nests fell into several categories. Whenever nests failed, I attempted to
determine the cause of failure. “Overwashed” failed nests included any nest that was completely
washed away, destroyed, or contained standing water. Also included in this category was any
nest during or after a significant overwash or storm event in which all chicks were dead in or
around the nest. I recorded nests as failed: abandoned if the nest was intact and either: 1) eggs

11
were cold or showed signs of not having been turned for an extended period of time (e.g. eggs
sunk into the nest, a distinctive line between the dirty side of the egg (down) and the clean side
(up), and especially if the eggs were cold and damp) or 2) eggs or chicks present at last
observation were not present and the nest was noticeably unkempt. If eggs remained in the nest
more than one observation past their expected hatch date, or if a nest that previously contained
eggs was found intact and well-kept but empty with no sign of eggshells or hatched chicks in the
area, it was designated “failed: never hatched”. All nests that clearly failed without enough
evidence to fit into any of the above categories, those that went missing completely, or those that
contained dead chicks or broken eggs fell into the general “fail” category.
I measured the ground elevation at each nest site using a Trimble Geo 7 X GPS. The
majority of elevation measurements were accurate within 3 cm; any nests that had elevations
with accuracy estimates > 5 cm were discarded. Additionally, I measured the height of each nest
to the top of the construction with a meter stick, with the exception of Forster’s Terns because
their nests were essentially flat. I visually estimated percent vegetation composition and
aggregated it across each transect (Appendix A). Outside of breeding season in December 2018 I
collected soil samples from several Brown Pelican and Forster’s Tern transects, as well as the
dredge spoil island. Using classification by feel and loss on ignition methods recommended by
Hoogsteen et al. (2015), I compared the soil composition as well as organic content (Appendix
B).
Both hatch and chick success were calculated separately using the daily nest survival
model (Dinsmore et al. 2002) to estimate daily survival rates and to fit 8 candidate models: a null
model and all combinations of start date, elevation, and year. I determined parameter estimates

12
for the best supported model for each species (PROGRAM MARK 9.0 packages RMark (Laake
2013) and MuMIn (Barton 2018), Program R, vers. 3.5.1 (R Core Team 2019)).
I used the age categories put forth by Walter et al. (2013) to look at the maximum age of
chicks from each successful Brown Pelican nests. Chicks were categorized based on their age in
weeks as follows: 1) 0 to 1.5, 2) 1.5 to 3, 3) 3 to 4.5, 4) 4.5 to 6, 5) 6 to 7.5, and 6) 7.5 to 9. I
counted sightings of chicks in and around nests, as well as sightings of a few banded chicks once
they left the nest each year.
Predator and Fire Ant Sampling
To determine the presence of mammalian predators, I set up track plates (Erwin et al.
2001, Raynor et al. 2012) at locations near former colonies on Rabbit Island after breeding
season, as well as, on the nearest dredge spoil island, approximately 2,380 m away. This island,
which supports no nesting waterbirds, is between 1.44 and 2.12 m in elevation, nearly ten times
the average elevation of nest sites at Rabbit Island. It is covered in dense, woody vegetation, and
showed some signs of mammalian habitation before track plates were deployed. Track plates
consisted of smooth patches of sand mixed with mineral oil and were baited with cat food
(Raynor et al. 2012, Erwin et al. 2001). I set up three plots at random points on each island for
four observation nights. I checked every plot each morning for three mornings consecutively in
August 2017, so as not to disturb or lure predators to active nests. All sign of animal use was
documented and then raked clean. In addition, at least one site on each island was equipped with
a field camera (Bushnell TrophyCam), and all areas were searched for sign or scat of mammalian
predators before the sites were set up.

13
I also set traps for fire ants according to the methods laid out by Seymour (2007), using
scintillation vials filled with hot dog. One vial was placed near an active transect during breeding
season and left out for at least one hour. I repeated this experiment seven times in 2017.
Results
Hydrology
I compared the water level data from my wells with the water levels at the nearest NOAA
station (CAPL1) and the nearest CRMS station (CRMS0685-H01) using cross-correlation.
Although the CRMS station is 4.6 km away from the center of Rabbit Island and the NOAA
station is 9.7 km away, both showed a lag of approximately +12 hours compared to the water
level recorder on Rabbit Island. In a simple correlation, the Rabbit Island sensor and the CRMS
station were more correlated (r=0.44) than Rabbit Island was with the NOAA station (r=0.25). I
used the CRMS station for historical data and as a proxy for the Rabbit Island sensors when they
failed.
In addition to failing to record the entire field season, the Rabbit Island sensor well data
combined with the elevation data gathered at each nest indicated that the island should have been
constantly flooded, which of course was not borne out during observations. I determined that
there had been a mechanical error in the measurement or human error in the conversion
measurements of the water level recorder data, and the data could not be used.
During breeding season in 2017, Rabbit Island experienced several storm events spread
throughout the season that caused widespread overwash and generally wetter conditions, while
2018 was characterized by fewer and less severe storm and overwash events and drier overall
conditions (Fig. 1). Almost all major flooding events causing failure of nests in both years

14
occurred when hourly mean high-water depths recorded at the nearby CRMS station were
approximately 0.4 m and were almost always associated with storms.
The exception was the overwash event on April 14, 2018. The highest water level
recorded during this event was 0.32. On April 3, 2018 water levels reached 0.37 m without
overwashing any nests, even though all nests destroyed in April 14 had already been initiated.
The CRMS station is located within the marsh nearly 5 km northwest of Rabbit Island. The
topography of Southwestern Louisiana, flat and low with low-lying marshes and several shipping
channels hydrologically connecting multiple inland lakes, including Lake Calcasieu, particularly
lends itself to wind-driven waves and changes in water level (Dietrich et al. 2010). It is possible
that on April 3, 2018 strong winds - up to 25 knots - from the south (data recorded at NOAA
CAPL1) could cause water to stack at the CRMS station but not on the Island, causing the water
level to be higher at the CRMS station than it actually was on Rabbit Island. Similarly, much of
the day on April 14, 2018 the wind was strongly from the north, which could cause water to be
pushed out of the marsh, decreasing the water level at the CRMS station so that it does not
compare accurately to Rabbit Island (Dietrich et al. 2010).
During the morning of April 14, 2018, there was an abrupt increase in windspeed and
change in wind direction. Between 9:18 am and 10:36 am the wind direction suddenly shifted
from S or SW to due N. During this time the wind gusts increased from 12.5 knots to 40.4 knots
within 20 minutes. The speed quickly decreased but the direction stayed from the north for the
rest of the day. This pattern of wind activity was markedly different from the pattern both on
April 3, 2014 as well as other overwash days. It was the highest windspeed during the nesting
season of 2018. In a wind-driven system, it is possible that this strong gust and abrupt directional
change caused rogue wave action at Rabbit Island that would be strong enough to overwash nests

15
but would not be picked up at the CRMS station a few kilometers away. Dietrich et al. (2010)
demonstrated that wind speeds of 15 m s-1 or approximately 29 knots coming from the north
pushed water out of Lake Calcasieu through its myriad hydrologic connections and decreased the
water level within the lake. Throughout the rest of the study the flood threshold of 0.4 m is
supported.
Figure 1. Water depth from CRMS0685-H01 throughout breeding seasons in 2017 and 2018.
Black arrows indicate major flooding events in 2017, grey arrows indicate major flooding in
2018.
In 2017, major overwash/flood events occurred on April 2 (highest level 0.47 m), April
29 (max level 0.55), and June 22 (0.8 m). In 2018 one such event occurred on April 14 (0.32 m)
and a second on June 18 (0.5 m). The highest water levels in each year occurred during the
events in June. The highest water level recorded by the CRMS station in 2017 was 0.8 m during
Tropical Storm Cindy (June 21-24). In 2018, there were no named storms during breeding
-0.5
-0.4
-0.3
-0.2
-0.1
0
0.1
0.2
0.3
0.4
0.5
0.6
0.7
0.8
0.9
3/1 3/8 3/15 3/22 3/29 4/5 4/12 4/19 4/26 5/3 5/10 5/17 5/24 5/31 6/7 6/14 6/21 6/28
Ad
just
ed W
ater
Ele
vati
on
to
Mar
sh (
m)
CRMS 2017 CRMS 2018

16
season. The highest water level recorded at the CRMS station in 2018 was 0.5 m during the
storm on June 18.
Extrapolating that flooding events on Rabbit Island were associated with water levels of
at least 0.4 m, I examined CRMS station hourly adjusted water level to marsh elevation data
from the past 12 years. I grouped the hourly observations by day to identify the number of days
in each breeding season where the water level exceeded 0.4 at least once (Fig. 2). There were no
hourly observations of 0.4 m or greater from 2006 through 2011 or in 2013 or 2014. There were
less than 10 days of flooding per year every year except for 2016. In 2016 there was a massive
increase, from 2 days (2% of the breeding season) in 2015 to 16 (13% of the breeding season) in
2016. In 2017 there were 6 days on which overwash occurred (5% of the breeding season).
Figure 2. Number of days in the breeding season with at least one hourly water level recorded
above 0.4 m. Labels indicate the percentage of overwash days during each year.
From 2006-2018, there were 271 hourly records of water level above 0.4 m during
breeding season, 29 individual overwash events. Eleven (38%) overwash days occurred in April,
0% 0% 0% 0% 0% 0%
2%
0% 0%
2%
13%
5%
2%
0
2
4
6
8
10
12
14
16
18
2006 2007 2008 2009 2010 2011 2012 2013 2014 2015 2016 2017 2018
Day
s D
uri
ng
Bre
edin
g Se
aso
n

17
followed by 7 (24%) in June. Five (17%) and 6 (21%) of flood days occurred in March and May,
respectively (Fig. 3).
Figure 3. Number of daily observations above 0.4 m from CRMS station between 2006-2018 by
month of the breeding season. Data labels indicate the percent of total overwash days across all
years that occurred in each month.
Nest Timing
Brown Pelicans nested first in each season, with nests first sighted on February 24 in
2017 and March 7 in 2018 (Fig. 4). New pelican nests were initiated throughout the field season,
some as late as May 7 in 2018 and May 25 in 2017. I first observed Tricolored Heron nests on
March 26 in 2017 and April 18 in 2018. With the exception of three re-nests, I did not find any
new heron nests after April 12 in 2017. Nest initiation after April 27 was rare in 2018. I only
found 5 new nests in May. I first found Roseate Spoonbill nests on April 27 in 2017 and April 18
in 2018. In 2017 I continued to find new spoonbill nests until June 18, while in 2018 I found no
new nests after April 27. The first Forster’s Tern nests were found on April 16 in 2017, while
they did not begin nesting until May 8 in 2018. They continued to initiate new nests until the
17%
38%
21%
24%
0
2
4
6
8
10
12
March April May June
Day
s D
uri
ng
Bre
edin
g Se
aso
n

18
large overwash events in June each year, after which the adult terns also disappeared from Rabbit
Island.
Figure 4. Number of active nests of each species by date in 2017 (top panel) and 2018 (bottom
panel) at Rabbit Island in Louisiana. Solid vertical lines indicate major flooding events. BRPE =
Brown Pelican, TRHE = Tricolored Heron, FOTE = Forster’s Tern, ROSP = Roseate Spoonbill.
0
25
50
75
100
125
150
BRPE TRHE FOTE ROSP
0
25
50
75
100
125
150
BRPE TRHE FOTE ROSP

19
Summary Nesting Data
The number of nests of each species observed was approximately the same between 2017
and 2018 (Table 2). In 2017, out of 263 nests, Brown Pelicans laid 751 eggs, averaging 2.9 eggs
per nest. Approximately 40% of nests successfully hatched at least one egg, averaging about 2.3
chick per nest. In 2018, Brown Pelicans laid 562 eggs distributed across 194 nests, averaging 2.9
eggs per nest again. Apparent hatch success was 43% in 2018 and pelicans averaged 2 chicks per
nest.
Table 2. Summary data for each species by year. Nest and hatch success are apparent, standard
deviations in parentheses. . BRPE = Brown Pelican, FOTE = Forster’s Tern, ROSP = Roseate
Spoonbill.
# of
nests
# of
eggs
# of
chicks
# of
nests
with
eggs
# of
nests
with
chicks
%
Hatch
Success
% Chick
Success
Mean
Eggs per
nest
Mean
Chicks
per nest
2017
BRPE 263 751 247 261 108 41% 16% 2.9 (0.45) 2.3 (1.25)
TRHE 46 151 106 46 37 80% 15% 3.3 (0.72) 2.9 (1.38)
FOTE 149 321 48 149 35 23% 0% 2.2 (0.74) 1.4 (0.72)
ROSP 22 40 28 21 13 62% 27% 1.9 (1.21) 2.2 (1.19)
2018
BRPE 194 562 164 194 84 43% 12% 2.9 (0.38) 2.0 (1.09)
TRHE 46 140 67 46 31 67% 17% 3.0 (0.63) 2.2 (1.18)
FOTE 121 291 45 121 34 28% 2% 2.4 (0.7) 1.3 (0.68)
ROSP 14 55 44 14 14 100% 50% 3.9 (0.62) 3.1 (1.19)
I surveyed 46 Tricolored Heron nests in 2017 and 2018. In 2017 herons laid 151 eggs,
averaging over 3.3 eggs per nest, 80% of which successfully hatched. Tricolored Herons in 2018
also averaged about 3 eggs per nest, 140 eggs in all. However, they only averaged 2.2 chicks per
nest, at a hatch rate of 67%.

20
Each year, Forster’s Terns had the smallest average number of chicks, less than 1.5
chicks per nest. Though they laid 321 eggs across 149 nests in 2017 and 291 eggs across 121
nests in 2018, averaging 2.2 to 2.4 eggs per nest, less than 30% of those nests hatched chicks
each year.
Roseate Spoonbills were the least common species of the four, resulting in only 22 nests
in 2017 and 14 in 2018. In 2017, spoonbill nests were only loosely associated, not arranged in
tight groups that enabled easy transects like the other species (Fig. 5). They were also the only
species for which some nests that were found after hatch were included in the study. In 2017
only 11 of the 21 nests contained eggs during the observation period, the rest having already
started the nestling phase. These nests did not contribute to the number of eggs per nest because
there was no way to know how many eggs they had originally contained. Roseate Spoonbills laid
40 eggs in 2017, 1.9 per nest, on average. In 2018 with fewer total nests they laid 55 eggs,
averaging nearly 4 eggs per nest. Their hatch rates were about 62% in 2017 and 100% in 2018,
yielding 2.2 and 3.1 chicks per nest, respectively.
No species nested in the same location in 2018 as they did in 2017 (Fig. 5). At no time in
either nesting season were any of this studies’ focal species seen utilizing the west side of Rabbit
Island. There appeared to be at least some Tricolored Heron and Roseate Spoonbill nests located
in the central part of the island but it was not possible to survey those nests on foot or by
motorized boat.

21
Figure 5. All nest points by species and year at Rabbit Island, Louisiana. All species nested in
different areas in 2018 than they did in 2017. BRPE = Brown Pelican, TRHE = Tricolored
Heron, FOTE = Forster’s Tern, ROSP = Roseate Spoonbill.

22
All species nested at slightly higher elevations in 2018 than in 2017, though most within
one standard deviation of their average elevation in 2017 (Fig. 6). In 2017, Forester’s Terns
nested at the lowest elevation (-20.3 cm), but in 2018, Forester’s terns nested at the highest
elevation (76 cm). However, it is worth noting that some of these nests were built on debris
floating on the surface of the water. Elevation was taken at ground level below the water, and so
some of these nests, as well as those located in particularly low areas on land, were actually
below sea level. These below sea-level nests brought down the average elevation significantly in
2017. I did not observe any floating nests or nests located below sea level in 2018. Average nest
height was 24.8 cm for Brown Pelicans, 31.7 cm for Roseate Spoonbills, and 43.9 cm for
Tricolored Herons.
Figure 6. Average ground elevation at nest sites for each species by year. Error bars are standard
deviation, labels are sample size (n).
Banded Pelican Sighting
Throughout the course of the 2017 field season I observed a Brown Pelican with a pink
auxiliary color band with the alphanumeric code “C48” several times (Fig. 7). I reported these
126 35 120 11183 40 116 140
5
10
15
20
25
30
35
40
Pelican Tricolor Forster's Roseate
Elev
atio
n (
cm)
2017 2018

23
sightings to the Bird Banding Laboratory. This individual was one of the 182 oil-rehabilitated
pelicans translocated to Rabbit Island after the 2010 Horizon oil spill (Selman et al. 2012).
Although this bird’s nest was not located on one of my transects, I did confirm several sightings
of this bird actively nesting, including the below photo of the bird with at least one successfully
hatched chick. This may be the first confirmation of a rehabilitated oiled pelican successfully
nesting at least 7 years after being contaminated.
Figure 7. Photograph of Brown Pelican C48 with at least one egg and one live chick in its nest.
Photo courtesy of Maggie MacPherson 2017.
Causes of Nest Failure
In both years, Brown Pelicans were impacted by overwash events early in the season that
other species avoided by beginning their nesting later. In 2017, the overwash event on April 3

24
destroyed 21% of all the nests I observed in that year (n = 55). Another 37 nests (14%) were
destroyed on April 30 (Fig. 8). The direct effects of the April 14 overwash event in 2018 was
smaller, only 4% (n = 8) of total nests were destroyed, although an additional 32 nests (16%)
were abandoned or otherwise failed before the next observation day (April 18).
However, the majority of Brown Pelican nests were complete or chicks were old enough
to survive the largest overwash events in June of each year. In 2017, Tropical Storm Cindy (June
22) destroyed 31 nests (12%). Twenty-one Brown Pelican nests (11%) were lost in the overwash
event on June 18, 2018.
Forster’s Terns were completely overwashed during the large flood events in June of
each year. Only one colony had been initiated by the April 30 flood in 2017, but all 24 nests in
that colony were destroyed. In addition to the large overwash events, specific colonies of
Forster’s Terns nesting on washed up vegetation (rack) were sometimes flooded or overwashed
by small local increases in water level that did not affect the island as a whole. Forster’s Terns
failed due to overwash/flooding more than any other species (65%, 174 of 267 failed nests).
After the large storms in June of each year all adult Forster’s Terns deserted Rabbit Island. For
all other species, both adults and young of the year that were old enough to survive the storm,
left the nest, or fledged stayed on the island and in the area. I never saw any fledged juvenile
Forster’s Tern at Rabbit Island either year, suggesting that even the few nests that chicks
managed to leave did not result in any new recruits.

25
Figure 8. Number of nests of each species destroyed in each of the major flood events in 2017
(upper panel) and 2018 (lower panel) at Rabbit Island, Louisiana. Labels indicate the percent of
total nests for each species destroyed. No Tricolored Heron nests were affected in either year, no
Roseate Spoonbill nests in 2018. BRPE = Brown Pelican, FOTE = Forster’s Tern, ROSP =
Roseate Spoonbill.
Tricolored Herons were actively nesting during two of the three overwash events in 2017,
but they were not impacted by the high water. In 2018, both Tricolored Herons and Roseate
Spoonbills were able to begin and conclude nesting attempts after the first overwash event and
21%
14%
12%
16%
21%
32%
0
10
20
30
40
50
60
April 3 April 30 June 22
Nu
mb
er o
f N
ests
Lo
st
BRPE FOTE ROSP
4%
11%
30%
0
10
20
30
40
50
60
April 14 June 18
Nu
mb
er o
f N
ests
Lo
st
BRPE FOTE

26
before the second. Roseate Spoonbills lost 7 nests (32%) during Tropical Storm Cindy in 2017,
though it is important to note that 5 out of the 7 were new nests that were located for the first
time on June 18.
Brown Pelicans failed due to overwash second most at 44% of all failed nests (n = 154)
(Fig. 9). Fifty-seven Brown Pelican nests (16%) failed to hatch by their expected hatch date. By
comparison, 0 Forster’s Tern, 8 Tricolored Heron (15%), and 6 Roseate Spoonbill nests (29%)
failed to hatch. Only one out of 21 failed Roseate Spoonbill nests (5%) failed after chicks were
found dead in the nest of unknown causes. Brown Pelican and Forster’s Tern nests failed this
way 1% of the time, 2 nests and 4 nests, respectively. Nests were abandoned or cause of failure
could not be determined in 27% (n = 94) of failed Brown Pelican nests, 85% (n = 44) of
Tricolored Heron, 34% (n = 90) of Forster’s Tern, and 29% (n = 6) of Roseate Spoonbill nests.
Additionally, 13% (n = 32) of Brown Pelican nests, all occurring simultaneously, were not
visibly damaged by a flood event in April of 2018, but failed at the same time as several nests in
the same area that were flooded or completely washed away. It seems likely that the flood event
affected the failure of these nests in some way, so they were counted as “post overwash” failures.
It is possible that subtle damage, damp, or cold from one of the overwash or severe weather
events was the cause of failure in other unknown, abandoned, and even never hatched nests.

27
Figure 9. Number of failed nests that resulted from each of five cause categories for each species
in 2017 and 2018 at Rabbit Island, Louisiana. Labels indicate the percentage of all failed nests of
that species by cause. These results do not include one Roseate Spoonbill nest that was suspected
to have failed due to avian predation.
Hatch Success
To perform statistical analysis and model selection, I censored all nests lacking elevation
measurements, including many that were destroyed in early overwash events in 2017. Elevation
was not included as an explanatory variable in the most supported models for any species (Table
3). Likelihood of survival to hatch, calculated for each species depending on estimated daily
survival rate (DSR) and their average incubation period, was 70% for Brown Pelicans (DSR =
0.989, incubation = 31 days) and Roseate Spoonbills (DSR = 0.984, incubation = 22), 77% for
Tricolored Herons (DSR = 0.989, incubation = 23 days), 12% for Forster’s Terns (DSR = 0.914,
incubation = 24).
44%
0%
65%
33%
13%
0% 0% 0%
16%
15%0%
29%1% 0% 1% 5%
27%
85%
34%
29%
0
20
40
60
80
100
120
140
160
180
Pelican Tricolor Forster's Roseate
Nu
mb
er o
f N
ests
Overwash Post Overwash Never Hatched Chick Death Abandoned/Unknown

28
Table 3. Model selection results for regression models evaluating the relationship of hatch
success to year, elevation, and date the nest was found. Models are ranked based on Akaike’s
Information Criterion (AIC) adjusted for model weights (wi). K is the number of parameters in
each model.
Species Model AICc ∆AIC wi K Deviance
Brown Pelican FirstFound*Year 860.025 0.000 0.977 3 848.01
FirstFound*Year*Elevation 867.562 7.538 0.023 4 843.52
Elevation 896.238 36.213 0.000 1 892.24
Constant 896.910 36.885 0.000 1 894.91
Year 898.710 38.686 0.000 2 894.71
FirstFound 899.370 39.345 0.000 1 893.37
Year*Elevation 899.911 39.886 0.000 2 891.91
FirstFound*Elevation 900.433 40.408 0.000 2 888.42
Tricolored Heron FirstFound 123.705 0.000 0.269 1 117.69
Year*Elevation 123.967 0.262 0.236 3 115.94
Elevation 124.594 0.889 0.172 1 120.59
Constant 125.051 1.346 0.137 1 123.05
Year 126.039 2.334 0.084 2 122.03
FirstFound*Elevation 127.295 3.590 0.045 2 115.24
FirstFound*Year*Elevation 127.408 3.703 0.042 4 103.21
FirstFound*Year 129.504 5.799 0.015 3 117.45
Forster's Tern FirstFound*Year 655.445 0.000 0.933 3 643.42
FirstFound*Year*Elevation 661.414 5.969 0.047 4 637.31
FirstFound 663.321 7.877 0.018 1 657.31
FirstFound*Elevation 668.448 13.003 0.001 2 656.42
Year*Elevation 678.185 22.740 0.000 3 670.17
Year 680.573 25.128 0.000 1 676.57
Elevation 685.783 30.338 0.000 1 681.78
Constant 694.436 38.991 0.000 1 692.43
Roseate
Spoonbill FirstFound 34.449 0.000 0.688 1 28.38
FirstFound*Year 37.010 2.561 0.191 3 24.77
FirstFound*Elevation 39.525 5.076 0.054 3 27.29
Elevation 40.331 5.882 0.036 1 36.30
Year 41.257 6.808 0.023 1 37.22
Year*Elevation 43.858 9.409 0.006 3 35.75
Constant 48.742 14.293 0.001 1 46.73
FirstFound*Year*Elevation 49.053 14.605 0.000 4 24.16

29
The daily survival rate of Brown Pelicans until hatch (DSR = 0.989) was a function of the
date the nest was found and the year. This model was extremely well supported with a weight of
0.98, meaning that there is only a 2% chance that another variable would improve the model.
The later in the season Brown Pelicans nested, the less likely they were to survive (β = -93.73,
SE = 0.00) and this trend was much stronger in 2017 than in 2018 (β = -1.3, SE = 0.00) (Fig. 10).
Forster’s Terns daily survival rate (DSR = 0.914) was also best described by the date the nest
was found and year (wi=0.933). However, for Forster’s Terns, nesting later improved their
chances (β = 23.34, SE = 0.00) and this effect was larger in 2018 than in 2017 (β = 2.66, SE =
0.00). Both Tricolored Herons and Roseate Spoonbills (DSR = 0.989 and 0.984, respectively)
were best supported by the date found alone, though neither model was as robust (wi = 0.269 for
Tricolored Herons and 0.688 for Roseate Spoonbills), suggesting that there are other factors not
considered in this study that affect nest success in these species. Tricolored Herons benefited
from nesting earlier (β = -0.14, SE = 0.1), while Roseate Spoonbills did better when they nested
later (β = 0.165, SE = 0.17).

30
Figure 10. Daily survival rate predictions until hatch for Brown Pelicans by day the nest was
found (0 = Febuary 24) and year.
Chick Success
I modeled chick success, the likelihood that at least one egg would survive through hatch
and the chick would successfully leave the nest at the end of the nestling phase, separately from
hatch success. I was able to determine whether or not every nest hatched, however it was more
difficult to parse whether or not chicks were successful. Almost all species had at least a few
unknown outcome nests, with the greatest percentage in Tricolored Heron (Fig. 11). In order to
run nest survival models with a binomial outcome I removed all unknown nests.
0
0.2
0.4
0.6
0.8
1
1.2
0 10 20 30 40 50 60 70 80 90
DSR
Day Found
2017 2018

31
Figure 11. Number of nests of each chick outcome for each species at Rabbit Island 2017 (upper
panel) and 2018 (lower panel). Labels indicate percentage of total nests for each species.
Likelihood of survival past the nestling stage was much lower for all species, calculated
with the entire nest age, from initiation until at least one chick leaves: 28% for Brown Pelicans
(DSR = 0.980, nesting = 62 days), 32% for Tricolored Herons (DSR = 0.97, nesting = 37 days),
16%
15%0%
27%4%39%
0% 5%
79%
46%
100%
68%
0
30
60
90
120
150
180
210
Pelican Tricolor Forster's Roseate
Nu
mb
er o
f N
ests
Success Unknown Fail
12%
17%2% 50%
13%
15%0% 7%
75%
67%
98%
43%
0
30
60
90
120
150
180
210
Pelican Tricolor Forster's Roseate
Nu
mb
er o
f N
ests
Success Unknown Fail

32
Roseate Spoonbills at 27% (DSR = 0.834, nesting = 39 days), and Forster’s Terns had 0%
likelihood to survive to leave the nest (DSR = 0.834, nesting = 39 days). All species except
Tricolored Herons had the same strongest model for chick success as they did for hatch success.
Tricolored Herons’ daily survival rate throughout the nestling phase (0.97), was actually best
described by the constant model, without any of the variables we examined. This model, again,
was not well-supported (wi = 0.405), so it is likely there are other variables affecting success in
this species.
Date found was a better predictor of daily survival rate throughout the nesting season
(DSR = 0.964) for Roseate Spoonbills (wi =0.888) than it was for only the incubation period
(Table 4). Once again, nesting later increased the daily survival rate (β = 0.283, SE = 0.133).
While date found and year was still the strongest model for daily survival of Forster’s Terns
(0.834), it is not as strong as the same model for hatch success (wi = 0.852), with a 15% chance
that other factors are involved. Daily survival rate increased with later nest initiation dates for
terns (β = 46.59, SE = 0.00) and were higher in 2018 than 2017 (β = 6.52, SE = 0.00). Daily
survival rate of Brown Pelicans throughout the nestling phase was almost as high as it was for
incubation only (DSR = 0.981). DSR decreased for Brown Pelicans the later they nested (β = -
49.83, SE = 0.02) and was lower in 2017 (β = -1.07, SE = 0.00), although DSR decreased later in
the season and both years followed the pattern more strongly than during only the incubation
period (Fig. 12). This model was very strongly supported, as well (wi = 0.984).
33
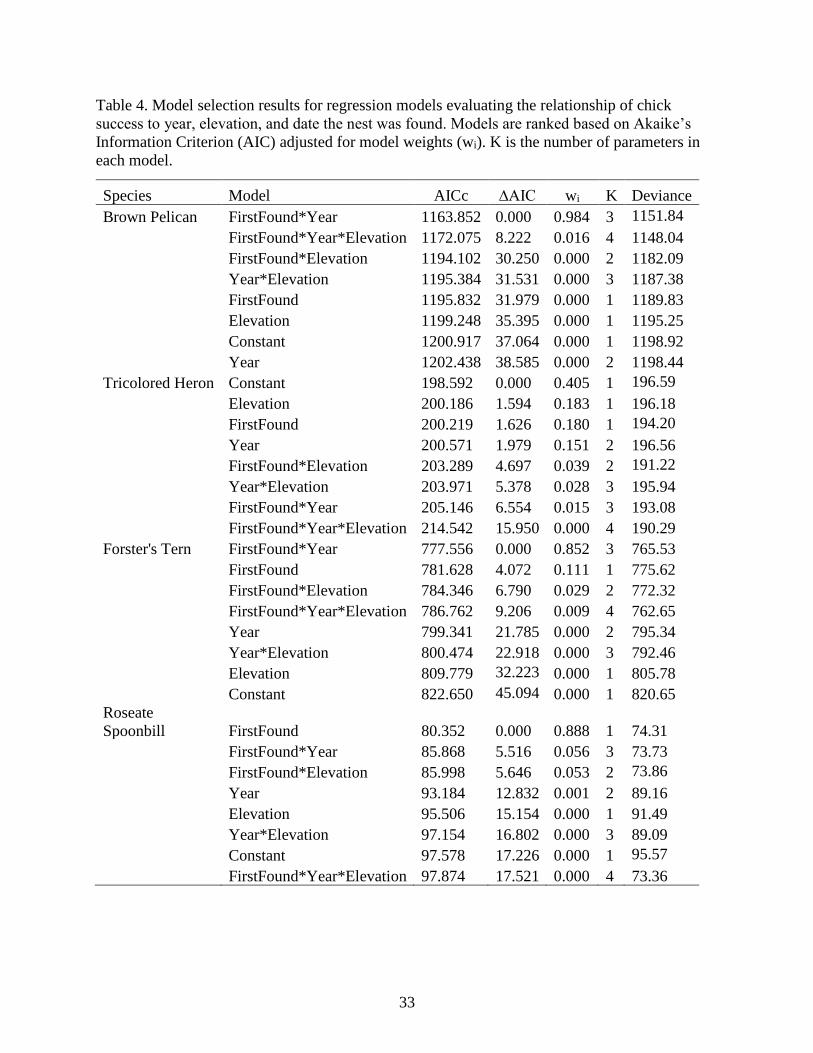
Table 4. Model selection results for regression models evaluating the relationship of chick
success to year, elevation, and date the nest was found. Models are ranked based on Akaike’s
Information Criterion (AIC) adjusted for model weights (wi). K is the number of parameters in
each model.
Species Model AICc ∆AIC wi K Deviance
Brown Pelican FirstFound*Year 1163.852 0.000 0.984 3 1151.84
FirstFound*Year*Elevation 1172.075 8.222 0.016 4 1148.04
FirstFound*Elevation 1194.102 30.250 0.000 2 1182.09
Year*Elevation 1195.384 31.531 0.000 3 1187.38
FirstFound 1195.832 31.979 0.000 1 1189.83
Elevation 1199.248 35.395 0.000 1 1195.25
Constant 1200.917 37.064 0.000 1 1198.92
Year 1202.438 38.585 0.000 2 1198.44
Tricolored Heron Constant 198.592 0.000 0.405 1 196.59
Elevation 200.186 1.594 0.183 1 196.18
FirstFound 200.219 1.626 0.180 1 194.20
Year 200.571 1.979 0.151 2 196.56
FirstFound*Elevation 203.289 4.697 0.039 2 191.22
Year*Elevation 203.971 5.378 0.028 3 195.94
FirstFound*Year 205.146 6.554 0.015 3 193.08
FirstFound*Year*Elevation 214.542 15.950 0.000 4 190.29
Forster's Tern FirstFound*Year 777.556 0.000 0.852 3 765.53
FirstFound 781.628 4.072 0.111 1 775.62
FirstFound*Elevation 784.346 6.790 0.029 2 772.32
FirstFound*Year*Elevation 786.762 9.206 0.009 4 762.65
Year 799.341 21.785 0.000 2 795.34
Year*Elevation 800.474 22.918 0.000 3 792.46
Elevation 809.779 32.223 0.000 1 805.78
Constant 822.650 45.094 0.000 1 820.65
Roseate
Spoonbill FirstFound 80.352 0.000 0.888 1 74.31
FirstFound*Year 85.868 5.516 0.056 3 73.73
FirstFound*Elevation 85.998 5.646 0.053 2 73.86
Year 93.184 12.832 0.001 2 89.16
Elevation 95.506 15.154 0.000 1 91.49
Year*Elevation 97.154 16.802 0.000 3 89.09
Constant 97.578 17.226 0.000 1 95.57
FirstFound*Year*Elevation 97.874 17.521 0.000 4 73.36

34
Figure 12. Daily survival rate predictions throughout nesting phase for Brown Pelicans by day
the nest was found (0 = Febuary 24) and year.
Elevation was not a primary driving factor in the survival rate of any species. That may
be because Rabbit Island has fairly homogenous topography. Mean nest elevation for each
species, regardless of status (chick success, unknown outcome, or failed nest), were all within
one standard deviation of each other (Fig. 13).
Figure 13. Average elevation of each species by chick outcome. Error bars are standard
deviation; labels are sample size (n).
0
0.2
0.4
0.6
0.8
1
1.2
0 10 20 30 40 50 60 70 80 90
DSR
Day Found
2017 2018
53 10 3 1231 21 0 2225 44 233 180
5
10
15
20
25
30
35
40
Pelican Tricolor Forster's Roseate
Elev
atio
n (
cm)
Success Unknown Failure

35
I found that most nests lost chicks between 1.5 and 3 weeks in both years (Fig. 14).
Chicks were not considered successful until they reached Category 3: 3 to 4.5 weeks. In 2017 29
Brown Pelican nests had at least one chick reach Category 3. With an average of 1.16 chicks per
nest (Table 2), I estimate that 33.6 chicks were actually recruited by this metric. In 2018 only 17
Brown Pelican nests reached at least Category 3. The average number of chicks per nest was less
in 2018 as well, only 0.99. By this calculation 14.8 chicks were recruited in 2018, for a total of
48.4 during this study out of 309 total nests. The distribution of age categories was significantly
different between 2017 and 2018 (ꭓ2 = 30.73, P < 0.0001).
Figure 14. Age category reached by the oldest/largest chick from each Brown Pelican nest as
defined by Walter et al. (2013). (1) 0 to 1.5, 2) 1.5 to 3, 3) 3 to 4.5, 4) 4.5 to 6, 5) 6 to 7.5, and 6)
7.5 to 9).
Predator and Fire Ant Presence
Evidence of mammalian predation was never recorded at a nest on Rabbit Island. Tracks
of mammalian predators were never found on Rabbit Island, though there were frequently bird
tracks present on the track plates. Though some field cameras trained on individual nests failed,
1517 16
12
1 0
24
37
3 3
6 5
0
5
10
15
20
25
30
35
40
1 2 3 4 5 6
Nu
mb
er o
f N
ests
2017 2018

36
one was washed over in the flood on April 3, and one randomly placed camera was trained on a
nest that had already abandoned, one camera covering multiple Brown Pelican nests captured
photos every 7 minutes and when the motion sensor was triggered every night from March 26-
28, 2017. No mammals or predators of any kind were visible in any of these 1700 pictures. The
only definitive mammalian sign ever seen throughout the entire research period were from
muskrats (Ondatra zibethicus). In addition, no fire ants were ever detected at the lures.
Researchers investigated any and all potential mammal tracks or sign of any kind and
opportunistically examined dead birds during regular monitoring duties. Corpses routinely
remained in place for several weeks without being moved and with no visible sign of mammalian
bite or claw marks or fire and activity.
Originally, I set traps for fire ants according to the methods laid out by Seymour (2007),
but no ants were ever collected across seven trials. To test the viability of this method I placed a
test vial off-site within a foot of an active fire ant mound and still collected no ants. However, the
cat food lure attracted fire ants at every site on every day on the dredge spoil island, while no fire
ants were ever seen on Rabbit Island, either during predator sampling on cat food lures or at any
other time during the study period. Throughout both nesting seasons there were many anecdotal
sightings of bird corpses, none of which ever showed any sign of mammalian scavenging or
decomposition by fire ants.
By contrast, the nearby dredge spoil island, 1.5 to 2 m higher than Rabbit Island, showed
tracks from feral hogs (Sus scrofa), a relatively large unidentified canid, and an unidentified
rodent, most likely the marsh rice rat (Oryzomys palustris). Only the rodent prints were observed
on the track plates. I encountered the hog and canine tracks in mud near predator trap sites. Trail
cameras on this island, also malfunctioned and no photographs were taken of any mammal.
37
Discussion
The results of this study indicate that nest timing, nesting strategy, and conditions in a
particular year can all have effects on nest success of colonial nesting waterbirds on coastal
islands. Species nesting above ground level such as Tricolored Herons and Roseate Spoonbills
are less susceptible to overwash than those that nest on the ground. Walter et al. (2013) found
that nest height was a significant factor in nest success for Brown Pelicans on nearby Wine and
Raccoon Islands, where they nested both in woody vegetation and on the ground. Birds that
nested higher above the substrate were more successful. Year was another highly influential
factor in nest success, possibly due to large overwash events, erosion, and shoreline retreat which
destroyed 20% of nests on Wine Island in 2009 and 15% in 2010 (Walter et a. 2013).
Flooding was the most common reason for nest failure in all species except Tricolored
Herons. This is consistent with the findings of McNease et al. (1992). Flooding, particularly
associated with storms, was the biggest threat to nesting Brown Pelicans throughout their 19-year
study, especially those that nested on the ground. Reportedly, one flood caused the loss of at
least 400 nestlings and many more eggs (McNease et al. 1992). In both years of this study,
overwash and flooding events almost always occurred when the water level was above 0.4 m
according to nearby gauges. On one occasion, April 3, 2018, an overwash event occurred without
water levels at either the nearby NOAA or CRMS station reaching 0.4 m. However, this event
was accompanied by strong winds and a swift change in wind direction. Although more
measurements are required to know for certain, this event may have been a meteotsunami, a
wave caused by localized atmospheric and barometric perturbations (Sheremet et al. 2016). At
least one such event has been documented on the Atchafalaya Shelf, where Rabbit Island is
located, and researchers suspect this was not an isolated incident based on the hydrology in the

38
area (Sheremet et al. 2016). Within the scope of this study it appears that data supports a flood
threshold of 0.4 m outside of such meteorological events. Occasional overwash events are
unlikely to have any serious effect on even local recruitment, since waterbird species are long-
lived and have many opportunities to nest and raise young. However, more comprehensive
demographic data for each species is necessary to accurately model the degree and frequency of
flooding that could decrease productivity below the level needed to sustain the population.
Despite the prevalence of flooding and evidence of a flood threshold once water levels
reached 0.4 m compared to the marsh, elevation was not a significant factor in determining daily
survival rate for any species. This may be because Rabbit Island is so low-lying and
topographically homogenous that birds cannot nest high enough for elevation to have an impact.
If birds are not able to nest above the flood line, then nesting early or late enough to avoid the
most common and usually largest overwash events in April and June may be their best strategy
for survival. Unfortunately, though nest timing can mitigate the effects of flooding, strategies
that increase success one year may be detrimental the next as evidenced by the variability in
timing of overwash events over the last 13 years.
Though difficult to measure, my study also suggests that flooding may impact ground
nests in subtler ways. While flooding and overwash are often associated with of nest bowls
washing away entirely or several centimeters of standing water in the nest, it is likely that nests
that remain intact can also fail due to nest material becoming damp and change the temperature
and the humidity of the nest, altering the ability of the parents to thermoregulate the eggs
effectively. I found evidence in abandoned nests that the eggs may have been wet on their
undersides, although whether that occurred before or after abandonment is difficult to say. In
fact, nearly as many Brown Pelican nests failed due either to suspected post-overwash effects

39
and abandonment as failed due to direct flooding (n = 141 and 154, respectively). Other studies
have shown nest abandonment may not require damage to the nest at all, merely environmental
cues that may indicate a high risk of overwash. In 2010 all 52 nests on Wine Island were
abandoned before eggs could hatch, apparently due to the decrease in suitable habitat (Walter et
al. 2013). However, there are alternative explanations for the large number of abandoned nests.
Anderson et al. (1982) linked large-scale nest abandonments of Brown Pelicans in Southern
California to food stress due to a lack of pelagic fish in the area. More study is required to rule
out other environmental factors.
Forster’s Terns were by far the least successful of all the species in this study. While I
banded terns from 3 nests past their nestling stage in 2018, none of the chicks were fledged at
that time. In both 2017 and 2018, Forster’s Terns did not renest on Rabbit Island after the
overwash events in June, and nearly all adult terns left the area. Based on the timing of the
overwash events and the fact that I never identified any fledgling terns in either year, I believe
that no recruitment took place from the Forster’s Terns on Rabbit Island. This is reflected in the
nest survival estimates in which Forster’s had a 12% chance of surviving to hatch but a 0%
chance of leaving the nest. A previous study in Minnesota showed that Forster’s Terns also had
fairly low hatch and success rates there. Hatch rates ranged from 0 to 33% while fledge rates
were 0 to 17% between two breeding seasons (Cuthbert and Louis 1993).
Forster’s Terns nest preferentially on dry dead vegetation (Bergman et al. 1970). Due to
the low elevation and frequent overwash of Rabbit Island, the majority of this vegetation is
deposited in areas that are repeatedly overwashed. Ideally on higher elevation islands nesting
substrate for Forster’s Terns would consist of vegetation washed up further inland during tropical
storms or hurricanes in the late summer or early fall, or periodic meteotsunamis throughout the

40
year. If overwash were less frequent and less intense this rack vegetation from extreme weather
would persist until the next nesting season but little to no rack would accumulate in the lowest
areas of the island. Then Forster’s Terns would be able to nest on their preferred substrate
without guaranteeing their eventual overwash. As more coastal islands lose elevation, loss of
safe substrate could cause a population decrease in Forster’s Terns.
However, Forster’s Terns face more than just flooding on Rabbit Island. Unlike Brown
Pelicans, Tricolored Herons, and Roseate Spoonbills, Forster’s Tern chicks were rarely seen
more than once and empty nests with no sign of whether or not an egg hatched was fairly
common. This could be because they become mobile and leave the nest earlier than the rest of
the species, but even when I thoroughly searched the entire transect area, I rarely found older
chicks hiding nearby. This reflects the 1993 study by Cuthbert and Louis, in which
“disappearance” was the most common cause of nest failure, both before eggs hatched (61%)
and after chicks had been confirmed (67%). Another 13% of eggs were abandoned (Cuthbert and
Louis, 1993).
Late nesting not only makes Forster’s Terns more susceptible to storms late in the season,
but they begin nesting around the same time as Laughing Gulls on Rabbit Island (anecdotal
observation). While I was unable to document any instances of avian predation on Rabbit Island,
Laughing Gulls are notorious nest predators and I did find some evidence of avian predation at
Marsh Island (Chapter 2). O’Connell and Beck (2003) found that gull predation on tern and
skimmer nests in Virginia accounted for more nest mortalities than tidal flooding, the second
most common cause of failure. Additionally, they suggested that large populations of gulls may
also force terns and skimmers into nesting areas where they are more susceptible to flooding
(O’Connell and Beck 2003). Forster’s Tern eggs and chicks on Rabbit Island may be facing

41
much higher levels of predation and competition than the other species due to their small relative
size, as well as an increase in avian predation during Laughing Gull nesting, in order to provide
food for their young. More information is needed to determine the impact of avian predation on
nest failure in Forster’s Terns.
Frederick and Collopy (1989) determined that Tricolored Herons had a 46-66%
probability of nest success using the Mayfield method compared to an estimated 32% in this
study. My probability may be artificially low, due to the number of unknown outcome nests. The
likelihood of hatch success was much higher, approximately 77%. Interestingly, they also found
that the largest cause of nest failure by far in Tricolored Herons was nest abandonment. This was
not associated with overwash or flooding events but was correlated with heavy rain (Frederick
and Collopy 1989). Roseate Spoonbills in Texas had a slightly higher rate of hatch success to
those at Rabbit Island (70%). White et al. (1982) recorded 79 to 97% success rates among their
nests over three years.
There was no sign of any mammal on Rabbit Island except for muskrats. In earlier studies
of nest success within southwestern Louisiana, muskrats were present in the study area but were
not considered nest predators (Gabrey et al. 2002). Both old and active muskrat mounds provide
nesting sites for Forster’s Terns, suggesting that the presence of muskrats may even be beneficial
for nesting waterbirds (Bergman et al. 1970, Gabrey et al. 2002). The presence of large
mammalian predators and fire ants on the nearby dredge spoil island is concerning in the context
of future restoration of Rabbit Island. Walter et al. (2013) suggested that some nest failures
during that study were due to imported red fire and as well as raccoon predation. The addition of
nest predators on such a small island could be much more detrimental to nesting birds than
occasional flooding (Erwin et al. 2001).

42
Management Implications
Restoration measures are needed to counteract subsidence and erosion on Rabbit Island.
However, raising the elevation more than 1 m would substantially increase the probability of
invasion by woody plants and mammalian predators, as evidenced by the dense woody
vegetation, mammalian predators, and invasive red fire ants prevalent on the dredge spoil island
just 2.4 km away and only 1.44 m in elevation. Additionally, while increasing the elevation may
increase the flood threshold, uncertainty regarding frequency and magnitude of flood events and
colonial nesting waterbird demographics limit our ability to make strong predictions. Overwash
events only occurred in 5 of the past 13 years, according to past CRMS station data. Water levels
above the flood threshold have occurred every year since 2015, and while sea level is increasing
(Visser et al. 2005, Deaton et al. 2017), and storms are becoming more frequent and intense (Day
et al. 2008), it is not yet clear whether more frequent high water events in Lake Calcasieu are the
new normal.
Furthermore, not all invasion by woody vegetation would decrease habitat for all species.
Forster’s Terns are obligate ground or overwater nesters, but Roseate Spoonbills and Tricolored
Herons build nests above the ground even in grassy vegetation and are known to nest in woody
vegetation elsewhere (Maxwell and Kale 1977, White et al. 1982, Cuthbert and Louis 1993).
Another study showed that Brown Pelicans have higher nest success when nesting in taller
vegetation, specifically black mangrove and marsh elder (Walter et al. 2013). This also points
towards caution in increasing island elevation, as mangroves do best in intermediate marsh,
which cannot be maintained if the elevation is raised too high (Guo et al. 2013). However, the
islands in Walter and colleagues’ (2013) study that supported mangroves and therefore must
have been fairly low in elevation were home to both fire ants and mammalian predators. The

43
spread of vegetation and predators from one island to another is difficult to predict. In a study of
barrier islands in Virginia, 6% of 51 radio-collared raccoons moved overwater from one island to
another (Dueser et al. 2013). Expansion in mammalian predators throughout barrier islands in
Virginia have corresponded with an overall decrease in population of several species as well as a
decrease in colony size (Erwin et al. 2003).
Rabbit Island is a unique case-study due to its lack of predators and relatively slow
subsidence compared to most coastal islands. This allowed me to isolate flood risk as a factor
affecting nest success in colonial nesting species with a variety of nesting strategies. On low-
elevation coastal nesting islands, increasing elevation slightly to increase the flood threshold and
decrease the number of overwash events may substantially increase nest survival. However, the
effects this could have on other factors and therefore on the ecosystem as a whole are still largely
unknown and unpredictable. More research is needed, particularly monitoring after restoration
occurs, in order to determine the most successful methods for restoring coastal islands for
nesting waterbirds.
The average land loss rate of barrier islands in coastal Louisiana is over 10 times that of
Rabbit Island, primarily due to wave action within the Gulf of Mexico (Selman et al. 2016).
Selman and colleagues (2016) concluded that Rabbit Island in particular and restoration efforts
such as the recent stabilization of Queen Bess in southeastern Louisiana will be important for the
future of nesting waterbirds. I submit that it also may be important to establish, and not just
restore, islands like Rabbit Island that are more protected from waves than barrier islands. I
suggest this because it may be more cost-effective to create new inland islands that will not erode
as quickly than it is to slow erosion of existing barrier islands in the open Gulf.

44

45
Chapter 2.
Methods
Study Area
My secondary site consisted of four small islands that were restored in 2015 located
within Bayou Platte in Marsh Island NWR, between Vermilion Bay and the Gulf of Mexico (Fig.
1). The substrate is mostly rock and the islands are treated with herbicide to give a more
favorable nesting habitat for birds that prefer bare ground. These islands are primarily managed
for Forster’s Terns, Gull-billed Terns (Gelochelidon nilotica) and Black Skimmers. Two of the
four small island sites support invasive fire ants. No mammals live on the islands but these
islands are in shallow water close to a larger continuous marsh, and so it is possible that
mammals will cross to feed on eggs and chicks during nesting season. Additionally, alligators are
prevalent in this area (personal observation).
Figure 1. Map of Coastal Louisiana, USA with inset of Bayou Platte within Marsh Island.
Breeding island sites circled in orange.

46
I visited the Marsh Island sites every 2 to 3 weeks beginning in March each year. Once
Forster’s Terns began nesting on these islands, I followed the same protocol for nest monitoring
as in Chapter 1, however site visits were conducted approximately bimonthly due to the distance
and relative difficulty of travel to these sites. These islands and the Forster’s Tern colonies on
each were relatively small, so I marked every nest I found on all four islands within Bayou
Platte.
I took elevation points at each nest and in transects across each island using a Trimble
7X, however these islands were located too far away from the nearest base station and the points
were too inaccurate to use. I used the nearest CRMS station (CRMS0529-H01, 29.60 N 91.92
W) to examine past water level data. Because I could not get an accurate elevation reading on the
islands, the water level data logger I installed was also unusable.
I deployed field cameras (Bushnell TrophyCam) at colonies on the two largest islands
(Henrietta Island and the Big Island) 4 times during both field seasons for periods of 10-14 days,
positioned so as to encompass several tern nests at once. During nest searches researchers
monitored the islands for signs of predator presence. Alligator sightings were recorded at each
site visit. A separate field camera was deployed at the entrance of a hole that appeared to be a
mammalian den during the 2018 nest season.
Results and Discussion
In 2017, I recorded Forster’s Tern nests on three islands within Bayou Platte. In 2018,
there were Forster’s Terns nesting on the same three islands and an additional small island west
of the Big Island, where I did not find any nests the year before. I observed 350 nests, producing
685 eggs over both years (Table 1). Only one chick was confirmed to have successfully hatched.

47
I observed more than one chick near my transects, however, due to the flat nesting substrate
unobstructed by vegetation, it was nearly impossible to determine which nest chicks came from.
While there were other chicks that attained hatch success, I believe that chick success was
essentially zero across all islands both years.
Table 1. Number of nests and eggs at four island sites within Bayou Platte in two field seasons.
#
Nests
#
Eggs
#
Chicks
2017
Henrietta 24 40 0
Crescent 38 73 0
Big Island 77 121 0
West Island 0 0 0
2018
Henrietta 130 302 1
Crescent 13 21 0
Big Island 53 98 0
West Island 15 30 0
The breeding season on Marsh island was later and shorter than on Rabbit Island
(Chapter 1). The earliest nest was found in 2017 on May 11 and all nests were destroyed by June
9. In 2018, I didn’t see any nests until June 6, and there was no nesting activity as of August 1.
Therefore, I defined the breeding season for Marsh Island as May 1 – July 31.
The water level data from the nearest CRMS station over the past 10 years shows a
general pattern of somewhat stable water levels throughout the breeding season, generally
between 0-0.4 m (Fig. 2). It is clear from Figure 2 that 2017 (denoted by white dots with a black
outline) and 2018 (black dots) were anomalous years. Water levels up to 0.96 were recorded on
June 22, 2017 during Tropical Storm Sandy. This event was by far the highest water level

48
recorded in the past 10 years. In 2018, water levels were persistently low throughout the whole
season.
Figure 2. Water level data from nearest CRMS station 0529-H01 during breeding season from
2008 through 2018.
While there was one extreme event in 2017, the mean water level was only slightly
higher than all other years. The mean water level in 2018 was the only negative mean and was
the only mean more than one standard deviation away from all other years (Fig. 3). It is possible
that these water levels were a mechanical error rather than such a drastic change from all other
previous seasons. However, Nyman et al. (2009) showed that water levels in marshes at Marsh
Island and nearby experienced lower mean daily low water levels than marshes surrounding
Calcasieu Lake and attributed the difference to the greater connectivity between the Gulf of
Mexico and Atchafalaya Bay than between the Gulf of Mexico and Calcasieu Lake. Although
the water was shallow in 2018, I was able to get the boat to each island on every visit, which
indicates that the water level was not below 0 m for the majority of the season. Whether or not
-0.8
-0.6
-0.4
-0.2
0
0.2
0.4
0.6
0.8
1
1.2
0 500 1000 1500 2000
Ad
just
ed W
ater
Ele
vati
on
to
Mar
sh (
m)
Date from May 1 - July 31
2008 2009 2010 2011 2012 2013
2014 2015 2016 2017 2018

49
the CRMS information was accurate, it is impossible to draw conclusions about flood thresholds
or probabilities based solely on these two years.
Figure 3. Mean water level during breeding season (May 1 – July 31) for the past 10 years. Error
bars are standard deviation.
Across all islands in both 2017 and 2018, Forster’s Terns nested exclusively on washed
up dead vegetation (rack) from previous overwash events. Since water levels were low in 2018,
and 3 monitoring visits to Marsh Island before breeding began revealed no rack or dead
vegetation on any of the islands. In fact, Forster’s Terns did not begin to nest in 2018 until June
6, the first time I observed rack lines on each of the islands. When I returned to Henrietta Island
six days later on June 12, an overwash event had destroyed all previous nests and deposited rack
at least 7 m inland from the previous rack line. Forster’s Terns had already colonized and built
nests on this new dead vegetation. To allow Forster’s Terns to nest earlier and in an area less
prone to overwash, I join Leburg et al. (1995) in recommending managers deposit dead
vegetation well above the rack line.
0.060.04
0.080.06 0.07 0.08
0.100.07
0.110.13
-0.21
-0.40
-0.30
-0.20
-0.10
0.00
0.10
0.20
0.30
2008 2009 2010 2011 2012 2013 2014 2015 2016 2017 2018
Met
ers

50
In 2017, there were four nests with definitive signs of avian predation by the way the
shells were broken. I assume that other nests were also depredated. These islands hosted
Laughing Gulls as well as terns and Black Skimmers. The same storm, Tropical Storm Cindy,
that destroyed all remaining nests on Rabbit Island in June (Chapter 1) completely overwashed
these low-lying islands. Like Rabbit Island, after that storm no adult or juveniles were seen on
any of the island sites.
The island of Henrietta was overwashed three times and re-colonized twice in 2018. The
first attempt consisted of 47 nests in which 101 eggs were laid. That colony was present from
June 6-12. The second attempt lasted from June 12-26 and contained 44 nests and 111 eggs.
Finally, from June 26-July 13, 39 nests contained 90 eggs. One chick successfully hatched
during the third attempt. On July 13, all nests on Henrietta Island were either empty or gone.
There were approximately 10 adult Forster’s Terns present and aggressive both on July 13 and at
my final visit on August 1. Despite searching, I did not find any chicks, although the adults’
behavior was consistent with nest or chick defense.
I saw what may have been a single fledged Forster’s Tern on West Island on July 13, but
there were no adults, chicks, or intact eggs present at any other island site. However, the majority
of nests at all sites were still present and intact, indicating that no overwash event or large
predator was responsible. I suspect the majority of the nest failures in 2018 were caused by avian
predation, although there was little proof and no way to determine the species depredating
Forster’s Tern nests.
Cameras at various colonies on Henrietta and the Big Island never captured mammals or
other large predators near nests in either nesting season. Multiple alligators were present during
every site visit, and I once witnessed an alligator predate a Gull-billed Tern chick in the water,

51
but there was never any sign that alligators depredated nests. During the 2018 nest season I
captured photographs of at least one nutria (Myocastor coypus) on Henrietta Island. While nutria
have been documented raiding bird nests (Windhoffer and Pierce, unpublished data quoted by
Baurick 2018), the nutria never appeared on nest cameras located near its burrow and there was
no sign of mammalian predation at any nest.
While our cameras failed to capture any actual depredation, they did show some potential
nest predators, all avian. In 2017, cameras on the Big Island caught large numbers of White Ibis
(Eudocimus albus) flying in and landing on top of Forster’s Tern colonies during the night.
Additionally, in 2018 large numbers of Gull-billed Terns appeared just behind nesting Forster’s
Terns. Within a few minutes several Forster’s Terns flushed off their nests and returned, however
the eggs that were previously visible were not seen again after that flushing photo. Both White
Ibis and Gull-billed Terns are carnivorous and feed primarily on invertebrates and small
amphibians, reptiles, crustaceans, and fish (Kushlan 1979, Erwin et al. 1998). It seems plausible
that either of these species may opportunistically depredate nests, however I did not capture that
behavior.
Interestingly, while all adult Forster’s Terns and any eggs or chicks on the Big Island,
Crescent Island, and West Island disappeared on July 13, 2018, Black Skimmers and their nests
and eggs were still present. There were active skimmer nests within as little as 0.5 m from empty
Forster’s Tern nests, some containing traces of shell and yolk. However, Black Skimmers’
unique bill morphology and nearly exclusive diet of fish make it extremely unlikely that they
were responsible for depredation of any other avian species (Favero et al. 2001). In preliminary
visits to the sites before breeding began in 2017, multiple owl pellets were observed on the Big
Island and Henrietta. I did not see owls, owl pellets, or field camera photos of owls during either

52
nesting season, but birds of prey are another candidate for possible nest predator. More intensive
sampling and video surveillance instead of field cameras are needed to determine the fate of
these nests.

53
Appendix A. Rabbit Island Vegetation Data for Chapter 1
Table A1. Approximate percent composition of vegetation for each transect. BRPE = Brown
Pelican, TRHE = Tricolored Heron, FOTE = Forster’s Tern, ROSP = Roseate Spoonbill.
Year Species Transect S. alterniflora S. patens D. spicata J. roemerianus
2017 BRPE A 0 0 100 0
2017 BRPE B 0 0 100 0
2017 BRPE C 50 0 50 0
2017 BRPE D 50 0 50 0
2017 BRPE E 70 30 0 0
2017 BRPE F 85 15 0 0
2017 BRPE G 60 40 0 0
2017 BRPE S 75 25 0 0
2017 BRPE T 100 0 0 0
2017 TRHE East 80 0 20 0
2017 TRHE North 50 30 20 0
2017 FOTE Bayou 50 0 20 30
2017 FOTE Sammy 75 25 0 0
2017 FOTE NE 50 30 20 0
2017 FOTE MMa N/A N/A N/A N/A
2017 FOTE BSb 0 0 0 100
2017 FOTE Pb 100 0 0 0
2017 ROSP 51-69 80 20 0 0
2017 ROSP 100-104 100 0 0 0
2018 BRPE H 100 0 0 0
2018 BRPE I 100 0 0 0
2018 BRPE J 100 0 0 0
2018 BRPE K 100 0 0 0
2018 BRPE L 100 0 0 0
2018 BRPE M 100 0 0 0
2018 BRPE N 90 0 10 0
2018 TRHE A 75 0 0 25
2018 TRHE B 20 80 0 0
2018 FOTE A 20 80 0 0
2018 FOTE B 50 35 15 0
2018 FOTE Cc 80 0 20 0
2018 FOTE D 90 10 0 0
2018 FOTE E 40 40 20 0
2018 ROSP ROSP 100 0 0 0 a Transect on abandoned muskrat mound, no live vegetation b Nests in this transect primarily floating on water, emergent vegetation around nests listed c Some nests in this transect directly on shell hash

54
Table A2. Average percent composition of vegetation for each species
S. alterniflora S. patens D. spicata J. roemerianus
BRPE 73.75 6.88 19.38 0
TRHE 56.25 27.5 10 6.25
FOTE 55.5 22 9.5 13
ROSP 93.33 6.67 0 0
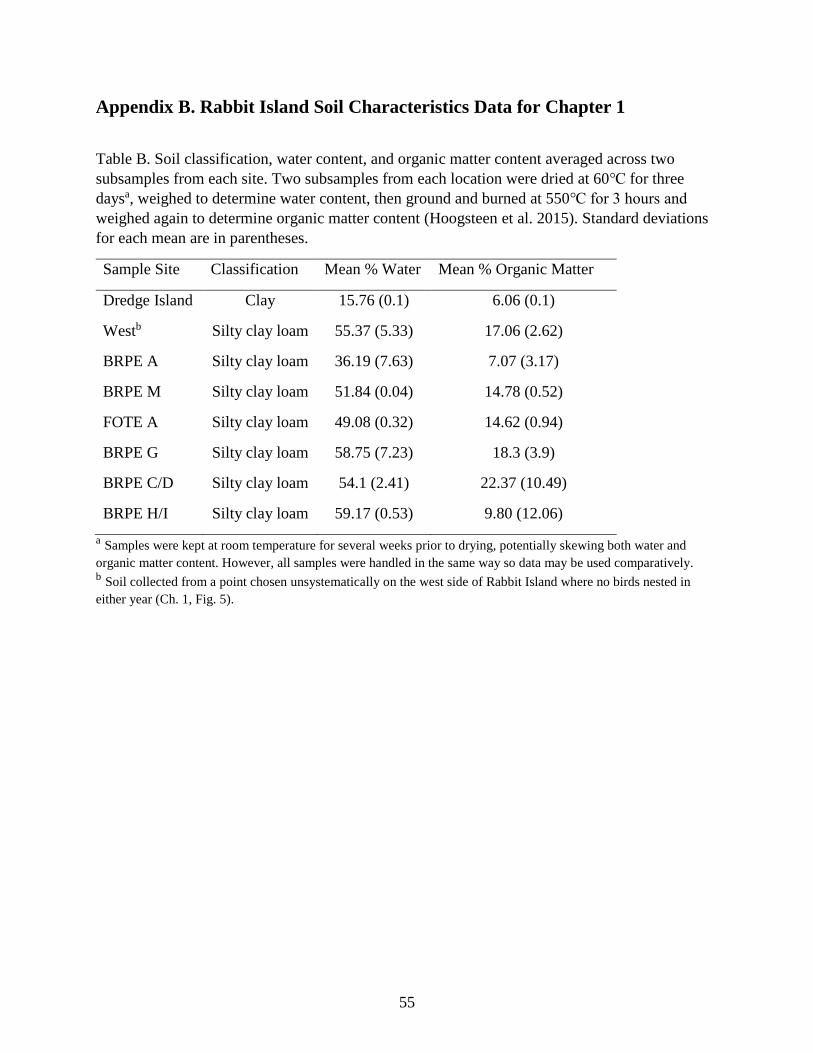
55
Appendix B. Rabbit Island Soil Characteristics Data for Chapter 1
Table B. Soil classification, water content, and organic matter content averaged across two
subsamples from each site. Two subsamples from each location were dried at 60℃ for three
daysa, weighed to determine water content, then ground and burned at 550℃ for 3 hours and
weighed again to determine organic matter content (Hoogsteen et al. 2015). Standard deviations
for each mean are in parentheses.
Sample Site Classification Mean % Water Mean % Organic Matter
Dredge Island Clay 15.76 (0.1) 6.06 (0.1)
Westb Silty clay loam 55.37 (5.33) 17.06 (2.62)
BRPE A Silty clay loam 36.19 (7.63) 7.07 (3.17)
BRPE M Silty clay loam 51.84 (0.04) 14.78 (0.52)
FOTE A Silty clay loam 49.08 (0.32) 14.62 (0.94)
BRPE G Silty clay loam 58.75 (7.23) 18.3 (3.9)
BRPE C/D Silty clay loam 54.1 (2.41) 22.37 (10.49)
BRPE H/I Silty clay loam 59.17 (0.53) 9.80 (12.06)
a Samples were kept at room temperature for several weeks prior to drying, potentially skewing both water and
organic matter content. However, all samples were handled in the same way so data may be used comparatively. b Soil collected from a point chosen unsystematically on the west side of Rabbit Island where no birds nested in
either year (Ch. 1, Fig. 5).

56
References
Adis, J. and Junk, W. J. 2002. Terrestrial invertebrates inhabiting lowland river floodplains of
Central Amazonia and Central Europe: a review. Freshwater Biology 47:711-731.
Anderson, D. W., Gress, F., and Mais, K. F. Brown Pelicans: Influence of food supply on
reproduction. Oikos 39(1):23-31.
Ballinger, A., Lake, P. S., Mac Nally, R. 2007. Do terrestrial invertebrates experience
floodplains as landscape mosaics? Immediate and longer-term effects of flooding on ant
assemblages in a floodplain forest. Oecologia 152:227-238.
Barton, K. 2018. MuMIn: Multi-Model Inference. R package version 1.42.1.
https://CRAN.R-project.org/package=MuMIn
Baurick, T. “Nutria don’t just destroy wetlands, they’re also raiding bird nests, scientists say”.
Nola.com June 14, 2018. https://expo.nola.com/news/erry-
2018/06/c2f7801aae3245/nutria_dont_just_eat_the_wetla.html
Bergman, R. D., Swain, P., and Weller, M. W. 1970. A comparative study of nesting Forster’s
and Black Terns. The Wilson Bulletin, 82(4):435-444.
Blus, L. J. and Keahey, J. A. 1978. Variation in reproductivity with age in the Brown Pelican.
The Auk 95(1):128-134.
Brooks, G. L., Sanders, F. J., Gerard, P. D., and Jodice, P. G. R. 2014. Daily survival rate for
nests of Black Skimmers from a core breeding area of the southeastern USA. The Wilson
Journal of Ornithology 126(3):443-450.
Carney, K. M., Sydeman, W. J. 1999. A review of human disturbance effects on nesting colonial
waterbirds. Waterbirds: The International Journal of Waterbird Biology 22(1):68-79.
Cuthbert, F. J. and Louis, M. 1993. The Forster’s Tern in Minnesota: status, distribution, and
reproductive success. The Wilson Bulletin 105(1):184-187.
Day, J. W., Christian, R. R., Boesch, D. M., Yáñez-Arancibia, A., Morris, J., Twilley, R. R.,
Naylor, L., Schaffner, L., Stevenson, C., 2008. Consequences of climate change on the
ecogeomorphology of coastal wetlands. Estuaries and Coasts 31:447-491.
Deaton, C. D., Hein, C. J., and Kirwan, M. L. 2017. Barrier island migration dominates
ecogeomorphic feedbacks and drives salt marsh loss along the Virginia Atlantic Coast,
USA. Geology 45(2):123-126.
DeFisher, L. E. and Bonter, D. N. 2013. Effects of invasive European fire ants (Myrmica rubra)
on Herring Gull (Larus argentatus) reproduction. PLoS ONE 8(5): e64185.

57
Dietrich, J. C., Bunya, S., Westerink, J. J., Ebersole, B. A., Smith, J. M., Atkinson, J. H., Jensen,
R., Resio, D. T., Luettich, R. A., Dawson, C., Cardone, V. J., Cox, A. T., Powell, M. D.,
Westerink, H. J., and Roberts, H. J. 2010. A high-resolution coupled riverine flow, tide,
wind, wind wave, and storm surge model for southern Louisiana and Mississippi. Part II:
Synoptic Description and Analysis of Hurricanes Katrina and Rita. American
Meteorological Society 138:378-404.
Dinsmore, S. J., White, G. C., Knopf, F. L. 2002. Advanced Techniques for Modeling Avian
Nest Survival. Ecology 83(12):3476-3488.
Dueser, R. D., Moncrief, N. D., Keišs, Martin, J. D., Porter, J. H., and Truitt, B. R. 2013.
Overwater movement of raccoons (Procyon lotor) in a naturally fragmented coastal
landscape. Northeastern Naturalist 20(3):511-528.
Erwin, R. M., Eyler, T. B., Hatfield, J. S., and McGary, S. 1998. Diets of nestling Gull-billed
Terns in coastal Virginia. Colonial Waterbirds 21(3):323-327.
Erwin, R. M., Truitt, B. R., and Jimenez, J. E. 2001. Ground-nesting waterbirds and mammalian
carnivores in the Virginia barrier island region: Running out of options. Journal of
Coastal Research 17(2):292-296.
Erwin, R. M., Allen, D. H., and Jenkins, D. 2003. Created versus natural coastal islands: Atlantic
waterbird populations, habitat choices, and management implications. Estuaries
26(4a):949-955.
Favero, M., Mariano-Jelicich, R., Silva, M. P., Bo, M. S., and Garcia-Mata, C. 2001. Food and
feeding biology of the Black Skimmer in Argentina: evidence supporting offshore
feeding in nonbreeding areas.
Fern, R. R., Withers, K., Schoech, L. A. 2016. Reproductive success of nesting terns on the
central Texas coast. Regional Studies in Marine Science 8:14-19.
Fontaine, J. J. and Martin, T. E. 2006. Parent birds assess nest predation risk and adjust their
reproductive strategies. Ecology Letters 9:428-434.
Frederick, P. C. and Collopy, M. W. 1989. Nesting success of five ciconiiform species in relation
to water conditions in the Florida Everglades. The Auk 106(4):625-634.
Frederick, P. C., Bjork, R., Bancroft, G. T., and Powell, G. V. N. 1992. Reproductive success of
three species of herons relative to habitat in southern Florida. Colonial Waterbirds
15(2):192-201.
Gabrey, S. W., Wilson, B. C., and Afton, A. D. 2002. Success of artificial bird nests in burned
Gulf Coast Chenier plain marshes. The Southwestern Naturalist 47(4):532-538.
Guo, H., Zhang, Y., Lan, Z., and Pennings, S. C. 2013. Biotic interactions mediate the expansion

58
of black mangrove (Avicennia germinans) into salt marshes under climate change. Global
Change Biology 19:2765-2774.
Holcomb, S. R., Bass, A. A., Reid, C. S., Seymour, M. A., Lorenz, N. F., Gregory, B. B., Javed,
S. M., Balkum, K. F. 2015. Louisiana Wildlife Action Plan. Louisiana Department of
Wildlife and Fisheries. Baton Rouge, Louisiana.
Hoogensteen, M. J. J., Lantinga, E. A., Baker, E. J., Groot, J. C. J., and Tittonell, P. A. 2015.
Estimating soil organic carbon through loss on ignition: effects of ignition conditions and
structural water loss. European Journal of Soil Science 66:320-328.
Johnston, G. R. 2016. Drought increases the impact of introduced European foxes on breeding
Australian pelicans. Wildlife Research 43(6):507-514.
Kushlan, J. A. 1979. Feeding ecology and prey selection in the White Ibis. The Condor
81(4):376-389.
Laake, J.L. 2013. RMark: An R Interface for Analysis of Capture-Recapture Data with MARK.
AFSC Processed Rep 2013-01, 25p. Alaska Fish. Sci. Cent., NOAA, Natl. Mar. Fish.
Serv., 7600 Sand Point Way NE, Seattle, WA 98115.
Lantz, T. C., Kokelj, S. V., and Fraser, R. H. 2015. Ecological recovery in an Arctic delta
following widespread saline incursion. Ecological Applications 25:172-85.
Leberg, P. L., P. Deshotels, S. Pius, and M. Carloss. 1995. Nest sites of seabirds on dredge
islands in coastal Louisiana. Proceedings of the Annual Conference of the Southeastern
Association of Fish and Wildlife Agencies 49:356-366.
Lorenz, J. J., Langan-Mulrooney, B., Frezza, P. E., Harvey, R. G., and Mazzotti, F. J. 2009.
Roseate Spoonbill reproduction as an indicator for restoration of the Everglades and the
Everglades estuaries. Ecological Indicators 9S:96-107.
Lutmerding, J. A. and A. S. Love. Longevity records of North American birds. Version 2015.2.
Patuxent Wildlife Research Center, Bird Banding Laboratory 2015.
Maxwell, G. R. II and Kale, H. W. II. 1977. Breeding biology of five species of herons in coastal
Florida. The Auk 94(4):689-700.
Mayfield, H. 1975. Suggestions for calculating nest success. Wilson Bulletin 87:456-466.
McNease, L., Richard, D., and Joanen, T. 1992. Reintroduction and colony expansion of the
Brown Pelican in Louisiana. Proceedings of the Forty-sixth Annual Conference of
Southeastern Association of Fish and Wildlife Agencies (Atlanta, Georgia, SEAFWA),
pp. 223-229.
Meckstroth, M. and Miles, K. A. 2005. Predator removal and nesting waterbird success at San

59
Francisco Bay, California. The International Journal of Waterbird Biology 28(2):250
255.
Miller, C. 2002. Plant Fact Sheet: Marsh Elder. USDA NRCS.
https://plants.usda.gov/factsheet/pdf/fs_ivfr.pdf
Nyman, J. A., La Peyre, M. K., Caldwell, A., Piazza, S., Thom, C., and Winslow, C. 2009.
Defining restoration targets for water depth and salinity in wind-dominated Spartina
patens (Ait.) Muhl. Coastal marshes. Journal of Hydrology 376:327-336.
O’Connell, T. J. and Beck, R. A. 2003. Gull predation limits nesting success of terns and
skimmers on the Virginia barrier Islands. Journal of Field Ornithology 74(1):66-73.
Owen, T. M. and Pierce, A. R. 2013. Hatching success and nest site characteristics of Black
Skimmer (Rynchops niger) on the Isles Dernieres Barrier Island Refuge, Louisiana.
Waterbirds 36(3):342-347.
Perry, C. L. and Mendelssohn, I. A. 2009. Ecosystem effects of expanding populations of
Avicennia germinans in a Louisiana salt marsh. Wetlands. 29(1):396-406.
Plentovich, S., Hebshi, A., and Conant, S. 2009. Detrimental effects of two widespread invasive
ant species on weight and survival of colonial nesting seabirds in the Hawaiian Islands.
Biological Invasions 11:289-298.
R Core Team. 2019. R: A language and environment for statistical computing. R Foundation for
Statistical Computing, Vienna, Austria. URL https://www.R-project.org/.
Raynor, E. J., Pierce, A. R., Leumas, C. M., and Rohwer, F. C. 2012. Breeding habitat
requirements and colony formation by Royal Terns (Thalasseus maximus) and Sandwich
Terns (T. scandvicensis) on barrier islands in the Gulf of Mexico. The Auk 129(4):763
772.
Raynor, E. J., Pierce, A. R., Owen, T. M., Leumas, C. M., and Rohwer, F. C. 2013. Short-term
demographic responses of a coastal waterbird community after two major hurricanes.
Waterbirds 36(1):88-93.
Savoca, M. S., Bonter, D. N., Zuckerberg, B., Dickinson, J. L., and Ellis, J. C. 2011. Nesting
density is an important factor affecting chick growth and survival in the Herring Gull.
The Condor 113(3):565-571.
Selman, W., Hess, T. J., Salyers, B., and Salyers, C. 2012. Short-term response of Brown
Pelicans (Pelecanus occidentalis) to oil spill rehabilitation and translocation.
Southeastern Naturalist 11(1):G1-G16.
Selman, W. and Davis, B. E. 2015. First nesting records in southwestern Louisiana for American
Oystercatchers (Haematopus palliatus) and Reddish Egrets (Egretta rufescens), with

60
implications for dredge spoil island restoration. The Wilson Journal of Ornithology
127(2):326-332.
Selman, W., Hess, T. J., and Linscombe, J. 2016. Long-term population and colony dynamics of
Brown Pelicans (Pelecanus occidentalis) in rapidly changing coastal Louisiana, USA.
Waterbirds 39(1):45-57.
Seymour, M. 2007. Effect of red imported fire ant (Solenopsis invicta buren) on the nesting
success of Northern Bobwhite (Colinus virginianus l.). Thesis. Louisiana State
University.
Simons, E. L. R., and O’Connor, P. M. 2012. Bone laminarity in the avian forelimb skeleton and
its relationship to flight mode: testing functional interpretations. The Anatomical Record
295:386-396.
Sims, S. A., Seavey, J. R., and Curtin, C. G. 2013. Room to move? Threatened shorebird habitat
in the path of sea level rise – dynamic beaches, multiple users, and mixed ownership: a
case study from Rhode Island, USA. Journal of Coastal Conservation 17:339-350.
Storey, A. E. 1987. Adaptations for marsh nesting in common and Forster’s terns. Canadian
Journal of Zoology 65(6):1417-1420.
Strong, A. M., Bancroft, G. T., and Jewell, S. D. 1997. Hydrological constraints on Tricolored
Heron and Snowy Egret resource use. The Condor 99(4):894-905).
Suarez, A. V., Yeh, P., and Case, T. J. 2005. Impacts of Argentine ants on avian nesting success.
Insectes Sociaux 52:378-382.
Turner, R. E. and Streever, B. 2002. Approaches to Coastal Wetland Restoration: Northern Gulf
of Mexico. SPB Academic Publishing. Hague, The Netherlands.
US Fish and Wildlife Service. 2009. Endangered and threatened wildlife and plants; removal
of the Brown Pelican (Pelecanus occidentalis) from the federal list of endangered and
threatened wildlife. Federal Register 74:1-29.
Visser, J. M. and Peterson, G. W. 1994. Breeding populations and colony site dynamics of
seabirds nesting in Louisiana. Colonial Waterbirds 17(2):146-152.
Visser, J. M., Vermillion, W. G., Evers, D. E., Linscombe, R. G., and Sasser, C. E. 2005. Nesting
habitat requirements of the Brown Pelican and their management implications. Journal of
Coastal Research 21(2):e27-e35.
Walter, S. T., Carloss, M. R., Hess, T. J., and Leburg, P. L. 2013. Hurricane, habitat degradation,
and land loss effects on Brown Pelican nesting colonies. Journal of Coastal Research
29(6A):187-195.

61
White, D. H., Mitchell, C. A., and Cromartie, E. 1982. Nesting Ecology of Roseate Spoonbills at
Nueces Bay, Texas. The Auk 99(2):275-284.
Yeai, Z., Lieu, J., Yang, X., Zhang, M., Tang, C., and Wang, T. 2014. Impact of coastal wetland
restoration strategies in the Chongming Dongtan Wetlands, China: Waterbird community
composition as an indicator. Acta Zoologica Academiae Scientiarum Hungaricae 60(2):
185-198.

62
Vita
Karis Amanda Ritenour grew up in Bloomington, Minnesota and graduated Magna cum Laude
from Beloit College (Beloit, Wisconsin) in 2011 with a degree in Ecology, Evolution, and
Behavioral Biology. After an internship with USGS tracking and handling desert tortoises in the
Mojave Desert and a couple of years in the domesticated world caring for dogs and horses, the
International Crane Foundation in Baraboo, Wisconsin took Karis under their wing. She worked
several jobs over the course of two years: costume-rearing Whooping Crane chicks for release,
tracking and monitoring cranes in Wisconsin, on migration across four states, and at the
wintering grounds of the wild flock in south Texas. Hooked on birds, in 2016 she took a job as
an assistant to a PhD student studying predator-prey dynamics with Bachman’s Sparrows at Tall
Timbers Research Station, handling not only sparrows but snakes and rodents as well. A
fascination with the dynamics of nest survival took hold and she continued on to Louisiana State
University in January 2017. Upon completion of her master’s degree, she will seek to continue
ecological field research to aid in conservation.