nest predators of open and cavity nesting birds … · nest predators of open and cavity nesting...
TRANSCRIPT

Wilson Bull., 1 1 1(2), 1999, pp. 251-256
NEST PREDATORS OF OPEN AND CAVITY NESTING BIRDS IN OAK WOODLANDS
. KATHRYN L. PURCELL1.' AND JARED VERNER1
ABSTRACT-Camera setups revealed at least three species a l rodents and seven species of birds as potential predators at artificial open nests. Surprisingly, among avian predators identified at open nests, one third were Bullock's Orioles (Icreras Dallockii). Two rodent species and three bird species were potential predators at artificial cavity nests. This high predator diversity was consistent with previous studies, although the number of avian predators at apen nests was higher than expected. Received 31 March 1998, accepted 22 Nov. 1998.
As the primary source of nest failure among ifornia. Thc San Joaquin Experimental Range covers
birds 1968, ~ i ~ ~ ~ f ~ 1969). predation is about 1875 ha and ranges in elevation from 215 to 520
a likely factor affecting species' m. Climate is Mediterranean, with cool, wet winters and hot, dry summers. A sparse woodland overstory habitat selection, and conservation (Zimmer-
blue oak (Q,,ercr,s do,,glnsii), interior live oak (Q, Inan 1984; Martin 1988a, b). When nest pre- wlslizenii), and foothill pine (Pinus sabinianu) covers dation differs among species, habitats, and 10- most of the San Joaquin Experimental Range. A scat- cations, it can influence life history traits such tered understory of shrubs includes mainly wedgeleaf as clutch size, nest placement, developmental ceanothus (Crunotlm csnenrer), chaparral whitethorn
known about predators of bird nests because situated artificial open nests law in small trees or predation is rarely observed, and observations shrubs in positions similar lo those known to be used
are biased toward diurnal predators. Some re. by California Towhees (on a forked branch or sup-
searchers have made assumptions about broad ~ O n e d by several twigs). At cavity setups. eggs were
classes of predators based oq the appearance placed with a "pick-up" tool, using cavities known to be deep enough for cavity-nesting species at the San
Of the depredated nest' but few data exist to Inaquin Experimental Range. Most cavities were ex-
support those assumptions, and authors dis- cavated by primary cavity nesters, but some natural agree on evidence used to assign depredated cavities previously used for nesting were also used. A nests to predator groups and the reliability of fiberscope (Purcell 1997) was used to guide the place- the evidence (Best 1978, Best and Stauffer ment of eggs in cavities, to monitor eggs lor possible 1980. Wrav et al. 1982. Boag et al. 1984. Her- predation, and to measure cavity depth. To avoid leav-
nandez et ;I. 199% ~arini-and Melo 1998). Here we report results of a camera study at both artificial open and cavity nests. The pri- mary objective of our study was to identify nest predators as part of a larger study of re- productive success among birds in oak-pine woodlands in the west-central foothills of the Sierra Nevada of California.
STUDY AREA AND METHODS The study was done at the San Joaquin Experimen-
tal Range, approximately 40 krn north of Fresno, Cal-
' USDA Forest Service, Pacific Southwest Research Station, 2081 E. Sierra Ave.. Fresno, CA 93710.
'Corresponding author: E-mail: kpurcell/psw-fresnoefs.fed.us
ing olfactory cues at nests, field personnel washed their hands before going into the field with a soap developed to remove human scent and sprayed their boots with a scent masker. We avoided dead-end trails and did not create paths that might lead predators to nests.
One experimental e m was placed in o w n nests. and .- one or two eggs were placed in cavity nests, the num- ber and type depending on availability. Most eggs used in apen nests were from wild House Sparrows (Passer dotnesricus) or captive Ringed Tunle-Doves (Sfreplo- pelin risorio); most eggs in cavities were from captive Zebra Finches (Poeplzilu gsllafa). We sometimes used a Buttonquail (Tumix sp.) egg as the second egg in a cavity nest. House Sparrow eggs were slightly smaller and Ringed Tuctle-dove eggs slightly larger than those of California Towhees (see Baicich and Harrison 1997). Although similar in size to eggs of the Plain Titmouse (Bncolopluts i,tor,tares), the Zebra Finch

252 THE WILSON BULLETIN. Vol. 111, No. 2. June 1999
eggs werc smaller than eggs of all cavity-nesting spe- cies in our study area.
Predation at open nests was monitored mechanical- ly, with an egg encircled by a loop of wire attached within a nesi of the California Towhee. Removal of the egg activated an electrical signal to a solenoid, trip- ping a camera mounted nearby. We used inexpensive, autofocus, autoflash, Keystone 550D or 590AF cnm- ems, allowing idcnlification of both diurnal and noc- turnal predators. (Trade names and commercial prod- ucts are mentioned for information only: no endorse- ment by the U.S. Department of Agriculture is im- plied.) Details on the mechanical system for open ncsts are available fioln KLI? At cavity nests, we used Trail- master Active Infrared trail rnonitors with weather- proof, autoflash 35 mm cameras lo monitor predation. One box that transmitted (12.1 c m L X 8.3 cm W X 4.6 cm D) and one that receivcd (19.1 cm L X 8.9 cm W X 5.3 cm D) the infrared beam were placed on each side of the cavity so lhat an animal entering it would break the beam, triggering the camera positioned on a nearby branch with a good view of the cavity. Because Trailmaster units are designed to be set up horizontally across trails, we modified the boxes so they could be attached easily to the tree bolt or limb with bungee cards. Sensitivity was set at the minimum delay of 0.5 s (one pulse) before an event was recorded, and the camera delay between photos was set at the minimum of 6 s.
Based a n the nesting seasons of cavity- and open- nesting species, cameras wcrc set up from March through June 1995 (cavities) and April through June 1995 (open). We used 10 open-nest setups to monitor 70 open nests, and 7 Trailmaster monitors st 61 cavity nests. Some dam on cavity nests were also included from the 1993 nnd 1994 field seasons (eight each year). All setups were checked about every 4 days. If an egg was taken, or not taken after 14 days, the setup was dismantled and moved to another location and installed using fresh eggs.
All artificial ncsts of the same nest type were sep- arated by at least 200 m in an effort to reduce the chance of visitation by the same animal at two or more setups. This distance was thought to be enough to as- sure independent samples of thc small mammals iden- tified as predators in lhis study. Based an spot mapping at the San Joaquin Experimental Range (unpublished data), territories of the Western Scrub-Jay (Aphrloco- ma cal(fomico), a common nest predator, were ap- proximately 120-210 m in diametel: Mean territory diameters ol' other common bird species ranged Crom 180 m (California Towhee) to 310 m (Western King- bird, Ty,nmss verricalis). Some cavity sctups werc closer than 200 m to open set-ups, but cameras and eggs were not placed concurrently at the two nest types.
At open nesls, we measured nesl height and the height and diameter of thc shrub or small ttec conlain- ing the nest. Diameter was measured as the mean o l the maximum crown diameter and the widest diameter perpendicular to thc maximum diameter. At cavity
nests, we measured nest height, cavity depth, and hor- izontal and vertical entrance diameters. We tested dif- ferences in these attributes between predated and un- predated nests using two-tailed r-tests (SAS version 6.12 for Windows, SAS Institute 1988). a = 0.05, and Bonferroni adjustments for mulliple tests. We calcu- lated power according to Abramowitz and Stegun (1964) based an specified effect sizes. an a of 0.05, and two-tailed tests using an inhouse SAS program.
RESULTS
Open nests.-Eggs were removed from 39 of the 70 open nest setups, but we could iden- tify the animals at only 29 of those. Rodents were identified at four (14%): deer mouse (Peromyscus spp., two cases), California ground squirrel (Spermophilcrs beecheyi, one case), and Merriam's chipmunk (Eutamias mert-iami, one case). At least five bird species were photographed at the remaining 25 nests (86%) from which an egg was taken: Western Scrub-Jay (12 cases), Bullock's Oriole (Icter- us bullockii, 7 cases), Acorn Woodpecker (Melanerpes fortnicivorus, I case), Westem Kingbird (I case, a pair), and California To- whee (1 case). We could not identify the bird species at the three remaining setups.
In three additional cases, eggs were pecked, chewed, or otherwise damaged but not re- moved. A pair of Plain Titmice pecked a large hole in the egg at one nest; a female Brown- headed Cowbird (Molothrus ater) punctured the egg in another nest; and either a dusky- footed woodrat (Neotoma fuscipes) or a West- ern Scrub-Jay chewed or pecked another egg (both species were photographed).
We may have underestimated nocturnal pre- dation. Only one photo of a deer mouse was taken at night. In 2 of the 10 cases with no identifiable predatol; photos were taken at night but were dark, perhaps because the cam- era's flash was too far from the nest or failed to operate properly (see also Hernandez et al. 1998b).
No atwibute measured at open nest setups differed significantly between predated and . i nonpredated nests (Table 1 ; P > 0.05 in all cases, P < 0.017 required for Bonfelroni ad- justment for multiple tests).
Cavity nests.-Photos were taken at 47 of 69 cavity nests where the egg was removed or pecked open. Interpretation of the photos was complicated, howevel: First, the mini- mum camera delay did not allow a photo each

Psrcell and Venler . NEST PREDATORS 253
TABLE I . Nest site variables and results of r-tests for nonpredated (n = 18) and predated (n = 48) open nests a1 the San Joaquin Experimental Range.
Nanprcdrlcd open ncrtn Mern (SE)
Predated opcn nerir Mern (SE)
Nest height (m) 1.21 (0.1 I) I . l l (0.06) 0.48 0.97" Substrate height (m) 4.61 (0.81) 4.25 (0.41) 0.67 0.91' Substrate diameter (m) 6.03 (1.34) 4.90 (0.40) 0.43 0.8ZS
" A Pwtue of0.017 is necdcd for rignificmcc ri o = 0.05 rher Bonfemni ndjurlmcnt for nmllple comyssonr. hn3s.d on m d f m size of bsm. r Brscd on m cmc, rile or 3 m.
time the infrared beam was broken after an initial photo was taken. Consequently, photos rarely showed animals leaving a cavity nest and none showed one "caught in the act" of leaving with an egg. We had to assume that an animal in a photo consumed the missing egg. Second, in seven cases the egg was gone and no animal was evident in the photo (see also Brooks 1996). The departure of some predators £rom a cavity may have been too rapid for it to he caught in the photo, or photos with no animal may have resulted from direct sunlight entering the receiver window (Kucera and Barrett 1993). Third, in 15 instances more than one species entered the cavity and tripped the camera before we found that the egg was gone. Fourth, in 16 cases nest material was added to the cavity by birds or manunals so we could not ascertain whether the eggs had been eaten or simply buried. We did not in- clude these cases in our comparisons of pre- dated and nonpredated nests.
In nine cavity setups with missing eggs, only one species appeased in the photos. The assumed predators were European Starling (Sturnus vulgaris; four cases), House Wren (Troglodytes aedon; one case), Western Blue-
bird (Sialia mexicana; one case), deer mouse (one case), and unidentified squirrels (proba- bly California ground squirrels; two cases). All photos were taken during daylight hours except that of the deer mouse.
No attribute measured at cavity nests dif- fered significantly between predated and non- predated nests (Table 2; P > 0.05 in all cases, P < 0.01 required after adjusting for multiple tests).
DISCUSSION
Our results are consistent with other studies using artificial nests in finding a high diversity of nest predators, ranging from six to nine species (Henry 1969, Wilcove 1985, Reitsma et al. 1990, Leimgruber et al. 1994). We iden- tified eight species at open nests, and two (possibly three) other species pecked or pierced eggs. Picman and Schriml (1994) found only one or two major predator species in each of four vegetation types, although predator diversity ranged from four (marsh) to nine species (scrubland and forest). Lack of independence of the setups in their study may have overestimated the importance of some predator species (see below). Interestingly, all
TABLE 2. Nest site variables and results of r-tests far predated and nonpredated cavity nests at the San Joaquin Experimental Range.
Nanpredared ewiiirr Predrled caviticr
Mean (SE) Mern (SE) P Power
Nest height (m) 3.82 (0.24) 35 3.78 (0.23) 32 0.90 0.98" Depth (cm) 25.1 (1.94) 35 31.0 (2.42) 31 0.06 0.95" Vertical entrance diameter (cm) 5.68 (0.67) 34 5.06 (0.16) 30 0.37 l.OOd Horizontal entrance diameter (cm) 5.19 (0.19) 34 5.14 (0.13) 30 0.83 0.9V Minimum entrance diameter (cm) 4.80 (0.15) 34 4.94 (0.14) 30 0.51 0.99"

254 THE WILSON BULLETIN - Vol. 111. No. 2. J w e 1999
but one (Acorn Woodpecker) of the avian predators at open nests in our study were open nesters and all avian predators at cavity nests were cavity nesters.
We know of only two efforts to study pre- dation at experimental cavity nests (Wilcove 1985, Sandstrom 1991). neither of which identified predators. Although some species photographed at our cavity setups may have been only reconnoitering potential nest sites, they may also oppolTunistically eat eggs thus encountered in a cavity. The importance of birds as predators at active cavity nests, de- fended by nesting birds, is unknown but prob- ably significant in some instances. European Starlings are known to usurp nest sites from other bird species (Troetschler 1976, Ingold 1989) and, although the contents of the cavi- ties were unknown, eggs were likely present in some when usurpation occuvred late enough in the nesting cycle for egg-laying or incu- bation to have begun. Our results suggest that starlings probably consume eggs in the course of usurping nest sites.
Although several species of corvids arc bc- lieved to be important predators at open nests (Yahner and Wright 1985, Yabner and Scott 1988, Anbin 1992, Picman and Sch~iml 1994, Hannon and Cotterill 19981, nest pre- dation at open nests by noncorvids has not often been documented. Gates and Gysel (1978) reported anecdotal evid6nce of nest predation by an Eastern Screech-Owl (Otus asio). Picman (1987) photographed Marsh Wrens (Cistothorus palusrrus), House Wrens, and Gray Catbirds (Dumetella carolinensis) predating nests. Picman and Schiml (1994) recorded predation events by Broad-winged Hawks (Buteo platypterus), Eastern Mead- owlarks (Srurnella magna), and Red-winged Blackbirds (Agelaius phoeniceus). The Marsh Wren was the only predator recorded at nests of Yellow-headed Blackbirds (Xauthocephal- us xarzthocephalus; Picman and Isabelle 1995). Predation of open nests by woodpeck- ers has been documented rarely (Bent 1939; Watt 1980; Hernandez et al. 1998a, b; Robert Cooper, unpubl. data), and never by the Acorn Woodpecker. Egg removal by Bullock's Ori- oles was su~pisingly common in this study. Both sexes of this oriole are known to be ejec- tors of Brown-headed Cowbird eggs, and they sometimes consume the eggs before removing
the shells (Sealy and Neudorf 1995). Al- though some of these "predators" may de- stroy nests or eggs with no nutritional moti- vation, predation of open nests by noncorvids may he more frequent than previously thought.
Leimgruber and coworkers (1994) and Pic- man and Schriml (1994) also found that po- tential predators visiting nests did not always eat the eggs. Consistent with the findings of Picman and Schriml, mammals in our study nearly always took the egg. Picman and Schriml (1994) classified as "accidental visi- tors" several bird species that visited nests, including Red-winged Blackbirds, that appar- ently ate eggs at 6 of 29 nests visited. Re- gardless of motivation, the effect of egg re- moval on the nesting birds is the same.
Artificial nest studies are just that-artifi- cial; some biases are certainly involved (Mar- tin 1987, Reitsma et al. 1990, Whelan et al. 1994, Marini and Melo 1998, Wilson et al. 1998). As visual predators, birds may key in on cameras or umealistic nest placements, or they may follow field workers and learn to associate conspicuous makers at nests with food (Picozzi 1975, Gotmark 1992). At open nests we were able to attain a realistic nest placement or a good camera view, but usually not both. At cavity nests, the transmitters and receivers may have inhibited predators fvom going to a cavity or may have attracted curi- ous predators. Predation also may have been more or less likely at artificial nests than real nests defended by adult birds, but even real nests are left unattended at regular intervals. In spite of these potential biases, we feel that useful data can be obtained from studies of artificial nests because they establish baseline data in an arena where so little is known.
We believe that the value of studies using artificial nests can be substantially increased if studies are designed more carefully to re- duce potential biases. For example, most of the studies we reviewed used distances he- tween setups ranging from 20 to 60 m. Such short intervals risk detection of the same in- dividual predator at two or more setups, vio- lating assumptions of independence. Ideally, the distance between artificial nests should ex- ceed the largest home-range diameter of the suite of likely predators. One might argue that shorter distances are appropriate for examin-

P!rrccll and Vrmer NEST PREDATORS 255
ing predation rates, although rates from arti- ficial nest studies are of questionable value for extrapolation to natural conditions (Martin 1987, Whelan et al. 1994, Wilson et al. 1998). Replication over large iueas is required to chaactdrize the suite of predators for a given vegetation type, since predators are often un- evenly distributed in space and time.
Further problems of independence may have occutl-ed in studies that replaced eggs in nests that had been predated previously. Nour and coworkers (1993) suggested that such egg replacement may not be a problem in studies using plasticine eggs or eggs made from mod- eling clay because the eggs are not eaten and provide the predator no incentive to return, although predators could avoid nests with clay eggs because of prior negative conditioning.
ACKNOWLEDGMENTS
We thank L. nnd S. Garner for instlwctions to con- struct the camera apparatus lo photograph nest preda- tors at open nests. We were aided in the field by K. Kalin, R. Miller, and, especially, by D. Cubenski and I. Ohanesian, who improved the apen-nest apparatus. The ~uanuscript benefitted from reviews by S. Hejl, C. Maguire, C. Meslow, W. Laudenslayel; L. Reitsma, C. Whelan, and three anonymous reviewers.
LITERATURE CITED
ABRAMowlrL, M. AND I. A. STEGUN. 1964. Handbook of mathematical Cunclions. Dover Publications, New York.
ANonBN, H. 1992. Corvid densit9 and nest predation i n relation to lbrest fragmentation: a landscape perspective. Ecology 73:794-804.
BAlCtCH, P I. AND C. I. 0. HARRISON. 1997. A guide ta the nests, eggs, and nestlings of North Ameri- can birds, sccand cd. Academic Press, Sun Diega, California.
BEN^, A. C. 1939. Life histories of North American woodpeckers. US. Nat. Mus. Bull. 174-334.
BEST, L. B. 1978. Field Sparrow reproductive success and nesting ecology. Auk 95:9-22.
BEST, L. 6. AND D. STAUWER. 1980. Factors affect- ing nesting success in riparian bird communities. Candor 82:149-158.
BOAG, D. A,, S. G. REEBS, AND M. A. SCHROEDER. 1984. Egg loss among Spruce Grouse inhabiting lodgepole pine forests. Can. J. Zool. 62:1034- 1037.
BROOKS, R. T. 1996. Assessment of two camera-based systems for monitoring a~boreal wildlife. Wildl. Soc. Bull. 24:298-300.
GATES, I. E. AND L. W. GYSEL. 1978. Avian nest dis- persion and fledging success in field-forest eco- tones. Ecology 59871-883,
GOT~~ARK, F. 1992. The effects of investigator distur- bance on nesting birds. Cuu. Omithol. 9:63-104.
HANNON, S. J . AND S. E. COTTERILL. 1998. Nest pre- dation in aspen woodlots in an agricultural area in Alberta: the enemy from within. Auk 115: 16-25.
HENRY, V. G. 1969. P ~ d a t i o n on dummy nests of ground-nesting birds in the southern Appala- chians. I. Wildl. Manage. 33:169-172.
HERNANDEZ, E, D. ROLLINS, AND R. CANTU. 19988. Evalualing evidence to identilji gl-ound-nest pred- aton in west Texas. Wildl. Soc. Bull. 255326-811.
HERNANDEZ, E, D. ROLLINS, AND R. CANTU. 1998b. An evaluation of Trailmaster camera systcms for idcn- tilying ground-nest predators. Wildl. Soc. Bull. 25:848-853.
KUCERA. T. E. AND R. H. BAKRETT. 1993. The Trail- master camera system for detecting wildlile. Wildl. Soc. Bull. 21505-508.
LACK, D. 1954. The natural regulation of animal n u m - bers. Oxlord Univ. Press, London, U.K.
LACK, D. 1968. Ecological adaptations lor breeding in birds. Methuen. London, U.K.
LEIMGRUBER, P., W. J. MCSHEA, AND J. H. RAPPOLE. 1994. Predation on artificial nesls in large forest blocks. J . Wildl. Manage. 58:254-260.
MARINI, M. A. AND C. MELO. 1998. Predators o l quail eggs, and the evidence o l the remains: implica- tions lor nest predation studies. Condor 100395- 399.
MART~N, T E. 1987. Anificial nest experiments: effects of nest appearance and type of predator. Condor 89925-928.
MARTIN, T. E. 1988a. Processes organizing open-nest- ing bird assemblages: competition or nest preda- tion? Evol. Ecol. 2:37-50.
MARTIN, T E. 1988b. On the advantage of being dif- ferent: nest predation and thc coexistence of bird species. Proc. Nat. Acad. Sci.. USA 85:2196- 2199.
MARTIN, T. E. 1988~ . Nest placement: implications lor selected life-history trails, with special rcfcrence to clutch size. Am. Nat. 132900-910.
MARTIN, T. E. 1995. Avian life history evolution in relation to nest sites, nest pmdation, and food. Ecol. Monozr. 65:lOl-127. -
NICE, M. M. 1957. Nesting success in altricinl birds. Auk 74305-32 I .
NOUK, N., E. MAITHYSEN, AND A. A. DHONDT. 1993. Artificial nest predation and habitat fragmentation: different trends in bird and mammal predators. Ecography 16:111-116.
PICMAN, J. 1987. An inexpensive camera setup for the study of egg predation at anificial nests. J . Field Omithol. 33372-382.
PICMAN, 1. AND A. ISABELLE. 1995. Sources al mortality and correlates of nesting success in Yellow-head- ed Blackbirds. Auk 112:183-191.
PICMAN, I. AND L. M. SCHRNL. 1994. A camera studv of temporal patterns of nest predation in different habitats. Wilson Bull. 106:456-465.
256 THE WILSON BULLETIN - Vol. 111. No. 2, June 1999
Pcozzb, N. 1975. Crow predation on marked nests. I. Wildl. Manage. 39:151-155.
PURCELL, K. L. 1997. USC of a fiberscope ror exam- ining cavity nests. 1. Field Omithol. 68:283-286.
R E ~ S M A , L. R., R. HOLMES, AND T. W. SHERRY. 1990. Effects of removal or red stquirrels. Tomins- cirons hedsonicas, and eastern chipmunks, Tan- ias srriarus, on nest "redation in a northern hard- wood lorest: an artificial nest experiment. Oikos 57:375-380.
RICKLEFS, R. E. 1969. An analysis of nesting mortality in birds. Smithson. Contrib. Zool. 9:l-48.
SANDSTR~M, U. 1991. Enhanced predation rales on cavity bird nests at deciduous h e s t edges-an experimental study. Ornis Fenn. 65293-98.
SAS INSTITUTE. 1988. SASISTAT user's guide: statis- tics. Release 6.03. SAS Institute, Inc., Cary, North Carolinia.
SEALY. S. G. AND D. L. NEUDORF. 1995. Male Northern Orioles eject cowbird eggs: implications for the evolution of rejection behavior. Condor 97:369- 375.
WAIT, D. I. 1980. Red-bcllied Woodpecker predation
on nestling American Redstans. Wilson Bull. 92: 249.
WAELAN, C. J., M. L. DILOER, D. ROBSON, N. HALLYN, AND S. DILGER. 1994. Effects of olfactory cues on artificial-nest experiments. Auk 11 1:945-952.
WRCDVE, D. S. 1985. Nest predation in forest tracts and the decline of migratory songbirds. Ecology 66121 1-1214.
WILSON, G. R., M. C. BRITTINCHAM, AND L. J . GODD- RICH. 1998. Haw well do artificial nests estimate success of teal nests? Condor 100:357-364.
WRAY, T 11, K. A. STm1.r. AND R. C. WHITMORE. 1982. Reproductive success or grassland sparrows on a reclaimed surface mine in West Virginia. Auk 99: 157-164.
YAHNER, R. H. AND D. P. SCOTL.. 1988. Efrecls of forest fragmentation on depredation of artificial nests. 1. Wildl. Manage. 52158-161.
YAHNER, R. H. AND A. L. WRIGHT. 1985. Depredation on artificial ground nests: cffecls of cdgc and plot age. J. Wildl. Manage. 49508-513.
ZIMMERMAN, J. L. 1984. Nest predation and its rela- tionship to habitat and ncsl densily in Dickcissels. Condor 86:68-72.

FLUCTUATING POPULATIONS OF HOUSE WRENS AND BEWICK'S WRENS IN FOOTHILLS OF THE
- WESTERN SIERRA NEVADA OF CALIFORNIA'
JARED VERNER AND KATHRYN L. PURCELL USDA Forrsl Scr-vice Prrcijic So~rrlt~v?sr Re.rr.ox11 Slotio,r, 2081 Errs1 Siewrr A w u e , Frrsrm, CA 93710,
e-nloil: jver,~erfp.w f~es~~o@fs . , fedrrs
Absrruci. In roothills of thc wcstern Sierra Nevada, 31 km cast of Madern, Calirornia, we studied whcthc~ Bcwick's Wrcns (Tlr,yo,no,m bewickii) lend to bc cxcludcd rrom an arm occupicd by Housc Wrcns (T~aglodyres oedorl) as reportcd in several studies in thc castern Unitcd Statcs. Ncithcr point counts from 1985 to 1997 nor spot mapping ltom 1989 to 1993 sueecsts anv interaction between these snccics. The studv ~criod includcd the most
winrcr months preceding survey counts. Wc spcculatc that Housc Wrcns cannot maintain their numbers by local recruitmenl during droughts in thc oak-pine woodlands that dominate our study area and that rccovery of thcirbopul&on following droughts involvcs rccruitmcnt from other areas, probably riparia11 zones and other mesic habitats clscwhcrc i n thc Sierra foothills and Central Vallcv of California. Thcrc was no infiucncc or vrcci~itation on abun- dance of Bewick's Wrens and, although they apparently sustaincd heivy iiot.lalily during a pcriad of extrcme winter wcather, their numbers othcrwisc wcrc not rclatcd to thc lowest tcmpcraturc during the winter preceding counts.
K q , ~vo~rls: Bcwick's Wren, Hoesc Wren, i~nerspcc~fk compcririo,~, popdrrrio,, rrrnds, p~cipiroriorz, Thryomanes bewickii, Troglodytes aedon.
INTRODUCTION nedy and White (19961, using nest boxes, found
Declining numbers of Bewick's Wrens (Th~yo- manes bewickii) have been well documented over nn~ch of the species' range in the eastern and midwestern United States (Wilcove 1990, Kennedy and White 1996). In Gite of the fact that evidence is mainly cil-cumstantial, probably the most widely held opinion is that Bewick's Wrens have declined in the face of expanding populations of House Wrens (Troglodytes ae- don) (Simpson 1978, Wilcove 1990, Kennedy and White 1996). Some observers have reported overt aggression and interspecific territo~iality between the species (Roads 1929, Brooks 1947, Newman 19611, hut we know of no study that has established a direct cause-and-effect relation between the invasion of House Wrens tnto an area and the consequent disappearance of Be- wick's Wrens. Alternate explanations warrant at- tention (Mengel 1965, Simpson 1978, Wilcove 1990).
In the most compelling study to date of inter- actions between breeding populations of these two species east of the Rocky Mountains, Ken-
' Received 7 April 1998. Acccptcd 12 January 1999.
that destruction of eggs or nestlings by House Wrens accounted for 81% of the nesting failures of Bewick's Wrens in their study area near Man- hattan, Kansas. They suggested that "range ex- pansion by nest-vandalizing House Wrens, prob- ably related to long-term habitat changes such as widespread secondary growth on abandoned agricultural land . . . , may be sufficient to ex- plain the declining numbers and contracting ranges of Bewick's WI-ens."
Few studies of interacdons between these spe- cies have been reported from west of the Rocky Mountains. Root (1969) suggested interspecific territoriality in a limited study in coastal Cali- fornia. Kroodsma (1973), on the other hand, I-e- ported extensive overlap anlong terrilories of Bewick's and House Wrens a1 the Finley Na- tional Wildlife Refuge in western Oregon. Be- wick's Wrens are permanent residents and House Wrens are migrants in both of these re- gions.
Both species breed in oak-pine woodlands in the western foothills of the Sie~ra Nevada of Califoniia. At the Sat1 Joaquin Experimental Range (SJER) we have been monitoring the rel- ative abundance of breeding bird species since
220 JARED VERNER AND KATHRYN L. PURCELL
1985 and report here on a comparison of the year-to-year changes in counts of House and Be- wick's Wrens. We test the null hypothesis that annual changes in counts of Bewick's Wrens are unrelated to annual changes in counts of House Wrens. Alternate hypotheses are that (I) counts of the two species exhibit opposite trends from year to year, and (2) counts of the two species exhibit parallel trends from yea- to year. The for- mer hypothesis corresponds to expectation if range expansion by House Wrens results in dis- placement of Bewick's Wrens.
Using 5 years of spot-mapping data (1989- 1993) on two 30-ha grids at SJER, we also ex- plore the spatial relations among song perches and territorial boundaries of these two species for evidence of interspecific competition or avoidance: were song perches of Bewick's Wrens less likely to occur near those of House Wrens, or vice versa, and were their territories exclusive?
METHODS
STUDY AREA
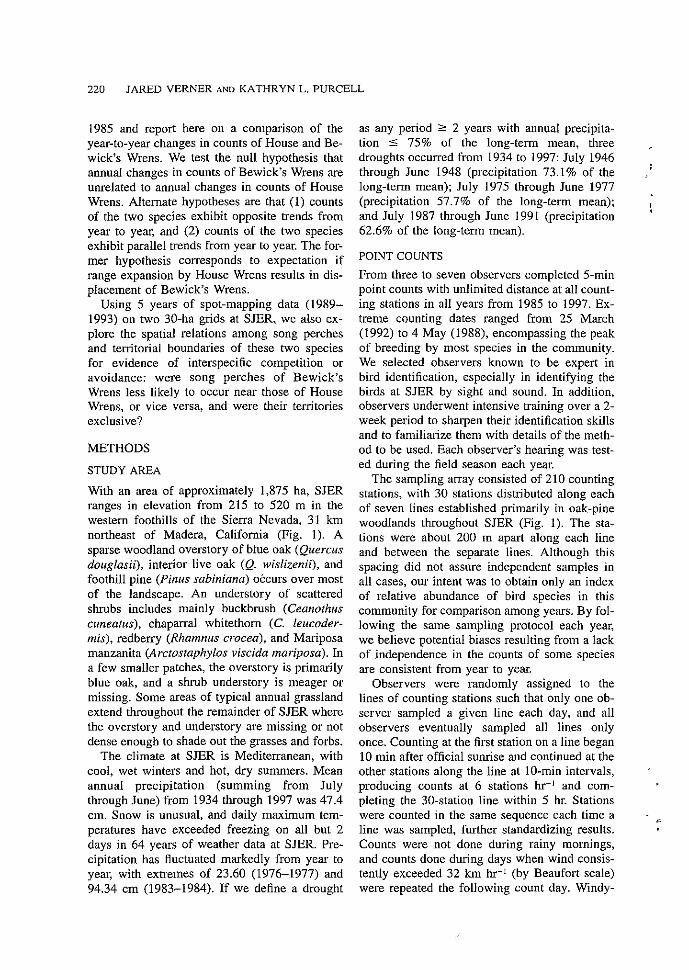
With an area of approximately 1,875 ha, SJER ranges in elevation from 215 to 520 m in the western foothills of the Sierra Nevada, 31 km northeast of Madera, California (Fig. 1). A sparse woodland overstory of blue oak (Quercus douglasii), interior live oak (Q. wislizenii), and foothill pine (Pinus sabiniana) occurs over most of the landscape. An understory of scattered shrubs includes mainly buckbrush (Ceanofhus cunearus), chaparral whitethorn (C. leucoder- mis), redberry (Rhamnus crocea), and Mariposa manzanita (Arctostaphylos viscida mariposa). In a few smaller patches, the overstory is primarily blue oak, and a shrub understory is meager or missing. Some areas of typical annual grassland extend throughout the remainder of SJER where the overstory and understory are missing or not dense enough to shade out the grasses and forbs.
The climate at SJER is Mediterranean, with cool, wet winters and hot, dry summers. Mean annual precipitation (summing from July through June) from 1934 through 1997 was 47.4 cm. Snow is unusual, and daily maximum tem- peratures have exceeded freezing on all hut 2 days in 64 years of weather data at SJER. Pre- cipitation has fluctuated markedly from year to year, with extremes of 23.60 (1976-1977) and 94.34 cm (1983-1984). If we define a drought
as any penod 2 2 years with annual precipita- tion 5 75% of the long-tern1 mean, three , droughts occurred from 1934 to 1997: July 1946 through June 1948 (precipitation 73.1% of the i
long-term mean); July 1975 through June 1977 (precipitation 57.7% of the long-term mean): , and July 1987 through June 1991 (precipitation 62.6% of the long-term mean).
POINT COUNTS
From three to seven observers completed 5-min point counts with unlimited distance at all count- ing stations in all years from 1985 to 1997. Ex- treme counting dates ranged from 25 March (1992) to 4 May (1988), encompassing the peak of breeding by most species in the community. We selected observers known to he expert in bird identification, especially in identifying the birds at SJER by sight and sound. In addition, observers underwent intensive training over a 2- week period to sharpen their identification skills and to familiarize them with details of the meth- od to be used. Each observer's hearing was test- ed during the field season each year.
The sampling array consisted of 210 counting stations, with 30 stations distributed along each of seven lines established primarily in oak-pine woodlands throughout SJER (Fig, 1). The sta- tions were about 200 m apart along each line and between the separate lines. Although this spacing did not assure independent samples in all cases, our intent was to obtain only an index of relative abundance of bird species in this community for comparison among years. By fol- lowing the same sampling protocol each year, we believe potential biases resulting from a lack of independence in the counts of some species are consistent from year to year.
Observers were randomly assigned to the lines of counting stations such that only one ob- server sampled a given line each day, and all observers eventually sampled all lines only once. Counting at the first station on a line began 10 min after official sunrise and continued at the other stations along the line at 10-min intervals, producing counts at 6 stations hr-' and com- pleting the 30-station line within 5 hr. Stations were counted in the same sequence each time a . line was sampled, f h h e r standardizing results. Counts were not done during rainy mornings, and counts done during days when wind consis- tently exceeded 32 km hr-' (by Beaufort scale) were repeated the following count day. Windy-

HOUSE AND BEWICIC'S WREN POPULATIONS 221
FIGURE I . General location map and boundary map of thc San Joaquin Expcrimcntal Rangc in foothills of the Sierra Nevada, California, showing locations of point-counting stations along each of thc scvcn sampling lines (A-G): the two spotmapping grids are shown as shaded rectangles. Calilbrnia Stalc Highway 41 bisects the study area just wcst of sampling line E.
day counts were not included in the present anal- ysis.
Results presented here are based on means of the total counts of each species by all observers each year Pooling results of at least three oh- servers was shown earlier by Verner and Milne (1989) to be a sufficient control for observer variability in this vegetation type, reducing Type I statistical ertors to the 5% level assumed by an alpha of 0.05, as opposed to a rate of 17%
when counts by single observers were com- pared.
SPOT MAPPING
In a detailed study of the spot-mapping method from 1985 through 1993, we estimated the num- bers of territorial birds on two plots 660 X 450 m, gridded at 30-m intervals (Fig. 1). One, the "grazed plot," had been grazed at a moderate level, probably for at least 100 years. The o t h e ~

222 JARED VERNER A N D KATHRYN L. PURCELL
the "ungrazed plot," was similarly grazed until 1934, when it was closed to grazing. Steel fence posts bearing alphanumeric codes identified each grid intersection. Methods generally fol- lowed international standards (Anonymous 1970, Robbins 1970) during the early years of the study but included some important excep- tions in laler years as we learned more about the method. Consequently, only results from 1989 through 1993 have been used in the present anal- ysis because our methods were well standard- ized by 1989 and we continued spot mapping only through 1993.
Dates of the first visit to the plots ranged from 22 to 28 March, and dates of the last visit ranged from 26 to 30 April. Members of the field crew most skilled in bird identification did the bil-d surveys on the plots, while other observers searched for nests and/or followed individuals, pairs, and family groups of individual species lo augment results of the spot mapping. Each year, three or four spot mappers completed four or three visits each, respectively, to each of the two plots (total of 12 visits), with random assign- ments to starting points on the grid. Because dai- ly visit maps were digitized each day, species maps could be produced at any time during the survey period when the field crew wished to re- view them to guide their subsequent field efforts. When 12 visits were compleled at each plot, fi- nal species maps were computer generated, the spot mappers collectively interpreted them to at- tain consensus, and lines were drawn around clusters of mapped locations (registrations) judged to indicate territories.
From these mapping effolls, we examined the spatial relations between territories of the two species and between locations of their song perches, using only song perches located visu- ally (hereafter, song posts). We plotted locations of song posts on maps ofthe two plots, grouping them into four sets of three consecutive survey dates (i.e., visits 1-2-3, 4-5-6, 7-8-9, and 10- 11-12) so that mapped song posts of the two species were relatively contemporary. If a sing- ing bird was located at the same song post on more than one visit in any group of three visits, we tallied each instance because repeated use of the same song post was an added measure of a male's tendency to stake its claim over space within a given cell in the mapping grid.
Using cells 30 X 30 m, we tallied for each of the four grouped survey intervals (1) the number
of song posts located for each species, as mapped by observers each day, (2) the number of cells with one song post, two song posts, etc., (3) the number of cells with Bewick's Wren song posts that also contained at least one House Wren song poa, and (4) the number of cells with House Wren song posts that also contained at least one Bewick's Wren song post. This pro- cedure was repeated using cells 50 X 50 m in an effort to make some allowance for scale ef- fects in tenitory sizes of the two species. Sample size for these analyses was 40 (5 years X 2 plots X 4 grouping intervals).
The number of House Wren (HOWR) song posts expected in cells with Bewick's Wren (BEWR) song posls =
Number of cells with BEWR songposts Total cells
X Total HOWR songposts
A cornpaable computation gave the number of Bewick's Wren song posts expected in cells with House Wren song posts. We used two-tailed, paired t-tests to explore whether differences be- tween the observed and expected numbers of song posts of each species in cells with song posts of the other suggested significant avoid- ance or attraction between the two species.
Results of this analysis may be biased by lack of independence. First, we undoubtedly recorded data from the same males in the same territories during consecutive visits in a given breeding season. Second, the same males may have been on the same territories in one or more years of the study.
WEATHER
Daily precipitation and minimumlmaximum temperatul-es were available from a small weath- er station maintained at SJER's headquarters since 1934. We tested the relation between yeal-- ly counts of each wren species and total precip- itation from 1 July of the year preceding point counts through 30 June of the year of counting; about 88% of the precipitation during this period falls before counts begin each year. Additional independent variables were the lowest tempera- ture recorded dul-ing the winter preceding counts, the 2-, 3-, 4-, and 5-year running avee ages of annual precipitation, and the summed "winter" precipitation values from October through February, through March, and through

HOUSE AND BEWTCK'S WREN POPULATIONS 223
April. Relations between annual counts of the wrens and those winter values were explored for the inlmediate season's precipitation and that for 1, 2, and 3 years prior to the immediate survey year. -
RESULTS
WREN POPULATIONS AND WEATHER
Annual counts of both House and Bewick's Wrens diffel-ed markedly among years (Table I). Neither their counts ( r = 0.20, P = 0.51, n = 13) nor the percentage changes in their yewto- year counts ( r = 0.39, P = 0.22, n = 12) were significantly correlated. In 8 of the 12 year-to- year intervals, however, populations of both spe- cies changed in the same direction (Fig. 2) (bi- nomial test. P = 0.39). Both soecies exhibited sharp increases in counts between some years. For examplc, mcan counts of Bcwick's Wrcns increased 74% from 1987 to 1988, 69% from 1991 to 1992, and 117% from 1993 to 1994
TABLE I. Mean annual counts ( 2 SE) of House Wrens and Bcwick's Wrens at the San Joaquin Experimental Rangc. Sample size equals the tiumber 01 different observ- crs who completed counts at all 210 counting stations each ycal; cxcepr in 1986 and 1987 when seven observers each complctcd two full sets 01 counts.
Year FIGURE 2. Relations of mcan annual counts of Housc Wrcns (heavy dashcd linc) and Bcwick's Wrcns (light dashed linc) to thc pcl-centagc deviation l inm mean annual precipilation (solid linc) at thc San Joaquin Expcr- imcntal Rangc. Thc "zero" linc tbr prccipitalion corresponds to mcan annual prccipitalion of 47.4 cm; lor thcsc data, "1985" rclcrs to the pe~iod rrom I July 1984 through 30 Junc 1985. and similarly tbr othcr years.

224 JARED VERNER AND KATHRYN L. PURCELL
Counts of House Wrens increased 353% from 1991 to 1992.
Exploratory linear regressions between mean annual counts of each species and our various measures of-precipitation gave mixed results. Adjusted R' values were low and nonsignificant for most tests. They were relatively high, how- ever, between counts of House Wrens and all four running averages of annual precipitation (2- year average: R' = 0.52, P = 0.003; 3-year av- erage: R2 = 0.50, P = 0.004; 4-year average: RL = 0.57, P = 0.002; 5-year average: R' = 0.39, P = 0.013). Bonferroni adjustment for these nmltiple tests requires P 5 0.013 for signifi- cance at the 0.05 level. Because results from the 4-year sunning average gave the best fit and the point scatter suggested a curvilinear relation, we fitted the 4-year sunning average to an equation of the f o n ~ l
), = u(l - e-"-"z ) + t where estimates of 5 = 133.707, 6 = -0.103,
and i. = 0.004 (Fig. 3). The root mean-square error was 23.9, a 17% improvement over the best linear model, based on the 4-year running average of precipitation. Visual inspection of the curve in Figure 3 suggests a threshold effect, seen in the steep ascent in mean annual counts of House Wrens between about 35 and 40 cm of annual precipitation, with an asymptote corre- sponding to a mean annual count of about 130 individuals within the range of precipitation ob- served during this study.
Correlations between counts of Bewick's Wrens and the prior year's total precipitation and the 2-, 3-, 4-, and 5-year lunning averages were not significant at the 0.05 level, nor were cor- relations between counts and winter precipita- tion for the current year, the previous year, or the previous 2 years. Although the probabilities of all corelations between counts and winter precipitation from 3 years prior to the counts ranged from 0.035 to 0.043, Bonferroni adjust- ment for these n~ultiple tests requires P 5 0.017
25 30 35 40 45 50 55 60
Four-Year Running Average of Precipitation (cm) FIGURE 3. Curvilinear relation bclwcen thc 4-ycar irunning avcl-agc of precipitalion and Incan annual counts of House Wrens (adjusted R2 = 0.57. P = 0.002). Note ihc apparent threshold effect suggested by the steep asccnt i n mcan annual counts between about 35 and 40 crn of annual precipilalion, with an asymplote corre- sponding to a mcan annual count ol about 130 individuals.

HOUSE AND BEWICK'S WREN POPULATIONS 225
for significance at the 0.05 level. The sharp de- cline (62%) of Bewick's Wrens from 1990 to 1991 (Fig. 2) followed the most severe period of winter weather on record at SJER. Tempera- tures dropped below freezing every night from 13 December 1990 through 2 January 1991, reaching - 1 1.7"C (the lowest temperature in the 64-year record) on the night of 21 December, -10.6'C on 22 Decemhel-, and -8.3"C on 23 Decemhel: This was accompanied by snow cov- er of 9-10 cm that remained for several days. Even a light dusting of snow is unusual at SJER, and it nolmally melts away within a day.
The correlation between counts of Bewick's Wrens and the lowest temperature recorded dur- ing the winter immediately preceding the counts was not significant (r = 0.37, P = 0.21), nor did minimum winter temperature add explanatory power to the regression model including total precipitation from October through March, 3 years prior to the counts-the precipitation mea- sure with the highest Rz-value for Bewick's Wren counts (Type III sums of squares, F,,,, = 2.10, P = 0.18). Furthermore, removal of the data for 1991-1993, when the Bewick's Wren population was strongly influenced by the severe winter of 1991, dropped the Rz-value from 0.29 (P = 0.035) to 0.0036 ( P > 0.10). Apparently the sharp drop in numbers of Bewick's Wrens associated with the severe winter of 1990-1991 positively biased the correlation between the winter period precipitation and Bewick's Wren abundance.
House Wren abundance, on the other hand, was strongly corl-elated with the lowest temper- ature recorded during the winter months preced- ing the counts (r = 0.77, P = 0.002), and adding minimum winter temperature to the regl-ession model with the 4-year running avexage of total precipitation (the measure with the highest R2 for House Wrens) significantly improved the model (Type IU sums of squares, F,,,, = 5.33, P = 0.04).
SPATIAL RELATIONS BETWEEN HOUSE AND BEWTCK'S WRENS
In a plot of the observed vs. expected values of song posts of one species in cells with at least
' one song post of ihe other, data points would lie along the 45-degree line if all observed values equaled their paired, expected values. Results in- dicated neither attraction nor avoidance in song post locations between singing males of the two
/+ Attraction Zone
0 1 2 3 4 5 6 7 8 Observed BEWR Song Posts
in Cells with HOWR Song Posts
Avoidance Zone
/+ Attraction Zone
T--,,,,,,,,.-,v-
0 1 2 3 4 5 6 7 8 Observed HOWR Song Posts in Cells with BEWR Song Posts
FIGURE 4. Above, the number of observed vs. ex- pected song posts of Bewick's Wrens (BEWR) in cells 30 x 30 m that contained song posts of Housc Wmns (data pooled for thc grazed and ungrazed spot-mapping plots). Below, the comparable data for song posts of Housc Wrens (HOWR) in cells containing song posts of Bcwick's Wrens. Points would be concentrated in one or the other of thc two zoncs if one species tended to avoid or to be attracted to the other. The true sample size (40) is obscured in each of these figures because several data points were Identical or so similar that plotted points wcrc coincidcnl.
species (Fig. 4), and none of four paired t-tests of differences between means of the number of expected and observed song posts of one species in cells with song posts of the other even ap-

226 JARED VERNER AND KATHRYN L. PURCELL
TABLE 2. Means C SE of the obscrvcd and cxpcctcd numbers of song posts of one species in cclls or the spot- mapping grid that had one or ,nore song posts of the other. pooling data from the two plots ( r r = 40).
obrcrvcd Exgctrll i-wlus" P
House Wrcn song posts i n Bcwick's Wreli cells . . BO-m grid 0.85 t 0.27 0.67 t 0.12 0.77 0.45 50-m grid 1.53 + 0.38 1.56 i 0.27 -0.15 0.88
Bcwick's Wmn song posts i n Hausc Wren cclls 30-m grid 0.70 + 0.22 0.55 t 0.10 0.81 0.42 50-rn erid 1.15 + 0.31 1.17 t 0.20 -0.08 0.93
proached statistical significance (Table 2). Power of the tests averaged 0.57 (range = 0.48-0.75) to detect a difference of 0.5 song post between observed and expected values and 0.99 (range = 0.97-1.00) to detect a difference of 1.0 song post. Wc cannot cstimatc thc cxtcnt to which these results may be biased by a lack of inde- pendence; it is the case, howevel; that noninde- pendence is more likely to produce a false pos- itive than a false negative result. In addition, the negative results of this analysis are supported by the territorial relations between these species as determined from spot mapping.
Although we do not contend that the spot- mapping method accurately maps territories of species on a study grid, it does provide some understanding of territory sizes and the general locations of boundaries. Superin~posed maps of "territories" delineated around clusters of the registrations of the two wren species in this study indicated that Bewick's Wrens held much larger territories than House Wrens at SJER and, when both species were relatively abundant, their territories overlapped extensively. In fact, the boundaries of a given Bewick's Wren terri- tory sometimes overlapped boundaries of sev- eral House Wren territories and sometimes com- pletely surrounded a delineated House Wren ter- ritory (Fig. 5). These observations are consistent with the those of Kroodsma (1973) in Oregon but not with those of Root (1969) in coastal Cal- ifornia.
DISCUSSION
Our results provided no evidence of interspecific competition between House and Bewick's Wrens. Estimates of abundance based on point counts indicated that neither species was com- petitively excluding the other. Indeed, although
FIGURE 5. Territory boundaries of Hausc Wrens (solid lincs) and Bcwick's Wrens (shaded) as delincat- ed kom spot-mapping data on the ungrazcd plot, 1993. Grid lincs of thc mapping plot wcre at 30-1" intervals.
not a significant pattern, annual population changes of the two species were in the same direction twice as often as in opposite directions. Spot-mapping indicated extensive tenitory o v w lap between the two species. Finally, analysis of the locations of song posts supported the null hypothesis of no difference between the expect- ed and observed numbers of song posts of one species in grid cells containing at least one song post of the other. Interestingly, most plotted points fell into the "avoidance" half of Figure 4 when counts wel-e low, but most fell into the "attraction" half when counts were high, as we might expect if males of the two species selected song posts independently of one another. Akec natively, the PI-evalence of points in the "attrac- tion" half when counts were high may reflect overlap between the species in the habitat attri-
'
butes that influence their selection of song posts. Results of other studies at SJER (Purcell
1995; Vernel; pers. observ.) indicate that these two wren species do not overlap in their selec-

HOUSE AND BEWICK'S WREN POPULATIONS 227
tion of nest sites. Nest sites of Bewick's Wrens wel-e generally atypical for cavity nesters and almost exclusively in natural cavities, including nests on the ground under a shrub or rock, or at the mouth of a vacant rodent burrow. Their nests were significantly lower than those of House Wrens, and they used nest boxes only twice over the 6-year period from 1989 to 1994 (44 boxes were in place from 1989 to 1991, and 92 were in place from 1992 to 1994). House Wrens used boxes frequently, and typically about 25% of the nest boxes were not used in a given yea& sug- gesting no limitation of nest sites for these two species, a conclusion supported by Waters et al. (1990) in an earlier study at SJER. Unlike the study by Kennedy and White (1996) in Kansas, we have never observed a case of House Wrens at SJER usurping an active nest cavity of Be- wick's Wrens, and Bewick's Wrens at SJER had the highest nest success among all secondary cavity-nesting species (Purcell 1995).
We do not view our results as necessarily in conflict with the many other studies implicating interspecific competition as a mechanism lead- ing to the extirpation of Bewick's Wrens in the face of range expansion by House Wrens. Most of those studies were done east of the Rocky Mountains, where we need not expect similar conditions. Moreover, western populations of the Bewick's Wren have not exhibited declines as severe as those in the east (Wilcove 1990, Ken- nedy and White 1996).
The rather shalp changes in relative abun- dance seen between some years for both species probably have a complex explanation beyond the present study. Although we have 13 years of data on these populations and their relations to weathel; in another sense our sample size is only one because the data included only one drought cycle and the most severe period of winter weather on record at SJER. In the context of the periodicity of these events, studies of much lon- ger duration are needed to sort out the details of cause and effect.
Visual inspection of Figure 2 suggests that the Bewick's Wren population held fairly well dur- ing most of the severe drought y e a s of 1987- 1990, suggesting that even very severe droughts have little effect on their population. On the oth- er hand, we suspect that Bewick's Wrens suf- fered high mortality as a direct result of the cold snap in the winter of 1990-1991, producing a drop in their population that was not paralleled
by a decline of House Wrens. Because the Be- wick's Wren is a permanent resident at SJER, and the House Wren is a migrant, only the for- mer could have been directly affected by the cold snap. Numbers of Bewick's Wrens then re- mained relatively low until 1994, when the pop- ulation began to recover.
The decline of House WI-ens duving the severe drought of 1987-1991, followed by their dra- matic recovery at the end of the drought, was not the first time such a change in abundance has been observed at SJER. We know from early spot-mapping studies at SJER, in 1978 and 1979, that House Wrens were rare on both the grazed and ungrazed plots following the severe drought of 1976-1977 (Vernel; pers. observ.). When spot mapping was resumed in 1985, how- ever, the Honse Wren was the most abundant breeder on both plots.
Our results raise the question of whether oak- pine woodlands at SJER comprise "sink" hab- itat for House Wrens, sensu Pulliam (1988). During years of more normal precipitation (at least 35 cm, as suggested by Fig. 3), House Wrens had high reproductive output compared with other secondary cavity nesters at SJER, of- ten successfully completing two nesting cycles (Purcell, pers. observ.). Because of their low numbers during drought years, data were insuf- ficient to estimate with confidence their produc- tivity and nesting success then. We suspect, however, that the oak-pine woodlands at SJER are at least "intermiuent" sinks for House Wrens; i.e., they support at least maintenance- level reproduction during years of normal pre- cipitation but not during drought years. Similar dynamics of other species are reviewed by O'Connor (1986) and Wiens (1989). The ques- tion is whether House WI-ens would persist in these woodlands, over the long term, if it were not for periodic in~migration from other habitats to "jump-start" the population after severe droughts. Probable source habitats include ripar- ian and other mesic sites elsewhere in the nearby Sierra foothills and Central Valley of California, which habitats do not exist at SJER. Such intee mittent source-sink dynamics may be a common occurrence.
The monitoring work at SJER is continuing, so we expect to re-examine these relations after the next drought cycle. We predict that precipi- tation will again be a major factor for the House Wren. The apparent asymptote at a mean point
228 JARED VERNER AND KATHRYN L. PURCELL
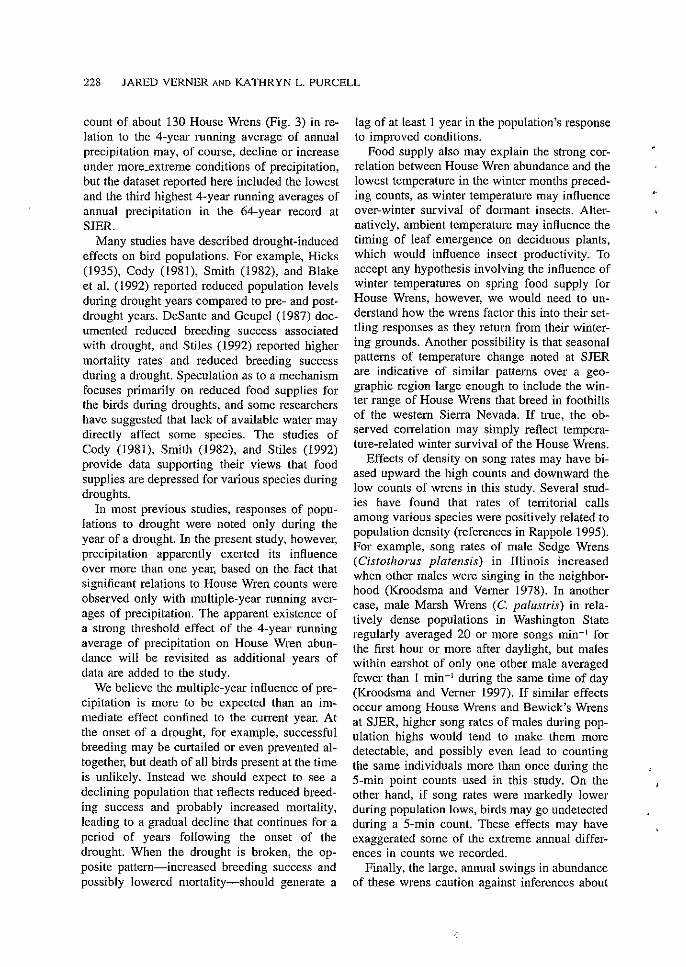
count of about 130 House Wrens (Fig. 3) in re- lation to the 4-year running average of annual precipitation may, of course, decline or increase under more-extreme conditions of precipitation, but the dataset reported here included the lowest and the third highest 4-year running averages of annual precipitation in Ule 64-year record at SJER.
Many studies have described drought-induced effects on bird populations. For example, Hicks (1935). Cody (l981), Smith (19821, and Blake et al. (1992) reported reduced population levels during drought years compared to pre- and post- drought years. DeSante and Geupel (1987) doc- umented reduced breeding success associated with drought, and Stiles (1992) reported higher mortality rates and reduced breeding success during a drought. Speculation as to a mechanism focuses primarily on reduced food supplies for the birds during droughts, and some researchers have suggested that lack of available water may directly affect some species. The studies of Cody (1981), Smith (1982), and Stiles (1992) provide data supporting their views that food supplies are depressed for various species du~ing droughts.
In most previous studies, responses of popu- lations to drought were noted only during the year of a drought. In the present study, however, precipitation apparently exerted its influence over more than one year, based qn the fact that significant relations to House Wren counts were observed only with multiple-year running aver- ages of precipitation. The apparent existence of a strong threshold effect of the 4-year running average of precipitation on House Wren nhun- dance will be revisited as additional years of data are added to the study.
We believe the multiple-year influence of pre- cipitalion is more to he expected than an im- mediate effect confined to the culrent year. At the onset of a drought, for example, successful breeding may be curtailed or even prevented al- together, but death of all birds present at the time is unlikely. Instead we should expect to see a declining population that reflects I-educed hreed- ing success and PI-obahly increased mortality, leading to a gradual decline that continues for a period of years following the onset of the drought. When the drought is broken, the op- posite pattern-increased hreeding success and possibly lowered mortalily-should generate a
lag of at least 1 year in the population's response to improved conditions.
Food supply also may explain the strong cor- relation between House Wren abundance and the lowest temperature in the winter months preced- ing counts, as winter temperature may influence over-winter survival of dormant insects. Alter- natively, ambient 1emperatu1-e may influence the timing of leaf emergence on deciduous plants, which would influence insect productivity. To accept any hypothesis involving the influence of winter temperatures on spring food supply for House Wrens, however, we would need to un- derstand how the wrens factor this into their set- tling responses as they return from their winter- ing grounds. Another possibility is that seasonal pattems of temperature change noted at SJER are indicative of similar patterns over a geo- graphic region large enough to include the win- ter range of House Wrens that hreed in foothills of the westem Sierra Nevada. If true, the oh- served COIL-elation may simply reflect tempera- lure-related winter survival of the House Wrens.
Effects of density on song rates may have hi- ased upward the high counts and downward the low counts of wrens in this study. Several stud- ies have found that rates of te~ritorial calls among various species were positively related to population density (references in Rappole 1995). For example, song rates of male Sedge Wrens (Cisrothorus platensis) in Illinois increased when other males wel-e singing in the neighhor- hood (Kroodsma and Verner 1978). In another case, male Marsh Wrens (C. palustris) in rela- tively dense populalions in Washington State regularly averaged 20 or more songs min-' for the first hour or more after daylight, hut males within earshot of only one other male averaged fewer than 1 min-' during the same time of day (Kroodsma and Verner 1997). If similar effects occur among House Wrens and Bewick's Wrens at SJER, higher song rates of males during pop- ulation highs would tend to make them more detectable, and possibly even lead to counting the same individuals more than once during the 5-min point counts used in this study. On the other hand, if song rates were makedly lower during population lows, birds may go undetected during a 5-min count. These effects may have exaggerated some of the extreme annual differ- ences in counts we recorded.
Finally, the large, annual swings in abundance of these wrens caution against inferences about

HOUSE AND BEWICK'S WREN POPULATIONS 229
long-term uends in their numbers in central Gal- KROODSMA, D. E. 1973. Coexistence of Bcwick's Wrens and House Wrcns in Oregon. Auk 90:341- ifomia, based on comparisons o f short-term 352,
studies in the past with short-term studies in the ~ O O D s M A , D. E., AND J. vERNER. 1978. complex present. singing behaviors among Cisrothorrrs wrens. Auk
95:703-7 16. ACKNOWLEDGMENTS
The Collowing assisted with ficld work over the years o l the study: Laura Arnow, Parker Backstrom, Susan Balch, Sandra Bloomficld, Ken Burton, Tony Chapcllc, Barbara Crousc. Chris Cutler, Jeff Davis. Doug Dry- nan, Matt Georgcff, Brian Gibson, Ellcn Hammond, Stevan Hawkins, Chris Heckscher, Jim Joncs, Sandra Kee, Kim Kuska. Zev Labinger, Peter Landrcs, John Lovio, Rod MacDonald, Bill Maynard, Rolf Miller, Kathy Milne, Dan Nelson, Barbara North, Kathlccn O'Kane, Coleen Pidgcon. Kim Raum, Rick Reynolds, Jcff Seay, Tim Schantz, Mike Sherman, Curt Steggall, Rob Suryan, Robert Suydam. Dan Taylor, Tracy Ten- nant, David Tibor, Jcnnifer Turner, and Ed Whisler. Sylvia Mori and Jim Baldwin assisted with statistical analyses; Chuck Evans and Teri Conway assisted with data processing; Doug Drynan prepared Figure 1 and Gary Eberlein prcparcd Figure 5. Constructive reviews of a draft manuscript were provided by Goelf Geupel and E. Dale Kcnncdy. To all we extend our deep ap- prcciation.
LITERATURE CITED
ANONYM~US. 1970. Recommendations ror an interna- tional standard for a mapping method'in bird ccn- sus work. Swcdish Nat. Sci. Res. Council, Stock- holm. Bull. Ecol. Res. Comm. 9:49-52.
BLAKE, J. G.. G. J. NIEML. AND J. M. HANOWSKI. 1992. Drought and annual vvrialion in bird populations, n. 419-430. h~ J. M. Haean 111 and D. W. John-
Washington, DC. BROOKS, M. 1947. Interrelations of House Wrcns and
Bewick's Wrcns. Auk 64:624. CODY. M. L. 1981. Habitat selection in birds: the rolcs
of vegetation structure, competitors, and produc- tivity. BioScicnce 3 1: 107-1 13.
DESANTE, D. E, AND G. R. GEUPEL. 1987. Landbird productivity in central coastal California: thc re- lationship to annual rainfall, and a rcproductive failurc in 1986. Condor 89:636-653.
HICKS, L. E. 1935. A Len year study of a bird popu- lation in central Ohio. Am. Midl. Nat. 16177- 186.
KENNEDY. E. D., AND D. W. WHITE. 1996. Interl'crcncc competition f ~ o m Housc Wrcns as a ractor in the decline of Bewick's Wrcns. Canscrv. Bid. 10: 281-284.
~~ ~~
KR~ODSMA, D. E., AND J. VERNER. 1997. Marsh Wren (Cisrorlmrr~.~ prrlssrris), p. 1-32. in A. Poole and E Gill [eds.], The birds of North America, No. 308. The Academy or Natural Sciences, Philadel- phia, and Thc American Ornithologists' Union, Washington, DC.
MENGEL, R. M. 1965. The birds of Kentucky. Am. Or- nithol. Union Monogr. 3.
O'CONNOR, R. 1. 1986. Dynamical aspects of avian habitat use, p. 235-240. in 1. Vcrncr, M. L. Mor- rison, and C. J. Ralph [cds.], Wildlife 2000: mod- eling habitat relationships of tcrrcstrial verte- bl-atcs. Univ. Wisconsin Prcss, Madison, WI.
NEWMAN, D. L. 1961. House Wrens and Bcwick's Wrens in northern Ohio. Wilson Bull. 73:84-86.
PULLIAM, H. R. 1988. Sources, sinks, and population regulation. Am. Nat. 132:652-661.
PURCELL. K. L. 1995. Reproductive strategies of open- and cavity-nesting birds. Ph.D. diss., Univ. Ne- vada, Reno, NV.
RAPPOLE, J. H. 1995. The ecology of migrant birds: a Neotropical pcrspcctive. Smithson. lost. Press, washington, DC.
Ronos, K. M. 1929. The return of the House Wrcn. Wilson Bull. 41:103.
ROssrNs, C. S. 1970. Rccornmendations lor an inter- national standard for a mapping method in bird census work. Audubon Field Notes 24:723-726.
ROOT, R. B. 1969. Interspecific tcnitoriality bctween Bewick's and Housc Wrcns. Auk 86125-127.
SIMPSON, M. B. 1978. Ecological faclors contributing to the decline of Bewick's Wren as a breeding species in the southern Blue Ridge Mountain Province. Chat 4225-28.
SMITH, K. G. 1982. Drought-induced changes in avian community slructure along a montane scre. Ecol- ogy 63:952-961.
Smes. E C. 1992. Effects of a severe droueht on the ~ -
population biology of a tropical hummingbird. Ecology 73:1375-1390.
VERNER, I., AND K. A. MILNE. 1989. Coping with sourccs of variability when monitoring population trcnds. Ann. Zool. Fennici 26191-199.
WATERS, J. R., B. R. NOON, AND 1. VERNER. 1990. Lack o l nest site limitation in a cavity-nesting bird com- munity. J. Wildl. Manage. 54:239-245.
W m s . J. A. 1989. The ecology of bird communities. Vol. I . Foundations and patterns. Cambridge Univ. Press, Cambridge.
WILCOVE, D. 1990. A quiet exit. Living Bird Quart. 9: 10-11.
