factors explaining socio-economic inequalities in cancer
TRANSCRIPT

Review
Factors Explaining Socio-EconomicInequalities in Cancer Survival:A Systematic Review
Nina Afshar, PhD1,2 , Dallas R. English, PhD1,3, and Roger L. Milne, PhD1,3,4
Abstract
Background: There is strong and well-documented evidence that socio-economic inequality in cancer survival exists within andbetween countries, but the underlying causes of these differences are not well understood.
Methods: We systematically searched the Ovid Medline, EMBASE, and CINAHL databases up to 31 May 2020. Observationalstudies exploring pathways by which socio-economic position (SEP) might causally influence cancer survival were included.
Results: We found 74 eligible articles published between 2005 and 2020. Cancer stage, other tumor characteristics, health-related lifestyle behaviors, co-morbidities and treatment were reported as key contributing factors, although the potentialmediating effect of these factors varied across cancer sites. For common cancers such as breast and prostate cancer, stage ofdisease was generally cited as the primary explanatory factor, while co-morbid conditions and treatment were also reported tocontribute to lower survival for more disadvantaged cases. In contrast, for colorectal cancer, most studies found that stage did notexplain the observed differences in survival by SEP. For lung cancer, inequalities in survival appear to be partly explained by receiptof treatment and co-morbidities.
Conclusions: Most studies compared regression models with and without adjusting for potential mediators; this method hasseveral limitations in the presence of multiple mediators that could result in biased estimates of mediating effects and invalidconclusions. It is therefore essential that future studies apply modern methods of causal mediation analysis to accurately estimatethe contribution of potential explanatory factors for these inequalities, which may translate into effective interventions to improvesurvival for disadvantaged cancer patients.
Keywordscancer survival, socio-economic position, deprivation, disadvantage, inequality, disparity
Received November 04, 2019. Received revised March 06, 2021. Accepted for publication March 31, 2021.
Introduction
Socio-economic position (SEP) is a complex construct of
several aspects of a person’s social, financial and occupation
position.1 Cancer patients with lower SEP consistently show
worse survival than those with higher SEP, regardless of
whether individual-level SEP or area-based measures are
used.2,3 Comprehensive reviews conducted by the International
Agency for Research on Cancer (IARC) in 19972 and Woods
et al, in 20053 found solid evidence for socio-economic
inequalities in cancer survival for most malignancies and in
many countries. The extent of the survival differences by SEP
1 Cancer Epidemiology Division, Cancer Council Victoria, Melbourne, Victoria,
Australia2 Cancer Health Services Research Unit, Centre for Health Policy, School of
Population and Global Health, The University of Melbourne, Melbourne,
Victoria, Australia3 Centre for Epidemiology and Biostatistics, School of Population and Global
Health, The University of Melbourne, Melbourne, Victoria, Australia4 Precision Medicine, School of Clinical Sciences at Monash Health, Monash
University, Melbourne, Victoria, Australia
Corresponding Author:
Nina Afshar, Cancer Epidemiology Division, Cancer Council Victoria, 615 St
Kilda Road, Melbourne, Victoria 3004, Australia.
Email: [email protected]
Cancer ControlVolume 28: 1-33ª The Author(s) 2021Article reuse guidelines:sagepub.com/journals-permissionsDOI: 10.1177/10732748211011956journals.sagepub.com/home/ccx
Creative Commons Non Commercial CC BY-NC: This article is distributed under the terms of the Creative Commons Attribution-NonCommercial 4.0 License(https://creativecommons.org/licenses/by-nc/4.0/) which permits non-commercial use, reproduction and distribution of the work without further permissionprovided the original work is attributed as specified on the SAGE and Open Access pages (https://us.sagepub.com/en-us/nam/open-access-at-sage).

is moderate for most cancer sites, but substantial for cancers of
the breast, colon, bladder and corpus uteri, which all have
relatively good prognosis.2 Stage at diagnosis was reported to
be the primary explanatory factor, but its estimated mediating
effect has differed by cancer site and between countries and
studies.3,4 Few studies have assessed the contribution of treat-
ment to survival differences among socio-economic groups.3,4
The degree to which patient characteristics such as the presence
of co-morbid conditions and health-related behaviors explain
socio-economic differences in cancer survival also remains
unclear.
In this systematic review, we assessed studies exploring
underlying reasons for socio-economic inequalities in cancer
survival, with the aim of identifying potential contributing fac-
tors and determining the validity of published estimates of their
mediating effects.
Methods
This systematic review was planned, conducted and
reported in adherence to the guidelines of the Preferred
Reporting Items for Systematic Reviews and Meta-
Analysis Protocols (PRISMA-P).5 The review protocol
was registered with the International Prospective Register
of Systematic Reviews–PROSPERO (registration number
CRD42016039227).
Search Strategy
A systematic search of studies published in English from 1
January 2005 to 31 May 2020 was conducted in Ovid Med-
line, EMBASE and the Cumulative Index to Nursing and
Allied Health Literature (CINAHL) databases to identify
those that investigated the underlying reasons for socio-
economic inequalities in cancer survival (Supplementary
Table 1). The bibliographies of selected studies were
reviewed to locate eligible articles that might not have been
detected through the above process. Finally, we carried out
a further manual search using Google Scholar and reviewed
the first 3 pages to ensure that potentially relevant studies
were not missed.
Eligibility Criteria
Eligible studies met all of the following criteria: (1) observa-
tional study of adults (men or women diagnosed with cancer at
age �15 years); (2) written in English and published in a peer-
reviewed journal since 2005; (3) investigated the underlying
causes of socio-economic inequalities in cancer survival;
(4) assessed death from any cause or death from a specific type
of cancer; and (5) reported an estimate of a hazard ratio (HR),
odds ratio (OR), or excess mortality rate ratio (EMRR), with a
corresponding 95% confidence interval (CI) or standard error.
The EMRR is the ratio of the excess mortality rate due to
cancer diagnosis in one group of people (e.g., people with low
SEP) versus the excess mortality rate in another group (e.g.,
people with high SEP). We excluded eligible abstracts if full
text was not available.
Study Screening and Data Extraction
N.A. performed the literature search and excluded irrelevant or
ineligible studies based on the titles and abstracts. Full reports
of selected articles were imported to Covidence, a web-based
program for conducting systematic reviews, for independent
screening by N.A. and R.L.M. Any disagreements were
resolved after consulting D.R.E. Data from the selected studies
were extracted by N.A. with assistance from R.L.M. For each
study, we extracted the following information: the first author’s
last name, year of publication, country where the study was
conducted, sources of data, diagnosis years, range of age at
cancer diagnosis, cancer types studied, measures and categories
of socio-economic position, factors considered as potentially
contributing to socio-economic inequalities in cancer patient
survival, statistical methods and covariates included in the
analyses.
Assessment of Risk of Bias
N.A. and R.L.M independently assessed the risk of bias of eli-
gible studies using the domains of bias from the ROBINS-E
(Risk of Bias In Non-Randomized Studies-of Exposures) tool
[http://www.bristol.ac.uk/population-health-sciences/centres/cre
syda/barr/riskofbias/robins-e/]. The following domains were
reviewed: confounding, selection of participants into the study,
classification of the exposure, adjustment for mediators, level of
missing data, measurement of the outcome, and reporting of
results.
Results
Study Selection
The electronic database search identified 9,245 articles; 2,069
duplicate citations were removed, and an additional 7,026 arti-
cles were excluded based on their title and abstract, leaving 150
articles for further assessment. We excluded 76 studies after
full-text screening; therefore, 74 articles met the eligibility
criteria for inclusion in the review (Figure 1).
Study Characteristics
Table 1 summarizes the characteristics of the included stud-
ies and factors considered as potentially contributing to
socio-economic inequalities in cancer-specific and overall
survival. Forty-four studies were conducted in Europe6-48
(1 study used data from England and Australia),49 19 in the
United States of America (US),50-68 4 in Canada,69-72 3 in
Australia,73-75 2 in New Zealand,76,77 and 2 in Asia.78,79
These studies assessed the following cancers: female
breast,8,9,13,17,18,26,29,30,32,36,44,49,53,59-61,65,67,77 male
breast,58 cervix,24,50 ovary,23,42,45 endometrium,33 pros-
tate,7,34,43,64 penis,47 colorectum,12,15,22,28,40,48,55,57,66,73
2 Cancer Control

lung,10,11,16,20,25,41,56 head and neck,31,54,70,71 brain and cen-
tral nervous system (glioma),62,63 esophagus,27 pancreas,39,79
liver,72 kidney,52 melanoma,19,35 acute myeloid leukemia37 and
non-Hodgkin lymphoma,21,38 as well as selected groups of
malignancies.6,14,46,51,68,69,74-76,78 The majority of the studies
used population-based cancer registry data,7-11,13,16-20,25,27-
30,34-36,38-41,44,49,50,52,54-56,58,60-63,66,68,69,71-79, some linking
these with healthcare administration, public and private
hospital, screening and treatment datasets.8,20,38,50,54,71,73 The
remaining studies used data from a variety of sources
including cohort and case-control studies,6,12,14,26,43,59,64 hospi-
tals,31,37,46,70 cancer surveillance programs,57 national cancer
audit48 or other cancer databases.15,21-24,32,33,42,45,47,51,53,65,67
Twenty-three studies reported cancer-specific survival, or rela-
tive or net survival, where the cancer under study was considered
as the cause of death,10,13,18,19,27,28,30,32,34-36,44,49,52,60,61,66,71,73-77
while 36 studies presented overall survival (i.e., death from any
cause).6-8,11,14,16,17,20-26,33,37-39,41,42,45,46,48,50,51,53,55-58,62,63,
70,72,78,79 Other studies reported both overall and cancer-specific
or relative/net survival.9,12,15,29,31,40,43,47,54,59,64,65,67-69
The measurement of SEP of cancer patients at diagnosis
varied across studies. Several studies used composite measures
or indices of SEP or deprivation such as census tracts socio-
economic status,38,51-56,58,61-63,65,66,68,70,71 Townsend index,17,27,28
the index of multiple deprivation,12,20,25,29,32,34,41,44,45,48 the
index of relative socio-economic advantage and disadvantage
or the index of relative socio-economic disadvantage,73-75 the
New Zealand deprivation index,76,77 the Scottish Index of mul-
tiple deprivation, deprivation index,30,37,42 socio-economic
index11 or the Small Area Health Research Unit index of social
deprivation.36 Other studies defined SEP using measures such
as educational level, income, unemployment rate, poverty-
level, median house-hold income or median property value
across aggregated or geographical areas based on address,
postal code or neighborhood.7-9,31,49,50,59,60,64,67,69,72,78
The remaining studies used individual measures including
education, gross household or disposable income, last
occupation and housing status (rental or owner
occupied).6,10,13-16,18,19,21-24,26,33,35,39,40,43,46,47,57,59,64,67,79
Figure 1. Flow diagram describing selection of studies for inclusion in the systematic review of factors explaining socio-economic inequalities incancer survival. CINAHL, Cumulative Index to Nursing and Allied Health Literature.
Afshar et al 3

Tab
le1.
Char
acte
rist
ics
ofIn
cluded
Obse
rvat
ional
Studie
son
Pote
ntial
Expla
nat
ions
for
Soci
o-E
conom
icIn
equal
itie
san
dC
ance
rSu
rviv
al,2005-2
020.
Pap
erC
ountr
yof
study
Dat
aso
urc
es/S
ettings
Popula
tion
incl
uded
Yea
rsofdia
gnosi
sA
geat
dia
gnosi
sA
nat
om
icsi
teof
cance
r(s)
Mea
sure
sof
soci
o-e
conom
icposi
tion
(SEP)
No.of
groups
Anal
yses
Des
crip
tion
ofre
sults
Cova
riat
ead
just
edfo
r
Aar
tset
al,2013
Net
her
lands
GLO
BE,pro
spec
tive
cohort
study
Ein
dhove
nan
dSu
rroundin
gs1991-2
008
NA
(15-7
5at
bas
elin
e)
All
mal
ignan
cies
with
focu
son
colo
n,
lung
(non-s
mal
lce
ll),p
rost
ate
and
fem
ale
bre
ast
Educa
tion
leve
l(indiv
idual
leve
l)4
Kap
lan-M
eier
met
hod
(cru
de
surv
ival
),C
ox
pro
port
ional
haz
ards
regr
essi
on
(ove
rall
5-y
ear
surv
ival
)
For
allca
nce
rsco
mbin
ed,5-y
ear
crude
surv
ival
was
super
ior
inhig
hly
educa
ted
pat
ients
com
par
edw
ith
low
educa
ted
cance
rpat
ients
.Educa
tional
ineq
ual
itie
sin
ove
rall
5-y
ear
surv
ival
wer
eobse
rved
inpro
stat
eca
nce
rco
mpar
ing
low
educa
ted
pat
ients
with
hig
hly
educa
ted,w
hile
no
asso
ciat
ions
wer
efo
und
for
bre
ast,
colo
nan
dnon-s
mal
lce
lllu
ng
cance
raf
ter
adju
stin
gfo
rag
e,ye
arofdia
gnosi
san
dst
age
atdia
gnosi
s.C
om
orb
iditie
san
dlif
esty
lebeh
avio
rsdid
not
expla
ined
uca
tional
ineq
ual
itie
sin
ove
rall
surv
ival
afte
rpro
stat
eca
nce
r.
Age
,ye
arofdia
gnosi
s,st
age
atdia
gnosi
san
dse
x(c
olo
nan
dnon-s
mal
lce
lllu
ng
cance
r)A
dditio
nal
ly,ad
just
edfo
rco
morb
idity,
alco
hol
consu
mption,
phys
ical
activi
tyan
dsm
oki
ng
stat
us
Aar
tset
al,2013
Net
her
lands
Ein
dhove
nC
ance
rR
egis
try
South
-eas
tern
Net
her
lands
1998-2
008
All
ages
Pro
stat
eSo
cio-e
conom
icst
atus
(SES)
def
ined
atnei
ghborh
ood
leve
lbas
edon
the
post
alco
de
ofth
ere
siden
cear
eader
ived
from
indiv
idual
tax
dat
apro
vided
atan
aggr
egat
edle
vel
3C
ox
pro
port
ional
haz
ard
regr
essi
on
(ove
rall
10-y
ear
surv
ival
)
Ove
rall
10-y
ear
surv
ival
was
super
ior
inhig
h-
SES
pat
ients
com
par
edw
ith
low
-SE
S(b
oth
loca
lized
and
adva
nce
dst
ages
).T
reat
men
thad
ala
rger
impac
ton
the
risk
of
dea
thco
mpar
ing
pat
ients
livin
gin
low
and
hig
hso
cio-
econom
icst
atus
area
s,ex
cept
for
men
aged
75
year
san
dold
er.
Pre
sence
of
com
orb
iditie
spar
tly
contr
ibute
dto
ineq
ual
itie
sin
ove
rall
surv
ival
follo
win
gpro
stat
eca
nce
rdia
gnosi
s.
Stra
tifie
dby
age
and
stag
eat
dia
gnosi
sA
dditio
nal
ly,ad
just
edfo
rye
arof
dia
gnosi
s,co
morb
idity
and
trea
tmen
t
(con
tinue
d)
4

Tab
le1.
(continued
)
Pap
erC
ountr
yof
study
Dat
aso
urc
es/S
ettings
Popula
tion
incl
uded
Yea
rsofdia
gnosi
sA
geat
dia
gnosi
sA
nat
om
icsi
teof
cance
r(s)
Mea
sure
sof
soci
o-e
conom
icposi
tion
(SEP)
No.of
groups
Anal
yses
Des
crip
tion
ofre
sults
Cova
riat
ead
just
edfo
r
Aar
tset
al,2011
Net
her
lands
BoB
Zdat
abas
e(p
opula
tion-b
ased
scre
enin
gpro
gram
)lin
ked
with
Ein
dhove
nC
ance
rR
egis
try
South
ern
Net
her
lands
1998-2
005
All
ages
Bre
ast
Soci
o-e
conom
icst
atus
(SES)
def
ined
atan
aggr
egat
edle
velfo
rea
chpost
alco
de
3Li
fete
stm
ethod
(cru
de
surv
ival
),C
ox
pro
port
ional
haz
ards
regr
essi
on
(ove
rall
5-y
ear
surv
ival
)
Wom
enw
ith
low
SES
had
low
erove
rall
5-y
ear
surv
ival
com
par
edw
ith
wom
enw
ith
hig
hSE
S,w
het
her
scre
en-
det
ecte
d,in
terv
alca
rcin
om
aor
not
atte
nded
scre
enin
gat
all.
Am
ong
non-a
tten
dee
san
din
terv
alca
nce
rs,
the
diff
eren
ces
insu
rviv
alw
ere
larg
ely
expla
ined
by
stag
e(4
8%
and
35%
)an
dto
ale
sser
deg
ree
by
trea
tmen
t,an
dco
morb
iditie
s(1
6%
and
16%
),re
spec
tive
ly.
Pre
sence
of
com
orb
iditie
sex
pla
ined
23%
of
surv
ival
ineq
ual
itie
sam
ong
scre
en-
det
ecte
dpat
ients
;it
had
less
impac
ton
inte
rval
cance
rsor
non-a
tten
dee
s.
Age
Stra
tifie
dby
scre
enin
gat
tendan
ceA
dditio
nal
ly,ad
just
edfo
rst
age
atdia
gnosi
s,co
morb
idity,
and
trea
tmen
t
Abdel
-Rah
man
etal
,2019
United Stat
esSu
rvei
llance
,Epid
emio
logy
,an
dEnd
Res
ults
(SEER
)
United
Stat
es2010-2
015
All
ages
Bre
ast
(non-
met
asta
tic)
Cen
sus
trac
t-le
vel
soci
oec
onom
icSt
atus
(SES)
3C
ox
pro
port
ional
haz
ard
regr
essi
on
(can
cer-
spec
ific
surv
ival
)
Low
erSE
Sin
dex
isas
soci
ated
with
wors
ebre
ast
cance
r-sp
ecifi
csu
rviv
al,
whic
hw
asnot
expla
ined
by
stag
eat
dia
gnosi
sor
bre
ast
cance
rsu
bty
pe
(tri
ple
neg
ativ
e,lu
min
alan
dH
ER
2).
Model
1:A
dju
sted
for
age,
race
,st
age
atdia
gnosi
s,an
dSt
ratifie
dby
bre
ast
cance
rsu
bty
pe
Model
2:A
dju
sted
for
age,
race
,bre
ast
cance
rsu
bty
pe,
and
Stra
tifie
dby
stag
e
Bas
tiaa
nnet
etal
,2011
Net
her
lands
Net
her
lands
Can
cer
Reg
istr
yN
ether
lands
1995-2
005
All
ages
Bre
ast
Soci
o-e
conom
icst
atus
(SES)
Are
a-bas
edm
easu
reac
cord
ing
topla
ceofre
siden
ceat
the
tim
eofdia
gnosi
s
5C
ox
pro
port
ional
haz
ard
regr
essi
on
(ove
rall
10-y
ear
surv
ival
),10-y
ear
rela
tive
surv
ival
(Hak
ulin
enm
ethod),
Rel
ativ
eExce
ssR
isk
ofd
eath
usi
ng
gener
aliz
edlin
ear
model
with
Pois
son
dis
trib
ution
Pat
ients
with
ave
rylo
wSE
Shad
low
erove
rall
and
cance
r-sp
ecifi
c10-y
ear
surv
ival
com
par
edto
very
hig
hSE
Sgr
oup.
Can
cer
stag
eonly
par
tly
expla
ins
obse
rved
soci
o-e
conom
icdiff
eren
ces
inbre
ast
cance
rsu
rviv
al.
Soci
o-e
conom
icst
atus
rem
ained
asi
gnifi
cant
indep
enden
tpro
gnost
icfa
ctor
of
surv
ival
.
Age
,ye
arofdia
gnosi
s,his
tolo
gy,gr
ade,
T-s
tage
,nodal
stat
us,
dis
tant
met
asta
ses,
surg
ery,
and
adju
vant
trea
tmen
t
(con
tinue
d)
5

Tab
le1.
(continued
)
Pap
erC
ountr
yof
study
Dat
aso
urc
es/S
ettings
Popula
tion
incl
uded
Yea
rsofdia
gnosi
sA
geat
dia
gnosi
sA
nat
om
icsi
teof
cance
r(s)
Mea
sure
sof
soci
o-e
conom
icposi
tion
(SEP)
No.of
groups
Anal
yses
Des
crip
tion
ofre
sults
Cova
riat
ead
just
edfo
r
Bec
kman
net
al,
2015
Aust
ralia
South
Aust
ralia
Can
cer
Reg
istr
ylin
ked
with
public
/pri
vate
hosp
ital
separ
atio
ndat
a,public
/pri
vate
radio
ther
apy
and
clin
ical
cance
rre
gist
ries
(tea
chin
ghosp
ital
s)
South
Aust
ralia
2003-2
008
50-7
9C
olo
rect
um
Index
ofre
lative
Soci
oec
onom
icA
dva
nta
gean
dD
isad
vanta
ged
(IR
SAD
)2006
(are
a-bas
edm
easu
reofso
cio-
econom
icposi
tion)
5K
apla
n-M
eier
met
hod
(1-,
3-
and
5-y
ear
crude
cance
r-sp
ecifi
csu
rviv
al),
Com
pet
ing
risk
regr
essi
on
(Fin
ean
dG
ray
met
hod)
Pat
ients
from
the
most
adva
nta
ged
area
shad
bet
ter
surv
ival
com
par
edw
ith
pat
ients
from
dis
adva
nta
ged
area
s.Su
rviv
alin
equal
itie
sw
ere
not
expla
ined
by
diff
eren
tial
stag
eat
dia
gnosi
s,pat
ient
fact
ors
,oth
ertu
mor
char
acte
rist
ics,
com
orb
idity,
and
trea
tmen
tm
odal
itie
s.
Age
,se
x,ye
arof
dia
gnosi
s,pla
ceof
resi
den
ce,ca
nce
rsi
te,st
age,
grad
e,co
morb
idity,
pri
mar
ytr
eatm
ents
Ber
ger
etal
,2019
Fran
ceT
he
leuke
mia
unit
of
the
Toulo
use
Univ
ersi
tyH
osp
ital
South
-wes
tof
Fran
ce2009-2
014
�60
Acu
teM
yelo
idLe
uke
mia
(AM
L)Euro
pea
ndep
riva
tion
index
(eco
logi
cal)
5C
ox
pro
port
ional
haz
ard
regr
essi
on
(Ove
rall
surv
ival
)
Cas
esliv
ing
inth
em
ost
dep
rive
dar
eas
had
ahig
her
risk
ofdyi
ng
from
allca
use
s,w
hic
hw
asnot
expla
ined
by
diff
eren
tial
initia
ltr
eatm
ent.
Age
,se
x,an
dco
morb
idity
Additio
nal
adju
stm
ent
for
AM
Lonto
geny,
cyto
genet
icpro
gnosi
s,per
form
ance
stat
us,
white
blo
od
cells
count,
and
trea
tmen
tB
ergl
und
etal
,2010
Swed
enR
egio
nal
Lung
Can
cer
Reg
istr
yC
entr
alSw
eden
1996-2
004
30-9
4Lu
ng
(Non-s
mal
lce
ll)Educa
tion
leve
l(indiv
idual
leve
lm
easu
re,m
ain
indic
ator
ofso
cio-
econom
icposi
tion)
Soci
oec
onom
icin
dex
(SEI)
bas
edon
the
occ
upat
ion
ofth
ehouse
hold
3 3K
apla
n-M
eier
met
hod,
Cox
pro
port
ional
haz
ards
regr
essi
on
(1-an
d3-y
ear
crude
cance
r-sp
ecifi
csu
rviv
al)
Can
cer-
spec
ific
surv
ival
was
hig
her
among
pat
ients
from
hig
hed
uca
tion
leve
l.St
age
atdia
gnosi
sw
asnot
diff
eren
tbet
wee
ned
uca
tional
groups.
The
auth
ors
obse
rved
soci
alin
equal
itie
sin
1-
and
3-y
ear
surv
ival
for
all
pat
ients
,but
afte
rad
just
men
tfo
rkn
ow
npro
gnost
icfa
ctors
and
trea
tmen
t,a
soci
algr
adie
nt
insu
rviv
alre
mai
ned
only
among
wom
enw
ith
earl
y-st
age
dis
ease
.In
men
with
stag
eIII
dis
ease
,th
ere
vers
epat
tern
was
obse
rved
,w
ith
hig
her
risk
ofdea
thin
pat
ients
with
hig
hed
uca
tion
leve
l.
Can
cer-
spec
ific
surv
ival
(both
SES
indic
ators
):Se
x,ag
e,st
age
atdia
gnosi
sC
ance
r-sp
ecifi
chaz
ard
model
s(E
duca
tional
leve
l):
Sex,ag
e,his
topat
holo
gy,
per
form
ance
stat
us,
smoki
ng
stat
us,
trea
tmen
t(s
trat
ified
by
stag
e)
(con
tinue
d)
6

Tab
le1.
(continued
)
Pap
erC
ountr
yof
study
Dat
aso
urc
es/S
ettings
Popula
tion
incl
uded
Yea
rsofdia
gnosi
sA
geat
dia
gnosi
sA
nat
om
icsi
teof
cance
r(s)
Mea
sure
sof
soci
o-e
conom
icposi
tion
(SEP)
No.of
groups
Anal
yses
Des
crip
tion
ofre
sults
Cova
riat
ead
just
edfo
r
Ber
glund
etal
,2012
Engl
and
Tham
esC
ance
rR
egis
try
South
east
Engl
and
2006-2
008
�59-�
80
Lung
Soci
oec
onom
icIn
dex
(SEI)
bas
edon
the
inco
me
dom
ain
of
the
2007
Indic
esof
dep
riva
tion
and
post
code
5Lo
gist
icre
gres
sion,
Cox
pro
port
ional
haz
ards
regr
essi
on
(Ove
rall
surv
ival
),M
ort
ality
rate
sm
odel
edw
ith
flexib
lepar
amet
ric
surv
ival
model
susi
ng
are
stri
cted
cubic
splin
e(o
vera
ll5-y
ear
surv
ival
)
Ove
rall
surv
ival
was
hig
her
inth
em
ost
afflu
ent
group,
espec
ially
for
earl
yst
ages
.W
hile
surv
ival
inad
vance
dst
age
was
poor
inal
lso
cioec
onom
icquin
tile
sw
ith
min
imal
diff
eren
cebet
wee
naf
fluen
tan
ddep
rive
dpat
ients
.In
equal
itie
sin
surv
ival
from
lung
cance
rco
uld
not
be
fully
expla
ined
by
diff
eren
ces
inst
age
atdia
gnosi
s,co
morb
idity
and
type
oftr
eatm
ent.
Sex,ag
eat
dia
gnosi
s,co
morb
idity,
trea
tmen
t
Bhar
athan
etal
,2011
Engl
and
Nort
her
nR
egio
nC
olo
rect
alC
ance
rA
udit
Gro
up
Nort
her
nEngl
and
1998–2002
�60->
80
Colo
rect
um
Indic
esofM
ultip
leD
epri
vation
(IM
D)
2004
(are
a-bas
edm
easu
re)
5Lo
gist
icre
gres
sion,
Kap
lan-M
eier
met
hod
(cru
de
ove
rall
5-y
ear
surv
ival
),C
ox
pro
port
ional
haz
ards
regr
essi
on,
5-y
ear
rela
tive
surv
ival
(Hak
ulin
en-
Ten
kanen
met
hod)
Ove
rall
and
rela
tive
5-
year
surv
ival
was
hig
her
among
afflu
ent
pat
ients
.T
he
diff
eren
cew
aspar
tly
expla
ined
by
vari
atio
nin
com
orb
idity,
urg
ency
ofsu
rger
yan
dcu
rative
rese
ctio
nst
atus.
Dep
riva
tion
rem
ained
asa
sign
ifica
nt
indep
enden
tpre
dic
tor
ofove
rall
surv
ival
.
Age
,se
x,gr
ade,
tum
or
site
and
diff
eren
tiat
ion,
stag
e,oper
ativ
eurg
ency
and
rese
ctio
n
Booth
etal
,2010
Can
ada
Onta
rio
Can
cer
Reg
istr
yO
nta
rio
2003-2
007
NA
Bre
ast,
colo
n,
rect
um
,non-s
mal
lce
lllu
ng,
cerv
ix,
and
lary
nx
Soci
o-e
conom
icst
atus
(bas
edon
com
munity
med
ian
house
hold
inco
me,
censu
s2001)
5K
apla
n-M
eier
met
hod,C
ox
pro
port
ional
haz
ards
regr
essi
on
(ove
rall
and
cance
r-sp
ecifi
c5-y
ear
surv
ival
)
Ove
rall
surv
ival
was
diff
eren
tac
ross
soci
o-e
conom
icgr
oups
for
all
cance
rs.So
cio-
econom
icdis
par
itie
sw
ere
found
inca
nce
rsofbre
ast,
colo
n,an
dla
rynx.
Diff
eren
ces
inst
age
atdia
gnosi
spar
tial
lyex
pla
ined
soci
o-
econom
icin
equal
itie
sin
bre
ast
cance
rsu
rviv
al,but
no
oth
erca
nce
rs.
Age
,st
age
atdia
gnosi
s
(con
tinue
d)
7

Tab
le1.
(continued
)
Pap
erC
ountr
yof
study
Dat
aso
urc
es/S
ettings
Popula
tion
incl
uded
Yea
rsofdia
gnosi
sA
geat
dia
gnosi
sA
nat
om
icsi
teof
cance
r(s)
Mea
sure
sof
soci
o-e
conom
icposi
tion
(SEP)
No.of
groups
Anal
yses
Des
crip
tion
ofre
sults
Cova
riat
ead
just
edfo
r
Bouch
ardy
etal
,2006
Switze
rlan
dG
enev
aca
nce
rre
gist
ryG
enev
a1980-2
000
<70
Bre
ast
Soci
o-e
conom
icst
atus
(bas
edon
indiv
idual
-lev
elocc
upat
ion)
4C
ox
pro
port
ional
haz
ards
regr
essi
on
(5-
and
10-y
ear
ove
rall
and
cance
r-sp
ecifi
csu
rviv
al)
Wom
enfr
om
low
soci
o-e
conom
icst
atus
had
hig
her
risk
ofdyi
ng
due
tobre
ast
cance
r.So
cio-e
conom
icin
equal
itie
sar
epar
tly
expla
ined
by
stag
eat
dia
gnosi
s,tu
mor
char
acte
rist
ics,
met
hod
ofdet
ection
(scr
eenin
g,sy
mpto
m,oth
er),
sect
or
ofca
re(p
ublic
,pri
vate
)an
dtr
eatm
ent.
Age
,per
iod
of
dia
gnosi
s,co
untr
yofbir
th,m
arital
stat
us,
met
hod
of
det
ection,st
age,
his
tolo
gy,tu
mor
char
acte
rist
ics,
sect
or
ofca
rean
dtr
eatm
ent
Bra
aten
etal
,2009
Norw
ayN
OW
AC
(Norw
egia
nW
om
enan
dC
ance
rSt
udy)
Norw
ay1996-2
005
34-6
9C
olo
nan
dre
ctum
,lu
ng,
bre
ast,
ova
ryan
doth
erm
alig
nan
cies
Yea
rsofEduca
tion
(indiv
idual
leve
l)G
ross
house
hold
Inco
me
(indiv
idual
leve
l)
4 5C
ox
pro
port
ional
haz
ards
regr
essi
on
(ove
rall
5-y
ear
surv
ival
)
Both
year
sofed
uca
tion
and
gross
house
hold
inco
me
wer
ein
vers
ely
asso
ciat
edw
ith
all-ca
use
cance
rm
ort
ality.
Hig
her
-educa
ted
wom
enw
ith
ova
rian
cance
rhad
low
erri
skofdyi
ng,
while
mort
ality
risk
among
colo
rect
alca
nce
rpat
ients
incr
ease
dw
ith
year
sof
educa
tion
(not
with
inco
me)
.Educa
tional
ineq
ual
ity
inove
rall
surv
ival
from
colo
nan
dre
ctal
cance
ris
par
tial
lyex
pla
ined
by
stag
eat
dia
gnosi
s,an
dal
though
less
so,by
smoki
ng
and
alco
hol
dri
nki
ng.
For
ova
rian
cance
r,st
age
atdia
gnosi
san
dsm
oki
ng
stat
us
pri
or
todia
gnosi
sdid
not
expla
inth
eobse
rved
diff
eren
ces
acro
ssed
uca
tion
groups.
Age
,house
hold
size
,m
arital
stat
us,
stag
e,sm
oki
ng,
BM
I,phys
ical
activi
ty,
par
ity,
horm
one
repla
cem
ent
ther
apy,
contr
acep
tive
s,al
cohol,
die
t,re
gion
ofliv
ing (c
ontin
ued)
8

Tab
le1.
(continued
)
Pap
erC
ountr
yof
study
Dat
aso
urc
es/S
ettings
Popula
tion
incl
uded
Yea
rsofdia
gnosi
sA
geat
dia
gnosi
sA
nat
om
icsi
teof
cance
r(s)
Mea
sure
sof
soci
o-e
conom
icposi
tion
(SEP)
No.of
groups
Anal
yses
Des
crip
tion
ofre
sults
Cova
riat
ead
just
edfo
r
Bro
okf
ield
etal
,2009
United Stat
esFl
ori
da
Can
cer
Dat
aSy
stem
(FC
DS)
linke
dto
Age
ncy
for
Hea
lthca
reA
dm
inis
trat
ion
(AH
CA
)
Flori
da
1998-2
003
All
ages
Cer
vix
Com
munity
pove
rty
leve
l(b
ased
on
post
code)
4K
apla
n-M
eier
met
hod
(med
ian
surv
ival
),C
ox
pro
port
ional
haz
ards
regr
essi
on
(ove
rall
surv
ival
)
Surv
ival
was
sign
ifica
ntly
low
eram
ong
dis
adva
nta
ged
pat
ients
asco
mpar
edw
ith
afflu
ent
pat
ients
.T
um
or
char
acte
rist
ics
and
trea
tmen
tex
pla
ined
som
eof
the
obse
rved
soci
o-
econom
icdis
par
itie
sin
surv
ival
.
Age
,ra
ce,et
hnic
ity,
com
orb
iditie
s,in
sura
nce
stat
us,
tum
or
stag
e,gr
ade,
his
tolo
gy,an
dtr
eatm
ents
Bye
rset
al,2008
Unite
Stat
esPat
tern
sofC
are
(PO
C)St
udy
oft
he
Nat
ional
Pro
gram
ofC
ance
rR
egis
trie
s(N
PC
R)
Cal
iforn
ia,
Colo
rado,
Illin
ois
,Lo
uis
iana,
New
York
,R
hode
Isla
nd,an
dSo
uth
Car
olin
a
1997
�25
Bre
ast,
colo
rect
um
,pro
stat
eSo
cio-e
conom
icst
atus
(bas
edon
the
educa
tion
and
inco
me
leve
lsofth
ece
nsu
str
act
of
resi
den
ce)
3C
ox
pro
port
ional
haz
ards
regr
essi
on
(ove
rall
5-y
ear
surv
ival
)
Surv
ival
was
low
eram
ong
indiv
idual
sw
ith
bre
ast
cance
rliv
ing
inlo
w-S
ES
area
sco
mpar
edw
ith
those
inaf
fluen
tar
eas.
Soci
oec
onom
icin
equal
itie
sin
ove
rall
5-y
ear
surv
ival
afte
rbre
ast
cance
rw
asex
pla
ined
by
late
rst
age
atdia
gnosi
san
dco
morb
idity,
while
trea
tmen
thad
no
med
iating
effe
ct.
Age
,ra
ce/e
thnic
ity,
com
orb
idity,
stag
e,tr
eatm
ent
(colo
rect
um
and
bre
ast)
,se
xan
dsu
bsi
te(c
olo
rect
um
)
Cav
alli-
Bjo
rkm
anet
al,2011
Swed
enT
wo
Swed
ish
Clin
ical
Qual
ity
Reg
iste
rson
colo
nan
dre
ctal
cance
r
Cen
tral
Swed
en(S
tock
holm
–G
otlan
dan
dU
ppsa
la–
Ore
bro
regi
ons)
1995-2
006
(rec
tal)
1997-2
006
(colo
n)
<75
Colo
nan
dre
ctum
Educa
tion
(indiv
idual
leve
l)3
Kap
lan-M
eier
met
hod
(ove
rall
3-
and
5-
year
surv
ival
),C
ox
pro
port
ional
haz
ards
regr
essi
on,
Rel
ativ
eSu
rviv
al,
Exce
ssm
ort
ality
rate
sm
odel
edusi
ng
Pois
son
regr
essi
on
Hig
hly
educa
ted
pat
ients
with
colo
nor
rect
alca
nce
rhad
hig
her
surv
ival
.D
iffer
ence
sin
elec
tive
or
emer
gency
surg
ery
and
type
of
hosp
ital
or
pre
oper
ativ
era
dio
ther
apy
for
rect
alca
nce
rdid
not
contr
ibute
tohig
her
exce
ssri
skofdea
thdue
toco
lon
or
rect
alca
nce
rin
pat
ients
with
low
educa
tion.
Age
,se
xSt
ratifie
dby
stag
e
Chu
etal
,2016
Can
ada
Pri
nce
ssM
arga
ret
Hosp
ital
/can
cer
cente
r
Toro
nto
2003-2
010
All
ages
Hea
dan
dnec
k(s
quam
ous
cell
carc
inom
a)
Soci
o-e
conom
icst
atus
(nei
ghborh
ood-
leve
lbas
edon
post
code
der
ived
from
2006
Can
ada
Cen
sus)
5C
ox
pro
port
ional
haz
ards
regr
essi
on,
logi
stic
regr
essi
on
(ove
rall
surv
ival
)
Ove
rall
surv
ival
was
wors
eam
ong
pat
ients
with
low
erso
cio-e
conom
icst
atus
whic
hm
aybe
due
todiff
eren
ces
insm
oki
ng,
alco
hol
consu
mptions
and
stag
eat
dia
gnosi
s.
Age
,se
x,st
age,
Alc
oholco
nsu
mption,
smoki
ng
stat
us
(con
tinue
d)
9

Tab
le1.
(continued
)
Pap
erC
ountr
yof
study
Dat
aso
urc
es/S
ettings
Popula
tion
incl
uded
Yea
rsofdia
gnosi
sA
geat
dia
gnosi
sA
nat
om
icsi
teof
cance
r(s)
Mea
sure
sof
soci
o-e
conom
icposi
tion
(SEP)
No.of
groups
Anal
yses
Des
crip
tion
ofre
sults
Cova
riat
ead
just
edfo
r
Com
ber
etal
,2016
Irel
and
Iris
hN
atio
nal
Can
cer
Reg
istr
ylin
ked
topublic
hosp
ital
dis
char
gedat
a(H
osp
ital
Inpat
ient
Enquir
ydat
a)
Irel
and
2004-2
008
All
ages
Non-H
odgk
in’s
lym
phom
aC
ensu
s-bas
eddep
riva
tion
score
(are
a-bas
ed)
Not
applic
able
Dis
cret
e-tim
esu
rviv
alusi
ng
stru
ctura
leq
uat
ion
model
ing
(ove
rall
surv
ival
)
Low
ersu
rviv
alam
ong
dis
adva
nta
ged
pat
ients
was
par
tly
expla
ined
by
pro
bab
ility
ofla
test
age
atdia
gnosi
san
dem
erge
ncy
pre
senta
tion.
Age
Cote
etal
,2019
United Stat
esSu
rvei
llance
,Epid
emio
logy
,an
dEnd
Res
ults
(SEER
)
United
Stat
es2000-2
015
�18
Glio
ma
Soci
oec
onom
icSt
atus
(County
leve
l,ce
nsu
sbas
ed)
5C
ox
pro
port
ional
haz
ards
regr
essi
on
(ove
rall
surv
ival
)
Surv
ival
was
hig
her
for
peo
ple
livin
gin
hig
her
SES
counties
,w
hic
hw
asnot
expla
ined
by
diff
eren
ces
inre
ceiv
ing
radio
ther
apy
and
chem
oth
erap
y.
Age
atdia
gnosi
s,ex
tent
ofsu
rgic
alre
sect
ion
Additio
nal
adju
stm
ent
for
radia
tion
and
chem
oth
erap
y
Dal
ton
etal
,2015
Den
mar
kD
anis
hLu
ng
Can
cer
Reg
iste
rD
enm
ark
2004-2
010
30-8
4Lu
ng
Educa
tion
(indiv
idual
leve
l)In
com
e(h
ouse
hold
)
3 3Lo
gist
icre
gres
sion,
Cox
pro
port
ional
haz
ards
regr
essi
on
(ove
rall
surv
ival
)
Lung
cance
rsu
rviv
alw
asdiff
eren
tby
all
soci
oec
onom
icst
atus
indic
ators
.Educa
tional
ineq
ual
ity
insu
rviv
alpar
tly
expla
ined
by
diff
eren
tial
stag
e,fir
st-lin
etr
eatm
ent,
com
orb
idity
and
per
form
ance
stat
us.
Age
,se
x,per
iod
of
dia
gnosi
s,tr
eatm
ent,
com
orb
idity,
per
form
ance
stat
us
Inco
me
was
adju
sted
for
educa
tion
Dan
zing
etal
,2014
United Stat
esSE
ER
(Surv
ival
,Epid
emio
logy
and
End
Res
ults)
regi
stry
United
Stat
es2004-2
010
�18
Kid
ney
Soci
oec
onom
icSt
atus
(County
leve
l,ce
nsu
sbas
ed)
4K
apla
n-M
eier
met
hod,
Cox
pro
port
ional
haz
ards
regr
essi
on
(can
cer-
spec
ific
surv
ival
)
Low
soci
o-e
conom
icst
atus
was
indep
enden
tly
asso
ciat
edw
ith
poore
rsu
rviv
alfr
om
renal
cance
r.A
uth
ors
sugg
este
dth
atth
eobse
rved
diff
eren
cem
aybe
expla
ined
by
late
stag
eat
dia
gnosi
s.
Age
,se
x,ra
ce,gr
ade,
his
tolo
gy,ye
arof
surg
ery,
pro
cedure
type,
pla
ceof
resi
den
ce,an
dm
arital
stat
us
Deb
etal
,2017
United Stat
esSE
ER
(Surv
ival
,Epid
emio
logy
and
End
Res
ults)
regi
stry
United
Stat
es2003-2
012
All
ages
Glio
ma
Soci
oec
onom
icSt
atus
(County
leve
l,ce
nsu
s-bas
ed)
3 5Lo
gist
icre
gres
sion,
Cox
pro
port
ional
haz
ards
regr
essi
on
(ove
rall
5-y
ear
surv
ival
)
The
obse
rved
low
ersu
rviv
alin
case
sliv
ing
indis
adva
nta
ged
area
sw
asonly
par
tly
expla
ined
by
diff
eren
ces
inth
etr
eatm
ent
rece
ived
(surg
ery
and
radia
tion
ther
apy)
.
Age
atdia
gnosi
s,se
x,
race
,tu
mor
type,
and
tum
or
grad
eA
dditio
nal
adju
stm
ent
for
surg
ery
and
radia
tion
ther
apy
(con
tinue
d)
10

Tab
le1.
(continued
)
Pap
erC
ountr
yof
study
Dat
aso
urc
es/S
ettings
Popula
tion
incl
uded
Yea
rsofdia
gnosi
sA
geat
dia
gnosi
sA
nat
om
icsi
teof
cance
r(s)
Mea
sure
sof
soci
o-e
conom
icposi
tion
(SEP)
No.of
groups
Anal
yses
Des
crip
tion
ofre
sults
Cova
riat
ead
just
edfo
r
DeR
ouen
et,
2018
United Stat
esPro
stat
eC
ance
rSt
udy
(popula
tion-
bas
edca
se-c
ontr
ol
study)
San
Fran
cisc
oB
ayA
rea
and
Los
Ange
les
County
1997-2
003
40-7
9Pro
stat
eEduca
tion
(indiv
idual
leve
l/se
lf-re
port
ed)
Nei
ghborh
ood-lev
elso
cio-e
conom
icst
atus
(SES)
3 5
Cox
pro
port
ional
haz
ards
regr
essi
on
(ove
rall
and
cance
r-sp
ecifi
csu
rviv
al)
Educa
tion
and
SES
wer
ejo
intly
asso
ciat
edw
ith
ove
rall
and
pro
stat
eca
nce
r-sp
ecifi
csu
rviv
alsu
chth
atm
enw
ith
the
low
est
leve
lsof
educa
tion
and
livin
gin
low
SES
area
shad
the
grea
test
risk
of
dea
thco
mpar
edto
colle
gegr
aduat
esliv
ing
inhig
hSE
Sar
eas.
Co-m
orb
iditie
s,hea
lth
beh
avio
rs,hosp
ital
SES
and
envi
ronm
enta
lfa
ctors
did
not
expla
inth
eobse
rved
gap
inpro
stat
eca
nce
r-sp
ecifi
csu
rviv
alby
educa
tion,al
though
the
gap
insu
rviv
alby
SES
dec
reas
edaf
ter
adju
stin
gfo
rth
ese
vari
able
s.
Age
,ra
ce/e
thnic
ity,
study
site
,ce
nsu
s-blo
ck-g
roup
Stra
tifie
dby
stag
eA
dditio
nal
adju
stm
ent
for
nat
ivity
(US-
born
or
fore
ign-b
orn
,co
-morb
iditie
s,hea
lth
beh
avio
rsan
den
viro
nm
enta
lfa
ctors
Dow
nin
get
al,
2007
Engl
and
Nort
her
nan
dY
ork
shir
eC
ance
rR
egis
try
Nort
her
nan
dY
ork
shir
ere
gions
1998-2
000
All
ages
Bre
ast
Tow
nse
nd
Index
for
area
ofre
siden
ce4
Logi
stic
regr
essi
on,
Cox
pro
port
ional
haz
ards
regr
essi
on
(ove
rall
5-y
ear
surv
ival
)
Wom
enfr
om
more
dep
rive
dar
eas
had
incr
ease
dri
skof
dea
thw
hic
hco
uld
be
par
tly
expla
ined
by
stag
eat
dia
gnosi
s
Age
,st
age
Eak
eret
al,2009
Swed
enR
egio
nal
Bre
ast
Can
cer
Reg
iste
rof
the
Uppsa
la/
Ore
bro
Reg
ion
Cen
tral
Swed
en1993-2
003
20-7
9B
reas
tLe
velofed
uca
tion
(indiv
idual
-lev
el)
4C
ox
pro
port
ional
haz
ards
regr
essi
on
(5-y
ear
cance
r-sp
ecifi
csu
rviv
al),
rela
tive
surv
ival
Surv
ival
was
low
eram
ong
dis
adva
nta
ged
pat
ients
.D
iffer
ence
sin
dia
gnost
icin
tensi
ty,tu
mor
char
acte
rist
ics
and
pri
mar
ytr
eatm
ents
did
not
expla
ined
uca
tional
ineq
ual
itie
sin
bre
ast
cance
rsu
rviv
al.
Age
,ye
arofdia
gnosi
s,dia
gnost
icin
tensi
ty,
tum
or
char
acte
rist
ics
and
trea
tmen
ts.
Stra
tifie
dby
stag
eat
dia
gnosi
s (con
tinue
d)
11

Tab
le1.
(continued
)
Pap
erC
ountr
yof
study
Dat
aso
urc
es/S
ettings
Popula
tion
incl
uded
Yea
rsofdia
gnosi
sA
geat
dia
gnosi
sA
nat
om
icsi
teof
cance
r(s)
Mea
sure
sof
soci
o-e
conom
icposi
tion
(SEP)
No.of
groups
Anal
yses
Des
crip
tion
ofre
sults
Cova
riat
ead
just
edfo
r
Engb
erg
etal
,2020
Den
mar
kD
anis
hPan
crea
tic
Can
cer
Dat
abas
eD
enm
ark
2012–2017
All
ages
Pan
crea
sH
ouse
hold
inco
me
4C
ox
pro
port
ional
haz
ards
regr
essi
on
(ove
rall
surv
ival
)
The
ove
rall
surv
ival
was
hig
her
for
case
sw
ith
hig
her
house
hold
inco
me.
Diff
eren
ces
insu
rgic
alre
sect
ion
and
chem
oth
erap
yex
pla
ined
very
little
ofth
eobse
rved
gap
insu
rviv
alac
ross
house
hold
inco
mes
.
Age
group,ye
arof
dia
gnosi
san
dco
morb
idity
(str
atifi
edby
sex)
Additio
nal
adju
stm
ent
for
civi
lst
atus,
educa
tion,r
egio
nof
resi
den
ce,st
age,
surg
ical
rese
ctio
nan
dch
emoth
erap
y
Eri
ksso
net
al,
2013
Swed
enSw
edis
hM
elan
om
aR
egis
ter
Swed
en1990-2
007
All
ages
Mel
anom
aLe
velofed
uca
tion
(indiv
idual
-lev
el)
3K
apla
n-M
eier
met
hod,
Cox
pro
port
ional
haz
ards
regr
essi
on
(can
cer-
spec
ific
surv
ival
)
Can
cer-
spec
ific
surv
ival
was
low
eram
ong
low
educa
ted
pat
ients
whic
his
par
tial
lyex
pla
ined
by
adva
nce
d-s
tage
pre
senta
tion.
Age
,se
x,cl
inic
alst
age
atdia
gnosi
s,tu
mor
site
,his
toge
net
icty
pe,
tum
or
ulc
erat
ion,tu
mor
thic
knes
s,C
lark
’sle
velofin
vasi
on,
livin
gar
ea,p
erio
dof
dia
gnosi
s(a
llm
odel
sw
ere
stra
tifie
dby
hea
lthca
rere
gion)
Fein
glas
set
al,
2015
United Stat
esN
atio
nal
Can
cer
Dat
aB
ase
(NC
BD
)hosp
ital
-bas
edca
nce
rre
gist
ry
United
Stat
es1998-2
006
All
ages
Bre
ast
Soci
oec
onom
icst
atus
(fro
mpat
ients
’co
mbin
edZ
IPco
de
quar
tile
sofce
nsu
s-bas
edm
edia
nin
com
ean
ded
uca
tional
atta
inm
ent
atth
etim
eofdia
gnosi
s)
6C
ox
pro
port
ional
haz
ards
regr
essi
on
(5-
and
10-y
ear
ove
rall
surv
ival
),K
apla
n-M
eier
met
hod
The
hig
hes
tSE
Sgr
oup
had
bet
ter
surv
ival
com
par
edw
ith
the
low
est.
Dis
par
itie
sin
dis
ease
stag
e,in
sura
nce
stat
us
and
trea
tmen
tex
pla
ined
som
eof
surv
ival
ineq
ual
itie
s.C
om
orb
idity
expla
ined
only
ave
rysm
allpro
port
ion
of
the
obse
rved
surv
ival
gap.
Age
,hosp
ital
char
acte
rist
ics,
tim
eper
iod,in
sura
nce
stat
us,
race
/et
hnic
ity,
stag
e,ty
pe
oftr
eatm
ent
Felle
ret
al,2018
Switze
rlan
dSw
iss
Nat
ional
Cohort
(SN
C)
-N
atio
nal
Inst
itute
for
Can
cer
Epid
emio
logy
and
Reg
istr
atio
n(N
ICER
)ca
nce
rre
gist
rynet
work
Switze
rlan
d2001-2
008
30-8
4C
olo
rect
um
Soci
o-e
conom
icposi
tion
(SEP)bas
edon
indiv
idual
-lev
elofed
uca
tion
3C
om
pet
ing
risk
regr
essi
ons
(Fin
ean
dG
ray’
sm
ethod),
Cox
pro
port
ional
haz
ards
regr
essi
on
(ove
rall
and
cance
r-sp
ecifi
csu
rviv
al)
Surv
ival
was
low
erin
pat
ients
with
colo
rect
alca
nce
rw
ith
low
leve
lofS
EP/
educa
tion,w
hic
hw
asonly
par
tly
expla
ined
by
rura
lity
of
resi
den
cean
dst
age
atdia
gnosi
s.
Age
atdia
gnosi
s,se
x,
civi
lst
atus,
and
nat
ional
ity
Additio
nal
adju
sted
for
urb
anity,
langu
age
regi
on
ofre
siden
ce,
tum
or
loca
lizat
ion,
stag
eat
dia
gnosi
san
dca
nto
nof
resi
den
ceFi
nke
etal
,2020
Ger
man
yPopula
tion-b
ased
clin
ical
cance
rre
gist
ries
South
and
Eas
tG
erm
any
2000-2
015
�15
Lung
Ger
man
Index
of
Multip
leD
epri
vation
(are
a-bas
ed)
5C
ox
pro
port
ional
haz
ards
regr
essi
on
(ove
rall
5-y
ear
surv
ival
)
Cas
esliv
ing
inth
em
ost
dep
rive
dar
eas
had
low
erove
rall
surv
ival
com
par
edw
ith
those
livin
gin
the
leas
tdep
rive
dre
gions,
whic
hw
ere
not
expla
inby
tum
or
grad
ean
dst
age
atdia
gnosi
s.
Age
,se
x,ye
arof
dia
gnosi
sA
dditio
nal
adju
stm
ent
for
cance
rsu
bty
pe,
grad
ing
and
stag
e
(con
tinue
d)
12

Tab
le1.
(continued
)
Pap
erC
ountr
yof
study
Dat
aso
urc
es/S
ettings
Popula
tion
incl
uded
Yea
rsofdia
gnosi
sA
geat
dia
gnosi
sA
nat
om
icsi
teof
cance
r(s)
Mea
sure
sof
soci
o-e
conom
icposi
tion
(SEP)
No.of
groups
Anal
yses
Des
crip
tion
ofre
sults
Cova
riat
ead
just
edfo
r
Forr
est
etal
,2015
Engl
and
Linke
ddat
aset
ofth
eN
ort
her
nan
dY
ork
shir
eC
ance
rre
gist
ryan
dH
osp
ital
Epis
ode
Stat
istics
and
lung
cance
rau
dit
dat
a
Nort
her
nan
dY
ork
shir
ere
gions
2006-2
009
All
ages
Lung
Index
ofM
ultip
leD
epri
vation
(are
a-bas
ed)
5Lo
gist
icre
gres
sion
(ove
rall
2-y
ear
surv
ival
)
Surv
ival
was
sign
ifica
ntly
low
erin
the
most
dep
rive
dpat
ients
.In
equal
itie
sin
surv
ival
from
lung
cance
rw
ere
par
tly
expla
ined
by
diff
eren
ces
inre
ceip
tofth
etr
eatm
ent.
Stag
eofdis
ease
and
per
form
ance
stat
us
did
notco
ntr
ibute
toth
eobse
rved
diff
eren
ces.
Age
,se
x,his
tolo
gy,
year
ofdia
gnosi
s,co
morb
idity,
tim
ely
GP
refe
rral
,st
age,
per
form
ance
stat
us,
type
oftr
eatm
ent,
tim
ely
1st
trea
tmen
t
Fred
erik
sen
etal
,2012
Den
mar
kD
anis
hnat
ional
lym
phom
adat
abas
e(L
YFO
)
Den
mar
k2000-2
008
�25
Non-H
odgk
inLy
mphom
aEduca
tion
(indiv
idual
-le
vel,
use
din
multiv
aria
ble
anal
ysis
)H
ouse
hold
inco
me
3 4C
ox
pro
port
ional
haz
ards
regr
essi
on
(ove
rall
surv
ival
),K
apla
n-M
eier
met
hod
Pat
ients
with
low
soci
oec
onom
icposi
tion
had
low
ersu
rviv
al.
Com
orb
idity
slig
htly
contr
ibute
dto
surv
ival
diff
eren
ces.
Oth
ercl
inic
alpro
gnost
icfa
ctors
such
asst
age
atdia
gnosi
s,per
form
ance
stat
us,
extr
anodal
invo
lvem
ent
and
leve
lofLD
Hpar
tly
expla
ined
diff
eren
ces
insu
rviv
al.
Age
,se
x,ye
arof
oper
atio
n,
clust
erin
gat
the
dep
artm
ent
leve
l,co
morb
idity,
per
form
ance
stat
us,
stag
e,ex
tran
odal
invo
lvem
ent,
leve
lofLD
H,IP
Isc
ore
Fred
erik
sen
etal
,2009
Den
mar
kN
atio
nal
clin
ical
dat
abas
eofth
eD
anis
hC
olo
rect
alC
ance
rG
roup
(DC
CG
)
Den
mar
k2001-2
004
61-7
6C
olo
nan
dre
ctum
Inco
me
(indiv
idual
-le
vel)
Educa
tion
(indiv
idual
-le
vel)
Housi
ng
stat
us
(indiv
idual
-lev
el)
1 3 2
Cox
pro
port
ional
haz
ards
regr
essi
on
(ove
rall
surv
ival
)
Surv
ival
was
super
ior
inpat
ients
with
hig
her
SES
com
par
edw
ith
those
with
low
SES.
The
obse
rved
asso
ciat
ion
was
par
tly
expla
ined
by
com
orb
idity
and
toa
less
erex
tent
by
lifes
tyle
,w
hile
stag
eat
dia
gnosi
s,m
ode
of
adm
itta
nce
,ty
pe
of
surg
ery
and
spec
ializ
atio
nof
surg
eon
did
not
contr
ibute
tosu
rviv
aldiff
eren
ces.
Age
,se
x,ye
arof
oper
atio
n,al
cohol,
tobac
co,B
MI,
com
orb
idity,
stag
e,m
ode
of
adm
itta
nce
,sp
ecia
list
surg
eon,
type
or
radic
ality
of
oper
atio
nIn
com
ew
asad
just
edfo
red
uca
tion.
Housi
ng
stat
us
was
adju
sted
for
inco
me
and
educa
tion
(con
tinue
d)
13

Tab
le1.
(continued
)
Pap
erC
ountr
yof
study
Dat
aso
urc
es/S
ettings
Popula
tion
incl
uded
Yea
rsofdia
gnosi
sA
geat
dia
gnosi
sA
nat
om
icsi
teof
cance
r(s)
Mea
sure
sof
soci
o-e
conom
icposi
tion
(SEP)
No.of
groups
Anal
yses
Des
crip
tion
ofre
sults
Cova
riat
ead
just
edfo
r
Gra
dy
etal
,2019
Fran
ceFr
anco
isB
acle
sse
regi
onal
cance
rca
rece
nte
r
Nort
h-W
est
Fran
ce(C
aen)
2011-2
015
�18
Ova
ryEuro
pea
nD
epri
vation
Index
(are
a-bas
ed)
2C
ox
pro
port
ional
haz
ards
regr
essi
on
(3-y
ear
ove
rall
surv
ival
)
Wom
enliv
ing
inm
ore
soci
o-e
conom
ical
lydis
adva
nta
ged
area
shad
low
ersu
rviv
alth
anth
ose
livin
gin
less
dis
adva
nta
ged
reas
ons.
The
obse
rved
gap
insu
rviv
alw
aspar
tly
expla
ined
by
diff
eren
ces
inst
age
and
the
trea
tmen
tre
ceiv
edi.e
.ch
emoth
erap
y,an
dsu
rgic
alre
sect
ion
Age
Additio
nal
adju
stm
ent
for
per
form
ance
stat
us,
grad
e,st
age,
chem
oth
erap
y,su
rgic
alre
sect
ion
Gro
om
eet
al,
2006
Can
ada
Linke
dca
nce
rre
sear
chdat
abas
e(O
nta
rio
Can
cer
Reg
istr
y,hosp
ital
dis
char
ged
dat
a,an
dra
dio
ther
apy
dat
a)
Onta
rio
1982-1
995
All
ages
Lary
nx
Soci
o-e
conom
icst
atus
(are
a-bas
edm
easu
rebas
edon
adju
sted
med
ian
house
hold
inco
me
from
the
Can
adia
nC
ensu
s)
5C
onditio
nal
Cox
pro
port
ional
haz
ards
regr
essi
on
(can
cer-
spec
ific
surv
ival
)
Soci
o-e
conom
icst
atus
was
asso
ciat
edw
ith
lary
nge
alca
nce
routc
om
es;su
rviv
aldis
par
ity
was
only
obse
rved
for
glott
icca
ses.
The
anat
om
icex
tent
of
the
tum
or
expla
ined
som
eofdiff
eren
ces
insu
rviv
alfr
om
glott
icca
nce
r.
T-c
ateg
ory
(the
anat
om
icex
tent
of
the
tum
or)
Guo
etal
,2015
United Stat
esFl
ori
da
Can
cer
Dat
aSy
stem
(FC
DS)
Flori
da
1996-2
010
�20
Ora
lan
dphar
ynx
Soci
o-e
conom
icst
atus
(usi
ng
censu
str
act-
leve
lpove
rty
info
rmat
ion
from
the
2000
U.S
.ce
nsu
sdat
a)
3C
ox
pro
port
ional
haz
ards
regr
essi
on,
med
iation
anal
ysis
(ove
rall
and
cance
r-sp
ecifi
csu
rviv
al)
Low
soci
o-e
conom
icst
atus
was
asso
ciat
edw
ith
poore
rsu
rviv
al.
Hig
her
rate
ofin
div
idual
smoki
ng
was
the
maj
or
contr
ibuto
rto
poore
rsu
rviv
alin
dis
adva
nta
ged
pat
ients
.T
he
med
iation
effe
ctof
indiv
idual
smoki
ng
was
larg
erin
the
mid
dle
SES
group
than
inth
elo
wSE
Sgr
oup.
Age
,se
x,ra
ce/
ethnic
ity,
mar
ital
stat
us,
hea
lth
insu
rance
,ye
arof
dia
gnosi
s,an
atom
icsi
te,st
age,
trea
tmen
t,sm
oki
ng
Hin
eset
al,2014
United Stat
esG
eorg
iaC
om
pre
hen
sive
Can
cer
Reg
istr
y(G
CC
R)
Geo
rgia
2000-2
007
45-8
5C
olo
rect
um
Cen
sus
Tra
ctSo
cioec
onom
icSt
atus
3K
apla
n-M
eier
met
hod,
Cox
pro
port
ional
haz
ards
regr
essi
on
(ove
rall
surv
ival
)
Pat
ients
from
low
soci
o-
econom
icposi
tion
had
hig
her
risk
of
dea
thaf
ter
colo
rect
alca
nce
r.Su
rviv
alin
equal
ity
was
not
expla
ined
by
tum
or
grad
e,st
age
and
trea
tmen
t.
Age
,se
x,ra
ce,dis
ease
stag
e,tu
mor
grad
e,ge
ogr
aphy,
trea
tmen
t(s
urg
ery,
chem
oth
erap
y,or
radia
tion)
(con
tinue
d)
14

Tab
le1.
(continued
)
Pap
erC
ountr
yof
study
Dat
aso
urc
es/S
ettings
Popula
tion
incl
uded
Yea
rsofdia
gnosi
sA
geat
dia
gnosi
sA
nat
om
icsi
teof
cance
r(s)
Mea
sure
sof
soci
o-e
conom
icposi
tion
(SEP)
No.of
groups
Anal
yses
Des
crip
tion
ofre
sults
Cova
riat
ead
just
edfo
r
Ibfe
ltet
al,2015
Den
mar
kD
anis
hG
ynae
colo
gica
lC
ance
rD
atab
ase
(DG
CD
)
Den
mar
k2005-2
010
�25
Ova
ryEduca
tion
(indiv
idual
-le
vel)
Dis
posa
ble
inco
me
(indiv
idual
-lev
el)
3 3Lo
gist
icre
gres
sion,
Cox
pro
port
ional
haz
ards
regr
essi
on
(ove
rall
surv
ival
)
Ther
ew
ere
soci
o-
econom
icin
equal
itie
sin
surv
ival
afte
rova
rian
cance
rth
atw
ere
not
fully
expla
ined
by
dis
ease
stag
e,his
tolo
gyan
dco
-m
orb
iditie
s.
Age
,co
morb
idity,
ASA
score
,ca
nce
rst
age,
tum
or
his
tolo
gica
lsu
bty
pe
Inco
me
was
adju
sted
for
educa
tion
and
cohab
itat
ion
stat
us
Ibfe
ltet
al,2013
Den
mar
kD
anis
hG
ynae
colo
gica
lC
ance
rD
atab
ase
(DG
CD
)
Den
mar
k2005-2
010
�25
Cer
vix
Educa
tion
(indiv
idual
-le
vel)
Dis
posa
ble
inco
me
(indiv
idual
-lev
el)
3 3C
ox
pro
port
ional
haz
ards
regr
essi
on
(ove
rall
surv
ival
)
Surv
ival
was
low
eram
ong
wom
enw
ith
min
imum
educa
tion
and
low
erin
com
e.So
cioec
onom
icdis
par
itie
sin
surv
ival
par
tly
expla
ined
by
stag
eat
dia
gnosi
san
dle
ssby
com
orb
idity
and
smoki
ng
stat
us.
Age
,co
morb
idity,
cance
rst
age,
smoki
ng
stat
us
Cohab
itat
ion
stat
us
was
adju
sted
for
educa
tion.In
com
ew
asad
just
edfo
red
uca
tion
and
cohab
itat
ion
stat
us
Jack
etal
,2006
Engl
and
Tham
esC
ance
rR
egis
try
South
-eas
tLo
ndon
1998
All
ages
Lung
Index
ofM
ultip
leD
epri
vation
(are
a-bas
ed)
5Lo
gist
icre
gres
sion
(ove
rall
1-y
ear
surv
ival
)
Var
iation
intr
eatm
ent
par
tly
expla
ined
diff
eren
ces
inove
rall
surv
ival
.
Age
,se
x,his
tolo
gy,
stag
ean
dbas
isof
dia
gnosi
s,tr
eatm
ent
Jeffre
yset
al,
2009
NewZ
eala
nd
New
Zea
land
Can
cer
Reg
istr
yN
ewZ
eala
nd
1994-2
003
15-9
9A
llm
alig
nan
cies
New
Zea
land
dep
riva
tion
index
(are
a-bas
ed)
45-y
ear
rela
tive
surv
ival
,w
eigh
ted
linea
rre
gres
sion
Soci
oec
onom
icin
equal
itie
sin
cance
rsu
rviv
alw
ere
evid
ent
for
allm
ajor
cance
rs.
Exte
nt
ofdis
ease
expla
ined
som
eof
the
diff
eren
ces
insu
rviv
alfr
om
bre
ast
(33.8
%),
colo
rect
alca
nce
r(1
2.2
%)
and
mel
anom
a(5
0%
)an
dit
expla
ined
alls
oci
o-
econom
icin
equal
itie
sin
surv
ival
ofce
rvic
alca
nce
r.
Dep
riva
tion-
and
ethnic
-spec
ific
life
table
by
age,
sex,
year
Jem
ber
eet
al,
2012
Can
ada
Onta
rio
Can
cer
Reg
istr
yO
nta
rio
1990-2
009
All
ages
Live
r(H
epat
oce
llula
rC
arci
nom
a)N
eigh
borh
ood
Inco
me
5K
apla
n-M
eier
met
hod
(1-,
2-
and
5-y
ear
ove
rall
surv
ival
),C
ox
pro
port
ional
haz
ards
regr
essi
on
Pat
ients
with
hig
her
SES
had
super
ior
surv
ival
com
par
edw
ith
those
with
low
SES.
Surv
ival
dis
par
ity
was
most
lyex
pla
ined
by
rece
ivin
gcu
rative
trea
tmen
tan
dle
ssby
com
orb
idity.
Age
,se
x,co
morb
idity,
ultra
sound
scre
enin
g,an
dcu
rative
trea
tmen
t
(con
tinue
d)
15

Tab
le1.
(continued
)
Pap
erC
ountr
yof
study
Dat
aso
urc
es/S
ettings
Popula
tion
incl
uded
Yea
rsofdia
gnosi
sA
geat
dia
gnosi
sA
nat
om
icsi
teof
cance
r(s)
Mea
sure
sof
soci
o-e
conom
icposi
tion
(SEP)
No.of
groups
Anal
yses
Des
crip
tion
ofre
sults
Cova
riat
ead
just
edfo
r
Johnso
net
al,
2014
United Stat
esG
eorg
iaC
om
pre
hen
sive
Can
cer
Reg
istr
y(G
CC
R)
Geo
rgia
2000-2
009
50-8
5Lu
ng
(non-s
mal
lce
ll)C
ensu
sT
ract
sSo
cioec
onom
icSt
atus
(SES)
4C
ox
pro
port
ional
haz
ards
regr
essi
on
(ove
rall
5-y
ear
surv
ival
)
Pat
ients
livin
gin
dep
rive
dar
eas
with
low
est
leve
lof
educa
tion
and
hig
hes
tle
velof
dep
riva
tion
had
poore
rsu
rviv
al.
Stag
eat
dia
gnosi
s,tu
mor
grad
ean
dtr
eatm
ent
par
tly
expla
ined
surv
ival
diff
eren
ces.
Age
,se
x,ra
ce,st
age,
tum
or
grad
e,an
dtr
eatm
ent
(surg
ery,
chem
oth
erap
y,ra
dia
tion)
Kee
gan
etal
,2015
United Stat
esEle
ctro
nic
med
ical
reco
rds
dat
afr
om
Kai
ser
Per
man
ente
Nort
her
nC
alifo
rnia
linke
dto
dat
afr
om
the
Cal
iforn
iaC
ance
rR
egis
try
Nort
her
nC
alifo
rnia
2004-2
007
45-6
4B
reas
tC
ensu
sT
ract
sSo
cioec
onom
icst
atus
(SES)
2C
ox
pro
port
ional
haz
ards
regr
essi
on
(ove
rall
and
cance
r-sp
ecifi
csu
rviv
al)
Wom
enliv
ing
inlo
w-
SES
nei
ghborh
oods
had
wors
ebre
ast
cance
r-sp
ecifi
csu
rviv
alth
anth
ose
livin
gin
hig
h-S
ES
nei
ghborh
ood,w
hic
hw
ere
not
expla
ined
by
diff
eren
ces
intr
eatm
ent
and
co-
morb
idco
nditio
ns.
Age
,m
arital
stat
us,
subty
pe,
tum
or
size
,ly
mph
node
invo
lvem
ent,
tum
or
grad
ean
dst
age
(str
atifi
edby
race
/et
hnic
ity)
Additio
nal
adju
stm
ent
for
co-m
orb
iditie
s,an
dtr
eatm
ent
modal
itie
sK
imet
al,2011
United Stat
esC
ance
rSu
rvei
llance
Pro
gram
(CSP
)Lo
sA
nge
les
1988-2
006
All
ages
Rec
tum
House
hold
inco
me
3K
apla
n-M
eier
met
hod,
Cox
pro
port
ional
haz
ards
regr
essi
on
(ove
rall
surv
ival
)
Afflu
ent
pat
ients
had
hig
her
surv
ival
afte
rre
ctal
cance
rco
mpar
eto
under
pri
vile
ged
pat
ients
.So
cio-e
conom
icin
equity
insu
rviv
alw
asnot
fully
expla
ined
by
diff
eren
tial
acce
ssto
trea
tmen
t,tu
mor
grad
ean
dex
tent
of
dis
ease
.
Age
,se
x,ra
ce/
ethnic
ity,
imm
igra
tion
stat
us,
tum
or
grad
e,ex
tent
ofdis
ease
,tim
eper
iod,
chem
oth
erap
y,ra
dio
ther
apy,
surg
ery
Lars
enet
al,2
015
Den
mar
kD
anis
hD
iet,
Can
cer
and
Hea
lth
Study
Den
mar
k1993-2
008
54-7
4B
reas
tEduca
tional
leve
l(indiv
idual
-lev
el)
Inco
me
(indiv
idual
-le
vel)
3 3C
ox
pro
port
ional
haz
ards
regr
essi
on
(ove
rall
surv
ival
)
Low
ered
uca
tion
was
asso
ciat
edw
ith
hig
her
risk
ofdea
th.
Educa
tional
diff
eren
ces
insu
rviv
alw
ere
par
tly
expla
ined
by
met
abolic
indic
ators
,sm
oki
ng
stat
us,
alco
holin
take
and
less
by
dis
ease
-re
late
dpro
gnost
icfa
ctors
and
com
orb
idity.
Age
,tu
mor
size
,ly
mph
node
stat
us,
no.of
posi
tive
lym
ph
nodes
,gr
ade
and
rece
pto
rst
atus,
com
orb
idity,
met
abolic
indic
ators
(BM
I,w
aist
circ
um
fere
nce
,dia
bet
es,sm
oki
ng
and
alco
holat
bas
elin
ean
dat
tim
eofdia
gnosi
s)
(con
tinue
d)
16

Tab
le1.
(continued
)
Pap
erC
ountr
yof
study
Dat
aso
urc
es/S
ettings
Popula
tion
incl
uded
Yea
rsofdia
gnosi
sA
geat
dia
gnosi
sA
nat
om
icsi
teof
cance
r(s)
Mea
sure
sof
soci
o-e
conom
icposi
tion
(SEP)
No.of
groups
Anal
yses
Des
crip
tion
ofre
sults
Cova
riat
ead
just
edfo
r
Lars
enet
al,2
016
Den
mar
kD
anis
hD
iet,
Can
cer
and
Hea
lth
study
linke
dto
Dan
ish
Can
cer
Reg
istr
yan
doth
erpopula
tion-b
ased
regi
stri
es
Copen
hag
enor
Aar
hus
area
1993-2
008
�50
Pro
stat
eEduca
tion
(indiv
idual
-le
vel)
Inco
me
(indiv
idual
-le
vel)
3 3C
ox
pro
port
ional
haz
ards
regr
essi
on
(ove
rall
and
cance
r-sp
ecifi
csu
rviv
al)
Cas
esw
ith
low
est
educa
tion
and
inco
me
had
low
erpro
stat
eca
nce
r-sp
ecifi
can
dove
rall
surv
ival
than
thei
rco
unte
rpar
tsw
ith
hig
hes
ted
uca
tion
and
inco
me.
The
obse
rved
low
ersu
rviv
alfo
rca
ses
with
low
est
educa
tion
par
tly
expla
ined
by
trea
tmen
tan
dm
etab
olic
indic
ators
.Fo
rpat
ients
with
low
est
inco
me,
low
ersu
rviv
alw
asnot
expla
ined
by
tum
or
aggr
essi
venes
s,co
morb
idity,
trea
tmen
tor
met
abolic
indic
ators
.
Age
Additio
nal
adju
stm
ent
for
tum
or
aggr
essi
venes
s,co
morb
idity,
trea
tmen
tan
dm
etab
olic
indic
ators
(BM
I,w
aist
circ
um
fere
nce
and
dia
bet
esat
bas
elin
e,an
dB
MIan
ddia
bet
esat
tim
eof
dia
gnosi
s).
Launay
etal
,2012
Fran
ceC
alva
dos
dig
estive
cance
rre
gist
ryC
alva
dos
1997-2
004
All
ages
Eso
phag
us
Tow
nse
nd
index
(are
a-bas
ed)
5R
elat
ive
1-
and
5-y
ear
surv
ival
,Exce
sshaz
ard
model
bas
edon
max
imum
likel
ihood
estim
atio
n(E
stev
em
odel
)
Dep
rive
dpat
ients
had
poore
rsu
rviv
alco
mpar
edw
ith
afflu
ent
pat
ients
.Su
rviv
aldis
par
itie
snot
expla
ined
by
diff
eren
ces
inca
nce
rex
tensi
on
or
morp
holo
gyat
dia
gnosi
s,su
rger
y,ra
dio
ther
apy
and
chem
oth
erap
y.
Age
,se
x,ye
arof
dia
gnosi
s,m
orp
holo
gy,st
age,
trea
tmen
ts(s
urg
ery,
radio
ther
apy,
chem
oth
erap
y)
Leje
une
etal
,2010
Engl
and
Tham
esC
ance
rR
egis
try
Eas
tern
Can
cer
Reg
istr
atio
nan
din
form
atio
nce
nte
rN
ort
her
nan
dY
ork
shir
eC
ance
rR
egis
try
and
info
rmat
ion
serv
ice
Engl
and
1997-2
000
�15
Colo
rect
um
Tow
nse
nd
index
(are
a-bas
ed)
5R
elat
ive
3-y
ear
surv
ival
,ge
ner
aliz
edlin
ear
model
with
Pois
son
Afflu
ent
pat
ients
had
bet
ter
surv
ival
com
par
edw
ith
dis
adva
nta
ged
pat
ients
.T
um
or
stag
epar
tly
expla
ined
soci
o-
econom
icin
equal
itie
sin
surv
ival
afte
rco
lore
ctal
cance
r.Ear
lytr
eatm
ent
(within
the
first
month
follo
win
gdia
gnosi
s)gr
eatly
reduce
dso
cio-
econom
icdiff
eren
ces
insu
rviv
al.
Age
,re
ceip
tof
trea
tmen
tan
dtim
e-to
-tre
atm
ent,
and
stag
eat
dia
gnosi
s
(con
tinue
d)
17
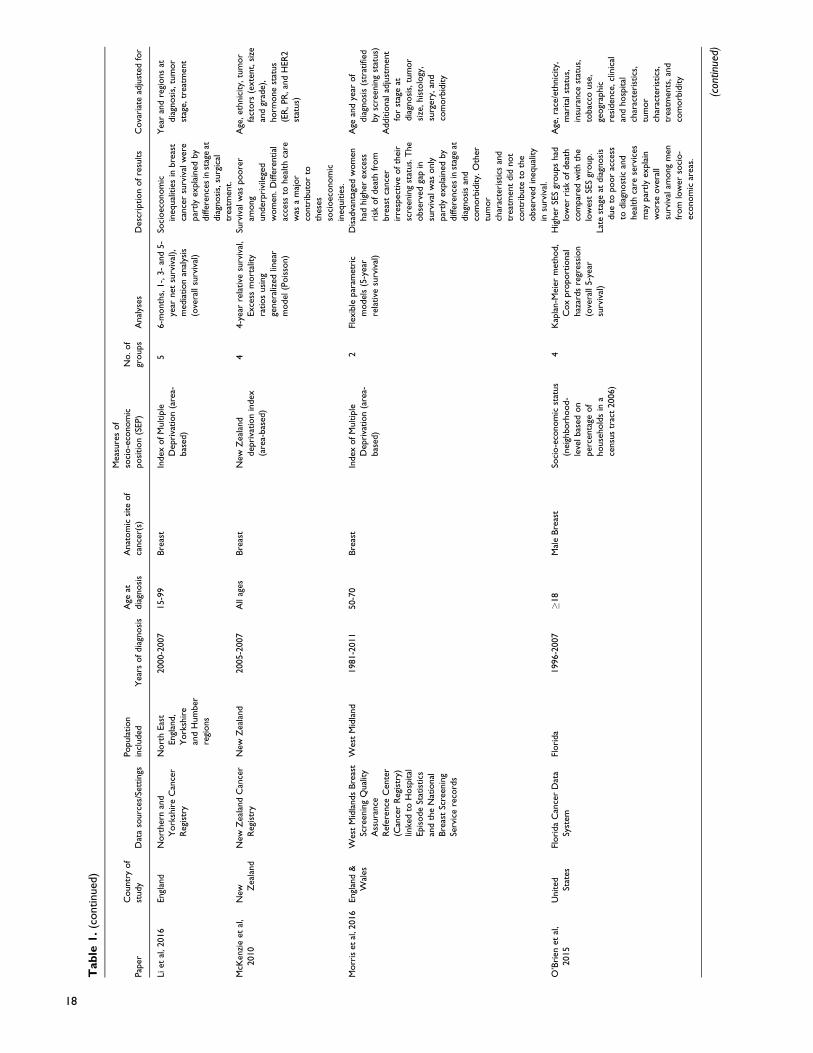
Tab
le1.
(continued
)
Pap
erC
ountr
yof
study
Dat
aso
urc
es/S
ettings
Popula
tion
incl
uded
Yea
rsofdia
gnosi
sA
geat
dia
gnosi
sA
nat
om
icsi
teof
cance
r(s)
Mea
sure
sof
soci
o-e
conom
icposi
tion
(SEP)
No.of
groups
Anal
yses
Des
crip
tion
ofre
sults
Cova
riat
ead
just
edfo
r
Liet
al,2016
Engl
and
Nort
her
nan
dY
ork
shir
eC
ance
rR
egis
try
Nort
hEas
tEngl
and,
York
shir
ean
dH
um
ber
regi
ons
2000-2
007
15-9
9B
reas
tIn
dex
ofM
ultip
leD
epri
vation
(are
a-bas
ed)
56-m
onth
s,1-,
3-
and
5-
year
net
surv
ival
),m
edia
tion
anal
ysis
(ove
rall
surv
ival
)
Soci
oec
onom
icin
equal
itie
sin
bre
ast
cance
rsu
rviv
alw
ere
par
tly
expla
ined
by
diff
eren
ces
inst
age
atdia
gnosi
s,su
rgic
altr
eatm
ent.
Yea
ran
dre
gions
atdia
gnosi
s,tu
mor
stag
e,tr
eatm
ent
McK
enzi
eet
al,
2010
NewZ
eala
nd
New
Zea
land
Can
cer
Reg
istr
yN
ewZ
eala
nd
2005-2
007
All
ages
Bre
ast
New
Zea
land
dep
riva
tion
index
(are
a-bas
ed)
44-y
ear
rela
tive
surv
ival
,Exce
ssm
ort
ality
ratios
usi
ng
gener
aliz
edlin
ear
model
(Pois
son)
Surv
ival
was
poore
ram
ong
under
pri
vile
ged
wom
en.D
iffer
ential
acce
ssto
hea
lth
care
was
am
ajor
contr
ibuto
rto
thes
esso
cioec
onom
icin
equitie
s.
Age
,et
hnic
ity,
tum
or
fact
ors
(exte
nt,
size
and
grad
e),
horm
one
stat
us
(ER
,PR
,an
dH
ER
2st
atus)
Morr
iset
al,2
016
Engl
and
&W
ales
Wes
tM
idla
nds
Bre
ast
Scre
enin
gQ
ual
ity
Ass
ura
nce
Ref
eren
ceC
ente
r(C
ance
rR
egis
try)
linke
dto
Hosp
ital
Epis
ode
Stat
istics
and
the
Nat
ional
Bre
ast
Scre
enin
gSe
rvic
ere
cord
s
Wes
tM
idla
nd
1981-2
011
50-7
0B
reas
tIn
dex
ofM
ultip
leD
epri
vation
(are
a-bas
ed)
2Fl
exib
lepar
amet
ric
model
s(5
-yea
rre
lative
surv
ival
)
Dis
adva
nta
ged
wom
enhad
hig
her
exce
ssri
skofdea
thfr
om
bre
ast
cance
rir
resp
ective
ofth
eir
scre
enin
gst
atus.
The
obse
rved
gap
insu
rviv
alw
asonly
par
tly
expla
ined
by
diff
eren
ces
inst
age
atdia
gnosi
san
dco
morb
idity.
Oth
ertu
mor
char
acte
rist
ics
and
trea
tmen
tdid
not
contr
ibute
toth
eobse
rved
ineq
ual
ity
insu
rviv
al.
Age
and
year
of
dia
gnosi
s(s
trat
ified
by
scre
enin
gst
atus)
Additio
nal
adju
stm
ent
for
stag
eat
dia
gnosi
s,tu
mor
size
,his
tolo
gy,
surg
ery,
and
com
orb
idity
O’B
rien
etal
,2015
United Stat
esFl
ori
da
Can
cer
Dat
aSy
stem
Flori
da
1996-2
007
�18
Mal
eB
reas
tSo
cio-e
conom
icst
atus
(nei
ghborh
ood-
leve
lbas
edon
per
centa
geof
house
hold
sin
ace
nsu
str
act
2006)
4K
apla
n-M
eier
met
hod,
Cox
pro
port
ional
haz
ards
regr
essi
on
(ove
rall
5-y
ear
surv
ival
)
Hig
her
SES
groups
had
low
erri
skofdea
thco
mpar
edw
ith
the
low
est
SES
group.
Late
stag
eat
dia
gnosi
sdue
topoor
acce
ssto
dia
gnost
ican
dhea
lth
care
serv
ices
may
par
tly
expla
inw
ors
eove
rall
surv
ival
among
men
from
low
erso
cio-
econom
icar
eas.
Age
,ra
ce/e
thnic
ity,
mar
ital
stat
us,
insu
rance
stat
us,
tobac
couse
,ge
ogr
aphic
resi
den
ce,cl
inic
alan
dhosp
ital
char
acte
rist
ics,
tum
or
char
acte
rist
ics,
trea
tmen
ts,an
dco
morb
idity
(con
tinue
d)
18

Tab
le1.
(continued
)
Pap
erC
ountr
yof
study
Dat
aso
urc
es/S
ettings
Popula
tion
incl
uded
Yea
rsofdia
gnosi
sA
geat
dia
gnosi
sA
nat
om
icsi
teof
cance
r(s)
Mea
sure
sof
soci
o-e
conom
icposi
tion
(SEP)
No.of
groups
Anal
yses
Des
crip
tion
ofre
sults
Cova
riat
ead
just
edfo
r
Oh
etal
,2020
United Stat
esC
alifo
rnia
Can
cer
Reg
istr
yC
alifo
rnia
1997-2
014
All
ages
Colo
rect
um
Soci
o-e
conom
icst
atus
(nei
ghborh
ood
SES
bas
edon
2000
censu
s)
5C
ox
pro
port
ional
haz
ards
regr
essi
on
(can
cer-
spec
ific
5-
year
surv
ival
)
The
obse
rved
low
ersu
rviv
alin
colo
rect
alca
nce
rpat
ients
livin
gin
more
dis
adva
nta
gear
eas
wer
enot
expla
ined
by
diff
eren
tial
stag
eat
dia
gnosi
s,oth
ertu
mor
char
acte
rist
ics,
trea
tmen
tre
ceiv
ed,
and
nei
ghborh
ood
and
hosp
ital
char
acte
rist
ics.
Age
,ye
ar,se
xan
dm
arital
stat
us
(str
atifi
edby
per
iod
ofdia
gnosi
s)A
dditio
nal
adju
stm
ent
for
subsi
te,st
age,
tum
or
size
,tu
mor
grad
e,su
rger
y,ra
dia
tion,
nei
ghborh
ood
and
hosp
ital
char
acte
rist
ics
Phill
ips
etal
,2019
Engl
and
Pan
-Bir
min
gham
Gyn
aeco
logi
cal
Can
cer
Cen
ter
Bir
min
gham
2007-2
017
All
ages
Ova
ry(a
dva
nce
ddis
ease
)In
dex
ofM
ultip
leD
epri
vation
(are
a-bas
ed)
5K
apla
n–M
eier
met
hod
(ove
rall
surv
ival
)So
cio-e
conom
icdiff
eren
ces
inove
rall
surv
ival
obse
rved
among
stag
eIIIan
dIV
ova
rian
cance
rpat
ients
wer
epar
tly
expla
ined
by
not
rece
ivin
gsu
rgic
altr
eatm
ent.
Age
Quag
liaet
al,
2011
Ital
yLi
guri
aR
egio
nC
ance
rR
egis
try
Gen
oa
1996-2
000
All
ages
Bre
ast
Dep
riva
tion
index
(bas
edon
the
info
rmat
ion
dra
wn
from
the
censu
sof
2001)
55-y
ear
rela
tive
surv
ival
(Hak
ulin
en–
Ten
kanen
met
hod),
Exce
ssm
ort
ality
ratios
usi
ng
gener
aliz
edlin
ear
model
(Pois
son)
Dep
rive
dw
om
enhad
poore
rsu
rviv
alco
mpar
edw
ith
afflu
ent
wom
en.
Obse
rved
dis
par
itie
sco
uld
be
par
tly
expla
ined
by
diff
eren
ces
intu
mor
char
acte
rist
ics
and
the
trea
tmen
tre
ceiv
ed.
Age
,tu
mor
size
,ly
mph
nodes
stat
us,
estr
oge
nre
cepto
rst
atus,
type
of
surg
ery,
radio
ther
apy,
lym
phad
enec
tom
y,horm
onal
ther
apy
Rober
tson
etal
,2010
Scotlan
dSc
ott
ish
Hea
dan
dN
eck
Audit,
Scotlan
dH
osp
ital
(pro
spec
tive
cohort
study)
Scotlan
d1999-2
001
All
ages
Hea
dan
dN
eck
Soci
o-e
conom
icst
atus
(are
a-bas
edusi
ng
the
2001
DEPC
AT
score
)
3C
ox
pro
port
ional
haz
ards
regr
essi
on
(ove
rall
and
cance
r-sp
ecifi
c5-y
ear
surv
ival
)
Soci
o-e
conom
icdiff
eren
ces
insu
rviv
alfr
om
hea
dan
dnec
kca
nce
rsex
pla
ined
by
vari
atio
ns
inst
age
atdia
gnosi
s,tu
mor
diff
eren
tiat
ion,
smoki
ng,
alco
hol
dri
nki
ng
and
pat
ient’s
per
form
ance
stat
us.
Age
,st
age,
tum
or
site
,diff
eren
tiat
ion,
WH
Oper
form
ance
stat
us,
smoki
ng
and
alco
holdri
nki
ng
stat
us
Ruth
erfo
rdet
al,
2013
Engl
and
Eas
tern
Can
cer
Reg
istr
atio
nan
dIn
form
atio
nC
ente
r(E
CR
IC)
Eas
tofEngl
and
2006-2
010
�30
Bre
ast
Index
ofM
ultip
leD
epri
vation
(are
a-bas
ed)
55-y
ear
rela
tive
surv
ival
,Exce
ssm
ort
ality
rate
ratios
(fle
xib
lepar
amet
ric
model
)
Surv
ival
dis
par
itie
sam
ong
wom
enw
ith
mid
dle
SES
alm
ost
expla
ined
by
stag
eat
dia
gnosi
s,w
hile
dis
ease
stag
ehad
no
effe
cton
surv
ival
among
the
most
dep
rive
dw
om
en.
Age
,st
age (c
ontin
ued)
19

Tab
le1.
(continued
)
Pap
erC
ountr
yof
study
Dat
aso
urc
es/S
ettings
Popula
tion
incl
uded
Yea
rsofdia
gnosi
sA
geat
dia
gnosi
sA
nat
om
icsi
teof
cance
r(s)
Mea
sure
sof
soci
o-e
conom
icposi
tion
(SEP)
No.of
groups
Anal
yses
Des
crip
tion
ofre
sults
Cova
riat
ead
just
edfo
r
Seid
elin
etal
,2016
Den
mar
kD
anis
hG
ynae
colo
gica
lC
ance
rD
atab
ase
Den
mar
k2005-2
009
25-9
0Endom
etri
um
Educa
tion
leve
l(indiv
idual
-lev
el)
3Lo
gist
icre
gres
sion,
Cox
pro
port
ional
haz
ards
regr
essi
on
(ove
rall
surv
ival
)
Min
imum
educa
tion
was
asso
ciat
edw
ith
hig
her
risk
ofdea
th.
Diff
eren
ces
inst
age
atdia
gnosi
spar
tial
lyex
pla
ined
educa
tional
ineq
ual
itie
sin
surv
ival
from
endom
etri
alca
nce
r.C
om
orb
idity
did
not
alte
rth
ere
sults.
Age
,co
hab
itat
ion
stat
us,
body
mas
sin
dex
(BM
I),
smoki
ng
stat
us,
com
orb
idity,
stag
e
Shaf
ique
etal
,2013
Scotlan
dSc
ott
ish
Can
cer
Reg
istr
yW
est
of
Scotlan
d1991-2
007
All
ages
Pro
stat
eSc
ott
ish
Index
of
Multip
leD
epri
vation
(SIM
D)
2004
score
(are
a-bas
ed)
55-y
ear
rela
tive
surv
ival
(Eder
erII),
Rel
ativ
eex
cess
risk
(full
likel
ihood
appro
ach),
Cox
pro
port
ional
haz
ards
regr
essi
on
Soci
o-e
conom
icin
equal
itie
sex
ist
insu
rviv
alofpro
stat
eca
nce
ran
dw
iden
edove
rtim
e.D
iffer
ential
stag
eat
dia
gnosi
sonly
par
tly
expla
ined
dep
riva
tion
gap
inpro
stat
eca
nce
rsu
rviv
al.
Age
,G
leas
on
grad
e,per
iod
ofdia
gnosi
s
Shar
if-M
acro
etal
,2015
United Stat
esC
alifo
rnia
Bre
ast
Can
cer
Surv
ivors
hip
Conso
rtiu
m
Cal
iforn
ia1993-2
007
�25
Bre
ast
Educa
tion
(sel
f-re
port
ed)
Nei
ghborh
ood
soci
o-
econom
icst
atus
(nSE
S)
4 5C
ox
pro
port
ional
haz
ards
regr
essi
on
(ove
rall
and
cance
r-sp
ecifi
csu
rviv
al)
Cas
esw
ith
low
educa
tion
and
low
SES
had
low
erove
rall
and
bre
ast
cance
r-sp
ecifi
csu
rviv
al,w
hic
hw
aspar
tly
expla
ined
by
hea
lth-r
elat
edlif
esty
lebeh
avio
rs,
co-m
orb
iditie
san
dhosp
ital
fact
ors
.T
reat
men
tdid
not
contr
ibute
toth
eobse
rved
gap
insu
rviv
al.
Age
,ye
arofdia
gnosi
s,ca
nce
rre
gist
ryre
gion,tu
mor
fact
ors
(str
atifi
edby
race
/et
hnic
ity)
(str
atifi
edby
race
/eth
nic
ity)
Additio
nal
adju
stm
ent
for
trea
tmen
t(s
urg
ery,
chem
oth
erap
y,ra
dia
tion),
par
ity,
mar
ital
stat
us,
hea
lth-r
elat
edlif
esty
lebeh
avio
rs,
com
orb
idity
and
hosp
ital
fact
ors
Singe
ret
al,2017
Ger
man
yLe
ipzi
gU
niv
ersi
tyM
edic
alC
ente
r,St
.Elis
abet
hH
osp
ital
Leip
zig,
St.G
eorg
Hosp
ital
Leip
zig
Leip
zig
No
info
rmat
ion�
18
All
mal
ignan
cies
com
bin
edSc
hooled
uca
tion
(indiv
idual
-lev
el)
Voca
tional
trai
nin
g(indiv
idual
-lev
el)
Job
grad
e(indiv
idual
-le
vel)
Job
type
(indiv
idual
-le
vel)
Inco
me
(house
hold
)
3 4 3 2 4
Pois
son
regr
essi
on
(ove
rall
10-y
ear
surv
ival
)
Ther
ew
ere
no
asso
ciat
ions
of
schoole
duca
tion
and
job
grad
ew
ith
surv
ival
.C
ases
with
blu
e-co
llar
jobs,
voca
tional
trai
nin
g,an
dlo
wer
leve
lofin
com
ehav
elo
wer
surv
ival
whic
hw
asnot
expla
ined
by
diff
eren
ces
inhea
lth
beh
avio
rs.
Age
,se
x,co
hab
itat
ion,
site
,st
age
atdia
gnosi
sA
dditio
nal
adju
stm
ent
for
hea
lth
beh
avio
r
(con
tinue
d)
20

Tab
le1.
(continued
)
Pap
erC
ountr
yof
study
Dat
aso
urc
es/S
ettings
Popula
tion
incl
uded
Yea
rsofdia
gnosi
sA
geat
dia
gnosi
sA
nat
om
icsi
teof
cance
r(s)
Mea
sure
sof
soci
o-e
conom
icposi
tion
(SEP)
No.of
groups
Anal
yses
Des
crip
tion
ofre
sults
Cova
riat
ead
just
edfo
r
Spra
gue
etal
,2011
United Stat
esT
wo
popula
tion-
bas
ed,ca
se-
contr
olst
udie
s
Wis
consi
n1995-2
003
20-6
9B
reas
tIn
div
idual
-lev
el-E
duca
tion
-Inco
me-
to-p
ove
rty
ratio
com
munity-
leve
l-%
without
ahig
hsc
hooldip
lom
a-%
inpove
rty
3 3 3 3
Cox
pro
port
ional
haz
ards
regr
essi
on
(ove
rall
and
cance
r-sp
ecifi
csu
rviv
al)
Surv
ival
rate
was
low
eram
ong
pat
ients
with
less
educa
tion,le
ssin
com
e,or
livin
gin
area
sw
ith
low
com
munity-
leve
led
uca
tion.
Scre
enin
gpar
tici
pat
ion,
stag
eat
dia
gnosi
sex
pla
ined
surv
ival
diff
eren
ces
by
indiv
idual
-lev
elin
com
ean
dex
pla
ined
som
eof
the
surv
ival
diff
eren
ces
by
indiv
idual
-an
dco
mm
unity-
leve
l-ed
uca
tion.
Life
styl
efa
ctors
had
am
inor
effe
cton
the
obse
rved
diff
eren
ces
insu
rviv
al.
Age
,ye
arofdia
gnosi
s,his
tolo
gic
type,
stag
eat
dia
gnosi
s,m
amm
ogr
aphy
use
,sm
oki
ng
his
tory
,fa
mily
his
tory
of
bre
ast
cance
r,B
MI
(body
mas
sin
dex
),post
men
opau
sal
horm
one
use
and
soci
o-e
conom
icva
riab
les
(as
requir
ed)
Stro
mber
get
al,
2016
Swed
enN
atio
nal
Can
cer
Reg
iste
ran
dth
enat
ional
Swed
ish
Mel
anom
aQ
ual
ity
Reg
iste
r
South
ern
and
the
Wes
tern
Swed
en
2004-2
013
�15
Mel
anom
aEduca
tion
leve
l(indiv
idual
-lev
el)
35-y
ear
rela
tive
surv
ival
,5-y
ear
exce
ssm
ort
ality
rate
s(m
axim
um
likel
ihood
model
)
Stag
eat
dia
gnosi
sex
pla
ined
som
eof
educa
tional
ineq
ual
itie
sin
surv
ival
from
cuta
neo
us
mal
ignan
tm
elan
om
a.
Age
,se
x,re
siden
tial
area
,st
age
atdia
gnosi
s
Sword
set
al,
2020
United Stat
esSE
ER
(Surv
ival
,Epid
emio
logy
and
End
Res
ults)
regi
stry
United
Stat
es2007-2
015
18-8
0G
astr
oin
test
inal
mal
ignan
cies
(9ca
nce
rty
pes
)
Cen
sus
trac
t-le
vel
soci
o-e
conom
icst
atus
(SES)
2K
apla
n-M
eier
met
hod
(ove
rall
and
cance
r-sp
ecifi
c5-y
ear
surv
ival
)C
ausa
lm
edia
tion
anal
ysis
Diff
eren
ces
inre
ceiv
ing
surg
ery
expla
ined
one
thir
dofso
cio-
econom
icin
equal
itie
sin
surv
ival
for
pat
ients
with
esophag
eal
aden
oca
rcin
om
a,ex
trah
epat
icch
ola
ngi
oca
rcin
om
a,an
dpan
crea
tic
aden
oca
rcin
om
a.
Age
,se
x,ra
ce/
ethnic
ity,
per
sonal
cance
rhis
tory
,an
dye
arofdia
gnosi
s
Ter
vonen
etal
,2017
Aust
ralia
New
South
Wal
esC
ance
rR
egis
try
New
South
Wal
es1980-2
008
All
ages
All
mal
ignan
cies
Index
ofR
elat
ive
Soci
o-
Eco
nom
icD
isad
vanta
ge(a
ggre
gate
dco
mposi
tem
easu
reofso
cio-e
conom
icposi
tion
bas
edon
case
susu
alre
siden
tial
addre
ssat
the
censu
scl
ose
stto
thei
rye
arofdia
gnosi
s)
5C
om
pet
ing
risk
regr
essi
on
model
s(F
ine
&G
ray
met
hod)
cance
r-sp
ecifi
csu
rviv
al
Cas
esliv
ing
inm
ore
dis
adva
nta
ged
area
shad
low
ersu
rviv
alco
mpar
edw
ith
those
livin
gin
less
dis
adva
nta
ged
regi
ons.
The
obse
rved
gap
inca
nce
rsu
rviv
alw
asnot
expla
ined
by
diff
eren
tial
stag
eat
dia
gnosi
s.
Age
,se
x,dia
gnost
icper
iod,re
mote
nes
s,co
untr
yofbir
th(s
trat
ified
by
per
iod
ofdia
gnosi
s)A
dditio
nal
adju
stm
ent
for
cance
rsi
tean
dsu
mm
ary
stag
e
(con
tinue
d)
21

Tab
le1.
(continued
)
Pap
erC
ountr
yof
study
Dat
aso
urc
es/S
ettings
Popula
tion
incl
uded
Yea
rsofdia
gnosi
sA
geat
dia
gnosi
sA
nat
om
icsi
teof
cance
r(s)
Mea
sure
sof
soci
o-e
conom
icposi
tion
(SEP)
No.of
groups
Anal
yses
Des
crip
tion
ofre
sults
Cova
riat
ead
just
edfo
r
Torb
rand
etal
,2017
Swed
enPen
ileC
ance
rD
ata
Bas
eSw
eden
(Pen
CB
aSe)
linke
dto
Nat
ional
Pen
ileC
ance
rR
egis
ter
(NPEC
R)
and
seve
raloth
erpopula
tion-b
ased
hea
lthca
rean
dso
ciodem
ogr
aphic
regi
ster
s
Swed
en2000-2
012
All
ages
Pen
isEduca
tional
leve
l(indiv
idual
-lev
el)
Dis
posa
ble
inco
me
(indiv
idual
-lev
el)
3 2C
ox
pro
port
ional
haz
ards
regr
essi
on
(ove
rall
and
cance
r-sp
ecifi
c1-
and
3-
year
surv
ival
)
Low
erle
vels
of
educa
tion
and
inco
me
wer
eas
soci
ated
with
low
ersu
rviv
alal
though
the
confid
ence
inte
rval
was
wid
e.In
equal
itie
sin
surv
ival
wer
enot
expla
ined
by
diff
eren
ces
inst
age
atdia
gnosi
san
dco
-morb
idco
nditio
ns.
Age
Additio
nal
adju
stm
ent
for
TN
Mst
age
and
com
orb
idity
Ued
aet
al,2006
Japan
Osa
kaC
ance
rR
egis
try
Osa
ka1975-1
997
All
ages
Cer
vix
and
corp
us
Soci
o-e
conom
icst
atus
(Munic
ipal
ity-
bas
edusi
ng
unem
plo
ymen
tan
dco
llege
/gra
duat
esc
hools
grad
uat
esw
ithin
67
munic
ipal
itie
s)
3 3K
apla
n-M
eier
met
hod,
Cox
pro
port
ional
haz
ards
regr
essi
on
(ove
rall
5-y
ear
surv
ival
)
Diff
eren
ces
insu
rviv
alfo
rce
rvic
alan
dco
rpus
cance
rpat
ients
wer
eobse
rved
among
hig
h,m
iddle
and
low
educa
tion/
unem
plo
ymen
tm
unic
ipal
itie
s.St
age,
his
tolo
gyan
dtr
eatm
ent
only
par
tly
expla
ined
obse
rved
soci
o-
econom
icdiff
eren
ces
insu
rviv
alfr
om
cerv
ical
cance
r.St
age
and
his
tolo
gypar
tial
lyex
pla
ined
soci
o-e
conom
icin
equal
ity
insu
rviv
alfr
om
corp
us
cance
r;tr
eatm
ent
did
not
mak
ean
ydiff
eren
ce.
Age
,ca
nce
rst
age,
his
tolo
gy,t
reat
men
tty
pe
Val
lance
etal
,2018
Engl
and
Nat
ional
Bow
elC
ance
rA
udit
(NB
OC
A)
linke
dto
Hosp
ital
Epis
ode
Stat
istics
(HES)
dat
a
Engl
and
2011-2
015
All
ages
Colo
rect
um
(met
asta
size
dto
liver
)
Index
ofM
ultip
leD
epri
vation
(are
a-bas
ed)
5C
ox
pro
port
ional
haz
ards
regr
essi
on
(ove
rall
3-y
ear
surv
ival
)
Dis
adva
nta
ged
pat
ients
had
low
ersu
rviv
alw
hic
hw
aspar
tly
expla
ined
by
rece
ivin
gliv
erre
sect
ion.
Age
,se
x,em
erge
ncy
adm
issi
on,co
-m
orb
iditie
s,ca
nce
rsi
te,st
age,
and
hep
atobili
ary
serv
ices
on-s
ite
Stra
tifie
dby
liver
rese
ctio
n
(con
tinue
d)
22

Tab
le1.
(continued
)
Pap
erC
ountr
yof
study
Dat
aso
urc
es/S
ettings
Popula
tion
incl
uded
Yea
rsofdia
gnosi
sA
geat
dia
gnosi
sA
nat
om
icsi
teof
cance
r(s)
Mea
sure
sof
soci
o-e
conom
icposi
tion
(SEP)
No.of
groups
Anal
yses
Des
crip
tion
ofre
sults
Cova
riat
ead
just
edfo
r
Wal
shet
al,2014
Irel
and
Iris
hN
atio
nal
Can
cer
Reg
istr
yIr
elan
d1999-2
008
15-9
9B
reas
tSA
HR
Uin
dex
ofso
cial
dep
riva
tion
(are
a-bas
ed)
5M
odifi
edPois
son
regr
essi
on,C
ox
pro
port
ional
haz
ards
regr
essi
on
(Age
-sta
ndar
diz
ed5-
and
10-y
ear
cause
-sp
ecifi
csu
rviv
al)
Wom
enfr
om
the
most
dep
rive
dar
eas
wer
e33%
more
likel
yto
die
ofbre
ast
cance
rco
mpar
edw
ith
wom
enfr
om
the
leas
tdis
adva
nta
ged
area
s.Pat
ient
and
tum
or
char
acte
rist
ics
par
tial
lyex
pla
ined
dep
riva
tion-r
elat
edin
equal
ity;
trea
tmen
tdid
not
mak
ean
ysi
gnifi
cant
diff
eren
ce.
Stra
tifie
dby
age,
TN
Mst
age
and
tum
or
grad
eA
dju
sted
for
met
hod
of
pre
senta
tion,
smoki
ng
stat
us,
regi
on
ofre
siden
ce,
dia
gnosi
sye
ar,
tum
or
morp
holo
gy,
horm
one
rece
pto
rst
atus,
trea
tmen
tw
ithin
12
month
sof
dia
gnosi
s
Woods
etal
,2016
Engl
and
Aust
ralia
Wes
tM
idla
nds
and
New
South
Wal
esca
nce
rre
gist
ries
Wes
tM
idla
nds
New
South
Wal
es
1997-2
006
50-6
5B
reas
tSo
cio-e
conom
icst
atus
bas
edon
the
unem
plo
ymen
tra
teofth
esm
allar
eaof
resi
den
ce
55-y
ear
net
surv
ival
(Pohar
-Per
me
met
hod)
Surv
ival
was
alm
ost
sim
ilar
among
afflu
ent
and
dep
rive
dw
om
enin
New
South
Wal
esir
resp
ective
ofw
ayofdia
gnosi
s;but
inth
eW
est
Mid
lands,
ther
ew
ere
sign
ifica
nt
larg
ediff
eren
ces
among
afflu
ent
and
dep
rive
dw
om
enin
both
scre
enin
ggr
oups,
whic
hw
ere
not
expla
ined
by
exte
nt
ofdis
ease
atdia
gnosi
s.
Adju
sted
for
regi
on,
cale
ndar
year
,ag
e,le
ad-t
ime
bia
san
dove
rdia
gnosi
s
Yu
etal
,2009
United Stat
es13
popula
tion-b
ased
cance
rre
gist
ries
par
tici
pat
edin
the
SEER
pro
gram
13
stat
esin
the
US
1998-2
002
�15
Bre
ast
soci
o-e
conom
icst
atus
(are
a-bas
ed)
4C
ox
pro
port
ional
haz
ards
regr
essi
on
(can
cer-
spec
ific
5-
year
surv
ival
)
Wom
enfr
om
the
most
dis
adva
nta
ged
area
shad
hig
her
risk
of
cance
r-re
late
ddea
thco
mpar
edw
ith
wom
enfr
om
afflu
ent
regi
ons,
whic
hw
asm
ost
lyex
pla
ined
by
stag
eat
dia
gnosi
san
dle
ssby
first
cours
etr
eatm
ent.
Age
,ye
arofdia
gnosi
s,A
JCC
stag
e,num
ber
ofposi
tive
lym
ph
nodes
,fir
stco
urs
etr
eatm
ents
,ra
ce,ru
ral/urb
anre
siden
ce (con
tinue
d)
23

Tab
le1.
(continued
)
Pap
erC
ountr
yof
study
Dat
aso
urc
es/S
ettings
Popula
tion
incl
uded
Yea
rsofdia
gnosi
sA
geat
dia
gnosi
sA
nat
om
icsi
teof
cance
r(s)
Mea
sure
sof
soci
o-e
conom
icposi
tion
(SEP)
No.of
groups
Anal
yses
Des
crip
tion
ofre
sults
Cova
riat
ead
just
edfo
r
Yu
etal
,2008
Aust
ralia
New
South
Wal
esC
entr
alC
ance
rR
egis
try
New
South
Wal
es1992-2
000
15-8
9A
llm
alig
nan
cies
(13
maj
or
types
of
cance
rs)
Index
ofR
elat
ive
Soci
o-
Eco
nom
icD
isad
vanta
ge(I
RSD
),ag
greg
ated
com
posi
tem
easu
reofso
cio-e
conom
icposi
tion
bas
edon
case
susu
alre
siden
tial
addre
ssat
the
censu
scl
ose
stto
thei
rye
arofdia
gnosi
s
55-y
ear
rela
tive
surv
ival
(per
iod
met
hod),
rela
tive
exce
ssri
skm
odel
usi
ng
Pois
son
regr
essi
on
Pat
ients
from
the
most
dis
adva
nta
ged
area
shad
poore
rsu
rviv
alfo
rca
nce
rsofth
est
om
ach,liv
er,lu
ng,
bre
ast,
colo
n,
rect
um
,ova
ry,a
nd
all
cance
rsco
mbin
ed.
Aft
erco
ntr
olli
ng
for
stag
eat
dia
gnosi
s,th
esi
gnifi
cant
surv
ival
diff
eren
ces
bet
wee
nso
cio-
econom
icgr
oups
dis
appea
red
for
ova
rian
cance
r;th
eef
fect
ofSE
Son
surv
ival
from
liver
and
bre
ast
cance
rdec
reas
edaf
ter
adju
stin
gfo
rst
age.
The
surv
ival
diff
eren
ces
for
allca
nce
rsin
the
most
dis
adva
nta
ged
area
sdec
reas
edaf
ter
contr
olli
ng
for
rem
ote
nes
sof
resi
den
ce.
Additio
nal
adju
stm
ent
for
stag
edid
not
chan
geth
ere
sults.
Age
,se
x,an
dye
arof
follo
w-u
p,st
age
atdia
gnosi
s,re
mote
nes
sof
resi
den
ce
Zai
tsu
etal
,2019
Japan
Kan
agaw
aC
ance
rR
egis
try
Kan
agaw
a1970-2
011
All
ages
Pan
crea
sO
ccupat
ion
(indiv
idual
-le
vel)
4K
apla
n-M
eier
met
hod,
Cox
pro
port
ional
haz
ards
regr
essi
on
(ove
rall
5-y
ear
surv
ival
)
Pat
ients
with
low
erle
vels
of
occ
upat
ional
clas
shad
low
ersu
rviv
al,
whic
hw
asnot
expla
ined
by
diff
eren
ces
insu
rger
y,ch
emoth
erap
y,st
age
atdia
gnosi
or
smoki
ng
hab
its.
Age
,se
x,ye
arof
dia
gnosi
sA
dditio
nal
adju
stm
ent
for
surg
ery,
chem
oth
erap
y,st
age,
tum
or
grad
ean
dsm
oki
ng
hab
its
24

Different approaches were used to attempt to explain the
underlying reasons for socio-economic inequalities in cancer
survival. Most studies applied the “difference method,” which
compares regression coefficients for exposure on outcome
from models with and without adjusting for potential media-
tors.6-8,10-15,17-28,30,31,33,35-37,39-44,46,47,50-53,55-57,59,60,62-67,69-79
Other studies examined the distribution of cases across
socio-economic categories by the mediator(s) of interest or
stratified the relative risk or survival rate estimates by
potential mediators.9,16,32,34,45,48,49,58,61 Four studies applied
causal mediation analysis.29,38,54,68
Factors Explaining Socio-Economic Inequalities in Survival
Cancer-specific survival. Sixteen studies examined the underly-
ing causes of educational and socio-economic inequalities in
breast cancer survival: 8 from Europe,9,13,18,30,32,36,44,49 5 from
the US,59-61,65,67 2 from New Zealand76,77 and 1 from Austra-
lia.74 Studies from Switzerland, Italy, Ireland, New Zealand
and Australia applying the difference method reported consis-
tent findings that stage at diagnosis, other tumor characteristics,
method of detection or presentation (symptomatic, screening,
incidental, unknown), and receiving suboptimal treatment and
sector of care (private or public) only partly explained the
observed socio-economic inequalities in breast cancer sur-
vival.13,30,36,76,77,74 In contrast, studies from the Netherlands
and Sweden found that the observed lower survival among
disadvantaged women, or those with low level of education,
was not explained by variation in stage of breast cancer at
diagnosis, other tumor characteristics, number of nodes exam-
ined or the treatment received.9,18
A study from England using stage-specific analysis found
that lower survival from breast cancer among women with mid-
level SEP, relative to the most advantaged, was entirely
explained by stage at diagnosis, while stage had no mediating
effect on lower survival among the most disadvantaged
patients.32 Another study using data from England and Austra-
lia observed no differences in survival across socio-economic
groups in New South Wales, Australia after stratifying on mode
of detection (screen-detected or non-screen-detected)49; how-
ever, in the West Midlands, England, there were inequalities in
survival between affluent and disadvantaged women with both
screen-detected and non-screen-detected breast cancer, which
were not explained by extent of disease at diagnosis.49 In con-
trast, another study from England reported that inequalities in
survival, irrespective of screening status (screen-detected or
non-screen-detected), were only partly explained by differ-
ences in stage at diagnosis and co-morbidities; differences in
other tumor characteristics and treatment did not contribute to
lower survival in disadvantaged women.44
US studies measuring SEP at the individual and community
level found that higher risk of death among the most disadvan-
taged women was mostly influenced by variation in annual
screening mammography participation and disease stage, and
less by lifestyle factors and first course treatment.59,60 Other
US studies reported that differences in stage at diagnosis, breast
cancer subtype (triple negative, HER2 or luminal), co-morbid
conditions and the treatment received did not explain lower
survival for residents of disadvantaged areas,61,65 while another
study reported health-related lifestyle behaviors and co-
morbidity, but not treatment, as contributing factors to the
observed gap in breast cancer survival.67
Of the 7 studies that investigated cancer-specific survival
after diagnosis with colon or rectal cancer, studies from Swe-
den, Australia and the US found that lower survival in disad-
vantaged or low educated patients was not explained by
variations in stage at diagnosis, patient factors or other tumor
characteristics, nor by differences in co-morbidities, hospital
type/characteristics, and treatment e.g. elective or emergency
surgery or preoperative radiotherapy for rectal cancer.15,66,73,74
In contrast, studies from England, Switzerland and New Zeal-
and concluded that rural-urban residence, extent of the disease
and provision of treatment within the first month of diagnosis
contributed to the observed lower survival in disadvantaged
patients and those with low-level education.28,40,76
Three studies assessed the association of socio-economic
disadvantage with survival from head and neck cancer. A study
from Canada found that the anatomic extent of the tumor
accounted for 3-23% of differences in survival from glottic
cancer71; the authors also reported waiting time to receive
treatment as an explanatory factor for lower survival among
disadvantaged patients.71 A US study of oral and pharyngeal
cancer reported cigarette smoking as a contributing factor to
socio-economic inequalities in survival; the authors reported
that the indirect effect of smoking was larger for patients in the
middle socio-economic group (21%) than for those in the low-
est category (13%).54 A Scottish study comparing HRs with
and without adjusting for potential mediators proposed that
socio-economic differences in survival from head and neck
cancers (deprived compared with affluent cases, unadjusted
HR 1.33; 95%CI 1.06-1.68) were explained by variations in
stage at diagnosis, tumor differentiation, alcohol drinking,
smoking status and patient performance status (fully adjusted
HR 0.93; 95%CI 0.64-1.35).31
Three studies investigated socio-economic differences in
survival from prostate cancer.34,43,64 A study from Scotland
stratifying the relative risk estimates by Gleason score found
that differential stage of prostate cancer contributed to some of
the observed deprivation-based gap in survival.34 A US study
concluded that differences in co-morbidities, health-related
behaviors, hospital characteristics and environmental factors
did not explain the observed lower survival for men with low
level of education, although the gap in survival by socio-
economic position (disadvantaged men compared with advan-
taged cases, base model HR 1.56; 95% CI 1.11-2.19) decreased
after adjusting for these variables (fully adjusted HR 1.41; 95%CI 0.98-2.03).64 A study from Denmark reported treatment and
metabolic indicators such as body mass index and diabetes as
contributing factors to lower survival among men with lowest
education, whereas co-morbidities did not explain the observed
gap in survival.43
Afshar et al 25

Two studies from Sweden19,35 and 1 from New Zealand76
assessed cancer-specific survival from melanoma by education
level or an area-based measure of SEP. A Swedish study, com-
paring models with and without adjusting for mediators of
interest, found that stage at diagnosis largely explained worse
survival among low educated relative to highly educated indi-
viduals (age and sex adjusted HR 1.58; 95%CI 1.40-1.77
decreased to HR 1.19; 95%CI 1.06-1.34 after adjusting for
clinical stage).19 Another study from Sweden reported consis-
tent findings.35 A New Zealand study showed that 50% of the
observed deprivation gap in survival from melanoma was
explained by extent of the disease.76
Of the remaining studies, a study of esophageal cancer from
France concluded that lower survival among patients living in
deprived areas was not explained by differences in stage, mor-
phology, surgery, radiotherapy or chemotherapy.27 A US study
conducted tumor characteristics-specific analysis and sug-
gested that lower survival from renal cancer among individuals
from lower socio-economic background may be partly
explained by advanced tumor at diagnosis, or tumor size or
grade.52 Another study of gastrointestinal cancers from the
US, applying causal mediation analysis, showed that differ-
ences in surgery explained one third of socio-economic
inequalities in survival for patients with esophageal adenocar-
cinoma, extrahepatic cholangiocarcinoma, and pancreatic
adenocarcinoma.68
An Australian study concluded that stage at diagnosis was
the underlying reason for lower survival from ovarian cancer in
women living in the most disadvantaged areas.74 Another study
from New Zealand found that the extent of disease fully
explained the observed lower survival from cervical cancer
among more deprived women, while it only contributed to
5% of the deprivation gap in survival from uterine cancer.76
A Swedish study of lung cancer showed that better survival
from early-stage disease in women with high educational level,
relative to low educated, persisted after adjusting for treatment
(HR 0.33; 95%CI 0.14-0.77), while for stage III, the observed
lower survival comparing high versus low educated men also
remained (fully adjusted HR 1.41; 95%CI 1.04-1.90).10
Another study from Sweden found that stage at diagnosis and
co-morbidities did not contribute to socio-economic inequal-
ities in survival from penile cancer.47 Lastly, an Australian
study of all malignancies found that stage at diagnosis did not
explain the observed lower survival among cancer patients
living in more disadvantaged areas.75
Overall survival. We identified 8 studies that assessed overall
survival following breast cancer diagnosis. A Dutch study
observed socio-economic differences in overall survival for
women with screen-detected, non-screen-detected and interval
breast cancers.8 Lower survival among more disadvantaged
women diagnosed via screening was partly explained by the
higher prevalence of co-morbidities. For women with non-
screen-detected and interval breast cancers, inequalities in sur-
vival appeared to be largely explained by differences in stage at
diagnosis, while treatment explained very little.8 A Canadian
and a British study found that socio-economic inequalities in
overall survival after breast cancer were partly mediated by
differential stage and surgical treatment.29,69 Similarly, studies
from England, the US and Canada concluded that the higher
risk of death for disadvantaged women was largely explained
by their generally more advanced stage and co-morbid condi-
tions.17,51 Another study from the US reported insurance status,
disease stage and treatment as major explanatory factors,
although co-morbidities explained very little of the observed
gap in survival.53 A study conducted in Denmark showed that
metabolic indicators, smoking status and alcohol intake
accounted for part of the higher risk of death among women
with lower educational attainment, while disease-related prog-
nostic factors and co-morbidities played only a minor role.26
The only study of male breast cancer, conducted in the US,
suggested that later stage due to poor access to diagnostic and
health care services may partly explain worse overall survival
among men from lower socio-economic neighborhoods.58
Seven studies investigated the association of SEP and edu-
cation with overall survival following diagnosis with colon or
rectal cancer. Two studies from England reported that varia-
tions in co-morbid conditions, urgency of surgery and curative
resection status explained part of lower overall survival among
the most deprived patients with colorectal cancer.12,48 A study
of colon cancer, conducted in Canada, found no evidence that
stage at diagnosis contributed to socio-economic differences in
overall survival,69 while a study from Norway found that edu-
cational inequality in overall survival from colon and rectal
cancer is explained partly by stage at diagnosis and although
less so, by smoking and alcohol drinking.14 One study from
Denmark noted that observed socio-economic differences in
overall survival from colorectal cancer were partly mediated
by co-morbidities and to a lesser extent by health-related beha-
viors, while stage at diagnosis, mode of admittance (admitted
for surgery electively or acutely), type of surgery and specia-
lization of surgeon did not contribute to these differences.22
Two US studies found that lower overall survival among dis-
advantaged individuals with colon and rectal cancer was
explained in part by disease stage, tumor grade and differential
access to treatment.55,57
Six studies examined socio-economic and educational
inequalities in overall survival from lung cancer. Of the 3 stud-
ies conducted in England, 1 found that the higher overall
survival in the most affluent group, especially those with
early-stage disease, was partly explained by variations in
co-morbidities and treatment.11 Two other studies also reported
that differences in receipt of treatment explained part of the
worse overall survival among patients residing in the most
deprived areas.20,25 A study from US found differential disease
stage, tumor grade and receipt of the treatment explained some
of the observed overall survival disadvantage among lung can-
cer patients from areas with higher concentration of deprivation
and lower levels of education.56 Similarly, a study from
Denmark noted that educational inequalities in overall survival
were partially explained by differences in stage of lung cancer
at diagnosis, delivery of first-line treatment, co-morbidity and
26 Cancer Control

performance status.16 In contrast, a German study found that
lower survival observed for residents of more disadvantaged
regions was not explained by differential stage at diagnosis or
tumor grade.41
Of the 3 studies that investigated prostate cancer, 2 were
conducted in Netherlands6,7 and 1 in the US.51 One study found
that co-morbid conditions, physical activity level and smoking
status did not contribute to lower overall survival in patients with
lower levels of education.6 Another study reported that socio-
economic-based inequalities in overall survival were partly
mediated by differences in treatment selection and by co-mor-
bidities.7 The US study found that disease stage explained at
least part of lower survival among prostate cancer patients either
living in poverty or having low educational level.51
With respect to head and neck and brain cancers, a study
from Canada found that lower overall survival among disad-
vantaged patients was explained by differences in cigarette
smoking, alcohol consumption, and stage at diagnosis.70 In
contrast, a second Canadian study of laryngeal cancer specifi-
cally, found that survival differences among socio-economic
groups were not explained by stage at diagnosis.71 Of the 2
studies that investigated socio-economic inequalities in overall
survival from glioma, a study from US concluded that varia-
tions in receiving chemotherapy and radiotherapy did not con-
tribute to the observed gap in survival.62 In contrast, a second
US study showed that lower survival in cases living in more
disadvantaged areas was partly explained by differences in the
receiving surgery and radiation therapy.63
We identified 8 studies that explored educational or socio-
economic inequalities in relation to overall survival from can-
cers of the cervix, ovary, corpus or endometrium. A US study
of cervical cancer showed that tumor characteristics and treat-
ment explained some of the inequalities in overall survival.50
A study from Japan reported similar findings.78 A study from
Denmark found that overall survival disadvantage in low
educated women with cervical cancer was partially explained
by stage at diagnosis and, to a lesser extent, by co-morbidities
and smoking status.24 Both studies, from Japan78 and
Denmark,33 investigating uterine and endometrial cancer
found that the lower survival among disadvantaged or less
educated women was partly mediated by disease stage and
histology, while co-morbid conditions and treatment had no
mediating effect. Of the 4 studies that assessed ovarian can-
cer, studies from France and the US found that the observed
gap in overall survival was partly explained by variations in
stage at diagnosis and the treatment received.42,45 A Danish
study reported differential stage at diagnosis, tumor histolo-
gical type, co-morbidities and health-related lifestyle beha-
viors as some of the explanatory factors.23 In contrast, a
study from Norway found that stage of ovarian cancer or
smoking status prior to diagnosis did not contribute to overall
survival gap between education groups.14
Of the remaining studies, studies from Denmark and Ireland
found that late stage at diagnosis and emergency presentation
contributed in part to educational inequalities in overall sur-
vival form non-Hodgkin’s lymphoma.21,38A French study of
acute myeloid leukemia showed that variations in initial treat-
ment did not explain the observed gap in overall survival by
socio-economic position.37 Of the 2 studies that assessed pan-
creatic cancer, a study from Denmark concluded that differ-
ences in surgical resection and chemotherapy explained very
little of the gap in overall survival across household incomes.39
Another study conducted in Japan found no evidence that stage
at diagnosis, smoking habits, surgery and chemotherapy con-
tribute to lower survival observed among unemployed patients
and those with lower levels of occupation.79 A Canadian study
reported variations in the provision of curative treatment and
co-morbidity prevalence as major contributing factors to lower
overall survival in disadvantaged patients with hepatocellular
carcinoma.72 Lastly, a study from Germany that assessed all
cancer types found that cases with blue-collar jobs, vocational
training and lower level of income have lower cancer survival
which was not explained by differences in health-related life-
style behaviors.46
Risk of Bias
Results from the assessment of the risk of bias of the eligible
studies are summarized in Supplementary Table 2. All included
studies had low risk of bias with respect to measurement and
classification of the exposure and the outcome.
Age at cancer diagnosis, sex (for non-sex-specific cancers),
ethnicity/race (for studies conducted in the US and New Zeal-
and), and year of diagnosis (where applicable i.e. the period of
diagnosis was �10 years) were considered to be important
confounding domains that should be adjusted for in the analy-
ses. Studies that applied a relative survival framework to esti-
mate EMRRs should have used socio-economic- or
deprivation-specific population life tables. With respect to con-
founding, several studies had moderate risk of bias; 7 studies
did not use socio-economic-specific population life
tables,9,12,15,18,27,30,49 A US study did not adjust for ethnicity/
race,66 5 did not control for sex,28,31,62,69,71 and 6 studies did
not adjust for year or period of diagnosis.26,43,47,71,72,78 Based
on existing literature,2,3,80 we considered health-related life-
style factors, screening participation, stage of cancer at diag-
nosis, other tumor characteristics, co-morbid conditions,
emergency presentation and treatment modalities as potential
mediators on the causal pathway that should not be adjusted for
in the analyses (Figure 2). Consequently, all studies that used
the difference method were classified as at high risk of bias. We
also assumed that patient’s rural-urban residence is a potential
mediator as socio-economic position generally determines
where a person lives, while acknowledging that it might be
also a confounder (i.e. area of residence affects SEP as well).
Bias in the selection of participants into the study was low
for all studies except 4 that identified cancer patients from a
hospital,31,37,46,70 which is problematic when estimating the
mediating effects of treatment. All studies, except 3, had a low
risk for the domain of bias due to selective reporting of
results.41,43,47 With respect to missing data, we assigned moder-
ate risk of bias to twenty-three studies that had 10-20% of their
Afshar et al 27

data missing,7,13,20,25-27,30,34,37,38,40,42,44,45,53,54,57,58,61,64,67,69,78
and high risk to eleven studies with more than 20% missing
data,33,39,41,43,46,48,65,66,72,75,79 regardless of whether multiple
imputation was applied.
Discussion
In this systematic review, studies relatively consistently
reported differences in disease stage, other tumor characteris-
tics such as size, grade or morphology, lifestyle behaviors
including smoking and excessive alcohol intake, co-morbid
conditions and the treatment received as contributing causes
of socio-economic inequalities in cancer-specific survival, but
the estimated mediating effects of these factors varied across
countries and cancer sites. Of the studies investigating survival
from breast cancer, the majority reported stage at diagnosis as a
contributing factor to lower survival among disadvantaged
women, while a few acknowledged the potential role of
co-morbidities and treatment. Most research on survival fol-
lowing colon or rectal cancer showed that stage of disease did
not explain inequalities in survival, whereas treatment and co-
morbidities partly contributed to the observed differences.
Research on survival from head and neck cancer found stage
at diagnosis, smoking and alcohol intake as the primary reasons
for these inequalities. Similarly, for melanoma and cancers of
the ovary, cervix, kidney and prostate, disease stage and treat-
ment were reported as contributing factors to the observed
survival gap across socio-economic groups. We found no obvi-
ous differences in explanatory factors by year of publication or
by country.
Findings of studies investigating underlying reasons for
socio-economic inequalities in overall survival following a
cancer diagnosis were generally in line with studies that
assessed cancer-specific survival, although the estimated
effects of potential mediators varied relative to studies consid-
ering death from a particular cancer as the outcome.
The most recent review published by IARC highlighted
several factors, which may contribute to observed inequalities
in cancer outcomes. There is compelling evidence from exist-
ing literature that individuals with lower levels of income and
education have limited awareness about adverse effects of
health-related behaviors; therefore, unhealthy diet, physical
inactivity, smoking, heavy alcohol intake and co-morbid con-
ditions are more prevalent among disadvantaged people.80
Stage at diagnosis is cited as the primary reason for inequalities
in cancer survival by socio-economic position, possibly due to
higher rates of screening participation and better access to
diagnostic services among advantaged people.80 Differential
access to treatment facilities and the quality of care received
have also been reported as potential contributing factors to
Figure 2. Directed acyclic graph (DAG) showing assumed causal associations between socio-economic position and cancer survival.
28 Cancer Control

lower cancer survival.80 We should consider the fact that the
mediating effect of these factors may be country-specific, gen-
erally due to variation in healthcare systems.
A review of access to cancer treatment trials across socio-
economic groups found that disadvantaged cancer patients
were underrepresented due to several barriers such as presence
of co-morbidities, travel distance to and from clinics and
financial concerns.81 Other research reported an increasing
gap between advantaged and disadvantaged patients regard-
ing access to novel targeted cancer treatments such as immu-
notherapy.82 Research on the effect of psychological factors
on socio-economic inequalities in cancer screening participa-
tion and attitudes toward cancer reported that people from
lower socio-economic background have more negative beliefs
about cancer screening, early detection and treatment such as
worrying and not willing to know if they have cancer, as they
believe cancer is a death sentence or cancer treatment is worse
than cancer itself.83,84
The contribution of the above factors and social or psycho-
logical stresses to socio-economic inequalities in cancer patient
survival is not clear due to methodological issues and data
limitations. Also, it is unclear whether the interaction between
the socio-demographic and clinical characteristics of cancer
patients and the health care system partly explain these inequal-
ities. In the absence of more in-depth knowledge, it is challen-
ging to identify and prioritize actionable factors to address
socio-economic inequalities in cancer survival and improve
outcomes for disadvantaged patients.
Limitations
The findings of this review should be interpreted with caution,
mainly due to between-study heterogeneity in measures of SEP
(measured at individual or neighborhood level) and the meth-
ods used to identify the underlying causes of socio-economic
inequalities in cancer survival. A limitation of using single
individual-level indicators of SEP in investigating socio-
economic inequalities in health outcomes is that each does not
address the multi-dimensionality of SEP; for instance, a person
can be classified as advantaged by one indicator (high level of
education), but not another (low level of income).85,86Another
issue is that in health inequalities research, it is common prac-
tice to adjust for socio-economic indicators other than the one
of interest, which ignores the complexity of the pathways that
connect SEP indicators to health.86 Using composite measures
of SEP defined by weighting and aggregating several socio-
economic dimensions to measure material and social depriva-
tion or social and economic standing, can potentially overcome
the issues mentioned above, but these measures might not be
suitable to answer particular policy questions.87 Using area-
based SEP measures may lead to misclassification and under-
estimation of contribution of individual-level SEP to health
outcomes, although the characteristics of an area, such as pub-
lic resources and infrastructure, can also independently affect
people’s health, thereby over-estimating the association of
individual-level SEP with the outcome of interest.88
The majority of the studies applied the difference method,
by which regression models were compared with and without
adjusting for potential mediators. This standard approach has
some major limitations. The first problem arises when there are
unmeasured mediator-outcome confounders. Adjusting for the
mediator in the presence of mediator-outcome confounding is
inappropriate as it creates a non-causal association between the
exposure and the mediator-outcome confounder, which can
induce substantial bias, known as collider bias.89 Another lim-
itation is the assumption of no interaction between the effects
of the exposure and the mediator on the outcome, which may
result in invalid inferences.89,90 Moreover, this approach fails
when multiple mediators are of interest and the mediators
affect or interact with each other (for example, interactions
between stage and treatment or co-morbidity and treatment);
in this case, adding mediators one-by-one to the model could
give biased estimates.89,90
About half of the included studies assessed overall survival,
which is problematic when exploring the reasons for socio-
economic inequalities in cancer survival as there is solid evi-
dence that socio-economic position is associated with death
due to causes other than cancer.91 In addition, for screen-
detectable cancers such as breast, colorectal and prostate can-
cer, the effect of overdiagnosis, lead-time and length-time bias
should not be neglected as screen-detected cancers show higher
survival, even in the presence of co-morbidities and ineffective
treatment.
Conclusion
Socio-economic inequalities in cancer survival appear to be
partly explained by differences in disease stage, health-
related behaviors, chronic conditions and treatment modalities.
Discrepancies in findings across studies could be due to varia-
tion in the covariates included in the analyses. It is essential
that future studies apply novel methods of mediation analysis
to population-based linked health data to generate more reli-
able evidence about the medical and psychological mechan-
isms underlying these inequalities, which may lead to better
resource allocation and change in cancer control policies to
improve cancer survival for all patients.
Declaration of Conflicting Interests
The author(s) declared no potential conflicts of interest with respect to
the research, authorship, and/or publication of this article.
Funding
The author(s) disclosed receipt of the following financial support for
the research, authorship, and/or publication of this article: N.A. was
the recipient of an Australian Government Research Training Program
Scholarship.
ORCID iD
Nina Afshar, PhD https://orcid.org/0000-0001-5587-9540
Roger L. Milne, PhD https://orcid.org/0000-0001-5764-7268
Afshar et al 29

Supplemental Material
Supplemental material for this article is available online.
References
1. Quaglia A, Lillini R, Mamo C, Ivaldi E, Vercelli M. Socio-
economic inequalities: a review of methodological issues and the
relationships with cancer survival. Crit Rev Oncol Hematol. 2013;
85(3):266-277.
2. Kogevinas M, Porta M. Socioeconomic differences in cancer sur-
vival: a review of the evidence. IARC Sci Publ. 1997;138(138):
177-206.
3. Woods L, Rachet B, Coleman M. Origins of socio-economic
inequalities in cancer survival: a review. Ann Oncol. 2005;
17(1):5-19.
4. Auvinen A, Karjalainen S. Possible explanations for social class
differences in cancer patient survival. IARC Sci Publ. 1997;(138):
377-397.
5. Moher D, Shamseer L, Clarke M, et al. Preferred reporting items
for systematic review and meta-analysis protocols (PRISMA-P)
2015 statement. System Rev. 2015;4(1):1.
6. Aarts MJ, Kamphuis CBM, Louwman MJ, Coebergh JWW,
Mackenbach JP, van Lenthe FJ. Educational inequalities in cancer
survival: a role for comorbidities and health behaviours?
J Epidemiol Community Health. 2013;67(4):365-373 369p.
7. Aarts MJ, Koldewijn EL, Poortmans PM, Coebergh JWW, Louw-
man M. The impact of socioeconomic status on prostate cancer
treatment and survival in the Southern Netherlands. Urology.
2013;81(3):593-600.
8. Aarts MJ, Voogd AC, Duijm LEM, Coebergh JWW, Louwman
WJ. Socioeconomic inequalities in attending the mass screening
for breast cancer in the south of the Netherlands-associations with
stage at diagnosis and survival. Breast Cancer Res Treat. 2011;
128(2):517-525.
9. Bastiaannet E, De Craen AJM, Kuppen PJK, et al. Socioeconomic
differences in survival among breast cancer patients in the Nether-
lands not explained by tumor size. Breast Cancer Res Treat. 2011;
127(3):721-727.
10. Berglund A, Holmberg L, Tishelman C, Wagenius G, Eaker S,
Lambe M. Social inequalities in non-small cell lung cancer man-
agement and survival: a population-based study in central
Sweden. Thorax. 2010;65(4):327-333.
11. Berglund A, Lambe M, Luchtenborg M, et al. Social differences
in lung cancer management and survival in South East England:
a cohort study. BMJ Open. 2012;2 (3): e001048.
12. Bharathan B, Welfare M, Borowski DW, et al. Impact of depriva-
tion on short- and long-term outcomes after colorectal cancer
surgery. Br J Surg. 2011;98(6):854-865.
13. Bouchardy C, Verkooijen HM, Fioretta G. Social class is an
important and independent prognostic factor of breast cancer
mortality. Int J Cancer. 2006;119(5):1145-1151.
14. Braaten T, Weiderpass E, Lund E. Socioeconomic differences in
cancer survival: the Norwegian women and cancer study. BMC
Public Health. 2009;9(178):178.
15. Cavalli-Bjorkman N, Lambe M, Eaker S, Sandin F, Glimelius B.
Differences according to educational level in the management and
survival of colorectal cancer in Sweden. Eur J Cancer. 2011;
47(9):1398-1406 1399p.
16. Dalton SO, Steding-Jessen M, Jakobsen E, et al. Socioeco-
nomic position and survival after lung cancer: influence of
stage, treatment and comorbidity among Danish patients with
lung cancer diagnosed in 2004-2010. Acta Oncol. 2015;54(5):
797-804 798p.
17. Downing A, Prakash K, Gilthorpe MS, Mikeljevic JS, Forman D.
Socioeconomic background in relation to stage at diagnosis, treat-
ment and survival in women with breast cancer. Br J Cancer.
2007;96(5):836-840.
18. Eaker S, Halmin M, Bellocco R, et al. Social differences in breast
cancer survival in relation to patient management within a
National Health Care System (Sweden). Int J Cancer. 2009;
124(1):180-187.
19. Eriksson H, Lyth J, Mansson-Brahme E, et al. Low level of edu-
cation is associated with later stage at diagnosis and reduced
survival in cutaneous malignant melanoma: a nationwide
population-based study in Sweden. European J Cancer. 2013;
49(12):2705-2716.
20. Forrest LF, Adams J, Rubin G, White M. The role of receipt and
timeliness of treatment in socioeconomic inequalities in lung can-
cer survival: population-based, data-linkage study. Thorax. 2015;
70(2):138-145.
21. Frederiksen BL, Dalton SO, Osler M, Steding-Jessen M, De Nully
Brown P. Socioeconomic position, treatment, and survival of non-
Hodgkin lymphoma in Denmark—a nationwide study. Br J Can-
cer. 2012;106(5):988-995.
22. Frederiksen BL, Osler M, Harling H, Ladelund S, Jørgensen T.
Do patient characteristics, disease, or treatment explain social
inequality in survival from colorectal cancer? Soc Sci Med.
2009;69(7):1107-1115 1109p.
23. Ibfelt EH, Dalton SO, Hogdall C, et al. Do stage of disease,
comorbidity or access to treatment explain socioeconomic differ-
ences in survival after ovarian cancer?—A cohort study among
Danish women diagnosed 2005-2010. Cancer Epidemiol. 2015;
39(3):353-359.
24. Ibfelt EH, Kjaer SK, Hogdall C, et al. Socioeconomic position and
survival after cervical cancer: influence of cancer stage, comor-
bidity and smoking among Danish women diagnosed between
2005 and 2010. Br J Cancer. 2013;109(9):2489-2495.
25. Jack RH, Gulliford MC, Ferguson J, Moller H. Explaining
inequalities in access to treatment in lung cancer. J Eval Clin
Pract. 2006;12(5):573-582.
26. Larsen SB, Kroman N, Ibfelt EH, Christensen J, Tjønneland A,
Dalton SO. Influence of metabolic indicators, smoking, alcohol
and socioeconomic position on mortality after breast cancer. Acta
Oncol. 2015;54(5):780-788 789p.
27. Launay L, Dejardin O, Pornet C, et al. Influence of socioeconomic
environment on survival in patients diagnosed with esophageal
cancer: a population-based study. Dis Esophagus. 2012;25(8):
723-730.
28. Lejeune C, Sassi F, Ellis L, et al. Socio-economic disparities in
access to treatment and their impact on colorectal cancer survival.
Int J Epidemiol. 2010;39(3):710-717.
30 Cancer Control

29. Li R, Daniel R, Rachet B. How much do tumor stage and treat-
ment explain socioeconomic inequalities in breast cancer sur-
vival? Applying causal mediation analysis to population-based
data. Eur J Epidemiol. 2016;31(6):603-611.
30. Quaglia A, Lillini R, Casella C, et al. The combined effect of age
and socio-economic status on breast cancer survival. Crit Rev
Oncol-Hematol. 2011;77(3):210-220.
31. Robertson G, Greenlaw N, Bray CA, Morrison DS. Explaining the
effects of socio-economic deprivation on survival in a national
prospective cohort study of 1909 patients with head and neck
cancers. Cancer Epidemiol. 2010;34(6):682-688.
32. Rutherford MJ, Hinchliffe SR, Abel GA, Lyratzopoulos G, Lam-
bert PC, Greenberg DC. How much of the deprivation gap in
cancer survival can be explained by variation in stage at diagno-
sis: an example from breast cancer in the East of England. Int J
Cancer. 2013;133(9):2192-2200.
33. Seidelin UH, Ibfelt E, Andersen I, et al. Does stage of cancer,
comorbidity or lifestyle factors explain educational differences
in survival after endometrial cancer? A cohort study among
Danish women diagnosed 2005-2009. Acta Oncol. 2016;55(6):
680-685.
34. Shafique K, Morrison DS. Socio-economic inequalities in sur-
vival of patients with prostate cancer: role of age and Gleason
grade at diagnosis. PLoS One. 2013;8(2):e56184.
35. Stromberg U, Peterson S, Holmberg E, et al. Cutaneous malignant
melanoma show geographic and socioeconomic disparities in
stage at diagnosis and excess mortality. Acta Oncol. 2016;55(8):
993-1000.
36. Walsh PM, Byrne J, Kelly M, McDevitt J, Comber H. Socioeco-
nomic disparity in survival after breast cancer in Ireland: observa-
tional study. PLoS One. 2014;9(11):e111729.
37. Berger E, Delpierre C, Despas F, et al. Are social inequalities
in acute myeloid leukemia survival explained by differences in
treatment utilization? Results from a French longitudinal
observational study among older patients. BMC Cancer.
2019;19(1):1-12.
38. Comber H, De Camargo Cancela M, Haase T, Johnson H, Sharp
L, Pratschke J. Affluence and private health insurance influence
treatment and survival in non-Hodgkin’s lymphoma. PLoS One.
2016;11(12):e0168684.
39. Engberg H, Steding-Jessen M, Oster I, Jensen JW, Fristrup CW,
Moller H. Regional and socio-economic variation in survival after
a pancreatic cancer diagnosis in Denmark. Dan Med J. 2020;
67(2):A08190438.
40. Feller A, Schmidlin K, Bordoni A, et al. Socioeconomic and
demographic inequalities in stage at diagnosis and survival
among colorectal cancer patients: evidence from a Swiss
population-based study. Cancer Med. 2018;7(4):1498-1510.
41. Finke I, Behrens G, Schwettmann L, et al. Socioeconomic differ-
ences and lung cancer survival in Germany: investigation based
on population-based clinical cancer registration. Lung Cancer.
2020;142:1-8.
42. Gardy J, Dejardin O, Thobie A, Eid Y, Guizard A-V, Launoy G.
Impact of socioeconomic status on survival in patients with ovar-
ian cancer. Int J Gynecol Cancer.2019;29(4):792-801.
43. Larsen SB, Brasso K, Christensen J, et al. Socioeconomic position
and mortality among patients with prostate cancer: influence of
mediating factors. Acta Oncol.2017;56(4):563-568.
44. Morris M, Woods LM, Rachet B. What might explain
deprivation-specific differences in the excess hazard of breast
cancer death amongst screen-detected women? Analysis of
patients diagnosed in the West Midlands region of England from
1989 to 2011. Oncotarget. 2016;7(31):49939-49947.
45. Phillips A, Kehoe S, Singh K, et al. Socioeconomic differences
impact overall survival in advanced ovarian cancer (AOC) prior
to achievement of standard therapy. Arch Gynecol Obstetr. 2019;
300(5):1261-1270.
46. Singer S, Bartels M, Briest S, et al. Socio-economic disparities in
long-term cancer survival-10 year follow-up with individual
patient data. Support Care Cancer.2017;25(5):1391-1399.
47. Torbrand C, Wigertz A, Drevin L, et al. Socioeconomic factors
and penile cancer risk and mortality; a population-based study.
BJU Int. 2017;119(2):254-260.
48. Vallance AE, van der Meulen J, Kuryba A, et al. Socioeconomic
differences in selection for liver resection in metastatic colorectal
cancer and the impact on survival. Eur J Surg Oncol. 2018;
44(10):1588-1594.
49. Woods LM, Rachet B, O’Connell D, Lawrence G, Coleman MP.
Impact of deprivation on breast cancer survival among women
eligible for mammographic screening in the West Midlands (UK)
and New South Wales (Australia): women diagnosed 1997-2006.
Int J Cancer. 2016;138(10):2396-2403.
50. Brookfield KF, Cheung MC, Lucci J, Fleming LE, Koniaris LG.
Disparities in survival among women with invasive cervical can-
cer: a problem of access to care. Cancer. 2009;115(1):166-178.
51. Byers TE, Wolf HJ, Bauer KR, et al. The impact of socioeco-
nomic status on survival after cancer in the United States: findings
from the national program of cancer registries patterns of care
study. Cancer. 2008;113(3):582-591.
52. Danzig MR, Weinberg AC, Ghandour RA, Kotamarti S, McKier-
nan JM, Badani KK. The association between socioeconomic
status, renal cancer presentation, and survival in the United States:
a survival, epidemiology, and end results analysis. Urology. 2014;
84(3):583-589.
53. Feinglass J, Rydzewski N, Yang A. The socioeconomic gradient
in all-cause mortality for women with breast cancer: findings
from the 1998 to 2006 National Cancer Data Base with follow-
up through 2011. Ann Epidemiol. 2015;25(8):549-555.
54. Guo Y, Logan HL, Marks JG, Shenkman EA. The relationships
among individual and regional smoking, socioeconomic status,
and oral and pharyngeal cancer survival: a mediation analysis.
Cancer Med. 2015;4(10):1612-1619.
55. Hines R, Markossian T, Johnson A, Dong F, Bayakly R. Geo-
graphic residency status and census tract socioeconomic status as
determinants of colorectal cancer outcomes. Am J Publ Health.
2014;104(3): e63-71.
56. Johnson AM, Hines RB, Johnson JA, Bayakly AR. Treatment
and survival disparities in lung cancer: the effect of social
environment and place of residence. Lung Cancer. 2014;
83(3):401-407.
Afshar et al 31

57. Kim J, Artinyan A, Mailey B, et al. An interaction of race and
ethnicity with socioeconomic status in rectal cancer outcomes.
Ann Surg. 2011;253(4):647-654.
58. O’Brien B, Koru-Sengul T, Miao F, et al. Disparities in overall
survival for male breast cancer patients in the state of Florida
(1996-2007). Clin Breast Cancer. 2015;15(4): e177-187.
59. Sprague BL, Trentham-Dietz A, Gangnon RE, et al. Socioeco-
nomic status and survival after an invasive breast cancer diagno-
sis. Cancer. 2011;117(7):1542-1551.
60. Yu XQ. Socioeconomic disparities in breast cancer survival: rela-
tion to stage at diagnosis, treatment and race. BMC Cancer. 2009;
9(1):1-7.
61. Abdel-Rahman O. Impact of NCI socioeconomic index on the
outcomes of nonmetastatic breast cancer patients: analysis of
SEER census tract-level socioeconomic database. Clin Breast
Cancer. 2019;19(6): e717-e722.
62. Cote DJ, Ostrom QT, Gittleman H, et al. Glioma incidence and
survival variations by county-level socioeconomic measures.
Cancer. 2019;125(19):3390-3400.
63. Deb S, Pendharkar AV, Schoen MK, Altekruse S, Ratliff J, Desai
A. The effect of socioeconomic status on gross total resection,
radiation therapy and overall survival in patients with gliomas.
J Neuro-Oncol. 2017;132(3):447-453.
64. DeRouen MC, Schupp CW, Koo J, et al. Impact of individual and
neighborhood factors on disparities in prostate cancer survival.
Cancer Epidemiol. 2018;53:1-11.
65. Keegan TH, Kurian AW, Gali K, et al. Racial/ethnic and socio-
economic differences in short-term breast cancer survival among
women in an integrated health system. Am J Publ Health. 2015;
105(5):938-946.
66. Oh DL, Santiago-Rodriguez EJ, Canchola AJ, Ellis L, Tao L,
Gomez SL. Changes in colorectal cancer 5-year survival dispa-
rities in California, 1997-2014. Cancer Epidemiol Biomark Pre-
vent. 2020;29(6):1154-1161.
67. Shariff-Marco S, Yang J, John EM, et al. Intersection of race/
ethnicity and socioeconomic status in mortality after breast can-
cer. J Commun Health. 2015; 40(6):1287-1299.
68. Swords DS, Mulvihill SJ, Brooke BS, Firpo MA, Scaife CL. Size
and importance of socioeconomic status-based disparities in use
of surgery in nonadvanced stage gastrointestinal cancers. Ann
Surg Oncol.2020;27(2):333-341.
69. Booth CM, Li G, Zhang-Salomons J, Mackillop WJ. The impact
of socioeconomic status on stage of cancer at diagnosis and sur-
vival: a population-based study in Ontario, Canada. Cancer. 2010;
116(17):4160-4167.
70. Chu KP, Habbous S, Kuang Q, et al. Socioeconomic status,
human papillomavirus, and overall survival in head and neck
squamous cell carcinomas in Toronto, Canada. Cancer Epide-
miol. 2016;40:102-112.
71. Groome PA, Schulze KM, Keller S, et al. Explaining socioeco-
nomic status effects in laryngeal cancer. Clin Oncol. 2006;18(4):
283-292.
72. Jembere N, Campitelli MA, Sherman M, et al. Influence of socio-
economic status on survival of hepatocellular carcinoma in the
Ontario population; a population-based study, 1990-2009. PLoS
One. 2012;7(7): e40917.
73. Beckmann KR, Bennett A, Young GP, et al. Sociodemographic
disparities in survival from colorectal cancer in South Australia: a
population-wide data linkage study. BMC Health Serv Res. 2015;
16(1):1-4.
74. Yu XQ, O’Connell DL, Gibberd RW, Armstrong BK. Assessing
the impact of socio-economic status on cancer survival in New
South Wales, Australia 1996-2001. Cancer Causes Control. 2008;
19(10):1383-1390.
75. Tervonen HE, Aranda S, Roder D, et al. Cancer survival dispa-
rities worsening by socio-economic disadvantage over the last 3
decades in new South Wales, Australia. BMC Publ Health.2017;
17(1):1-11.
76. Jeffreys M, Sarfati D, Stevanovic V, et al. Socioeconomic
inequalities in cancer survival in New Zealand: the role of extent
of disease at diagnosis. Cancer Epidemiol Biomark Prevent.
2009;18(3):915-921.
77. McKenzie F, Ellison-Loschmann L, Jeffreys M. Investigating
reasons for socioeconomic inequalities in breast cancer sur-
vival in New Zealand. Cancer Epidemiol. 2010;34(6):
702-708.
78. Ueda K, Kawachi I, Tsukuma H. Cervical and corpus cancer
survival disparities by socioeconomic status in a metropolitan
area of Japan. Cancer Sci. 2006;97(4):283-291.
79. Zaitsu M, Kim Y, Lee H-E, Takeuchi T, Kobayashi Y, Kawachi I.
Occupational class differences in pancreatic cancer survival: a
population-based cancer registry-based study in Japan. Cancer
Med.2019;8(6):3261-3268.
80. Vaccarella S, Lortet-Tieulent J, Saracci R, Conway DI, Straif
K, Wild CP, editors. Reducing social inequalities in cancer:
evidence and priorities for research. Lyon (FR): International
Agency for Research on Cancer; 2019. PMID: 33443989.
81. Sharrocks K, Spicer J, Camidge D, Papa S. The impact of socio-
economic status on access to cancer clinical trials. Br J Cancer.
2014;111(9):1684-1687.
82. Mano M. The burden of scientific progress: growing inequal-
ities in the delivery of cancer care. Acta Oncol. 2006;45(1):
84-86.
83. Quaife SL, Winstanley K, Robb KA, et al. Socioeconomic
inequalities in attitudes towards cancer: an international cancer
benchmarking partnership study. Eur J Cancer Prevent. 2015;
24(3):253.
84. Von Wagner C, Good A, Whitaker K, Wardle J. Psychosocial
determinants of socioeconomic inequalities in cancer screening
participation: a conceptual framework. Epidemiol Rev. 2011;
33(1):135-147.
85. Braveman PA, Cubbin C, Egerter S, et al. Socioeconomic status in
health research: one size does not fit all. JAMA. 2005;294(22):
2879-2888.
86. Green MJ, Popham F. Interpreting mutual adjustment for mul-
tiple indicators of socioeconomic position without committing
mutual adjustment fallacies. BMC Publ Health. 2019;19(1):
1-7.
87. Shavers VL, Shavers VL. Measurement of socioeconomic status
in health disparities research. J National Med Assoc. 2007;99(9):
1013-1023.
32 Cancer Control

88. Demissie K, Hanley JA, Menzies D, Joseph L, Ernst P.
Agreement in measuring socio-economic status: area-based
versus individual measures. Chronic Dis Can. 2000;21(1):
1-7.
89. VanderWeele T, Vansteelandt S. Mediation analysis with multi-
ple mediators. Epidemiol Methods. 2014;2(1):95-115.
90. Richiardi L, Bellocco R, Zugna D. Mediation analysis in epide-
miology: methods, interpretation and bias. Int J Epidemiol. 2013;
42(5):1511-1519.
91. Mackenbach JP, Stirbu I, Roskam A-JR, et al. Socioeconomic
inequalities in health in 22 European countries. N Engl J Med.
2008;358(23):2468-2481.
Afshar et al 33

Minerva Access is the Institutional Repository of The University of Melbourne
Author/s:
Afshar, N; English, DR; Milne, RL
Title:
Factors Explaining Socio-Economic Inequalities in Cancer Survival: A Systematic Review.
Date:
2021-01
Citation:
Afshar, N., English, D. R. & Milne, R. L. (2021). Factors Explaining Socio-Economic
Inequalities in Cancer Survival: A Systematic Review.. Cancer Control, 28,
pp.10732748211011956-. https://doi.org/10.1177/10732748211011956.
Persistent Link:
http://hdl.handle.net/11343/280557
File Description:
Published version
License:
CC BY-NC