socio-economic inequalities in access to planned hospital
TRANSCRIPT

Socio-economic inequalities in
access to planned hospital care:
causes and consequences
Prepared for the Midlands Decision Support Network
13th May 2021 (v2)
Prepared by:
Steven Wyatt
Head of Analytics
Jake Parsons
Analytics Manager

The Strategy Unit | Socio-economic inequalities in access to planned hospital care:
causes and consequences i
https://csucloudservices-my.sharepoint.com/personal/rachel_caswell_mlcsu_nhs_uk/Documents/Documents/DSU/DSU project -/socio-
economic inequalities in access to planned hospital care - 210513 with adjusted hyperlinks.docx
Document Title Midlands Decision Support Network
Job No 753
Prepared by Steven Wyatt & Jake Parsons
Checked by Fraser Battye & Simon Bourne
Date 13th May 2021
Document control

The Strategy Unit | Socio-economic inequalities in access to planned hospital care:
causes and consequences ii
https://csucloudservices-my.sharepoint.com/personal/rachel_caswell_mlcsu_nhs_uk/Documents/Documents/DSU/DSU project -/socio-
economic inequalities in access to planned hospital care - 210513 with adjusted hyperlinks.docx
‘Reducing health inequality’ must be one of this country’s most stable policy aims. With peaks and
dips in emphasis, it has been featured consistently in policy statements since at least the late 1990s.
Yet outcomes have got worse. Gaps between rich and poor have widened. Defying a trend that
began in late Victorian times, gains in life expectancy have stalled for poorer groups - and have
even fallen for women from the poorest backgrounds. Most recently, the pandemic has exposed
the radically different experiences and outcomes of different ethnic groups in the UK.
Faced with this situation, it may be tempting for those of us in the NHS to see inequality as
someone else’s problem. The determinants of inequality are broad and social; healthcare has only a
contributory role - so the ‘real solutions’ lie outside the NHS. This has a ring of truth. Getting a grip
on inequality does require cross-societal, cross-governmental action. Yet it would only ring true if
the NHS was already doing all it could.
This analysis shows that it isn’t.
The headline results are jarring. They show a consistent and growing inequality in the use of
elective care. Notwithstanding some subtlety, the general pattern is of wealthier groups receiving
more elective care than poorer groups. This pattern has emerged over recent years: it was not the
case in 2005. And it is seen most clearly late in the ‘pathway’; this is a problem of choices made
once people are receiving care.
Are there reasons to hope this might change?
One such reason might be to see the pandemic as a ‘teachable moment’. Inequality has been such
a central part of the story; maybe the resulting attention and comment will be converted to actions
and outcomes?
Another, more technical, reason is that NHS Planning Guidance demands the opposite situation to
that revealed by this analysis. It demands that people experiencing the worst outcomes are
prioritised for treatment. (It also demands that such prioritisation is done using robust analysis).
But there are even simpler reasons for hope. This analysis has highlighted a problem that is directly
within the NHS’s ability to control. Many of the solutions, which will be the subject of a further
project, will also therefore be within NHS control. So this report identifies a problem that local
services can do something about. Moving from analysis to action is then a question of will and
practicality.
Fraser Battye
The Strategy Unit
Foreword

The Strategy Unit | Socio-economic inequalities in access to planned hospital care:
causes and consequences iii
https://csucloudservices-my.sharepoint.com/personal/rachel_caswell_mlcsu_nhs_uk/Documents/Documents/DSU/DSU project -/socio-
economic inequalities in access to planned hospital care - 210513 with adjusted hyperlinks.docx
Foreword........................................................................................................................................ ii
Executive Summary ....................................................................................................................... 1
1. Introduction .................................................................................................................. 3
1.1 Planned hospital care .................................................................................................................................... 3
1.2 Inequalities and inequities ........................................................................................................................... 4
1.3 Dimensions of inequality .............................................................................................................................. 4
1.4 Measuring inequalities .................................................................................................................................. 5
1.5 Previous research ............................................................................................................................................ 5
1.6 Recent policy context .................................................................................................................................... 6
1.7 Report structure ............................................................................................................................................... 7
1.8 Supplementary materials.............................................................................................................................. 8
2. Describing socio-economic inequalities in access to planned hospital care .............. 9
Key findings ..................................................................................................................................................................... 9
2.1 Activity levels and trends............................................................................................................................ 10
2.2 Activity rates by age and sex .................................................................................................................... 11
2.3 Activity rates by condition ......................................................................................................................... 12
2.4 Differences in rates of planned hospital care by deprivation....................................................... 13
2.5 Changes in rates of planned hospital care by deprivation ............................................................ 14
2.6 Differences in rates of elective spells by deprivation and condition ......................................... 15
2.7 Differences in rates of elective spells by deprivation and STP ..................................................... 16
3. Where in the pathway do inequities in planned hospital care emerge? .................. 17
Key findings ................................................................................................................................................................... 17
3.1 Moving from inequalities to inequities ................................................................................................. 17
3.2 Pathways of care ............................................................................................................................................ 18
3.3 Chronic obstructive pulmonary disease ............................................................................................... 19
3.4 Heart failure ..................................................................................................................................................... 23
3.5 Arthritis of the hip ......................................................................................................................................... 24
3.6 Cataracts ........................................................................................................................................................... 25
3.7 Four pathways ................................................................................................................................................ 26
Contents

The Strategy Unit | Socio-economic inequalities in access to planned hospital care:
causes and consequences iv
https://csucloudservices-my.sharepoint.com/personal/rachel_caswell_mlcsu_nhs_uk/Documents/Documents/DSU/DSU project -/socio-
economic inequalities in access to planned hospital care - 210513 with adjusted hyperlinks.docx
4. Possible drivers of inequalities in access to planned hospital care .......................... 27
Key findings ................................................................................................................................................................... 27
4.1 Differential impacts of health policies to improve or control access to planned hospital
care .............................................................................................................................................................................. 27
4.2 Waiting times targets .................................................................................................................................. 29
4.3 NHS-funded access to private hospital provision ............................................................................ 30
4.4 Access to new diagnostic technologies ................................................................................................ 31
4.5 Access to procedures arising from new screening programmes ................................................ 32
4.6 Access to procedures with extensive eligibility criteria .................................................................. 33
5. Does poor access to planned hospital care increase demand for unplanned care? . 35
Key findings ................................................................................................................................................................... 35
5.1 Rates of elective and emergency spells by deprivation ................................................................. 36
5.2 Change in rates of elective and emergency spells by deprivation ............................................. 37
5.3 Rates of elective and emergency spells by deprivation and ICD10 chapter........................... 38
5.4 Rates of emergency spells before and after an elective spell ...................................................... 39
5.5 Rates of emergency spells before and after an elective spell by deprivation ........................ 40
5.6 Modelling the impact of elective activity on emergency activity ............................................... 41
5.7 Equalising access to elective care ........................................................................................................... 43
6. Conclusions ................................................................................................................. 45
Appendix A: Adjusting for need ................................................................................................. 46
Appendix B: Pathway metrics ..................................................................................................... 48
Appendix C: Additional pathway charts ..................................................................................... 52
Heart failure ................................................................................................................................................................... 52
Hip arthritis .................................................................................................................................................................... 54
Cataracts ......................................................................................................................................................................... 55
Appendix D: Methods used to explore the relationship between elective and emergency
spells ............................................................................................................................................ 56
Appendix E: Data sources and analytical methods .................................................................... 58

The Strategy Unit | Socio-economic inequalities in access to planned hospital care:
causes and consequences 1
https://csucloudservices-my.sharepoint.com/personal/rachel_caswell_mlcsu_nhs_uk/Documents/Documents/DSU/DSU project -/socio-
economic inequalities in access to planned hospital care - 210513 with adjusted hyperlinks.docx
Tackling inequalities in health is a long-standing NHS policy objective. Variation in the experiences
and outcomes of different communities during the COVID-19 pandemic served to bring this issue
back into focus. In the Summer and Autumn of 2020, as the first wave of the pandemic subsided,
concern grew about reduced access to routine hospital care: diagnostics, outpatient care and
planned surgery. Waiting lists and waiting times began to grow. The network of Decision Support
Units in the Midlands recognised the potential for this issue to exacerbate existing inequalities.
They jointly commissioned this analysis to explore the extent, causes and consequences of socio-
economic inequalities in access to planned hospital care. The recent NHS Planning Guidance
emphasises the importance of identifying and tackling these inequalities.
The report has four objectives:
1. To describe socio-economic inequalities in access to planned hospital care
2. To identify where in the patient pathways these, inequalities in planned care emerge
3. To explore potential drivers of these inequalities
4. To explore whether poor access to planned care in some communities leads to increased
demand for unplanned care.
The key findings are set out below.
The report builds on earlier research, advancing our understanding in some key areas. Although
further analysis may certainly add benefit, this report is sufficient to support some immediate and
targeted actions. We look forward to working with the network of Decision Support Units in the
Midlands to improve the outcomes for people living in the most deprived parts of the region.
Describing socio-economic inequalities in access to planned hospital care
Rates of access to planned care have increased substantially in recent years.
Rates of access are higher among those living in the least deprived areas. This was not always the
case.
This pattern holds for most major causes of morbidity and in most STPs.
Where in the pathway do inequities in planned hospital care emerge?
We explored four pathways: chronic obstructive pulmonary disease, heart failure, arthritis of the hip
and cataracts.
Executive Summary

The Strategy Unit | Socio-economic inequalities in access to planned hospital care:
causes and consequences 2
https://csucloudservices-my.sharepoint.com/personal/rachel_caswell_mlcsu_nhs_uk/Documents/Documents/DSU/DSU project -/socio-
economic inequalities in access to planned hospital care - 210513 with adjusted hyperlinks.docx
Having adjusted for levels of need, activity in the early parts of each the four pathways was skewed
towards the most deprived.
This pattern was reversed towards the very end of the pathway, when secondary care treatment
occurs.
Possible drivers of inequalities in access to planned hospital care
The late pathway skew towards the least deprived populations that has occurred in recent years,
may be a function of various policy initiatives introduced to improve or control access to secondary
care treatments.
Access to NHS-funded private sector treatment is substantially higher in the least deprived
populations.
As waiting times improved between 2000 and 2014, the benefits were felt disproportionately by
those living in the least deprived areas.
Growth in the rates of access to new imaging technologies tends to be slower in the most deprived
areas.
When the NHS seeks to limit access to certain forms of surgery, rates tend to fall more rapidly in
the most deprived areas.
When the NHS introduces new screening programmes, interventions resulting from those
programmes tend to increase more slowly in the most deprived areas.
Does poor access to planned hospital care increase demand for unplanned care?
There is good evidence of a relationship between levels of planned and emergency spells.
For every 10 additional elective spells, we estimate that one emergency spell will be avoided.
The effect accumulates over two years.
Increasing access to elective care for those in the most deprived areas is likely to lead to reductions
in emergency care overall and to inequalities in levels of emergency care.
The Strategy Unit | Socio-economic inequalities in access to planned hospital care:
causes and consequences 3
https://csucloudservices-my.sharepoint.com/personal/rachel_caswell_mlcsu_nhs_uk/Documents/Documents/DSU/DSU project -/socio-
economic inequalities in access to planned hospital care - 210513 with adjusted hyperlinks.docx
This report explores socio-economic inequalities in access to planned hospital care. It has four
primary objectives:
1. To describe socio-economic inequalities in access to planned hospital care.
2. To identify where in the patient pathways these inequalities in access emerge,
3. To explore potential drivers of these inequalities
4. To explore whether poor access to planned care in some communities leads to increased
demand for unplanned care.
Reducing inequalities in health outcomes and in access to healthcare is a long-standing national
policy objective, but the profile of this policy is particularly high at present. Indeed, the recent NHS
Planning Guidance requires STPs to make progress on this issue as a condition for accessing the
Elective Recovery Fund.
The analysis has been conducted by the Strategy Unit on behalf of the Midlands STPs network of
Decision Support Units.
1.1 Planned hospital care
In contrast to urgent and emergency care, planned hospital care is arranged in advance and often
follows a referral from a GP. This type of care can involve a consultation with a hospital specialist, a
diagnostic test, surgery, or the administration of a specialist form of medication. Care can be
provided in an outpatient or inpatient setting and may include one or more overnight stay.
Activities of this type consume approximately half of all NHS hospital expenditure.
In our analysis, we focus on attendances at outpatient clinics and elective (planned) inpatient spells
whether or not these involve an overnight stay. We have excluded some other similar forms of
care: inpatient maternity care, planned transfers between hospitals and regular day admissions
where care is delivered as a planned series of short admissions as part of an on-going regimen of
repeated treatments. These are relatively small components of planned hospital services and are
subject to different challenges.
1. Introduction

The Strategy Unit | Socio-economic inequalities in access to planned hospital care:
causes and consequences 4
https://csucloudservices-my.sharepoint.com/personal/rachel_caswell_mlcsu_nhs_uk/Documents/Documents/DSU/DSU project -/socio-
economic inequalities in access to planned hospital care - 210513 with adjusted hyperlinks.docx
1.2 Inequalities and inequities
The terms ‘inequalities’ and ‘inequities’ are used throughout this report. The terms have particular
and distinct meanings within a healthcare policy context. The term ‘inequalities’ is used to describe
differences in rates of access to a service between population subgroups; it makes no claims about
the appropriateness or fairness of these differences. In contrast the term ‘inequities’ is used to
describe unjustifiable differences in rates of access between subgroups. An equity analysis must
control for levels of need within each population subgroup. Having done this, an equitable
distribution of services is one where rates of access to a service or population follow the
distribution of need, such that a patient with a given level of need in one subgroup has the same
chance of accessing a service as their counterparts with a similar level of need in other subgroups.
This is the standard that the NHS seeks to achieve.
Assessing equity is challenging. In practice it is only feasible for specific services or pathways (e.g.,
for hip replacements) rather than for broader sets of services (e.g., elective hospital spells), because
patterns of need vary substantially between services. This report uses both inequality and inequity
assessments as required.
1.3 Dimensions of inequality
Inequalities and inequities can act across many different dimensions: gender, ethnicity, geography,
sexual preference, religion etc. This report is particularly concerned with differences in rates of
access between socio-economic groups as defined by indices of deprivation. These indices score
and rank small geographical areas (known as lower super output areas) by the relative levels of
deprivation experienced by their residents. The English Indices of Deprivation 2019, the most
recent release, measures deprivation across seven domains: income, employment, education,
health, crime, barriers to housing and services and living environment. Because this multi-faceted
definition of deprivation is used, deprivation should not be considered equivalent to poverty
although it is often the case that people living in the most deprived areas have lower levels of
income than people living in other areas.
Areas are often grouped in to 10 equally sized, deciles of deprivation with decile 1 representing the
10% of areas with the highest levels of deprivation and decile 10 representing the areas with the
lowest levels of deprivation. Quintiles of deprivation, five equally sized groups, are also commonly
used.
The Strategy Unit | Socio-economic inequalities in access to planned hospital care:
causes and consequences 5
https://csucloudservices-my.sharepoint.com/personal/rachel_caswell_mlcsu_nhs_uk/Documents/Documents/DSU/DSU project -/socio-
economic inequalities in access to planned hospital care - 210513 with adjusted hyperlinks.docx
1.4 Measuring inequalities
There are many, well-established approaches to measuring inequalities and inequities across a
population. In this report, we use the relative index of inequalities (RII) to indicate the extent to
which the rate of an activity or event varies across socio-economic groups defined by deciles of
deprivation. It is similar to the range (the difference between the highest and lowest rates), but
takes into account the values for all deprivation deciles as well as the population size of each
group, such that smaller groups do not unduly skew the results. Where the denominator of the
rates assessed is the population size, the RII measures degrees of inequality. Where the
denominator is a measure of need, the RII measures inequities.
1.5 Previous research
In 1971, the Lancet published a paper titled ‘The inverse care law’.1 The paper was authored by
Julian Tudor-Hart, drawing heavily on his experiences as a general practitioner in Glyncorrwg, a
coal-mining area in South Wales. The law states that:
"The availability of good medical care tends to vary inversely with the need for it in the
population served.”
He observed that while this is particularly apparent where medical care is distributed according to a
person’s ability to pay, it also holds true in health systems where individuals are fully insured. In
the 50 years since the paper was published, many quantitative and qualitative studies have
confirmed this relationship between the need and supply of healthcare. We highlight four such
papers.
In 2003 Anna Dixon, Julian Le Grand, John Henderson, Richard Murray and Emmi Poteliakhoff
reviewed the available evidence to determine whether the NHS was equitable.2 They concluded
that most studies exploring equity of access to specific planned procedures found that utilisation
rates were higher in higher-income groups after adjusting for need. Some studies pointed in the
opposite direction, but the authors highlight that these studies often relied on self-reported health
status as a proxy for need and that this may be subject to systematic bias, or that the studies did
not distinguish between planned and emergency care.
1 https://www.thelancet.com/journals/lancet/article/PIIS0140-6736(71)92410-X/fulltext 2 https://journals.sagepub.com/doi/10.1258/135581907780279549

The Strategy Unit | Socio-economic inequalities in access to planned hospital care:
causes and consequences 6
https://csucloudservices-my.sharepoint.com/personal/rachel_caswell_mlcsu_nhs_uk/Documents/Documents/DSU/DSU project -/socio-
economic inequalities in access to planned hospital care - 210513 with adjusted hyperlinks.docx
In 2010 Andy Judge, Nicky Welton, Jat Sandhu and Yoav Ben-Shlomo compared rates of need and
supply of NHS-funded hip and knee replacement surgery by quintiles of deprivation in England in
2002.3 Having adjusted for levels of need, they concluded that people living in the most deprived
areas were substantially less likely to receive an NHS-funded hip or knee replacement than their
counterparts in the least deprived areas.
In 2015 Martin Wenzl, Sarah McCuskee and Elias Mossialos reviewed the evidence on equity as a
policy goal and the NHS’s capacity to deliver equity through the process of commissioning.4 They
found that commissioners (Clinical Commissioning Groups) had limited capacity and incentives to
commission for equity. They concluded that the 2012 health reforms prioritised the goal of
efficiency at the expense of equity.
In 2020, Eric Brunner, Martin McKee, Martin Shipley, George Stoye and Ben Zaranko used self-
reported health status from a sample of older adults, to explore socio-economic inequities in
access to hospital care between 2004 and 2015.5 They found that since 2010, gaps in rates of
access to outpatient care had opened up between socio-economic groups. By 2015, individuals
with higher levels of qualification received higher levels of outpatient care relative to the
individual’s self-reported health status.
1.6 Recent policy context
The most recent planning guidance was issued by NHS England in March 2021.6 Two themes
receive particular attention: reducing health inequalities and managing the backlog of planned
hospital care that has built up over the course of the COVID-19 pandemic. An Elective Recovery
Fund (ERF) has been established to ensure that local health systems have sufficient resources to
deliver increased levels of planned hospital activity. To qualify for ERF monies, systems must
demonstrate that their plans meet the Fund’s objectives to address health inequalities. In
particular, local plans must:
• Use waiting list data (pre and during pandemic), including for clinically prioritised cohorts, to
identify disparities in relation to the bottom 20% by Index of Multiple Deprivation (IMD) and
black and minority ethnic populations.
3 https://www.bmj.com/content/341/bmj.c4092 4 https://academic.oup.com/bmb/article/115/1/5/260428 5 https://www.ifs.org.uk/publications/15059 6 https://www.england.nhs.uk/operational-planning-and-contracting/

The Strategy Unit | Socio-economic inequalities in access to planned hospital care:
causes and consequences 7
https://csucloudservices-my.sharepoint.com/personal/rachel_caswell_mlcsu_nhs_uk/Documents/Documents/DSU/DSU project -/socio-
economic inequalities in access to planned hospital care - 210513 with adjusted hyperlinks.docx
• Prioritise service delivery by taking account of the bottom 20% by IMD and black and minority
ethnic populations for patients on the waiting list and not on the waiting list, including
through proactive case finding.
• Use system performance frameworks to measure access, experience and outcomes for black
and minority ethnic populations and those in the bottom 20% of IMD scores.
• Evaluate the impact of elective recovery plans on addressing pre-pandemic and pandemic-
related disparities in waiting lists, including for clinically prioritised cohorts.
• Demonstrate how the ICS’s SRO for health inequalities will work with the Board and partner
organisations to use local population data to identify the needs of communities experiencing
inequalities in access, experience and outcomes and ensure that performance reporting allows
monitoring of progress in addressing these inequalities.
2021/22 priorities and operational planning guidance: Implementation guidance,
NHS England March 2021
1.7 Report structure
This report has four substantive chapters. Chapter 2 sets out levels of planned hospital care, before
moving on to describe inequalities in access to planned hospital care by activity type, condition
and STP. These assessments are made at two points in time: 2005 and 2018.
Chapter 3 seeks to identify where inequities emerge along the clinical pathway from the
development of symptoms to secondary care treatments. It describes four clinical pathways: those
for chronic obstructive pulmonary disease, heart failure, arthritis of the hip, and cataracts. Having
adjusted for levels of need, we estimate levels of inequity at six stages of each pathway:
identification, primary care management, primary care prescribing, referral to secondary care,
secondary care management and secondary care treatment.
Chapter 4 seeks to explain the results observed in Chapter 3 by exploring the impact of various
policy and clinical interventions including waiting times targets, the roll-out of new technologies
and screening programmes and processes that seek to control access to some forms of treatment.
Chapter 5 explores the relationship between inequalities in access to planned care and demand for
unplanned care. We consider the credibility of this claim before subjecting the causal hypothesis
to a formal test. Finally, we estimate how much unplanned care might be avoided if we addressed
inequalities in access to planned hospital care.

The Strategy Unit | Socio-economic inequalities in access to planned hospital care:
causes and consequences 8
https://csucloudservices-my.sharepoint.com/personal/rachel_caswell_mlcsu_nhs_uk/Documents/Documents/DSU/DSU project -/socio-
economic inequalities in access to planned hospital care - 210513 with adjusted hyperlinks.docx
1.8 Supplementary materials
Two additional sets of materials are provided alongside this regional report. The pathway analysis
in Chapter 3 is reproduced for each STP/ICS in the Midlands region, drawing out the key messages
for those systems and in particular highlighting where the results for an STP/ICS vary substantively
from those for the region as a whole. These can be found in a supplementary paper made
available alongside this report.
We also provide a series of technical appendices, in the form of r-markdown files, for each of the
substantive chapters in this report. These files set out the data sources we relied on, the processes
we used to assemble the data and the methods we used to analyse it. This material is supplied to
enable other analysts to check, replicate and advance our analysis (see Appendix E for details). We
welcome feedback from our fellow analysts on our approaches and methods.

The Strategy Unit | Socio-economic inequalities in access to planned hospital care:
causes and consequences 9
https://csucloudservices-my.sharepoint.com/personal/rachel_caswell_mlcsu_nhs_uk/Documents/Documents/DSU/DSU project -/socio-
economic inequalities in access to planned hospital care - 210513 with adjusted hyperlinks.docx
Key findings
Rates of access to planned care have increased substantially in recent years.
Rates of access are higher among those living in the least deprived areas. This was not always the
case.
This pattern holds for most major causes of morbidity and in most STPs.
In this chapter we estimate rates of outpatient attendances and elective spells per head of
population in 2018, and illustrate how these have changed since 2005. We show how activity rates
vary by age, sex and health condition. We then move on to explore how rates of access to planned
hospital care vary by socio-economic group, as defined by deciles of deprivation. We make these
assessments for 2005 and 2018, by health condition and STP/ICS.
2. Describing socio-economic inequalities
in access to planned hospital care

The Strategy Unit | Socio-economic inequalities in access to planned hospital care:
causes and consequences 10
https://csucloudservices-my.sharepoint.com/personal/rachel_caswell_mlcsu_nhs_uk/Documents/Documents/DSU/DSU project -/socio-
economic inequalities in access to planned hospital care - 210513 with adjusted hyperlinks.docx
2.1 Activity levels and trends
In 2018 there were 152.5 elective spells and 1,681 outpatient attendances per 1000 population in
England. This emphasises the scale of this aspect of NHS provision.
The level of planned hospital care increased considerably between 2005 and 2018. Rates of elective
spells per head of population increased by 33.1% in that period (2.2% per annum), while outpatient
attendances per head increased by 78.1% (4.5% per annum). This occurred despite constraints on
NHS funding growth in the years following the economic downturn in 2008 and 2009.

The Strategy Unit | Socio-economic inequalities in access to planned hospital care:
causes and consequences 11
https://csucloudservices-my.sharepoint.com/personal/rachel_caswell_mlcsu_nhs_uk/Documents/Documents/DSU/DSU project -/socio-
economic inequalities in access to planned hospital care - 210513 with adjusted hyperlinks.docx
2.2 Activity rates by age and sex
Rates of planned hospital care rise slowly with age to age 50 and then more sharply to age 80,
before declining. Obstetrics and gynaecology activity elevates outpatient rates for women aged 20-
45. Rates of elective spells and outpatient attendances are higher in older men than in women of
the same age. The bowel scope screening programme had a substantial impact on activity rates
for men and women aged 55, but this screening programme was discontinued in January 2021.
The Strategy Unit | Socio-economic inequalities in access to planned hospital care:
causes and consequences 12
https://csucloudservices-my.sharepoint.com/personal/rachel_caswell_mlcsu_nhs_uk/Documents/Documents/DSU/DSU project -/socio-
economic inequalities in access to planned hospital care - 210513 with adjusted hyperlinks.docx
2.3 Activity rates by condition
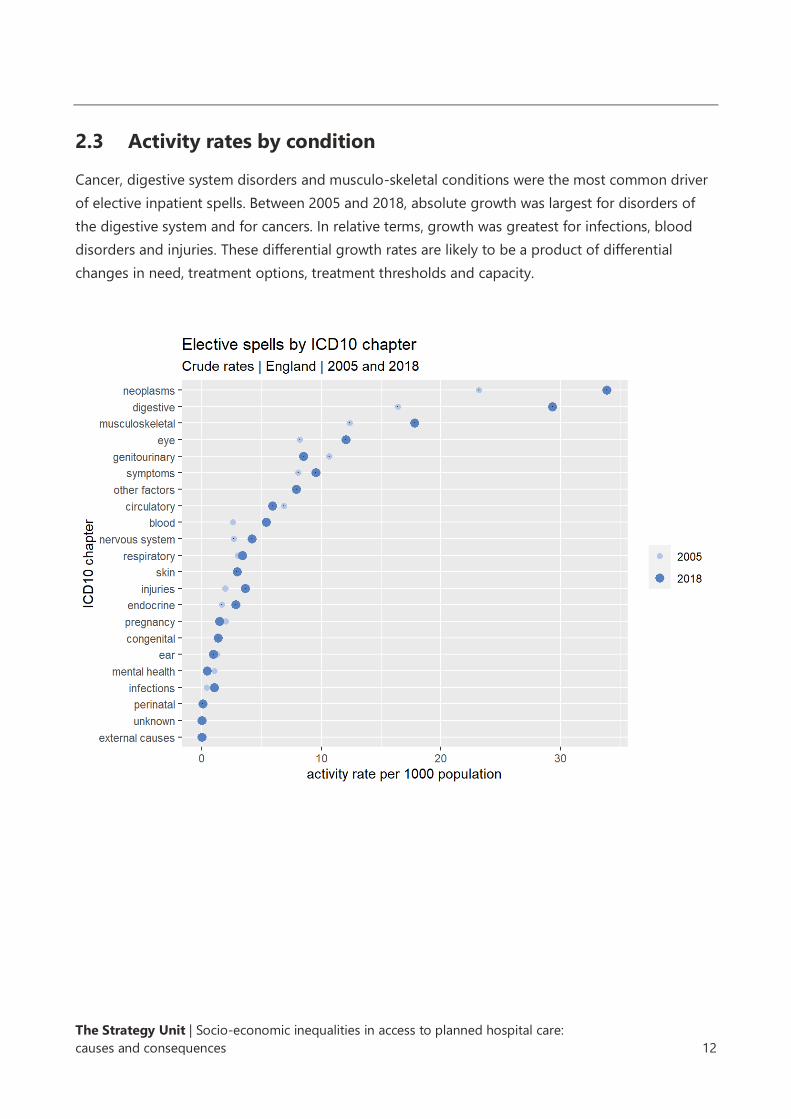
Cancer, digestive system disorders and musculo-skeletal conditions were the most common driver
of elective inpatient spells. Between 2005 and 2018, absolute growth was largest for disorders of
the digestive system and for cancers. In relative terms, growth was greatest for infections, blood
disorders and injuries. These differential growth rates are likely to be a product of differential
changes in need, treatment options, treatment thresholds and capacity.
The Strategy Unit | Socio-economic inequalities in access to planned hospital care:
causes and consequences 13
https://csucloudservices-my.sharepoint.com/personal/rachel_caswell_mlcsu_nhs_uk/Documents/Documents/DSU/DSU project -/socio-
economic inequalities in access to planned hospital care - 210513 with adjusted hyperlinks.docx
2.4 Differences in rates of planned hospital care by deprivation
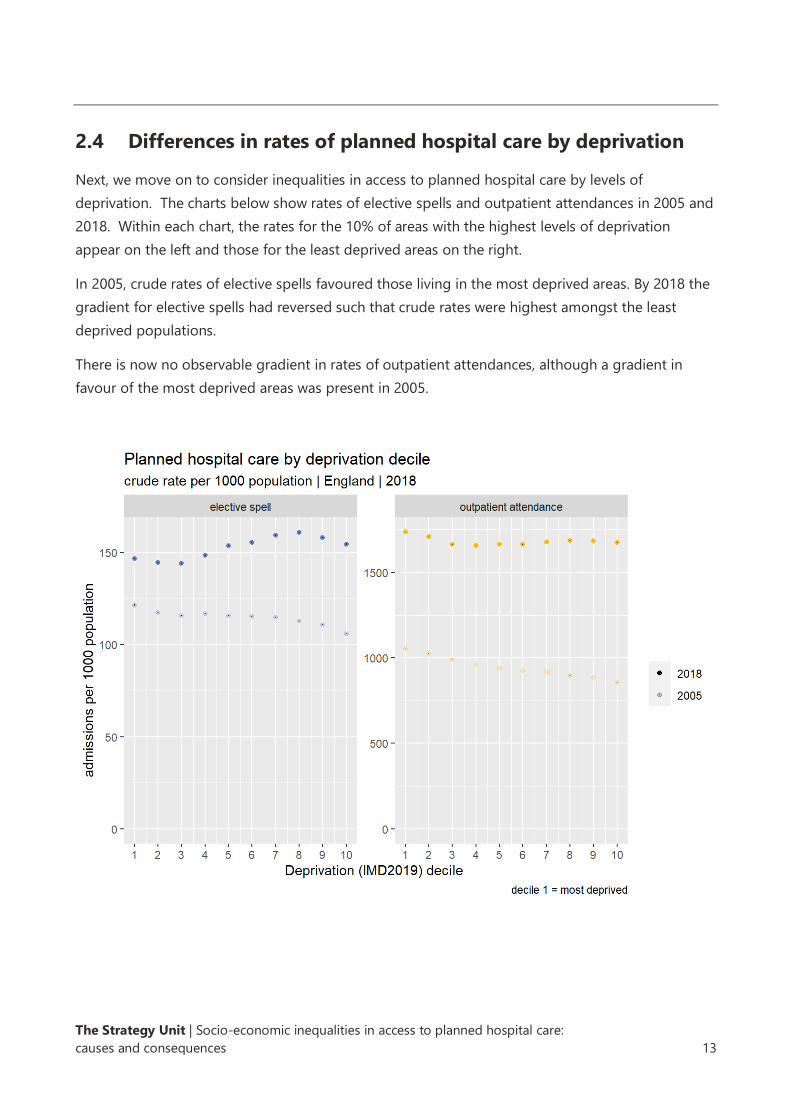
Next, we move on to consider inequalities in access to planned hospital care by levels of
deprivation. The charts below show rates of elective spells and outpatient attendances in 2005 and
2018. Within each chart, the rates for the 10% of areas with the highest levels of deprivation
appear on the left and those for the least deprived areas on the right.
In 2005, crude rates of elective spells favoured those living in the most deprived areas. By 2018 the
gradient for elective spells had reversed such that crude rates were highest amongst the least
deprived populations.
There is now no observable gradient in rates of outpatient attendances, although a gradient in
favour of the most deprived areas was present in 2005.

The Strategy Unit | Socio-economic inequalities in access to planned hospital care:
causes and consequences 14
https://csucloudservices-my.sharepoint.com/personal/rachel_caswell_mlcsu_nhs_uk/Documents/Documents/DSU/DSU project -/socio-
economic inequalities in access to planned hospital care - 210513 with adjusted hyperlinks.docx
2.5 Changes in rates of planned hospital care by deprivation
After taking account of differential changes in the age/sex structure, rates of elective spells and
outpatient attendances for those living in the most deprived areas have grown at a slower rate.
The Strategy Unit | Socio-economic inequalities in access to planned hospital care:
causes and consequences 15
https://csucloudservices-my.sharepoint.com/personal/rachel_caswell_mlcsu_nhs_uk/Documents/Documents/DSU/DSU project -/socio-
economic inequalities in access to planned hospital care - 210513 with adjusted hyperlinks.docx
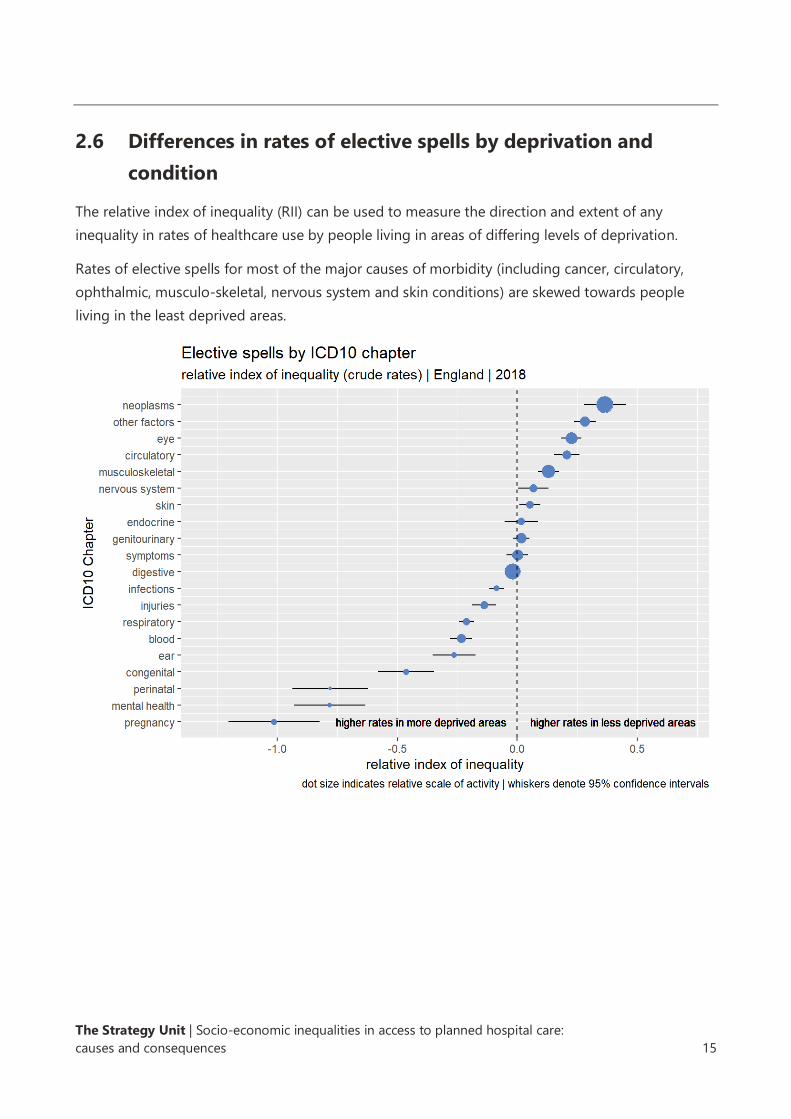
2.6 Differences in rates of elective spells by deprivation and
condition
The relative index of inequality (RII) can be used to measure the direction and extent of any
inequality in rates of healthcare use by people living in areas of differing levels of deprivation.
Rates of elective spells for most of the major causes of morbidity (including cancer, circulatory,
ophthalmic, musculo-skeletal, nervous system and skin conditions) are skewed towards people
living in the least deprived areas.
The Strategy Unit | Socio-economic inequalities in access to planned hospital care:
causes and consequences 16
https://csucloudservices-my.sharepoint.com/personal/rachel_caswell_mlcsu_nhs_uk/Documents/Documents/DSU/DSU project -/socio-
economic inequalities in access to planned hospital care - 210513 with adjusted hyperlinks.docx
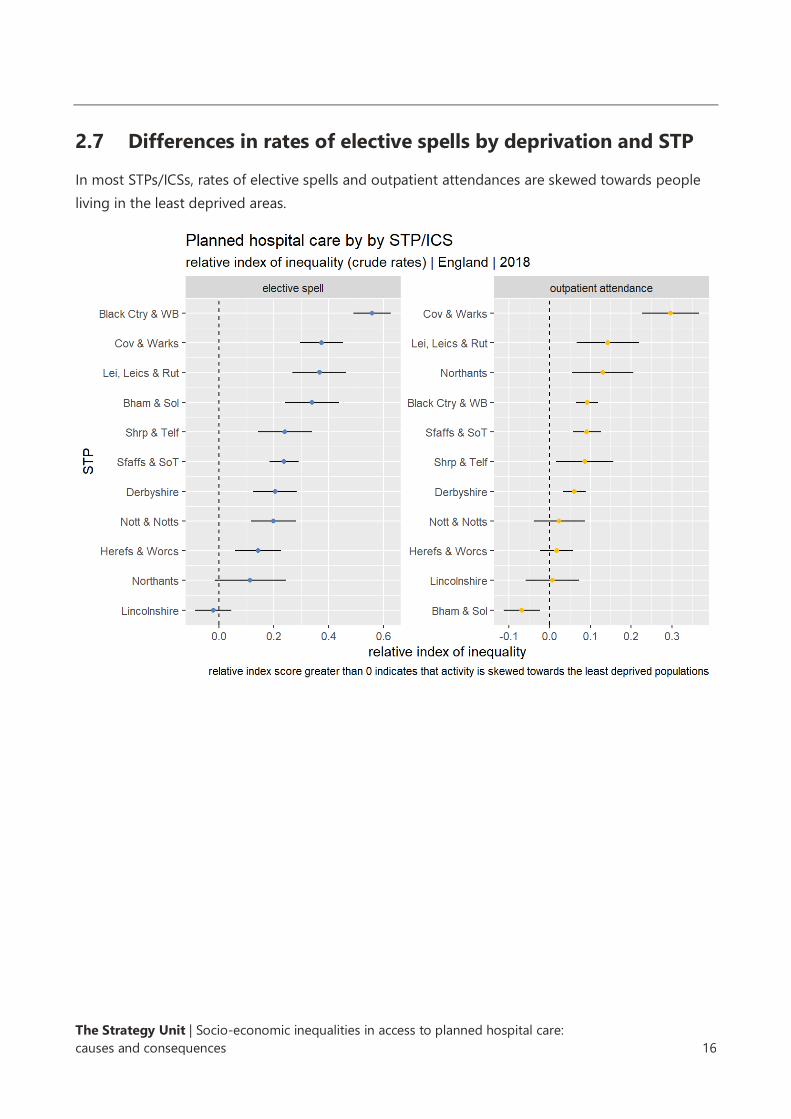
2.7 Differences in rates of elective spells by deprivation and STP
In most STPs/ICSs, rates of elective spells and outpatient attendances are skewed towards people
living in the least deprived areas.
The Strategy Unit | Socio-economic inequalities in access to planned hospital care:
causes and consequences 17
https://csucloudservices-my.sharepoint.com/personal/rachel_caswell_mlcsu_nhs_uk/Documents/Documents/DSU/DSU project -/socio-
economic inequalities in access to planned hospital care - 210513 with adjusted hyperlinks.docx
Key findings
We explored four pathways: chronic obstructive pulmonary disease, heart failure, arthritis of the
hip, and cataracts.
Having adjusted for levels of need, activity in the early parts of each the four pathways was skewed
towards the most deprived.
This pattern was reversed towards the very end of the pathway, when secondary care treatment
occurs.
Having established that rates of planned hospital spells are lower for those living in the most
deprived areas, this chapter seeks to confirm whether these differences persist after adjustments
are made for levels of need and, if so, where these inequities emerge over the planned care
pathway. We make these assessments for four planned care pathways: chronic obstructive
pulmonary disease (COPD), heart failure, arthritis of the hip, and cataracts. These high-volume
pathways were selected in consultation with colleagues in the DSU network. Two pathways - for
hip arthritis and cataracts - are predominantly surgical, requiring some form of localised
intervention. Those for COPD and heart failure are predominantly medical and involve a more
systemic approach to treatment.
3.1 Moving from inequalities to inequities
In Chapter 2, we saw that rates of planned hospital spells per head of population were lower
among those living in the most deprived areas - but levels of need per head of population might
differ between those living in more or less deprived areas. A more useful assessment would
involve comparing rates of planned hospital spells across deciles of deprivation having adjusted for
levels of need. An assessment of this type supports judgements not only about differences in rates
of access between groups, but also about whether these differences are clinically justified.
Information about how we adjusted for levels of need can be found in Appendix A.
3. Where in the pathway do inequities in
planned hospital care emerge?
The Strategy Unit | Socio-economic inequalities in access to planned hospital care:
causes and consequences 18
https://csucloudservices-my.sharepoint.com/personal/rachel_caswell_mlcsu_nhs_uk/Documents/Documents/DSU/DSU project -/socio-
economic inequalities in access to planned hospital care - 210513 with adjusted hyperlinks.docx
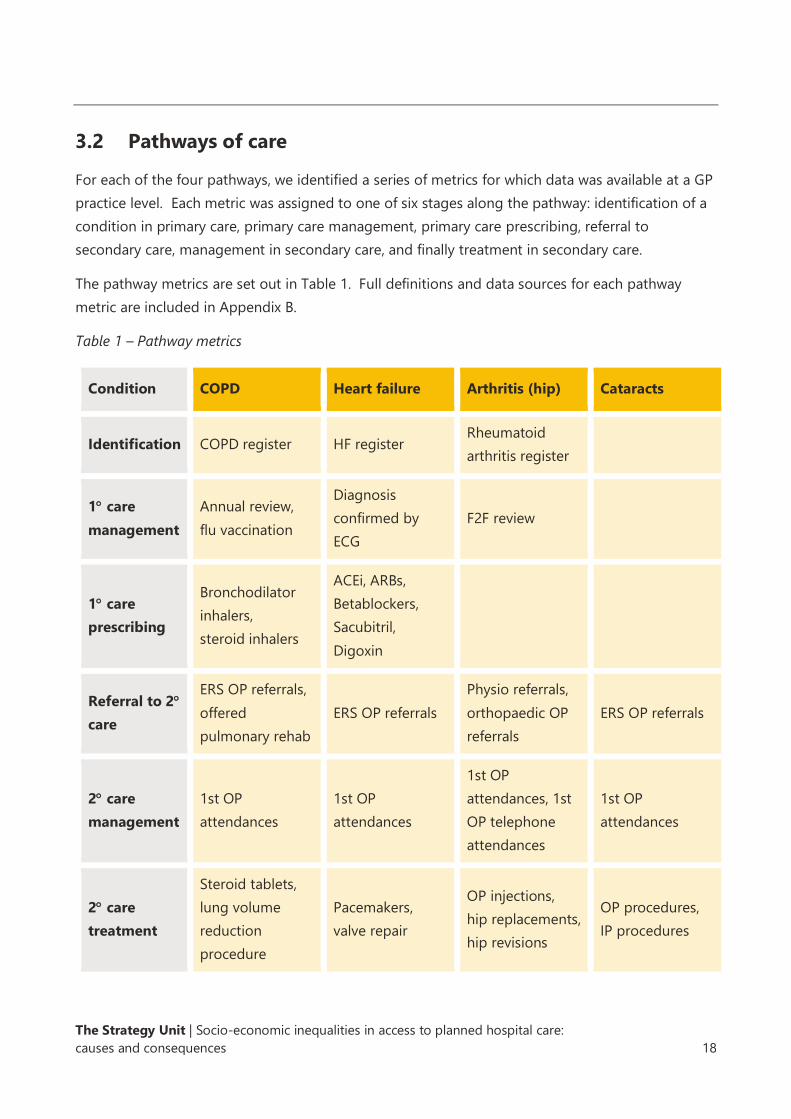
3.2 Pathways of care
For each of the four pathways, we identified a series of metrics for which data was available at a GP
practice level. Each metric was assigned to one of six stages along the pathway: identification of a
condition in primary care, primary care management, primary care prescribing, referral to
secondary care, management in secondary care, and finally treatment in secondary care.
The pathway metrics are set out in Table 1. Full definitions and data sources for each pathway
metric are included in Appendix B.
Table 1 – Pathway metrics
Condition COPD Heart failure Arthritis (hip) Cataracts
Identification COPD register HF register Rheumatoid
arthritis register
1 care
management
Annual review,
flu vaccination
Diagnosis
confirmed by
ECG
F2F review
1 care
prescribing
Bronchodilator
inhalers,
steroid inhalers
ACEi, ARBs,
Betablockers,
Sacubitril,
Digoxin
Referral to 2
care
ERS OP referrals,
offered
pulmonary rehab
ERS OP referrals
Physio referrals,
orthopaedic OP
referrals
ERS OP referrals
2 care
management
1st OP
attendances
1st OP
attendances
1st OP
attendances, 1st
OP telephone
attendances
1st OP
attendances
2 care
treatment
Steroid tablets,
lung volume
reduction
procedure
Pacemakers,
valve repair
OP injections,
hip replacements,
hip revisions
OP procedures,
IP procedures
The Strategy Unit | Socio-economic inequalities in access to planned hospital care:
causes and consequences 19
https://csucloudservices-my.sharepoint.com/personal/rachel_caswell_mlcsu_nhs_uk/Documents/Documents/DSU/DSU project -/socio-
economic inequalities in access to planned hospital care - 210513 with adjusted hyperlinks.docx
The following charts for each of the pathways show the activity-to-need ratios (activity per 1,000
need) by deprivation decile for each of the activity measures detailed above. The relative index of
inequalities (RII) is given for each measure.
The RII represents the inequality gap across the whole population between the most and the least
disadvantaged. It allows for comparison of inequity across different measures. The sign of the RII
indicates the direction of the inequity: a negative RII indicates that activity-to-need ratios are
higher for those in more deprived groups, whereas a positive RII indicates higher activity-to-need
ratios in the least deprived groups. The absolute size of the RII (i.e., its numerical value without the
sign) indicates the size of the inequity.
3.3 Chronic obstructive pulmonary disease
Chronic obstructive pulmonary disease is a term used to describe progressive, chronic conditions
such as emphysema and chronic bronchitis that cause breathing difficulties. These conditions can
be managed in primary care, but as symptoms worsen, patients are often referred to secondary
care for more specialised medical treatment. In some cases, patients are offered surgical
interventions to remove air pockets and damaged parts of the lung.
The charts that follow show the ratio of activity to need at various points on the COPD pathway.
Patients with COPD in the most deprived areas are more likely to be identified by their GP and
placed on a COPD register than patients in the least deprived areas. Patients with COPD in the
most deprived areas are also more likely to receive primary care management (annual reviews and
influenza vaccinations), to be prescribed inhalers, to be referred to secondary care and, to be seen
by a specialist in an outpatient setting. However, patients with COPD living in the least deprived
areas are more likely to receive treatments in secondary care, such as lung volume reduction
surgery.

The Strategy Unit | Socio-economic inequalities in access to planned hospital care:
causes and consequences 20
https://csucloudservices-my.sharepoint.com/personal/rachel_caswell_mlcsu_nhs_uk/Documents/Documents/DSU/DSU project -/socio-
economic inequalities in access to planned hospital care - 210513 with adjusted hyperlinks.docx
Identification
Primary care management
Primary care prescribing
Referral to secondary care
Secondary care management
Secondary care treatment

The Strategy Unit | Socio-economic inequalities in access to planned hospital care:
causes and consequences 21
https://csucloudservices-my.sharepoint.com/personal/rachel_caswell_mlcsu_nhs_uk/Documents/Documents/DSU/DSU project -/socio-
economic inequalities in access to planned hospital care - 210513 with adjusted hyperlinks.docx
The summary chart below illustrates the RII for each metric on the COPD pathway. It includes
confidence intervals indicating whether the observed inequity is statistically significant. Yellow
points on the chart indicate that activity is significantly skewed towards more deprived populations,
and blue points indicate that activity is significantly skewed towards less deprived populations.
Grey points indicate there is no evidence of inequity at these points on the pathway.
For some metrics, the level of detail in the underlying datasets means we can be confident that the
metrics relate exclusively to patients on the relevant pathway. For example, the COPD pathway
metric relating to influenza vaccinations relates specifically to patients on primary care COPD
registers. For other metrics, this is not the case, for example, the hip arthritis pathway metric
relating to outpatient referrals, measures rates of all orthopaedic outpatient referrals, not just those
for hip arthritis. We provide some indication of the degree of ‘fit’ between the metric and the
pathway in Appendix B and the subsequent charts. This is also indicated on the charts, with the
level of transparency of each dot representing the extent to which the metric fits the pathway.
It shows that at the early part of the COPD pathway, activities are skewed towards patients living in
the most deprived areas, but at the end of the pathway the skew is reversed with people living in
the least deprived areas being more likely to receive secondary care treatments.

The Strategy Unit | Socio-economic inequalities in access to planned hospital care:
causes and consequences 22
https://csucloudservices-my.sharepoint.com/personal/rachel_caswell_mlcsu_nhs_uk/Documents/Documents/DSU/DSU project -/socio-
economic inequalities in access to planned hospital care - 210513 with adjusted hyperlinks.docx
One potential explanation for this finding is that patients living in the least deprived areas are in
greater need of secondary care treatments because they receive lower levels of care at earlier
stages of the pathway. However, we note that having adjusted for need, emergency COPD
hospital spells and deaths in hospital following an emergency COPD spell are higher among those
living in the most deprived areas. This suggests that the skew towards the most deprived in the
earlier parts of the pathway are not sufficient to slow disease progression relative to those living in
the least deprived areas.
The Strategy Unit | Socio-economic inequalities in access to planned hospital care:
causes and consequences 23
https://csucloudservices-my.sharepoint.com/personal/rachel_caswell_mlcsu_nhs_uk/Documents/Documents/DSU/DSU project -/socio-
economic inequalities in access to planned hospital care - 210513 with adjusted hyperlinks.docx
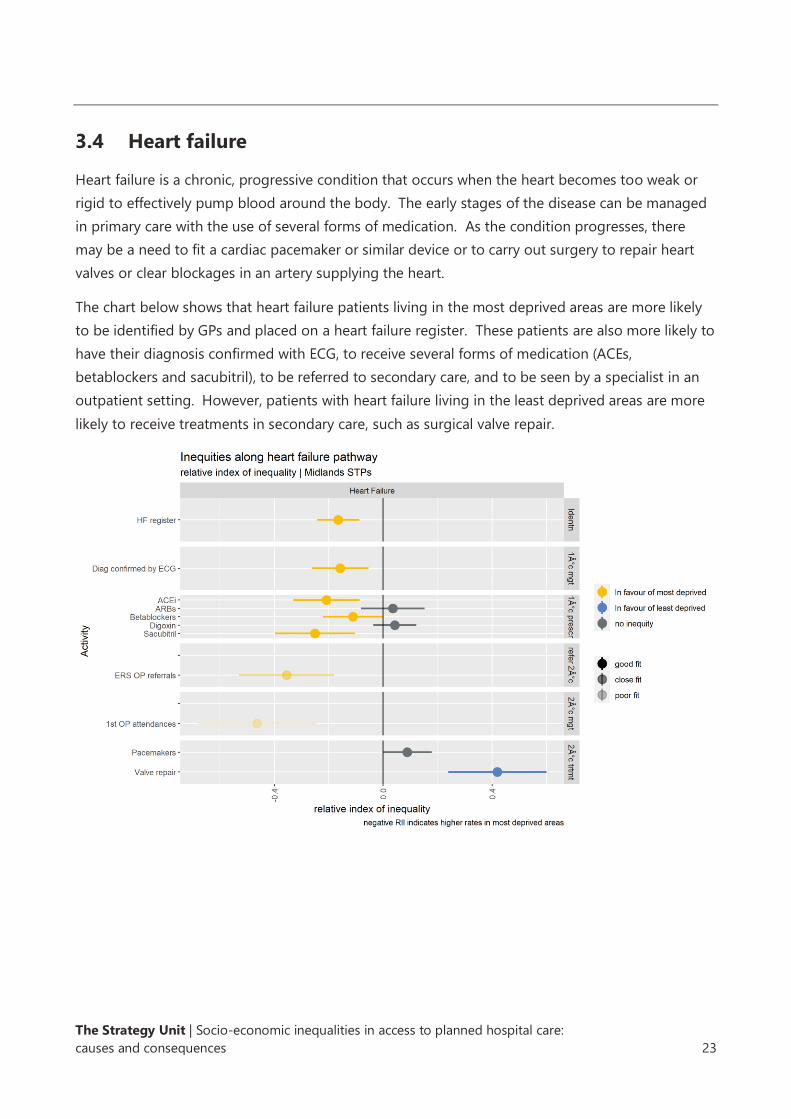
3.4 Heart failure
Heart failure is a chronic, progressive condition that occurs when the heart becomes too weak or
rigid to effectively pump blood around the body. The early stages of the disease can be managed
in primary care with the use of several forms of medication. As the condition progresses, there
may be a need to fit a cardiac pacemaker or similar device or to carry out surgery to repair heart
valves or clear blockages in an artery supplying the heart.
The chart below shows that heart failure patients living in the most deprived areas are more likely
to be identified by GPs and placed on a heart failure register. These patients are also more likely to
have their diagnosis confirmed with ECG, to receive several forms of medication (ACEs,
betablockers and sacubitril), to be referred to secondary care, and to be seen by a specialist in an
outpatient setting. However, patients with heart failure living in the least deprived areas are more
likely to receive treatments in secondary care, such as surgical valve repair.

The Strategy Unit | Socio-economic inequalities in access to planned hospital care:
causes and consequences 24
https://csucloudservices-my.sharepoint.com/personal/rachel_caswell_mlcsu_nhs_uk/Documents/Documents/DSU/DSU project -/socio-
economic inequalities in access to planned hospital care - 210513 with adjusted hyperlinks.docx
3.5 Arthritis of the hip
Arthritis is a term, used to describe several progressive, autoimmune disorders of the joints.
Osteoarthritis and rheumatoid arthritis are two common forms of arthritis affecting the hip that
cause pain and, stiffness and reduce the range of motion. Improvements to a patient’s lifestyle can
help, and over-the-counter medications can be used to manage pain and inflammation at the early
stages of the disease. As the condition progresses, physiotherapy and prescribed medications may
be required. When a patient’s hip pain or mobility has deteriorated sufficiently, they are often
offered surgery to replace the hip with an artificial joint. Modern hip prostheses last for many
years, but surgery to replace an artificial joint with another may sometimes be required.
Compared with those living in the least deprived areas, patients with hip arthritis living in the most
deprived areas are more likely to be identified by GPs and placed on an arthritis register. They are
also more likely to receive a face-to-face review in primary care and to be seen by a specialist in an
outpatient setting. Patients with hip arthritis living in the least deprived areas are, however, more
likely to receive a telephone consultation from a specialist and to receive a hip replacement.

The Strategy Unit | Socio-economic inequalities in access to planned hospital care:
causes and consequences 25
https://csucloudservices-my.sharepoint.com/personal/rachel_caswell_mlcsu_nhs_uk/Documents/Documents/DSU/DSU project -/socio-
economic inequalities in access to planned hospital care - 210513 with adjusted hyperlinks.docx
3.6 Cataracts
The term ‘cataracts’ describes a progressive condition in which the lens in a person’s eye becomes
cloudy, obscuring vision. The condition is usually diagnosed by a community optician who in turn
refers a patient to a specialist ophthalmologist. Surgery to replace the lens with an artificial one is
the only proven form of treatment.
Data on the early part of the cataracts pathway is difficult to obtain in the detail required for this
assessment. However, the available data, suggests that patients living in the most deprived areas
are more likely to receive a first outpatient appointment with a consultant. Cataract surgery can be
delivered in outpatient or an inpatient setting; the data suggests that people living in the most
deprived areas are more likely to receive inpatient surgery.
Note that our method of estimating need for cataract surgery is comparatively crude. The method
adjusts for some risk factors (e.g., age) but not for risk factors such as smoking, alcohol
consumption, diabetes, or steroid use. This may mean that our estimates understate the level of
need in the most deprived areas and overstate need in the least deprived areas.
The Strategy Unit | Socio-economic inequalities in access to planned hospital care:
causes and consequences 26
https://csucloudservices-my.sharepoint.com/personal/rachel_caswell_mlcsu_nhs_uk/Documents/Documents/DSU/DSU project -/socio-
economic inequalities in access to planned hospital care - 210513 with adjusted hyperlinks.docx
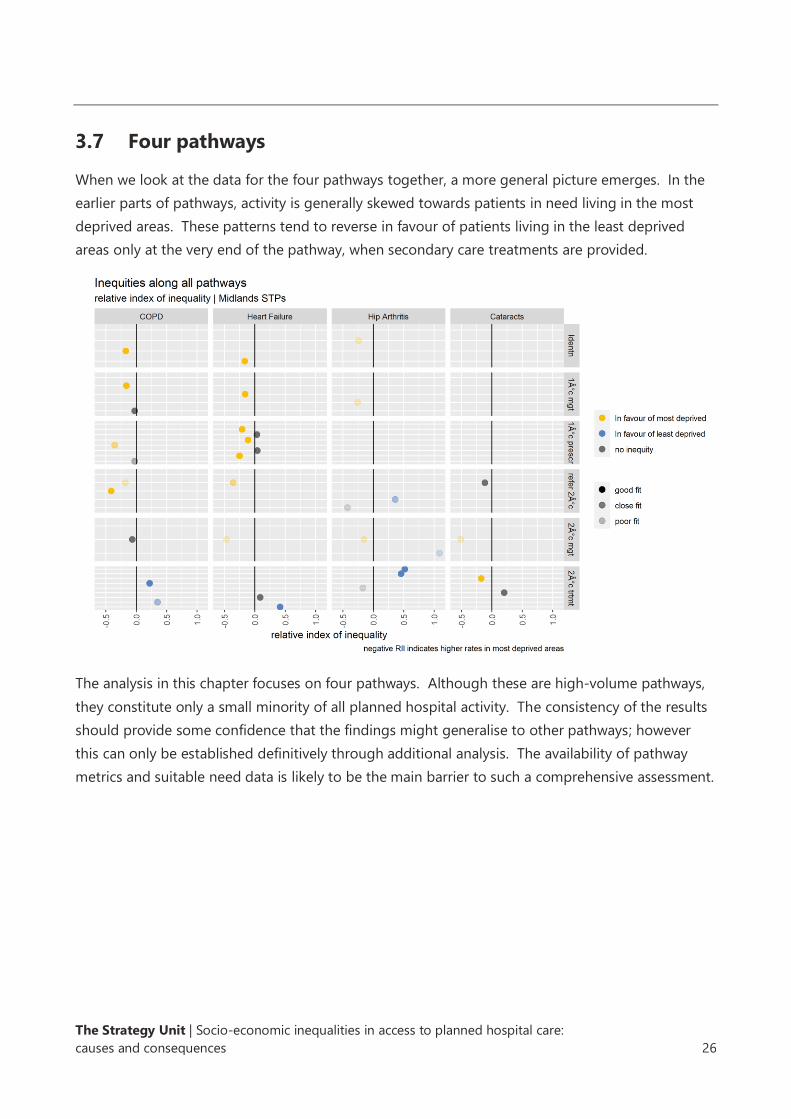
3.7 Four pathways
When we look at the data for the four pathways together, a more general picture emerges. In the
earlier parts of pathways, activity is generally skewed towards patients in need living in the most
deprived areas. These patterns tend to reverse in favour of patients living in the least deprived
areas only at the very end of the pathway, when secondary care treatments are provided.
The analysis in this chapter focuses on four pathways. Although these are high-volume pathways,
they constitute only a small minority of all planned hospital activity. The consistency of the results
should provide some confidence that the findings might generalise to other pathways; however
this can only be established definitively through additional analysis. The availability of pathway
metrics and suitable need data is likely to be the main barrier to such a comprehensive assessment.

The Strategy Unit | Socio-economic inequalities in access to planned hospital care:
causes and consequences 27
https://csucloudservices-my.sharepoint.com/personal/rachel_caswell_mlcsu_nhs_uk/Documents/Documents/DSU/DSU project -/socio-
economic inequalities in access to planned hospital care - 210513 with adjusted hyperlinks.docx
Key findings
The late pathway skew towards the least deprived populations that has occurred in recent years
may be a function of various policy initiatives introduced to improve or control access to secondary
care treatments.
Access to NHS-funded private sector treatment is substantially higher in the least deprived
populations.
As waiting times improved between 2000 and 2014, the benefits were felt disproportionately by
those living in the least deprived areas.
Growth in rates of access to new imaging technologies tends to be slower in the most deprived
areas.
When the NHS seeks to limit access to certain forms of surgery, rates tend to fall more rapidly in
the most deprived areas.
When the NHS introduces new screening programmes, interventions resulting from those
programmes tend to increase more slowly in the most deprived areas.
In Chapters 2 and 3 we saw substantial and widespread inequities in access to planned hospital
care. These inequities have not always been present at this scale and they tend to emerge late in
the care pathway. Pinning down the causes or drivers of these changes is not straightforward. In
this chapter we offer our emerging theories and provide some supporting evidence. We regard
these theories as credible explanations, but further work is required to confirm them.
4.1 Differential impacts of health policies to improve or control
access to planned hospital care
Improving access to planned hospital care has been a key theme of health policy since the early
2000s, reducing waiting times, maximising uptake of new diagnostic tests and, surgical procedures,
and rolling out screening programmes.
As NHS budgets became increasingly constrained following the economic downturn in 2008 and
2009, NHS policy turned to controlling access to certain low-value forms of secondary care. The
4. Possible drivers of inequalities in
access to planned hospital care
The Strategy Unit | Socio-economic inequalities in access to planned hospital care:
causes and consequences 28
https://csucloudservices-my.sharepoint.com/personal/rachel_caswell_mlcsu_nhs_uk/Documents/Documents/DSU/DSU project -/socio-
economic inequalities in access to planned hospital care - 210513 with adjusted hyperlinks.docx
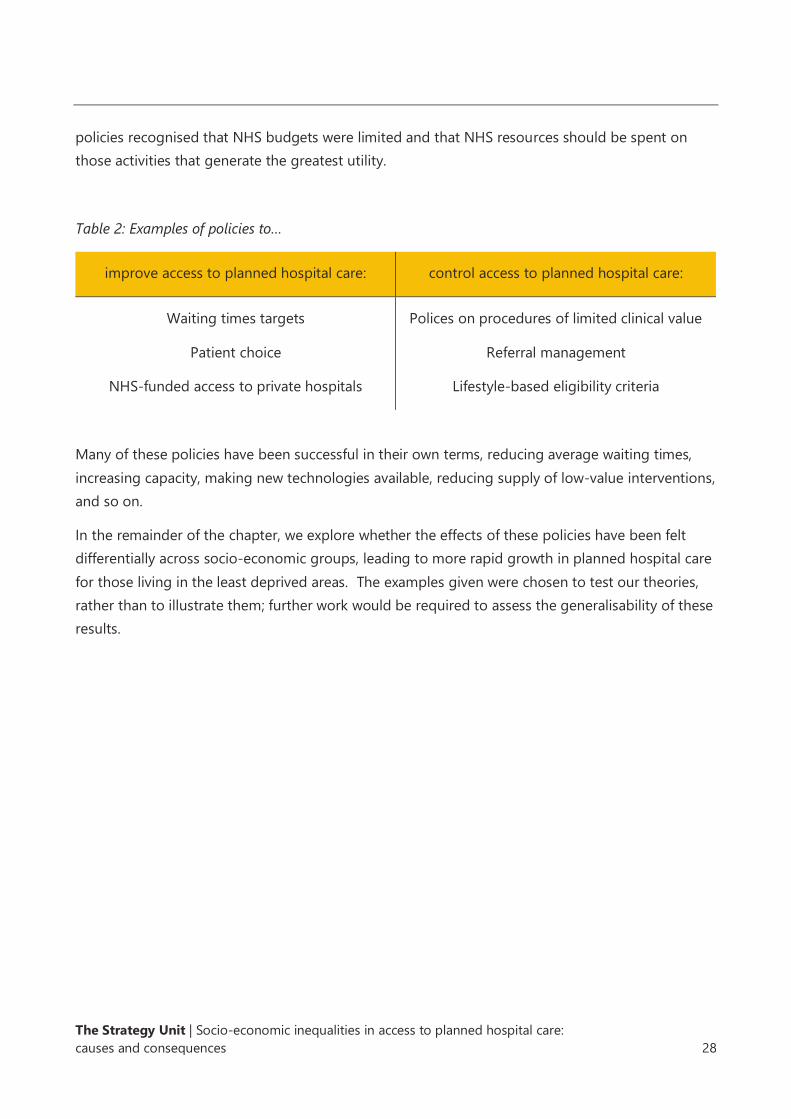
policies recognised that NHS budgets were limited and that NHS resources should be spent on
those activities that generate the greatest utility.
Table 2: Examples of policies to…
improve access to planned hospital care: control access to planned hospital care:
Waiting times targets
Patient choice
NHS-funded access to private hospitals
Polices on procedures of limited clinical value
Referral management
Lifestyle-based eligibility criteria
Many of these policies have been successful in their own terms, reducing average waiting times,
increasing capacity, making new technologies available, reducing supply of low-value interventions,
and so on.
In the remainder of the chapter, we explore whether the effects of these policies have been felt
differentially across socio-economic groups, leading to more rapid growth in planned hospital care
for those living in the least deprived areas. The examples given were chosen to test our theories,
rather than to illustrate them; further work would be required to assess the generalisability of these
results.

The Strategy Unit | Socio-economic inequalities in access to planned hospital care:
causes and consequences 29
https://csucloudservices-my.sharepoint.com/personal/rachel_caswell_mlcsu_nhs_uk/Documents/Documents/DSU/DSU project -/socio-
economic inequalities in access to planned hospital care - 210513 with adjusted hyperlinks.docx
4.2 Waiting times targets
A series of national targets and standards have been developed to increase the proportion of
patients who receive planned care in a timely manner. Initially, these targets measured the time
between a decision to admit a patient and the admission itself. Targets became increasingly
numerous and sophisticated, measuring the times from referral to treatment. These targets are
currently the subject of a national review.
In the early and mid-2000s, people in more deprived areas were, on average, getting faster access
to elective inpatient activity. Waiting times improved dramatically for all groups in the late 2000s.
By 2014 the gradient in waiting times across deprivation quintiles had reversed, and those in less
deprived areas were receiving faster access to care. Since 2014, waiting times have deteriorated
and the gradient across deprivation quintiles has become less clear.

The Strategy Unit | Socio-economic inequalities in access to planned hospital care:
causes and consequences 30
https://csucloudservices-my.sharepoint.com/personal/rachel_caswell_mlcsu_nhs_uk/Documents/Documents/DSU/DSU project -/socio-
economic inequalities in access to planned hospital care - 210513 with adjusted hyperlinks.docx
4.3 NHS-funded access to private hospital provision
The patient choice initiative allowed patients to choose the hospital where they would receive care
and made information available to patients on the quality and timeliness of care in different
hospitals. Independent Sector Treatment Centres (ISTCs) were developed to increase planned care
capacity. The extended choice initiative allowed patients to elect to receive their NHS-funded care
in certain independent and private hospitals.
In the early 2000s, NHS-funded access to the independent sector was negligible. The development
of ISTCs in the mid-2000s and the extended choice policy initiative in 2007 resulted in a steady
increase in NHS-funded independent sector activity. Access to independent sector providers is
substantially higher among the least deprived populations and the disparity is increasing.

The Strategy Unit | Socio-economic inequalities in access to planned hospital care:
causes and consequences 31
https://csucloudservices-my.sharepoint.com/personal/rachel_caswell_mlcsu_nhs_uk/Documents/Documents/DSU/DSU project -/socio-
economic inequalities in access to planned hospital care - 210513 with adjusted hyperlinks.docx
4.4 Access to new diagnostic technologies
The past two decades have seen the development and roll-out of many new forms of diagnostic
imaging. Colonography - computed tomography (CT) of the colon - involves the use of specially
adapted x-ray equipment to examine the large intestine for cancers, growths and other bowel
disorders. It extends the coverage of diagnostic imaging of the colon to patients who would be
less able to tolerate a colonoscopy, the standard but more invasive intervention.
Single photon emission computed tomography (SPECT) provides images of the flow of blood
within the body. It is used to diagnose a range of conditions, including seizures, infections and
cancers. It is often used as an alternative to positron emission tomography (PET), which is both
very expensive and highly resource constrained.
Between 2009 and 2018, the growth in the use of colonography and SPECT has been greater for
those living in the least deprived areas.

The Strategy Unit | Socio-economic inequalities in access to planned hospital care:
causes and consequences 32
https://csucloudservices-my.sharepoint.com/personal/rachel_caswell_mlcsu_nhs_uk/Documents/Documents/DSU/DSU project -/socio-
economic inequalities in access to planned hospital care - 210513 with adjusted hyperlinks.docx
4.5 Access to procedures arising from new screening programmes
The NHS operates several population screening programmes. Screening seeks to identify people
at higher risk of a disease so that treatments can be made available at an early stage, thereby
improving outcomes. The NHS has introduced several new screening programmes in recent years.
The abdominal aortic aneurysm screening programme invites men to receive an ultrasound test in
the year they turn 65. The scan seeks to establish the presence or absence of an aneurysm in the
main blood vessel that runs between the heart and the stomach. If an aneurysm goes untreated, it
may burst and result in life-threatening internal bleeding. If detected, it can be monitored or
treated. Large abdominal aortic aneurysms can be repaired with surgery.
Until recently there were two bowel cancer screening programmes: the faecal immunochemical test
(FIT) and bowel scope. The latter involved inviting men and women aged 55 years to receive a
single endoscopic examination of the lower portion of the bowel; however this programme was
discontinued in January 2021.
The Strategy Unit | Socio-economic inequalities in access to planned hospital care:
causes and consequences 33
https://csucloudservices-my.sharepoint.com/personal/rachel_caswell_mlcsu_nhs_uk/Documents/Documents/DSU/DSU project -/socio-
economic inequalities in access to planned hospital care - 210513 with adjusted hyperlinks.docx
Between 2009 and 2018, rates of growth of elective abdominal aortic aneurysm grafts in men aged
65 and bowel scopes in men and women aged 55, increased more among those living in the least
deprived areas.
4.6 Access to procedures with extensive eligibility criteria
Commissioners developed lists of procedures of limited clinical value and set out the criteria that
must be met before these procedures could be delivered. This included procedures that were
predominantly cosmetic, those with a high risk-benefit ratio, those for which there was limited
evidence of effectiveness, or those where more cost-effective alternatives were available. In some
cases, commissioners restricted access to some forms of treatment if certain lifestyle-based criteria
(e.g., body mass index or smoking status) were met. Referral management centres were set up to
review the referrals of GPs to secondary care, to identify and divert patients for whom there was a
view that secondary care treatment was not yet warranted.
Tonsillectomy and carpal tunnel release are forms of surgery that commonly feature on
commissioner lists of ‘procedures of limited clinical value’. Tonsillectomy involves the surgical
removal of the tonsils in order to treat recurrent throat infections and obstructive sleep apnoea.
Although historically performed in high volumes, trials revealed that many recipients did not
benefit from the surgery. Over time, the eligibility criteria for tonsillectomy have been tightened to
limit access to those who are most likely to benefit.
Carpal tunnel syndrome is a progressive condition that causes pain, numbness and tingling in the
thumbs and fingers. Over time, pain may extend up the arm, causing weak grip and muscle
wastage. The condition is caused by the compression of a nerve that runs through the wrist and
carpal tunnel release is a surgical intervention to alleviate this compression. Carpal tunnel
syndrome is common and mild symptoms often resolve without treatment. Eligibility criteria for
surgery reflect the fact that those experiencing more severe and persistent symptoms are more
likely to receive benefit from the surgery, whilst non-surgical interventions are effective for other
people and carry fewer risks.
Between 2009 and 2018, having adjusted for changes in the age-sex population structure, rates of
carpal tunnel release and tonsillectomy procedures have fallen fastest among those living in the
most deprived areas.

The Strategy Unit | Socio-economic inequalities in access to planned hospital care:
causes and consequences 34
https://csucloudservices-my.sharepoint.com/personal/rachel_caswell_mlcsu_nhs_uk/Documents/Documents/DSU/DSU project -/socio-
economic inequalities in access to planned hospital care - 210513 with adjusted hyperlinks.docx

The Strategy Unit | Socio-economic inequalities in access to planned hospital care:
causes and consequences 35
https://csucloudservices-my.sharepoint.com/personal/rachel_caswell_mlcsu_nhs_uk/Documents/Documents/DSU/DSU project -/socio-
economic inequalities in access to planned hospital care - 210513 with adjusted hyperlinks.docx
Key findings
There is good evidence of a relationship between levels of planned and emergency spells.
For every 10 additional elective spells, we estimate that one emergency spell will be avoided.
The effect accumulates over two years.
Increasing access to elective care for those in the most deprived areas is likely to lead to reductions
in emergency care overall and to inequalities in levels of emergency care.
In this chapter, we explore one potential consequence of inequality in access to planned care: its
impact on demand for unplanned care. The notion that levels of unplanned hospital care might be
affected by levels of planned hospital care has face validity. If an individual with a treatable
condition does not received planned hospital interventions in a timely manner, then we might
expect their condition to deteriorate to a point where an episode of unplanned care is inevitable.
We have seen that rates of elective spells are lower for those living in the most deprived areas. We
seek to confirm earlier work demonstrating that rates of urgent care, including unplanned hospital
admissions, are higher for people living in these areas, compared with people living in areas of
lower deprivation. We then explore the credibility of a negative causal relationship between rates
of planned and unplanned care. Finally, we estimate the impact of equalising access to planned
care on levels of emergency spells.
5. Does poor access to planned hospital
care increase demand for unplanned
care?
The Strategy Unit | Socio-economic inequalities in access to planned hospital care:
causes and consequences 36
https://csucloudservices-my.sharepoint.com/personal/rachel_caswell_mlcsu_nhs_uk/Documents/Documents/DSU/DSU project -/socio-
economic inequalities in access to planned hospital care - 210513 with adjusted hyperlinks.docx
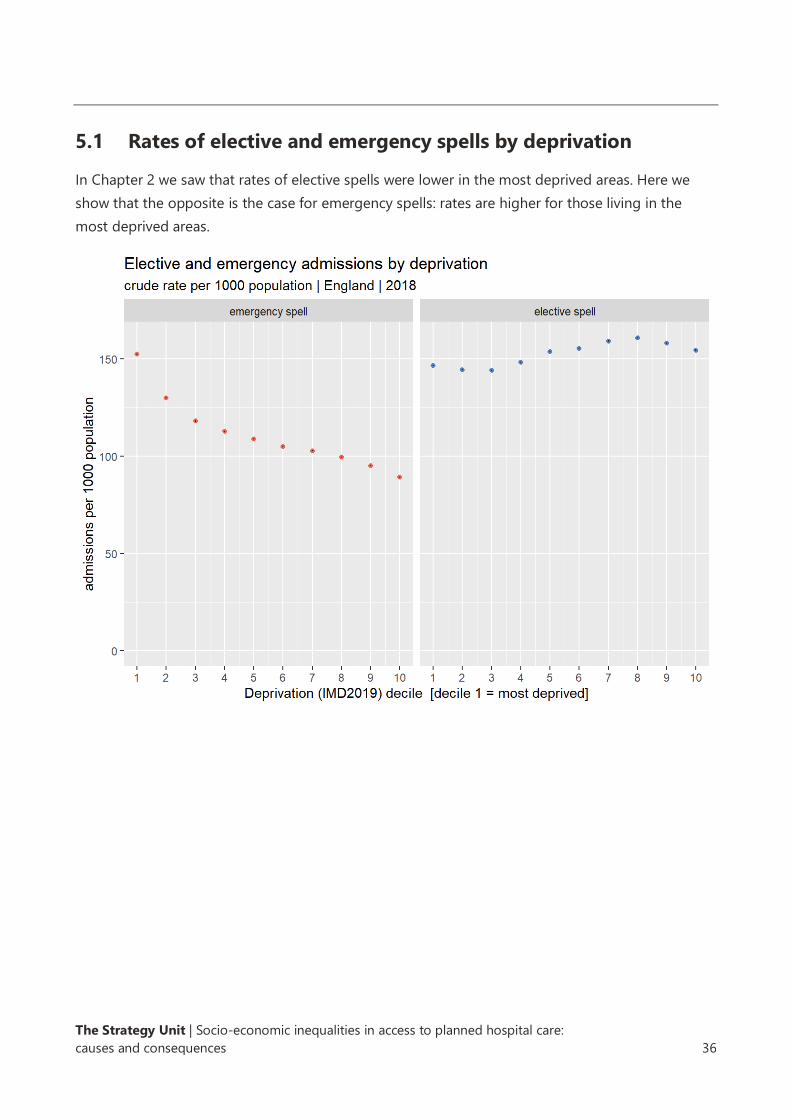
5.1 Rates of elective and emergency spells by deprivation
In Chapter 2 we saw that rates of elective spells were lower in the most deprived areas. Here we
show that the opposite is the case for emergency spells: rates are higher for those living in the
most deprived areas.

The Strategy Unit | Socio-economic inequalities in access to planned hospital care:
causes and consequences 37
https://csucloudservices-my.sharepoint.com/personal/rachel_caswell_mlcsu_nhs_uk/Documents/Documents/DSU/DSU project -/socio-
economic inequalities in access to planned hospital care - 210513 with adjusted hyperlinks.docx
5.2 Change in rates of elective and emergency spells by
deprivation
After adjusting for changes in the population structure, we can see there have been greater
increases in the rates of elective spells in the least deprived areas, while the greatest growth in
rates of emergency spells has taken place among populations living in the most deprived areas.

The Strategy Unit | Socio-economic inequalities in access to planned hospital care:
causes and consequences 38
https://csucloudservices-my.sharepoint.com/personal/rachel_caswell_mlcsu_nhs_uk/Documents/Documents/DSU/DSU project -/socio-
economic inequalities in access to planned hospital care - 210513 with adjusted hyperlinks.docx
5.3 Rates of elective and emergency spells by deprivation and
ICD10 chapter
These patterns appear to hold for many of the major ICD10 chapters - higher elective spell rates in
the least deprived areas and higher emergency spell rates in the most deprived areas.
The Strategy Unit | Socio-economic inequalities in access to planned hospital care:
causes and consequences 39
https://csucloudservices-my.sharepoint.com/personal/rachel_caswell_mlcsu_nhs_uk/Documents/Documents/DSU/DSU project -/socio-
economic inequalities in access to planned hospital care - 210513 with adjusted hyperlinks.docx
5.4 Rates of emergency spells before and after an elective spell
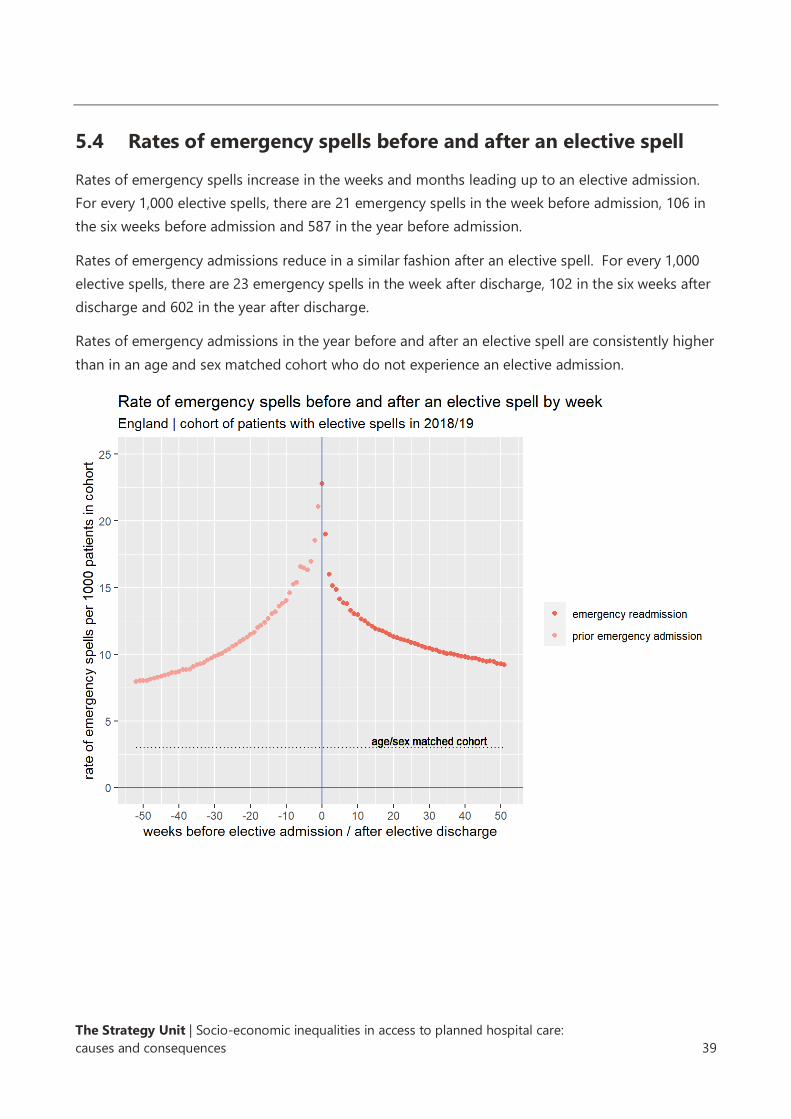
Rates of emergency spells increase in the weeks and months leading up to an elective admission.
For every 1,000 elective spells, there are 21 emergency spells in the week before admission, 106 in
the six weeks before admission and 587 in the year before admission.
Rates of emergency admissions reduce in a similar fashion after an elective spell. For every 1,000
elective spells, there are 23 emergency spells in the week after discharge, 102 in the six weeks after
discharge and 602 in the year after discharge.
Rates of emergency admissions in the year before and after an elective spell are consistently higher
than in an age and sex matched cohort who do not experience an elective admission.

The Strategy Unit | Socio-economic inequalities in access to planned hospital care:
causes and consequences 40
https://csucloudservices-my.sharepoint.com/personal/rachel_caswell_mlcsu_nhs_uk/Documents/Documents/DSU/DSU project -/socio-
economic inequalities in access to planned hospital care - 210513 with adjusted hyperlinks.docx
5.5 Rates of emergency spells before and after an elective spell by
deprivation
Rates of emergency spells are higher in the six weeks before and after an elective spell for those
patients living in the most deprived areas.
Rates of emergency spells are marginally higher in the six weeks before an elective spell than in the
six weeks post discharge, and the differential is greatest for patients living in the most deprived
areas.

The Strategy Unit | Socio-economic inequalities in access to planned hospital care:
causes and consequences 41
https://csucloudservices-my.sharepoint.com/personal/rachel_caswell_mlcsu_nhs_uk/Documents/Documents/DSU/DSU project -/socio-
economic inequalities in access to planned hospital care - 210513 with adjusted hyperlinks.docx
5.6 Modelling the impact of elective activity on emergency
activity
The information above provides circumstantial evidence in support of a negative causal
relationship between rates of planned and unplanned hospital spells. In particular:
• There is an inverse relationship between levels of planned and emergency spells across
levels of deprivation.
• There have been larger increases in elective care in the least deprived areas, and smaller
increases in emergency spells.
• Rates of emergency spells increase before an elective admission and then decline.
• Higher rates of prior emergency admissions and readmissions are seen in the most
deprived areas.
We now formally test this potential causal relationship using a statistical method known as panel
data regression.
Levels of unplanned care are likely linked with many factors. One of the key challenges in
establishing the presence and scale of a causal relationship between planned and unplanned
hospital spells relates to our ability to fully control for other factors that might generate unplanned
hospital spells. We might speculate, for example, that levels of unplanned spells increase with the
number of older people, and it may be possible to control for this factor using available data. But
other factors - communicable disease outbreaks, economic circumstances, environmental
conditions the availability of formal and informal care - are more difficult to pin down. Even if we
were able to source reliable data on these factors, we could not be confident that we had
controlled for all such factors. In any resulting analysis, we could not be confident that the
measured relationship between planned and unplanned spells was not contaminated by the effect
of these unobserved factors. Panel data regression offers a potential solution to this challenge.
Information about the methods we have used is set out in Appendix D.
Our model suggests that increases in elective spells within a population lead to a reduction in the
number of emergency spells, all other things being equal. A substantial part of this effect is felt in
the first quarter after the increase in elective spells, but the effect continues to accumulate for
some time afterwards. After two years, the full effects have been felt. By this time, our model
estimates that for every 10 additional elective spells, one emergency spell is avoided.
While there is a clear moral justification for ensuring equal access to planned hospital care, our
model suggests there may be secondary benefits. If equalising access to planned hospital care
requires additional planned care activity and expenditure, then some of this expenditure will be
offset by reductions in the costs associated with emergency spells. On average, emergency spells

The Strategy Unit | Socio-economic inequalities in access to planned hospital care:
causes and consequences 42
https://csucloudservices-my.sharepoint.com/personal/rachel_caswell_mlcsu_nhs_uk/Documents/Documents/DSU/DSU project -/socio-
economic inequalities in access to planned hospital care - 210513 with adjusted hyperlinks.docx
are 25% more expensive than elective spells. The beds required to accommodate the additional
elective patients will also be offset by reductions in beds occupied by emergency patients. On
average, emergency spells consume overnight bed days at more than seven times the rate of
elective spells. Finally, reducing the number of emergency spells will also reduce the number of
attendances at emergency departments, freeing up this most pressured part of the healthcare
system.
Our model also suggests there may be a relationship between levels of outpatient attendances and
emergency spells, but this effect is so small and uncertain that it can reasonably be ignored.

The Strategy Unit | Socio-economic inequalities in access to planned hospital care:
causes and consequences 43
https://csucloudservices-my.sharepoint.com/personal/rachel_caswell_mlcsu_nhs_uk/Documents/Documents/DSU/DSU project -/socio-
economic inequalities in access to planned hospital care - 210513 with adjusted hyperlinks.docx
5.7 Equalising access to elective care
Having established and quantified the causal relationship, we can estimate the impact on
emergency spells of increasing the number of elective spells so that all socio-economic groups
have equal rates of access. Note that this ‘levelling-up’ approach to equalising access to planned
care is only one of many such strategies; alternative approaches might involve ‘levelling down’ and
‘(zero-sum) activity redistribution’. Choices between these strategies will rest on moral arguments,
economic constraints, and beliefs about present levels of over-supply or unmet need.
We estimate that the number of elective spells would need to increase by 9.7% in order to ensure
that the rate of elective spells in each deprivation quintile was equal to the rate in the quintile with
the highest rate within each STP.
Our model suggests that delivering this ‘levelled-up’ scenario in the Midlands for a sustained
period would result in the rate of emergency admissions being cut by 1.3% per year. The level of
inequality in rates of emergency spells would also be reduced.

The Strategy Unit | Socio-economic inequalities in access to planned hospital care:
causes and consequences 44
https://csucloudservices-my.sharepoint.com/personal/rachel_caswell_mlcsu_nhs_uk/Documents/Documents/DSU/DSU project -/socio-
economic inequalities in access to planned hospital care - 210513 with adjusted hyperlinks.docx
The scale of these effects varies by STP. In the Midlands, the Black Country & West Birmingham
and Coventry & Warwickshire STPs would see the greatest benefits, with more modest effects seen
in the Herefordshire & Worcestershire and Lincolnshire STPs.
In this chapter we set out to explore one of the many possible consequences of unequal access to
planned care. Our analysis represents compelling evidence to support the theory that increasing
access to elective care for those in the most deprived areas would lead to reductions in demand for
emergency care.
The Strategy Unit | Socio-economic inequalities in access to planned hospital care:
causes and consequences 45
https://csucloudservices-my.sharepoint.com/personal/rachel_caswell_mlcsu_nhs_uk/Documents/Documents/DSU/DSU project -/socio-
economic inequalities in access to planned hospital care - 210513 with adjusted hyperlinks.docx
In this report we have provided evidence of inequalities and inequities in access to planned
hospital care. These effects are significant and widespread. Our pathway analysis suggests that
these inequities emerge late in the care pathway, and we highlight as potential causes policies to
improve and control access to planned hospital treatments. These inequities have implications
beyond the planned care system. It appears that poor access to planned care plays a part in
generating demand in the unplanned care system. Increasing access to elective care for those in
the most deprived areas is likely to lead to reductions in emergency care overall and to fewer
inequalities in the levels of emergency care.
The report builds on earlier research, advancing our understanding in some key areas. Although
further analysis may certainly add benefit, this report is sufficient to support some immediate and
targeted actions. The report suggests there may be value in reviewing the policies and procedures
that seek to improve or control access to elective care and the process by which decisions about
treatment are taken, ensuring these processes do not inadvertently disadvantage people living in
the most deprived areas.
Deciding whether and how to act on this evidence will require sound reasoning and careful
consensus-building within local health systems. We look forward to working with the network of
Decision Support Units in the Midlands to improve the outcomes for people living in the most
deprived parts of the region.
6. Conclusions

The Strategy Unit | Socio-economic inequalities in access to planned hospital care:
causes and consequences 46
https://csucloudservices-my.sharepoint.com/personal/rachel_caswell_mlcsu_nhs_uk/Documents/Documents/DSU/DSU project -/socio-
economic inequalities in access to planned hospital care - 210513 with adjusted hyperlinks.docx
Adjusting for need is not straightforward. It relies on robust estimates of the level and distribution
of a disease within a population. These are usually derived from prevalence (or incidence) studies
or from database studies. Prevalence and incidence studies are complex, time-consuming field
exercises involving interviews and assessments of a carefully designed sample of the population.
Practicalities and resource constraints mean that estimates derived from these studies are subject
to both conceptual and statistical uncertainty. Database studies use anonymised data collected as
part of routine clinical practice. Although less expensive, database studies are at greater risk of
bias arising from the clinical or recording practices that generated the data.
Analysts and researchers often want to draw conclusions about the level of need within a
population of interest based on the results of prevalence or database studies that were conducted
on other populations. These synthetic estimates are calculated by applying the prevalence rate of a
condition within each stratum of the study population to the same stratum in the population of
interest. Strata may be defined by several variables, such as age, sex, deprivation, comorbidities, or
lifestyle risk factors. The more granular the stratification, the more confident one can be in the
synthesised prevalence estimate in the population of interest.
Table 3 sets out the sources of need data that we have used for each of the four conditions
considered in the report.
Appendix A: Adjusting for need

The Strategy Unit | Socio-economic inequalities in access to planned hospital care:
causes and consequences 47
https://csucloudservices-my.sharepoint.com/personal/rachel_caswell_mlcsu_nhs_uk/Documents/Documents/DSU/DSU project -/socio-
economic inequalities in access to planned hospital care - 210513 with adjusted hyperlinks.docx
Table 3: Need data used to make equity assessments
COPD Heart failure Arthritis (hip) Cataracts
Source of
need
estimates
PHE and Imperial
College estimates
produced for
Fingertips 2015
PHE and Imperial
College estimates
produced for
Fingertips 2015
Versus arthritis
produced by
Imperial College
2018
National eye
health
epidemiological
model
Methods
used to
derive
need
estimates
Synthetic
estimates at GP
level (2015). Final
model variables
included sex, age,
smoking status &
deprivation
Synthetic
estimates at GP
level. Final model
variables included
age, sex, ethnicity,
BMI, smoking
status, CHD,
hypertension,
diabetes, atrial
fibrillation &
alcohol
consumption
Synthetic
estimates at
MSOA level. Final
model variables
included age, sex,
BMI, smoking
status, SES &
activity levels
Age specific
prevalence
estimates based
on a population-
based clinical
survey (conducted
in 1999)
identifying those
with cataracts and
dissatisfaction
with vision. Age-
specific rates
applied to GP
patient lists. No
adjustment made
to account for
potential
differences in
need due to
deprivation.
The units of analysis in this chapter are GP practices, because we are able to estimate the levels of
both healthcare activity and need at this level. For each GP practice we estimated levels of
deprivation by taking the mean of the deprivation scores from the lower super output areas
(LSOAs) where the GP’s registrants live, weighted by the number of registrants in each LSOA. GP
practices were then assigned to 10 equally sized groups (deciles) based on these mean weighted
deprivation scores.

The Strategy Unit | Socio-economic inequalities in access to planned hospital care:
causes and consequences 48
https://csucloudservices-my.sharepoint.com/personal/rachel_caswell_mlcsu_nhs_uk/Documents/Documents/DSU/DSU project -/socio-
economic inequalities in access to planned hospital care - 210513 with adjusted hyperlinks.docx
Hip arthritis Metric Data source Year Definition and selection criteria/codes Assessment of
fit of metric to pathway
Rheumatoid arthritis register
QOF dataset (NHS Digital)
2019/20 Number of patients on QOF RA register poor
Patients with a face-to-face review for rheumatoid arthritis
QOF dataset (NHS Digital)
2019/20 The number of patients with rheumatoid arthritis, on the register, who have had a face-to-face review in the preceding 12 months
poor
Physio referral M&L CSU held ERS data
2019/20 All referrals recorded on ERS dataset where specialty code = 9909 (physiotherapy)
poor
Outpatient referral M&L CSU held ERS data
2019/20 OP referrals recorded on ERS dataset to T&O specialty where clinic type = HIP
good
OP 1st attendance M&L CSU held HES outpatient dataset
2018/19 OP 1st attendances where treatment specialty = 111 (Orthopaedic) or 110 (T&O)
close
Steroid injections M&L CSU held HES outpatient dataset
2018/19 OP procedures during appointments under treatment specialty 111 (Orthopaedic) or 110 (T&O) for selected OPCS codes W903, W904, X382
poor
Joint replacement M&L CSU held HES inpatient dataset
2018/19 Hip replacement elective episodes where - opetn_01 to opertn_24 in 'W371', 'W378', 'W379', 'W381', 'W388', 'W389', 'W391', 'W398', 'W399','W461', 'W468', 'W469', 'W471', 'W478', 'W479', 'W481', 'W488', 'W489','W931', 'W938', 'W939', 'W941', 'W948', 'W949', 'W951', 'W958', 'W959', or opetn_01 to opertn_24 in ('W521', 'W528', 'W529', 'W531', 'W538', 'W539', 'W541', 'W548', 'W549' &opetn_01 to opertn_24 in('Z761', 'Z756', 'Z843')
good
Joint replacement revisions
M&L CSU held HES inpatient dataset
2018/19 Hip revision elective episodes where - opetn_01 to opertn_24 in 'W370', 'W372', 'W373', 'W374', 'W380', 'W382', 'W383', 'W384', 'W390', 'W392', 'W393', 'W394', 'W395', 'W396','W460', 'W462', 'W463', 'W470', 'W472', 'W473', 'W480', 'W482', 'W483', 'W484', 'W485','W930', 'W932', 'W933', 'W940', 'W942', 'W943', 'W950', 'W952', 'W953', 'W954' or opetn_01 to opertn_24 in ('W521', 'W528', 'W529', 'W531', 'W538', 'W539', 'W541', 'W548', 'W549' &opetn_01 to opertn_24 in('Z761', 'Z756', 'Z843')
good
Appendix B: Pathway metrics
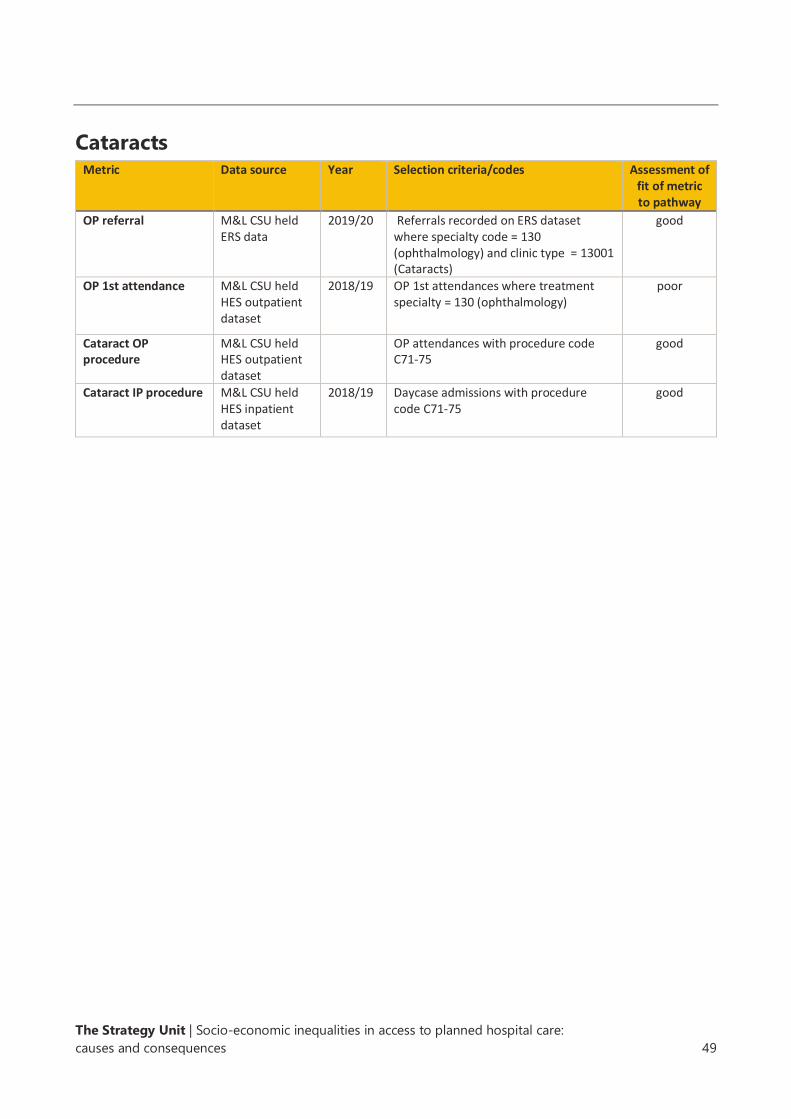
The Strategy Unit | Socio-economic inequalities in access to planned hospital care:
causes and consequences 49
https://csucloudservices-my.sharepoint.com/personal/rachel_caswell_mlcsu_nhs_uk/Documents/Documents/DSU/DSU project -/socio-
economic inequalities in access to planned hospital care - 210513 with adjusted hyperlinks.docx
Cataracts
Metric Data source Year Selection criteria/codes Assessment of fit of metric to pathway
OP referral M&L CSU held ERS data
2019/20 Referrals recorded on ERS dataset where specialty code = 130 (ophthalmology) and clinic type = 13001 (Cataracts)
good
OP 1st attendance M&L CSU held HES outpatient dataset
2018/19 OP 1st attendances where treatment specialty = 130 (ophthalmology)
poor
Cataract OP procedure
M&L CSU held HES outpatient dataset
OP attendances with procedure code C71-75
good
Cataract IP procedure M&L CSU held HES inpatient dataset
2018/19 Daycase admissions with procedure code C71-75
good

The Strategy Unit | Socio-economic inequalities in access to planned hospital care:
causes and consequences 50
https://csucloudservices-my.sharepoint.com/personal/rachel_caswell_mlcsu_nhs_uk/Documents/Documents/DSU/DSU project -/socio-
economic inequalities in access to planned hospital care - 210513 with adjusted hyperlinks.docx
COPD Metric Data source Year Selection criteria/codes Assessment of
fit of metric to pathway
COPD register QOF dataset (NHS Digital)
2019/20 Number of patients on QOF COPD register
good
Flu vaccinations QOF dataset (NHS Digital)
2019/20 Number of people with COPD who have had a flu vaccination during preceding 12 months
good
Annual reviews QOF dataset (NHS Digital)
2019/20 Number of people with COPD who have had a review during the preceding 12 months
good
Inhalers - short acting bronchodilators
English prescribing dataset - Source Openprescribing.net
2019/20 Items prescribed of Salbutamol, Ipratropium Bromide,Bricanyl, Terbutaline, (inhaler products only)
close
Steroid inhalers if above fail to work
English prescribing dataset - Source Openprescribing.net
2019/20 Items prescribed of beclometasone dipropionate, formoterol with budesonide (selected licensed products), formoterol with beclomethasone (selected licensed products)
close
Steroid tablets: short course for bad flareups
English prescribing dataset - Source Openprescribing.net
2019/20 Items prescribed of Prednisolone close
Pulmonary rehab: exercise and education programme - delivered by nurses, physios and dieticians
QOF dataset (NHS Digital)
Number of patients with COPD and Medical Research Council (MRC) dyspnoea scale ≥3 at any time in the preceding 12 months, with a subsequent record of an offer of referral to a pulmonary rehabilitation programme.
good
OP referral M&L CSU held ERS data
Referrals recorded on ERS dataset where specialty code = 340 (respiratory medicine)
poor
OP 1st attendance M&L CSU held HES outpatient dataset
OP 1st attendances where treatment specialty = 340 (respiratory medicine)
poor
Surgery: lung volume reduction,
M&L CSU held HES inpatient dataset
Elective episodes where opertn_01 to opertn_24 in E541, E542, E543,E544,E545,E546,E547,E548,E548
good

The Strategy Unit | Socio-economic inequalities in access to planned hospital care:
causes and consequences 51
https://csucloudservices-my.sharepoint.com/personal/rachel_caswell_mlcsu_nhs_uk/Documents/Documents/DSU/DSU project -/socio-
economic inequalities in access to planned hospital care - 210513 with adjusted hyperlinks.docx
Heart failure Metric Data source Year Selection criteria/codes Assessment of
fit of metric to pathway
HF QOF register QOF dataset (NHS Digital)
2019/20 Number of patients on HF register good
ECG confirmed QOF dataset (NHS Digital)
2019/20 Number of patients who have had HF diagnosis confirmed by ECG or specialist
good
Cardiology OP referral M&L CSU held ERS data
All referrals recorded on ERS dataset where specialty code = 320 cardiology
poor
Cardiology OP 1st attendance
M&L CSU held Outpatient data
OP 1st attendances where treatment specialty = 320 cardiology
poor
ACE inhibitors English prescribing dataset - Source Openprescribing.net
2019/20 Items prescribed of captopril,enalapril meleate, fosinpril,lisinopril,perindorpil erbumine, quinapril hydrochloride, ramipril
good
ARBs English prescribing dataset - Source Openprescribing.net
2019/20 Items prescribed of Candesartan cilxetil losartan potassium, valsartan
good
Beta blocker English prescribing dataset - Source Openprescribing.net
2019/20 Items prescribed of Bisoprolol Fumarate, Carvedilol, Nebivolol
good
Sacubitril English prescribing dataset - Source Openprescribing.net
2019/20 Items prescribed of Sacubitril/Valsartan good
Digoxin (lanoxin) English prescribing dataset - Source Openprescribing.net
2019/20 Items prescribed of digoxin good
Pacemakers M&L CSU held HES inpatient dataset
Elective and non-elective episodes where opertn_01 to opertn_24 in ('K601', 'K605', 'K606', 'K607', 'K608', 'K609','K611', 'K615', 'K616', 'K617', 'K618', 'K619') or
good
Valve repair/replacement
M&L CSU held HES inpatient dataset
Elective and non-elective episodes where opertn_01 to opertn_24 in ('K29', 'K31', 'K32', 'K33', 'K34', 'K35','K36')
good

The Strategy Unit | Socio-economic inequalities in access to planned hospital care:
causes and consequences 52
https://csucloudservices-my.sharepoint.com/personal/rachel_caswell_mlcsu_nhs_uk/Documents/Documents/DSU/DSU project -/socio-
economic inequalities in access to planned hospital care - 210513 with adjusted hyperlinks.docx
Heart failure
Identification
Primary care management
Primary care prescribing
Referral to secondary care
Appendix C: Additional pathway charts
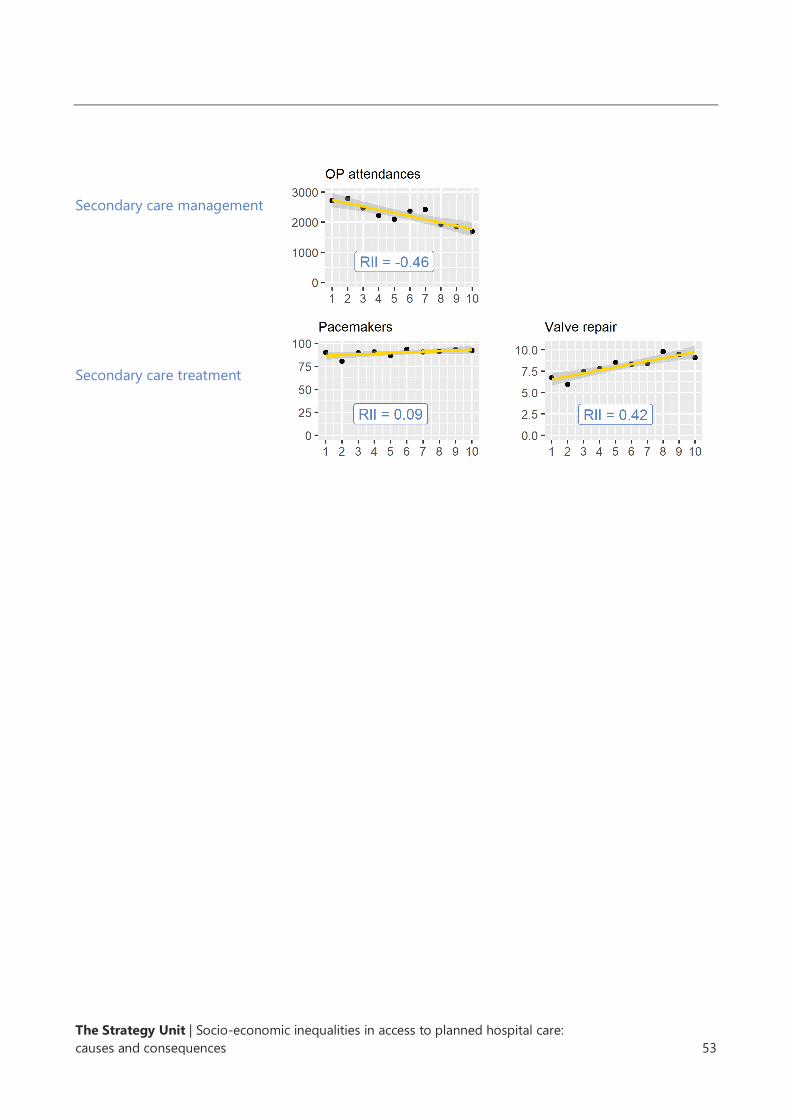
The Strategy Unit | Socio-economic inequalities in access to planned hospital care:
causes and consequences 53
https://csucloudservices-my.sharepoint.com/personal/rachel_caswell_mlcsu_nhs_uk/Documents/Documents/DSU/DSU project -/socio-
economic inequalities in access to planned hospital care - 210513 with adjusted hyperlinks.docx
Secondary care management
Secondary care treatment
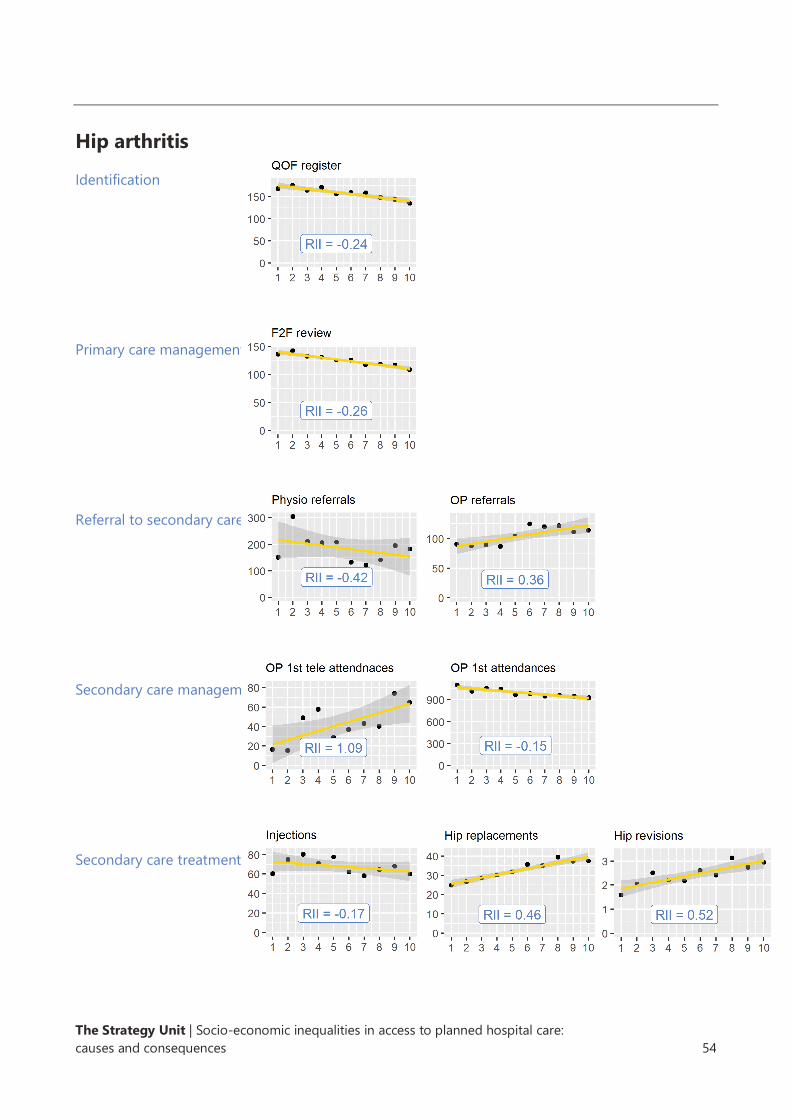
The Strategy Unit | Socio-economic inequalities in access to planned hospital care:
causes and consequences 54
https://csucloudservices-my.sharepoint.com/personal/rachel_caswell_mlcsu_nhs_uk/Documents/Documents/DSU/DSU project -/socio-
economic inequalities in access to planned hospital care - 210513 with adjusted hyperlinks.docx
Hip arthritis
Identification
Primary care management
Referral to secondary care
Secondary care management
Secondary care treatment

The Strategy Unit | Socio-economic inequalities in access to planned hospital care:
causes and consequences 55
https://csucloudservices-my.sharepoint.com/personal/rachel_caswell_mlcsu_nhs_uk/Documents/Documents/DSU/DSU project -/socio-
economic inequalities in access to planned hospital care - 210513 with adjusted hyperlinks.docx
Cataracts
Referral to secondary care
Secondary care management
Secondary care treatment
The Strategy Unit | Socio-economic inequalities in access to planned hospital care:
causes and consequences 56
https://csucloudservices-my.sharepoint.com/personal/rachel_caswell_mlcsu_nhs_uk/Documents/Documents/DSU/DSU project -/socio-
economic inequalities in access to planned hospital care - 210513 with adjusted hyperlinks.docx
Panel data contains information measured at several time points and for several subjects of
observation. In this case, our panel data includes information by quarter between the second
quarter of 2004 and the fourth quarter of 2018, for each of the resident populations of 135 clinical
commissioning groups.
Panel data regression attempts to measure the strength of a relationship between an outcome
variable (in our case the number of unplanned admissions) and variables of interest (rates of
planned admissions and outpatient attendances), having controlled for several other variables (the
size of the population, the number of deaths, and the proportion of the population who are
women, aged under 20, or aged over 65, 75 and 85 years). Given that we might expect the impact
of levels of unplanned care to be delayed, we also include lagged versions of our variables of
interest. The key assumption in this panel data model is that factors not included in the model,
which differentially influence the number of unplanned hospital spells between CCGs, do not vary
substantially between CCGs over time. In other words, we assume that aside from population size,
age-sex structure and deaths, all other factors that influence the number of unplanned admissions
in a CCG rise and fall reasonably consistently across CCGs over time. Whilst this is not
unreasonable, we should note that any substantial variation from this assumption will affect the
reliability of our results.
There are several forms of panel data regression model. We used several established statistical
tests to select between these model forms. The LaGrange multiplier test, the F test and the
Hausman test were used to determine that a fixed effects model outperformed random effects and
pooled effects models.
The charts below show the individual and cumulative lagged effects of elective spells and
outpatient attendances on rates of emergency spells.
Appendix D: Methods used to explore the
relationship between elective and
emergency spells

The Strategy Unit | Socio-economic inequalities in access to planned hospital care:
causes and consequences 57
https://csucloudservices-my.sharepoint.com/personal/rachel_caswell_mlcsu_nhs_uk/Documents/Documents/DSU/DSU project -/socio-
economic inequalities in access to planned hospital care - 210513 with adjusted hyperlinks.docx

The Strategy Unit | Socio-economic inequalities in access to planned hospital care:
causes and consequences 58
https://csucloudservices-my.sharepoint.com/personal/rachel_caswell_mlcsu_nhs_uk/Documents/Documents/DSU/DSU project -/socio-
economic inequalities in access to planned hospital care - 210513 with adjusted hyperlinks.docx
Alongside this report we provide a series of supplementary files, for each substantive chapter in the
report (Chapters 2, 3, 4 and 5). These take the form of r-markdown files containing information
about the sources of data used, the analysis carried out and the graphical outputs produced.
The data was assembled using Transact-SQL and the analysis conducted using R and selected R
libraries.
The files are provided to allow other analysts to check, reproduce and improve upon our analysis.
The files can be found at the following website - https://github.com/The-Strategy-
Unit/753_Inequalities_Planned_Hospital_Care
We welcome feedback from our fellow analysts on our approaches and methods.
Appendix E: Data sources and analytical
methods

The Strategy Unit
Tel: 0121 612 1538
Email: [email protected]
Web: www.strategyunitwm.nhs.uk
Twitter: @strategy_unit