factors related to nest survival and over-winter survival of a
TRANSCRIPT

University of Tennessee, KnoxvilleTrace: Tennessee Research and CreativeExchange
Masters Theses Graduate School
12-2011
Factors Related to Nest Survival and Over-winterSurvival of a Northern Bobwhite (Colinusvirginianus) Population in Southwest FloridaSteven Kenneth [email protected]
This Thesis is brought to you for free and open access by the Graduate School at Trace: Tennessee Research and Creative Exchange. It has beenaccepted for inclusion in Masters Theses by an authorized administrator of Trace: Tennessee Research and Creative Exchange. For more information,please contact [email protected].
Recommended CitationBrinkley, Steven Kenneth, "Factors Related to Nest Survival and Over-winter Survival of a Northern Bobwhite (Colinus virginianus)Population in Southwest Florida. " Master's Thesis, University of Tennessee, 2011.https://trace.tennessee.edu/utk_gradthes/1059

To the Graduate Council:
I am submitting herewith a thesis written by Steven Kenneth Brinkley entitled "Factors Related to NestSurvival and Over-winter Survival of a Northern Bobwhite (Colinus virginianus) Population in SouthwestFlorida." I have examined the final electronic copy of this thesis for form and content and recommendthat it be accepted in partial fulfillment of the requirements for the degree of Master of Science, with amajor in Wildlife and Fisheries Science.
David A. Buehler, Major Professor
We have read this thesis and recommend its acceptance:
Joseph D. Clark, Arnold M. Saxton
Accepted for the Council:Carolyn R. Hodges
Vice Provost and Dean of the Graduate School
(Original signatures are on file with official student records.)

Factors Related to Nest Survival and Over-winter Survival of a Northern Bobwhite
(Colinus virginianus) Population in Southwest Florida
A Thesis Presented for the
Master of Science Degree
The University of Tennessee, Knoxville
Steven Kenneth Brinkley
December 2011

ii
DEDICATION
This work is dedicated to the memory of my grandparents William and Virginia
Hamilton and Hayden and Ernestine Phebus. Growing up and spending time with them
on their farms initiated my love of nature. I would also like to dedicate this work to the
memory of my friend George R. Mayfield, who taught me most everything I know about
the wondrous world of birds.
iii
AKNOWLEDGEMENTS
I could literally write a book acknowledging all the wonderful people who helped
get me to this point, but in the interest of time and space I must exclude some. Even
though your name may not show up on this document, you know who you are and how
much I appreciate all you have done for me.
This study would not have been possible without funding from the Florida Fish
and Wildlife Conservation Commission (FWC) and support from the University of
Tennessee Department of Forestry, Wildlife and Fisheries. For several years of advice
and support, I would specifically like to thank the FWC staff at Babcock-Webb WMA:
Mike Kemmerer, Cason Pope, Josh Birchfield, Frank Lewis, John Barlow, Rob Hawsey,
Paul and Pam Jones, Joan Gordon, and all the others that helped out along the way. I
would also like to thank Nick Wiley, Chuck McKelvy, Tommy Hines, Jeff McGrady, and
Lee Taylor of the FWC for their support and efforts keeping the study funded for seven
years.
Thanks to all those who worked tirelessly on the quail study over the years
tracking down quail and collecting data: Doug Holt, Jeff Sloan, Jason Scott, Mike Green
and Chris Jones. Special thanks to the master quail trapper Jerry Coker without whom
our sample size would have been much smaller. The Southwest Florida Flatwoods Quail
Forever Chapter members and other local quail hunters volunteered countless hours
helping with covey call counts and cast netting quail.
Thanks so much to my major professor Dr. David Buehler for taking me on as yet
another graduate student and helping me sort my way through graduate school financially
and mentally. Thanks to my other committee members Dr. Joe Clark and Dr. Arnold
Saxton for your excellent classes and guidance through analysis of a monster dataset. My
final committee member Dr. Ralph Dimmick was my project leader on the quail study.
Doc, I will never be able to thank you enough for hiring me, believing in me throughout
the entire study, and being an excellent friend. Your knowledge and guidance is greatly
appreciated.
I would like to thank Billy Minser for also being a great friend and telling me that
I should apply for a great job studying quail in Florida. I was very lucky to have Than

iv
Boves, Emily Hockman, Chris Lituma, and Katie Percey as lab mates and friends for my
entire grad school experience. I appreciate all your input, suggestions, and advice along
the way. I am proud to know that you and all my other fellow graduate student friends at
UT will be my colleagues as wildlife professionals.
A special thanks to my parents Ken and Sue Brinkley; my sister Kendra Scott and
her family, John, Jack, and Kate; and my brother Keith Brinkley and his family, Lauren
and Charlie, for all your love and support in pursuit of my dreams.
Lastly, my most important thank you is for my lovely wife, Amy. She followed
me from beautiful northwest Montana to also beautiful but less forgiving southwest
Florida. Amy worked right beside me in the bug infested mugginess of my study site and
loved it as much as I did. She has also worked hard to help fund my way through
graduate school. Amy, I love you and can’t imagine my life without you.

v
ABSTRACT
The northern bobwhite (Colinus virginianus) is a gallinaceous upland game bird
dependent on early successional grassland habitat for reproduction and survival.
Bobwhite populations have been declining range-wide for nearly a half century. The
habitat of Babcock-Webb Wildlife Management Area (BWWMA) in southwest Florida is
mostly virgin, early successional grassland and pine flatwoods. Although BWWMA is
located in the far southern end of the bobwhite range, the area is a popular public land for
bobwhite hunting. The BWWMA bobwhite population has declined evidenced by a
dramatic decrease in harvest over the last 20 years. The two objectives of my research
were to (1) describe nest habitat selection and daily nest survival of the bobwhite
population on BWWMA, and (2) evaluate factors related to over-winter (1 October – 30
March) survival of the BWWMA bobwhite population. Specifically, I evaluated nest-site
habitat selection and modeled daily nest survival as a function of biologically meaningful
spatial, temporal, climatic, and habitat related covariates (Part II). I tested the hypothesis
that bobwhites selected nesting habitat at the landscape level. There was no evidence that
bobwhites selected specific habitats for nesting, but basin marsh and wet flatwoods cover
types were used for nesting slightly more than they were available. The incubation
period nest survival rate was 0.477 (SE = 0.027). Daily nest survival rates did not differ
among years, the hunting zone in which the nest was located, or between genders of the
incubating bird. Nest survival was positively related to the percent of basin marsh habitat
within a 1000-m radius of the nest. Daily nest survival declined over the nesting period.
I modeled the over-winter survival rates of bobwhites as a function of hunting pressure
and other spatial, temporal, climatic and habitat covariates (Part III). The average
over-winter survival rate was 0.402 (SE = 0.023). Year, time, and hunting zone were
important factors influencing over-winter survival. Hunting pressure was the factor most
related to over-winter survival. I evaluated management oriented questions related to
over-winter survival of bobwhites on BWWMA. Food strip management and prescribed
fire did not appear to be related to over-winter survival. Harvest rates were greater than
others reported from studies in the Southeast and results suggested that, to some extent,
harvest was additive to natural mortality. If the goal of management is to increase the

vi
BWWMA bobwhite population, reduction in harvest rate is one likely effective
management strategy for achieving that goal.

vii
TABLE OF CONTENTS
PART I: INTRODUCTION ....................................................................................1
LITERATURE CITED ............................................................................................5
PART II: NEST HABITAT SELECTION AND FACTORS INFLUENCING
NEST SURVIVAL OF NORTHERN BOBWHITE (Colinus virginianus) IN
SOUTHWEST FLORIDA .......................................................................................8
ABSTRACT .............................................................................................................9
INTRODUCTION ...................................................................................................9
STUDY AREA ......................................................................................................12
METHODS ............................................................................................................14
Field Methods ..................................................................................................14
Trapping .................................................................................................14
Handling and Marking ...........................................................................16
Radio Telemetry .....................................................................................16
Nest Location and Monitoring ...............................................................17
Data Analyses ..................................................................................................17
Nest Habitat Selection ............................................................................18
Daily Nest Survival ................................................................................19
RESULTS ..............................................................................................................27
Nest Habitat Selection .....................................................................................29
Daily Nest Survival..........................................................................................31
DISCUSSION ........................................................................................................37
Nest Habitat Selection .....................................................................................38
Daily Nest Survival..........................................................................................42
CONCLUSIONS....................................................................................................49
LITERATURE CITED ..........................................................................................51

viii
PART III: OVER-WINTER SURVIVAL OF A NORTHERN BOBWHITE
(Colinus virginianus) POPULATION IN SOUTHWEST FLORIDA ..................57
ABSTRACT ...........................................................................................................58
INTRODUCTION .................................................................................................58
STUDY AREA ......................................................................................................61
METHODS ............................................................................................................63
Field Methods ..................................................................................................63
Trapping .................................................................................................63
Handling and Marking ...........................................................................64
Radio Telemetry .....................................................................................65
Harvest Data Collection .........................................................................65
Data Analyses ..................................................................................................66
Over-winter Survival ..............................................................................66
Management Questions ..........................................................................73
RESULTS ..............................................................................................................76
Over-winter Survival .......................................................................................76
Management Questions ...................................................................................90
DISCUSSION ........................................................................................................97
MANAGEMENT IMPLICATIONS ...................................................................103
LITERATURE CITED ........................................................................................106
PART IV: CONCLUSIONS ...............................................................................109
LITERATURE CITED ........................................................................................112
VITA ....................................................................................................................113

ix
LIST OF TABLES
PART II
Table 2.1: Descriptions and abbreviations for the 12 habitat categories on
BWWMA in southwest Florida, 2003 – 2009. ......................................................21
Table 2.2: Description of the three preliminary model suites for daily nest
survival rate and the corresponding model notation used in later results tables. ...25
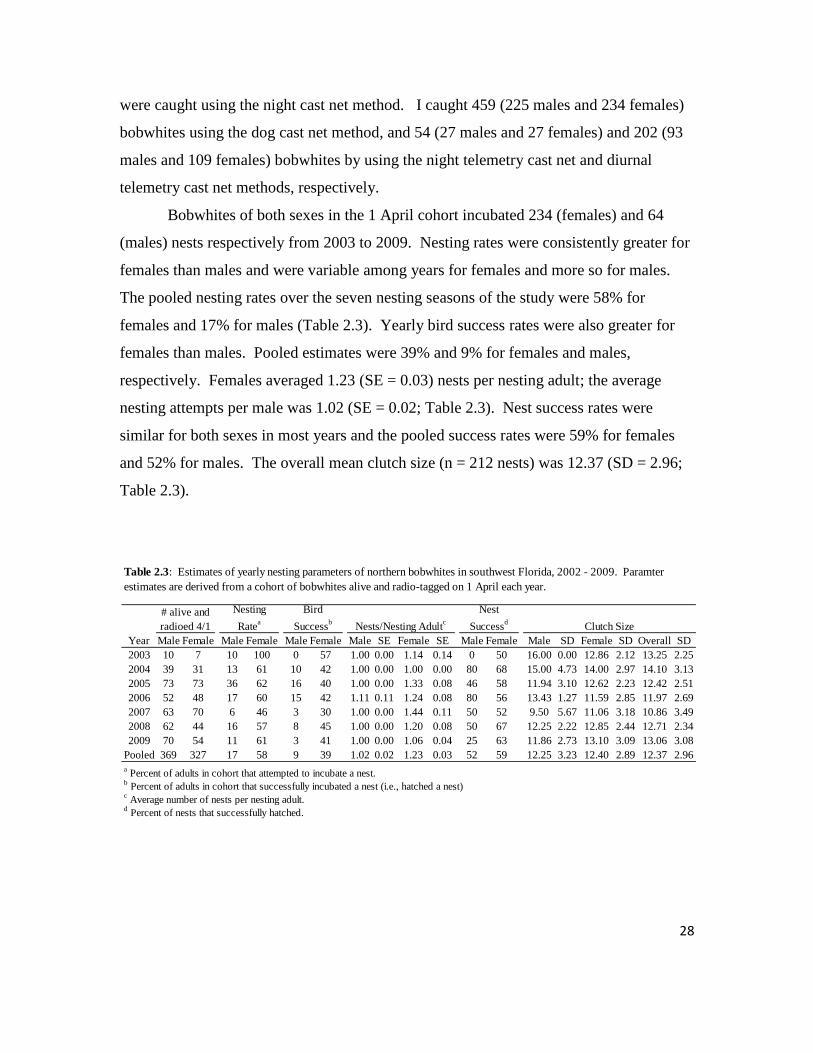
Table 2.3: Estimates of yearly nesting parameters of northern bobwhites in
southwest Florida, 2003 – 2009. ............................................................................28
Table 2.4: Total area and proportions of each habitat category available to and
used by nesting northern bobwhites in southwest Florida, 2003 – 2009. ..............30
Table 2.5: Selection of nest habitats by northern bobwhites in southwest
Florida, 2003 – 2009. .............................................................................................30
Table 2.6: Number of nests monitored and nesting periods of bobwhites in
southwest Florida, 2003 – 2009. ............................................................................32
Table 2.7: Summary of model-selection results from the first preliminary
model suite for nest survival of northern bobwhites in southwest Florida, 2003
– 2009.....................................................................................................................34
Table 2.8: Summary of model-selection results from the second preliminary
model suite for nest survival of northern bobwhites in southwest Florida, 2003
– 2009.....................................................................................................................34
Table 2.9: Summary of model-selection results from the third preliminary
model suite for nest survival of northern bobwhites in southwest Florida, 2003
– 2009.....................................................................................................................34
Table 2.10: Summary of model-selection results from the fourth model suite
for nest survival of northern bobwhites in southwest Florida, 2003 – 2009..........35
Table 2.11: Summary of model-selection results from the fifth model suite for
nest survival of northern bobwhites in southwest Florida, 2003 – 2009,
including final additive models. .............................................................................35
Table 2.12: Beta estimates and 95% confidence intervals (CI) for parameters
in the seven best models for nest survival of northern bobwhites in southwest
Florida, 2003 – 2009. .............................................................................................36
Table 2.13: Average nesting parameter estimates of northern bobwhites in
southwest Florida, 2003 – 2009, and other bobwhite populations ........................39
x
Table 2.14: General site-level nest-site habitat description for bobwhite nests
in southwest Florida, 2003 – 2009. ........................................................................41
PART III
Table 3.1: Description of the model notation in the four preliminary model
suites for the over-winter survival analysis of northern bobwhites in southwest
Florida, 2003 – 2009. .............................................................................................69
Table 3.2: Encounter period dates, lengths, and hunting for each over-winter
period of the southwest Florida bobwhite study, 2003 – 2009. .............................77
Table 3.3: Summary of model-selection results from the first model suite for
over-winter survival of northern bobwhites in southwest Florida, 2003 – 2009. ..78
Table 3.4: Parameter estimates and 95% confidence intervals for covariates in
the S(year+t+Sex+Age) model in the first model suite for bobwhite over-winter
survival in southwest Florida, 2003 – 2009. ..........................................................79
Table 3.5: Summary of model-selection results from the second model suite
for over-winter survival of northern bobwhites in southwest Florida, 2003 –
2009........................................................................................................................80
Table 3.6: Parameter estimates and 95% confidence intervals for the top three
models in the second model suite for over-winter survival of bobwhites in
southwest Florida, 2003 – 2009. ............................................................................81
Table 3.7: Summary of model-selection results from the third model suite for
over-winter survival of northern bobwhites in southwest Florida, 2003 – 2009. ..82
Table 3.8: Parameter estimates and 95% confidence intervals for the best
model in the third model suite for over-winter survival of bobwhites in
southwest Florida, 2003 – 2009. ............................................................................83
Table 3.9: Hunting zone over-winter survival estimates and 95% confidence
intervals for northern bobwhites in southwest Florida, 2003 – 2009. ...................83
Table 3.10: Summary of model-selection results from the fourth model suite
for over-winter survival of northern bobwhites in southwest Florida, 2003 –
2009........................................................................................................................84
Table 3.11: Parameter estimates and 95% confidence intervals for the three
best models in the fourth model suite for over-winter survival of bobwhites in
southwest Florida, 2003 – 2009. ............................................................................84

xi
Table 3.12: Summary of model-selection results from the fifth model suite for
over-winter survival of northern bobwhites in southwest Florida, 2003 – 2009. ..85
Table 3.13: Summary of model-selection results from the sixth model for
over-winter survival of northern bobwhites in southwest Florida, 2003 – 2009. ..87
Table 3.14: Parameter estimates and 95% confidence intervals for covariates in
the best model of the sixth model suite for bobwhite over-winter survival in
southwest Florida, 2003 – 2009. ............................................................................88
Table 3.15: Questions and answers for the six management related analyses for
northern bobwhites in southwest Florida, 2003 - 2009..........................................91
Table 3.16: Summary of model-selection results from management Question 1
relating food strips to over-winter survival of northern bobwhites in southwest
Florida, 2003 – 2009. .............................................................................................91
Table 3.17: Parameter estimates and 95% confidence intervals for the models
evaluated for Question 1 relating food strips to over-winter survival of
bobwhites in southwest Florida, 2003 – 2009. ......................................................92
Table 3.18: Summary of model-selection results from management Question 2
relating burning to over-winter survival of northern bobwhites in southwest
Florida, 2003 – 2009. .............................................................................................92
Table 3.19: Parameter estimates and 95% confidence intervals for the model
evaluated for Question 2 relating burning to over-winter survival of bobwhites
in southwest Florida, 2003 – 2009. ........................................................................92
Table 3.20: Summary of model-selection results from management Question 3
relating hunting pressure to survival of bobwhites during the regular hunting
season on BWWMA in southwest Florida, 2003 – 2009.......................................93
Table 3.21: Parameter estimates and 95% confidence intervals for the model
evaluated for Question 3 relating hunting pressure to survival of bobwhites
during the regular hunting season on BWWMA in southwest Florida, 2003 –
2009........................................................................................................................93
Table 3.22: Estimated harvest rates of northern bobwhites during the regular
hunting season on BWWMA in southwest Florida, 2003 – 2009. ........................95
Table 3.23: Estimated harvest rates of northern bobwhites during the zone F
hunting season on BWWMA in southwest Florida, 2003 – 2009. ........................95
Table 3.24: Summary of model-selection results from management Question 5
about the effects of harvest rates on over-winter survival of northern bobwhites
in southwest Florida, 2003 – 2009. ........................................................................96

xii
Table 3.25: Parameter estimates and 95% confidence intervals for the model
evaluated for Question 5 on the effects of harvest rates on over-winter survival
of northern bobwhites in southwest Florida, 2003 – 2009.....................................96
Table 3.26: Summary of model-selection results from management Question 6
about the relationship between over-winter survival and pre-hunt density the
following year of northern bobwhites in southwest Florida, 2003 – 2009. ...........97
Table 3.27: Parameter estimates and 95% confidence intervals for the model
evaluated for Question 6 on the relationship between over-winter survival and
pre-hunt density the following year of northern bobwhites in southwest Florida,
2003 - 2009 ............................................................................................................97
Table 3.28: Pre-hunt density estimates for bobwhites in each hunting zone on
BWWMA in southwest Florida, 2003 – 2009. ....................................................102
Table 3.29: Harvest rates and associated hunting pressures for bobwhite
hunting on BWWMA in southwest Florida. ........................................................105

xiii
LIST OF FIGURES
PART II
Figure 2.1: Babcock-Webb Wildlife Management Area in southwest Florida
with five hunt management zones, 2002 – 2009....................................................14
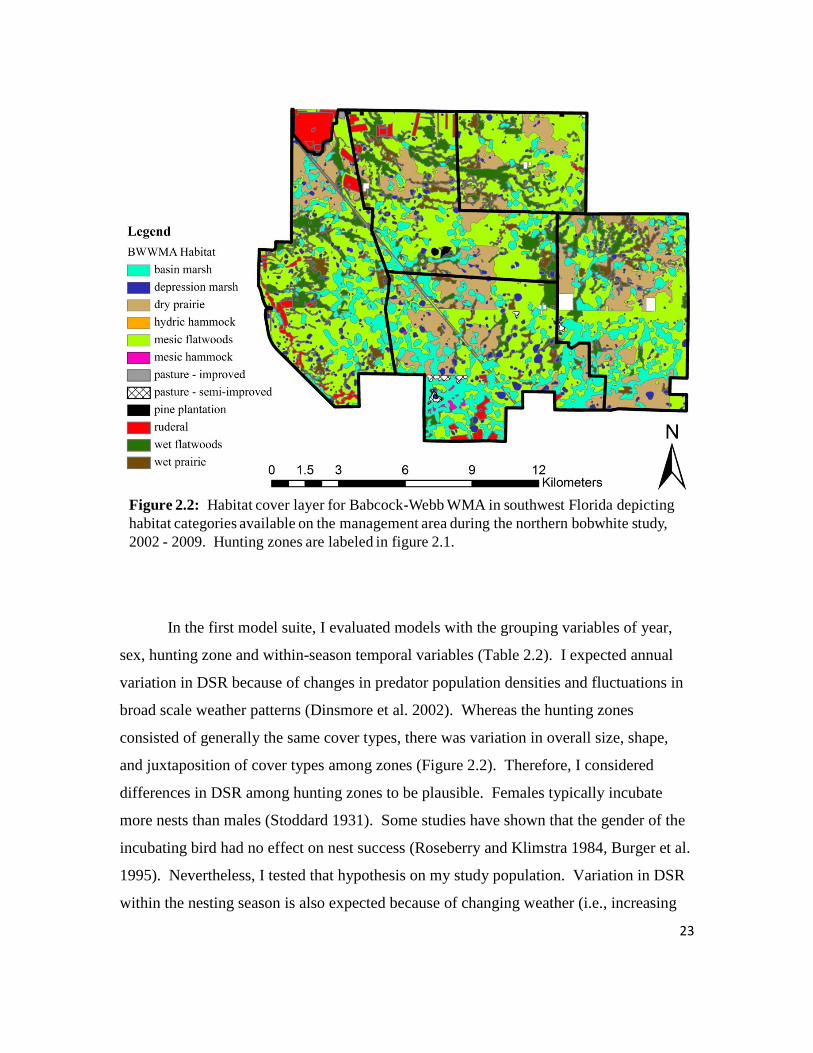
Figure 2.2: Habitat cover layer for Babcock-Webb WMA in southwest Florida
depicting habitat categories available on the management area, 2002 – 2009. .....23
Figure 2.3: Proportions of available and used cover types for nesting northern
bobwhites in southwest Florida, 2003 – 2009. ......................................................31
Figure 2.4: Daily nest survival rate trend and 95% confidence interval for the
203 interval nesting period of northern bobwhites in southwest Florida, 2003 –
2009, estimated from model averaging. .................................................................37
Figure 2.5: Typical nesting habitat of bobwhite nests on BWWMA in
southwest Florida, 2003 – 2009 .............................................................................42
Figure 2.6: Nesting incubation activity by week for the 204-day nesting period
of northern bobwhites in southwest Florida, 2003 – 2009.....................................46
Figure 2.7: Graphical depiction of the relationship between the BM1000
covariate and daily nest survival rate for bobwhites in southwest Florida, 2003
– 2009.....................................................................................................................47
PART III
Figure 3.1: Babcock-Webb Wildlife Management Area with five hunt
management zones. ................................................................................................62
Figure 3.2: Habitat cover layer for Babcock-Webb WMA in southwest Florida
depicting habitat categories during the northern bobwhite study, 2002 – 2009. ...72
Figure 3.3: Babcock-Webb Wildlife Management Area in southwest Florida
with food strips in red and five hunt management zones, 2002 – 2009.................73
Figure 3.4: Encounter period survival rate estimates and 95% confidence
intervals for each year of the northern bobwhite study in southwest Florida,
2003 – 2009............................................................................................................89
Figure 3.5: Over-winter survival rate estimates and 95% confidence intervals
for each year of the northern bobwhite study in southwest Florida, 2003 –
2009........................................................................................................................90

xiv
Figure 3.6: Relationship between total hunting pressure and harvest rate of
northern bobwhites in southwest Florida, 2003 – 2009. ........................................94
Figure 3.7: Relationship between harvest rate and over-winter survival of
northern bobwhites in southwest Florida, 2003 – 2009. ........................................96
Figure 3.8: Predicted harvest rates in relation to observed hunting pressures
and associated harvest rates during the northern bobwhite study in southwest
Florida, 2003 – 2009. ...........................................................................................103

1
PART I
INTRODUCTION

2
North American native, grassland ecosystems have diminished by an estimated
80% since the mid-1800’s (Knopf 1994, Noss et al. 1995). As a result, many grassland
bird populations have been declining for almost a half century (Brennan et al. 2005).
Only 5% of eastern grassland bird species exhibited significant population increases from
1966 – 2008 (Ziolkowski et al. 2010). The decline in populations has been attributed to
loss of habitat through afforestation, fragmentation, and deterioration (Brennan et al.
2005). Afforestation is viewed as the leading factor related to grassland habitat loss and
grassland species population declines in the eastern United States (Askins 2000).
However, urban development, monoculture farming, pasture improvement, invasive
herbaceous exotics, and fire exclusion are other major factors contributing to native
grassland deterioration and fragmentation in the eastern United States (Exum et al. 1982,
Brennan 1991, Askins 2000, Brennan et al. 2005, Perkins and Vickery 2007, Flanders et
al. 2009).
Northern bobwhite (Colinus virginianus) is a grassland bird species that has been
declining for at least the past 45 years (North American Breeding Bird Survey, Sauer et
al. 2011). Range-wide, northern bobwhite (hereafter “bobwhite”) populations declined
by 3.7% per year from 1966 to 2008 and an alarming 7.3% decrease between 2007 and
2008 (Ziolkowski et al. 2010). Significant local declines have also been reported. In
Florida, the bobwhite population declined 4.1% per year from 1980 to 2007, and a
decline of 4.9% per year has been reported in the coastal flatwoods region during the
same time period (Sauer et al. 2008). The magnitude and persistence of this decline
requires research from biologists to understand the nature and consequences of the
dwindling bobwhite population. Knowledge gained from research will aide in education
of managers, landowners, and the general public, all of whom play a vital role in the
challenge of reversing the bobwhite population decline.
Bobwhites have received considerable research attention for the past 80 years
(Hernández et al. 2002). As a popular upland gamebird, bobwhites have long been a
focus of interest for hunters. Historically, bobwhites were found in scattered patches
throughout their geographic range (Klimstra 1982, Burger 2001). Forests dominated the
landscape and bobwhites existed in openings created by natural disturbances or by

3
disturbances created by Native Americans. From the mid-1800’s to the early 1900’s,
European settlers cleared the land for various purposes, and bobwhite populations
expanded throughout the Southeast (Burger 2001). Generally, bobwhite habitat consists
of early successional plant communities (Burger 2001). Early settlers created and
maintained farms by opening up small patches within large tracts of forest and provided
excellent early successional habitat renewed with each annual farming cycle.
The dominant factor in the decline of bobwhite populations seen today is the loss
of quality habitat (Brennan 1991). In the coastal plain region, extensive logging after
European settlement was followed by fire exclusion. As a result, longleaf pine (Pinus
palustris) woodlands became one of the most critically endangered ecosystems in North
America (Askins 2000). Much of the land cleared of timber was left idle with fire
excluded. This resulted in dense forests of fire-sensitive species unusable by grassland
bird species such as the bobwhite (Askins 2000). Other cleared land was converted to
farmland. Until the early 1900’s, farmers burned native pastures for cattle and
maintained the pine savanna ecosystem (Askins 2000). However, an increase in
monoculture farming reduced diversity on the landscape (Exum et al. 1982). Farms and
farm fields ever increasing in size have reduced the overgrown fence rows and small
fields important for bobwhite nesting and brood cover (Klimstra 1982).
Whereas habitat degradation and fragmentation have resulted in bobwhite
population declines, there are still large tracts of land with quality habitat. Although the
habitat quality may be suitable in these places, other factors are continuing to depress
bobwhite numbers. Bobwhite hunting is a component of over-winter mortality that may
contribute to population decline (Roseberry and Klimstra 1984, Brennan 1991, Williams
et al. 2004). Survival during the over-winter period has been identified as a key factor
related to bobwhite population change (Folk et al. 2007, Sandercock et al. 2009).
Bobwhite populations may be stable or increase only if harvest stays below a critical
threshold (Landers and Mueller 1986, Williams et al. 2004). There is also a relationship
between bobwhite population parameters (i.e., nest survival) and climatic and biological
variables (Stoddard 1931, Frye 1954, Taylor et al. 1999a, Taylor et al. 1999b, Lusk et al.
2001, Lusk et al. 2002, Staller et al. 2002, Cooper et al. 2009, Hernández et al. 2009). If

4
managers can understand the relationships between these factors and bobwhite population
parameters, more effective management may reverse local and regional population
declines.
This research was initiated to gain an understanding of factors limiting bobwhite
populations toward the southern extreme of the bobwhite’s geographic range.
Specifically, the objectives of my study on the Babcock-Webb Wildlife Management
Area were to (1) determine the factors related to nest survival of bobwhites (Part II); and
(2) determine the factors related to over-winter survival of bobwhites (Part III). I present
overall conclusions gathered from my research and analyses in Part IV. Individual Parts
II and III are written as stand-alone manuscripts for future publication.

5
LITERATURE CITED
Askins, R. A. 2000. Restoring North America's birds: lessons from landscape ecology.
Yale University Press, New Haven, Connecticut, USA.
Brennan, L. A. 1991. How can we reverse the northern bobwhite population decline?
Wildlife Society Bulletin 19:544-555.
Brennan, L. A. and W. P. Kuvlesky. 2005. Invited paper: North American grassland
birds: an unfolding conservation crisis? Journal of Wildlife Management 69:1-13.
Burger, L. W., Jr. 2001. Northern Bobwhite. Pages 122-146 in J. G. Dickson, editor.
Wildlife of Southern Forests: Habitat and Management. Hancock House
Publishers, Surrey, B.C., Canada.
Cooper, S. M., J. C. Cathey, D. L. Alford, and S. S. Sieckenius. 2009. Influence of
rainfall, type of range, and brush management on abundance of northern
bobwhites (Colinus virginianus) in southern Texas. Southwestern Naturalist
54:13-18.
Exum, J. H., R. W. Dimmick, and B. L. Deardon. 1982. Land use and bobwhite
populations in an agricultural system in west Tennessee. Pages 6-12 in F.
Schitoskey, Jr., E. C. Schitoskey, andL. G. Talent, editors. Proc. Second National
Bobwhite Quail Symp. Oklahoma State Univ., Stillwater, OK.
Flanders, A. A., W. P. Kuvlesky, D. C. Ruthven, R. E. Zaiglin, R. L. Bingham, T. E.
Fulbright, F. Hernández, L. A. Brennan, and J. H. Vega Rivera. 2009. Effects of
invasive exotic grasses on south Texas rangeland breeding birds. The Auk
123:171-182.
Folk, T., R. Holmes, and J. Grand. 2007. Variation in northern bobwhite demography
along two temporal scales. Population Ecology 49:211-219.
Frye, O. E. J. 1954. Charlotte County quail investigation. Report: Pittman-Robertson
Project Florida W-11-2.
Hernández, F., F. S. Guthery, and W. P. Kuvlesky, Jr. 2002. The legacy of bobwhite
research in south Texas. Journal of Wildlife Management 66:1-18.
Hernández, F., F. Hernández, J. A. Arredondo, F. C. Bryant, L. A. Brennan, and R. L.
Bingham. 2009. Influence of precipitation on demographics of northern
bobwhites in southern Texas. Wildlife Society Bulletin 33:1071-1079.
Klimstra, J. L. 1982. Bobwhite quail and changing land use. Pages 1-6 in F. Schitoskey,
Jr., E. C. Schitoskey, andL. G. Talent, editors. Proc. Second National Bobwhite
Quail Symp. Oklahoma State Univ., Stillwater, OK.

6
Knopf, F. L. 1994. Avain assemblages on altered grasslands. Studies in Avian Biology
15:247-257.
Landers, J. L., and B. S. Mueller. 1986. Bobwhite quail management: a habitat approach.
Miscellaneous Publication 6. Tall Timbers Research Station, Tallahassee, FL,
USA.
Lusk, J. J., F. S. Guthery, and S. J. DeMaso. 2001. Northern bobwhite (Colinus
virginianus) abundance in relation to yearly weather and long-term climate
patterns. Ecological Modelling 146:3-15.
Lusk, J. J., F. S. Guthery, R. R. George, M. J. Peterson, and S. J. DeMaso. 2002. Relative
abundance of bobwhites in relation to weather and land use. Journal of Wildlife
Management 66:1040-1051.
Noss, R. F., E. T. Laroe, and J. M. Scott. 1995. Endangered ecosystems of the United
States: a preliminary assessment of loss and degradation. Report No. 0611- R-01
(MF). National Biological Service. Washington, D.C., USA.
Perkins, D. W., and P. D. Vickery. 2007. Nest success of grassland birds in Florida dry
prairie. Southeastern Naturalist 6:283-292.
Roseberry, J. L., and W. D. Klimstra. 1984. Population ecology of the bobwhite.
Southern Illinois University Press, Carbondale, USA.
Sandercock, B. K., W. E. Jensen, C. K. Williams, and R. D. Applegate. 2009.
Demographic sensitivity of population change in northern bobwhite. Journal of
Wildlife Management 72:970-982.
Sauer, J. R., J. E. Hines, and J. Fallon. 2008. The North American Breeding Bird Survey,
results and analysis 1966-2007. Version 5.15.2008, USGS Patuxent Wildlife
Research Center, Laurel, MD.
Sauer, J. R., J. E. Hines, J. E. Fallon, K. L. Pardieck, J. D. J. Ziolkowski, and W. A. Link.
2011. The North American Breeding Bird Survey, results and analysis 1966 -
2009. Version 3.23.2011. USGS Patuxent Wildlife Research Center, Laurel, MD.
Staller, E. L., W. E. Palmer, and J. P. Carroll. 2002. Macrohabitat composition
surrounding successful and depredated northern bobwhite quail nests. Pages 61-
64 in S. J. DeMaso, J. W. P. Kuvlesky, F. Hernández, andM. E. Berger, editors.
Quail V: Proceedings of the Fifth National Quail Symposium. Texas Parks and
Wildlife Department, Austin, TX.
Stoddard, H. L. 1931. The bobwhite quail: its habits, preservation and increase. Charles
Scribner's Sons, New York, New York, USA.

7
Taylor, J. S., K. E. Church, and D. H. Rusch. 1999a. Microhabitat selection by nesting
and brood-rearing northern bobwhite in Kansas. Journal of Wildlife Management
63:686-694.
Taylor, J. S., K. E. Church, D. H. Rusch, and J. R. Cary. 1999b. Macrohabitat effects on
summer survival, movements, and clutch success of northern bobwhite in Kansas.
Journal of Wildlife Management 63:675-685.
Williams, C. K., R. S. Lutz, and R. D. Applegate. 2004. Winter survival and additive
harvest in northern bobwhite coveys in Kansas. Journal of Wildlife Management
68:94-100.
Ziolkowski, D. J., Jr, K. L. Pardieck, and J. R. Sauer. 2010. The 2003 - 2008 summary of
the North American breeding bird survey. Bird Populations 10:90-109.

8
PART II
NEST HABITAT SELECTION AND FACTORS RELATED TO NEST
SURVIVAL OF NORTHERN BOBWHITE (Colinus virginianus) IN SOUTHWEST
FLORIDA
9
ABSTRACT
I evaluated nest-habitat selection and factors related to daily nest survival of a
northern bobwhite population in southwest Florida, USA during 2003 to 2009. Of the
birds alive and radio-tagged on 1 April each nesting season (n = 327 females, n = 369
males), 58% of females and 17% of males incubated ≥1 nest, and 39% of females and 9%
of males successfully hatched ≥1 nest. Of the birds that incubated a nest, females
averaged 1.23 (SE = 0.03) nests per bird and males averaged 1.02 (SE = 0.02) nests per
bird. Nest success was 59% for females and 52% for males. Mean clutch size was 12.37
eggs (SD = 2.96). I evaluated nest-habitat selection by radio-tagged female bobwhites
monitored during the breeding season. I modeled effects of temporal, climatic, and biotic
factors on daily survival rates for bobwhite nests (n = 400) using Program MARK. Nine
broad habitat categories were used to analyze nest-habitat selection. Based on a resource
selection probability function analysis, bobwhites did not select nest-sites based on cover
type (P = 0.279); although there was limited support for preferential use relative to
availability of basin marsh and wet flatwoods habitats. The proportion of basin marsh
and wet flatwoods habitat at two spatial scales around nests were included as covariates
in models related to daily nest survival. The best-supported models indicated that daily
nest survival had a negative linear relationship with time during the nesting season and a
positive relationship with the proportion of basin marsh within a 1000-m radius of the
nest. Daily nest survival did not differ by year, hunting zone, or sex, nor by rainfall and
temperature. Daily nest survival for the 204-day nesting period ranged from 0.992 (SE =
0.006) on 9 March to 0.949 (SE = 0.016) on 7 September. The nest survival rate for the
23-day incubation period estimated from the constant survival model was 0.477 (SE =
0.027). The results of this study suggested that bobwhite nest-habitat selection was
random at the resolution I investigated. Daily nest survival declined over time and was
affected by habitat surrounding the nest.
INTRODUCTION
Grassland bird species have been experiencing population declines across the
United States for decades (Brennan et al. 2005). Northern bobwhite (hereafter

10
“bobwhite”) populations have declined rangewide at 3.7% per year from 1966 to 2008
(Ziolkowski et al. 2010). The factors most frequently attributed to bobwhite population
declines were habitat loss and fragmentation (Brennan 1991, Dimmick et al. 2002). The
National Bobwhite Conservation Initiative (NBCI) developed habitat management
objectives for distinct regions within the bobwhite range with a goal of restoring
bobwhite populations to 1980 levels (Dimmick et al. 2002). To support implementation
of the plan, information is needed on habitat requirements and demographics of separate
populations so that contemporary management strategies can be developed.
The NBCI stated that “a lack of nesting and brood rearing cover was the major
limiting factor over much of the range of the northern bobwhite” (Dimmick et al.
2002:3). To manage nesting cover properly, it is important to understand nesting habitat
selection and requirements specific to local bobwhite populations. Many studies have
documented site-level nest habitat selection and the relationship of nest-site habitat
characteristics to nest success (Taylor et al. 1999a, Taylor and Burger 2000, Townsend et
al. 2001, Lusk et al. 2006, Rader et al. 2007, Collins et al. 2009). Taylor et al. (1999a)
found that nest-sites in Kansas had taller vegetation and more visual obstruction and litter
than random sites and that successful nests were surrounded by taller grass, less shrub
coverage, and less litter than depredated nests. Lusk et al. (2006) reported similar results
in northern Texas with regard to nest-site selection and nest success, but unlike in
Kansas, they found a positive relationship between shrub coverage and nest success.
Nest-site selection was similar in southern Texas to that in northern Texas, but nest
success was related to climatic factors rather than any particular nest-site characteristics
(Rader et al. 2007). Taylor and Burger (2000) reported that nest sites were not selected
based on vegetation characteristics but that successful nests had more bare ground and
less litter coverage than unsuccessful nests in Mississippi. In New Jersey, greater visual
obscurity and litter cover were qualities of selected nest sites, but no site characteristics
evaluated were related to nest success (Collins et al. 2009). It is clear that some common
factors exist in nesting habitat selection (e.g., selection for native grasses), but also that
there are differences among populations in how habitat factors are related to nest success.

11
At a macro scale, Rader et al. (2007) investigated the influence of percent woody
coverage on the landscape on bobwhite nest survival in southern Texas and found no
relationship. In Kansas, successful bobwhite nests were observed to have greater
coverage of native grass hayfields around them at intermediate scales and less coverage
of native rangeland at small scales (Taylor et al. 1999b). Staller et al. (2002) studied
macro-habitat influence on nest survival in south Georgia and north Florida. They
reported that bobwhites typically selected nest-sites with less surrounding hardwood
drain habitat and that nest success may have been greater at sites with less surrounding
hardwood drain habitat.
Other factors may influence nest survival for bobwhites. Generally, bobwhites
depend on rain at crucial times during the year to assure an adequate food supply and
enough moisture to perpetuate chick development during nest incubation. Most research
has focused on the lack of rain and its effects on bobwhite populations (Lusk et al. 2001,
Lusk et al. 2002, Cooper et al. 2009, Hernández et al. 2009). In the semi-arid region of
Texas, above average rainfall during the growing season enhanced vegetation growth
resulting in increased food and cover (Cooper et al. 2009). The timing and amount of
rain in this region caused the populations to exhibit a “boom and bust” phenomenon with
a positive population response (or “boom”) in times of above average rainfall and a
negative response (“bust”) when rain amounts were below average (Hernández et al.
2009).
In mesic regions, productivity tends to have a negative relationship with increased
rainfall (Cooper et al. 2009). Southern Florida has a hot-humid climate with a rainy
season between May and November, a period during which it receives 70% of its annual
rainfall (Black 1993). Tropical moisture and heat produce regular afternoon
thunderstorms that can produce substantial rainfall within relatively short periods of time.
Frye (1954) found an inverse relationship between summer rainfall and the percentage of
juvenile bobwhites in the fall population in southwest Florida. Excessive summer rainfall
in some habitats, therefore, may reduce bobwhite abundance through reduced nest
success and/or recruitment. However, Frye (1954) could not find a definitive relationship
between total bobwhite abundance in autumn and summer rainfall. More recently, Miley
12
and Lichtler (2006) found no negative effect of summer rainfall on bobwhite
demographic parameters in south-central Florida, but good drainage on that study site
may have contributed to the lack of response.
Temperature has also been shown to directly affect bobwhite nest survival
(Roseberry and Klimstra 1984, Rader et al. 2007). Roseberry and Klimstra (1984)
attributed a small portion of nest failures in southern Illinois to extreme temperatures.
Conversely, daily nest survival increased with increasing mean maximum daily
temperatures in southern Texas (Rader et al. 2007). Temperature may also produce
indirect effects on bobwhite nest success. For example, Frye (1954) observed that cooler
spring temperatures in southwest Florida delayed pair formation and nest initiations.
Such a setback could push peak nesting periods to coincide with peak predator density or
activity periods.
I estimated nesting rate, bird success, nests per nesting adult, nest success, and
average clutch size for cohorts of bobwhites alive and radio-tagged on 1 April, as well as
nest habitat selection and factors influencing daily nest survival of a northern bobwhite
population in southwest Florida from 2003 to 2009. Objectives of my study were to: (1)
determine if bobwhites preferred certain cover types for nesting among those available,
and (2) evaluate relationships between daily nest survival rates and year, time, sex, hunt
zone, climate (particularly rainfall), and habitat composition covariates.
STUDY AREA
The study was conducted on the Fred C. Babcock-Cecil M. Webb Wildlife
Management Area (hereafter “BWWMA”). BWWMA is a 26,302-ha state-owned
wildlife management area managed by the Florida Fish and Wildlife Conservation
Commission, located about 8 km east of Punta Gorda, Charlotte County, Florida. The
habitat is southern pine flatwoods with south Florida slash pine (Pinus elliottii var.
densa) dominating the overstory. Other tree species included cabbage palm (Sabal
palmetto), live oak (Q. virginiana), and laurel oak (Q. laurifolia). The understory was
dominated by saw palmetto (Serenoa repens) intermixed with other woody shrub species
such as southern waxmyrtle (Myrica cerifera), gallberry (Illex glabra), and dwarf live
13
oak (Q. minima). Herbaceous vegetation in the understory included broomsedge
(Andropogon spp.), wiregrass (Aristida stricta), and slough grass (Scleria muhlenbergii).
Sesbania (Sesbania sp.) food strips were planted each spring to provide food and cover
for bobwhites and other species throughout the fall and winter months. Seasonal and
perennial ponds and wetlands of various sizes were dispersed throughout the landscape.
Frye (1954) described BWWMA’s vegetation, geology, soils, and land uses in detail.
Prior to the initiation of the bobwhite study, BWWMA was divided into five hunt zones
used as treatment areas for various hunting regulations. Zones were labeled A, B, C, D,
and F and ranged from 3,132 ha to 6,258 ha (Figure 2.1). In most cases, zone boundaries
were delineated by barbed wire fences. Zones A – D were the largest in size. Bobwhite
hunting was allowed on those zones throughout the regular BWWMA quail hunting
season from mid-November through the end of December. Zone F was the smallest zone.
Bobwhite hunting was allowed only on two consecutive days in late January each year.
Wildlife management on BWWMA included cattle grazing, prescribed fire, and
roller chopping to maintain early successional habitat. Grazing was permitted in various
sections of zones A, B, C, and D at various times of year throughout the study. Each
year, prescribed fires were implemented from December to March. The majority of the
BWWMA (i.e., 50 – 100%) was prescribe-burned each year. Summer burns were added
to the burn plan to promote seed production of wiregrass. Roller chopping occurred year
round to reduce saw palmetto coverage, set back overall habitat succession and promote
vegetation growth.

14
METHODS
Field Methods
Trapping: I began trapping bobwhites on the study area in October 2002 and
continued year round until 31 March 2009. Trapping ceased for six weeks in zones A-D
each year during the regular BWWMA quail hunting season and for two days in zone F
during the quail quota hunt each January. I used six trapping methods throughout the
study: baited funnel trap, funnel live decoy trap, night mist netting using radio telemetry,
night cast netting using radio telemetry, diurnal cast netting using radio telemetry, and
diurnal cast netting using bird dogs.
Figure 2.1: Babcock-Webb Wildlife Management Area in southwest Florida
with five hunt management zones, 2002 - 2009.
15
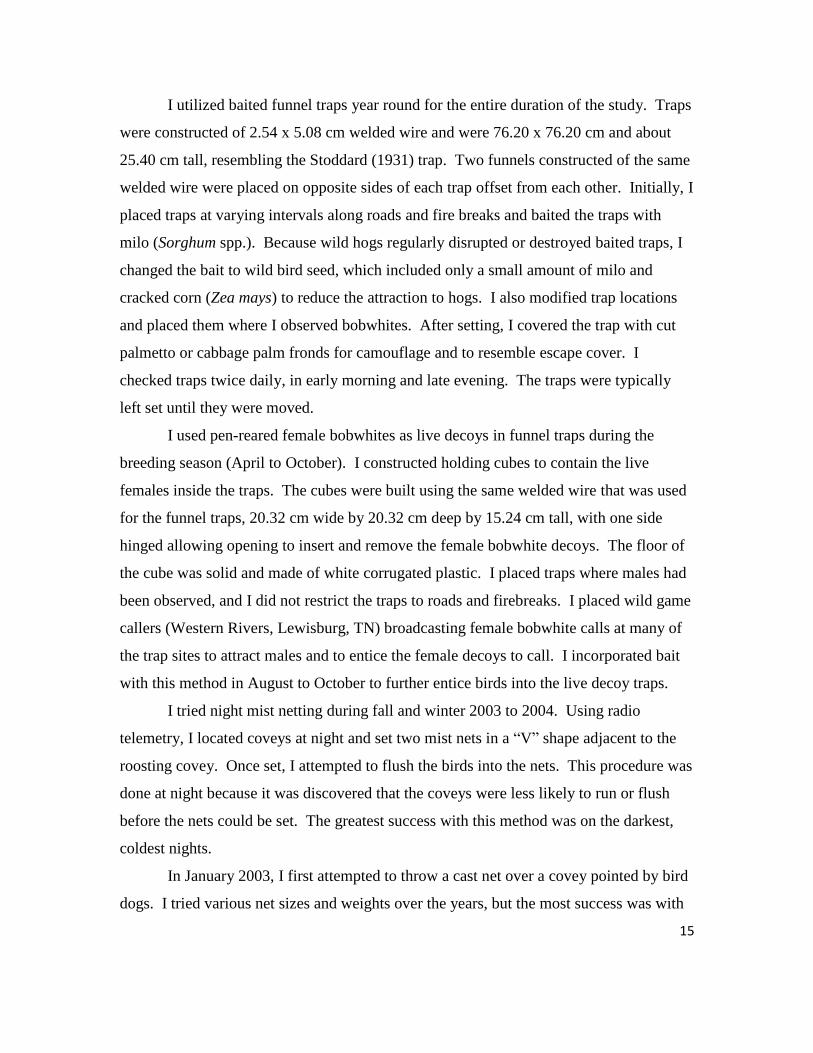
I utilized baited funnel traps year round for the entire duration of the study. Traps
were constructed of 2.54 x 5.08 cm welded wire and were 76.20 x 76.20 cm and about
25.40 cm tall, resembling the Stoddard (1931) trap. Two funnels constructed of the same
welded wire were placed on opposite sides of each trap offset from each other. Initially, I
placed traps at varying intervals along roads and fire breaks and baited the traps with
milo (Sorghum spp.). Because wild hogs regularly disrupted or destroyed baited traps, I
changed the bait to wild bird seed, which included only a small amount of milo and
cracked corn (Zea mays) to reduce the attraction to hogs. I also modified trap locations
and placed them where I observed bobwhites. After setting, I covered the trap with cut
palmetto or cabbage palm fronds for camouflage and to resemble escape cover. I
checked traps twice daily, in early morning and late evening. The traps were typically
left set until they were moved.
I used pen-reared female bobwhites as live decoys in funnel traps during the
breeding season (April to October). I constructed holding cubes to contain the live
females inside the traps. The cubes were built using the same welded wire that was used
for the funnel traps, 20.32 cm wide by 20.32 cm deep by 15.24 cm tall, with one side
hinged allowing opening to insert and remove the female bobwhite decoys. The floor of
the cube was solid and made of white corrugated plastic. I placed traps where males had
been observed, and I did not restrict the traps to roads and firebreaks. I placed wild game
callers (Western Rivers, Lewisburg, TN) broadcasting female bobwhite calls at many of
the trap sites to attract males and to entice the female decoys to call. I incorporated bait
with this method in August to October to further entice birds into the live decoy traps.
I tried night mist netting during fall and winter 2003 to 2004. Using radio
telemetry, I located coveys at night and set two mist nets in a “V” shape adjacent to the
roosting covey. Once set, I attempted to flush the birds into the nets. This procedure was
done at night because it was discovered that the coveys were less likely to run or flush
before the nets could be set. The greatest success with this method was on the darkest,
coldest nights.
In January 2003, I first attempted to throw a cast net over a covey pointed by bird
dogs. I tried various net sizes and weights over the years, but the most success was with
16
2.74-m radius nets with about 1.48 kg of lead weight per meter. The small, light nets
were easier to throw and open. Extra weight did not seem to be necessary to keep birds
under the net in most cases. This turned out to be an important addition to my trapping
strategy for radio-tagging birds in “new” coveys (coveys that previously had no radioed
quail). I used cast nets with dogs mostly in the fall and winter when the bobwhites were
in coveys.
I began using cast nets to capture additional bobwhites in coveys with at least one
radioed bird shortly after I discovered the use of cast nets with bird dogs. I located
bobwhites by radio telemetry and, depending on the number of workers at the site, threw
1 to 3 cast nets onto the covey. I used this method in the fall and winter when the
bobwhites were in coveys.
Handling and Marking: After capture, birds were held in cloth bags until they
could be processed, typically immediately after capture. Processing of each bird included
recording age, sex, and mass (g). I determined age and sex by plumage (Rosene 1969). I
placed bobwhites in a short shear stocking for containment to determine mass with a
300-g spring scale. Every captured bird was tagged with a uniquely numbered aluminum
leg band. I also fitted birds of both sexes and age classes weighing >130 g with a 6 – 7-g
neck loop radio transmitter (American Wildlife Enterprises, Monticello, FL). After a bird
was processed, I released it at its point of capture. Total processing time averaged 10
minutes.
Radio telemetry: I attempted to locate radio-tagged birds once every 4 days.
Because of limited manpower, equipment malfunction, and inclement weather, some
bobwhites were located at greater time intervals. I located radioed bobwhites using
R4000 telemetry receivers and 3-element yagi antennas (Advanced Telemetry Systems,
Isanti, MN). To estimate radio locations, I approached within 20 m of each radio-tagged
bird. I marked each bird’s location using Trimble Geoexplorer 3 GPS receivers (Trimble
Navigation Limited, Sunnyvale, CA) by entering an azimuth and distance to the bird’s
actual location into the GPS unit. If the bird was seen running or flushed, I determined
the exact location of the bird. Other information recorded in the GPS unit at the time of
marking a location was the date, time, and hunt zone.
17
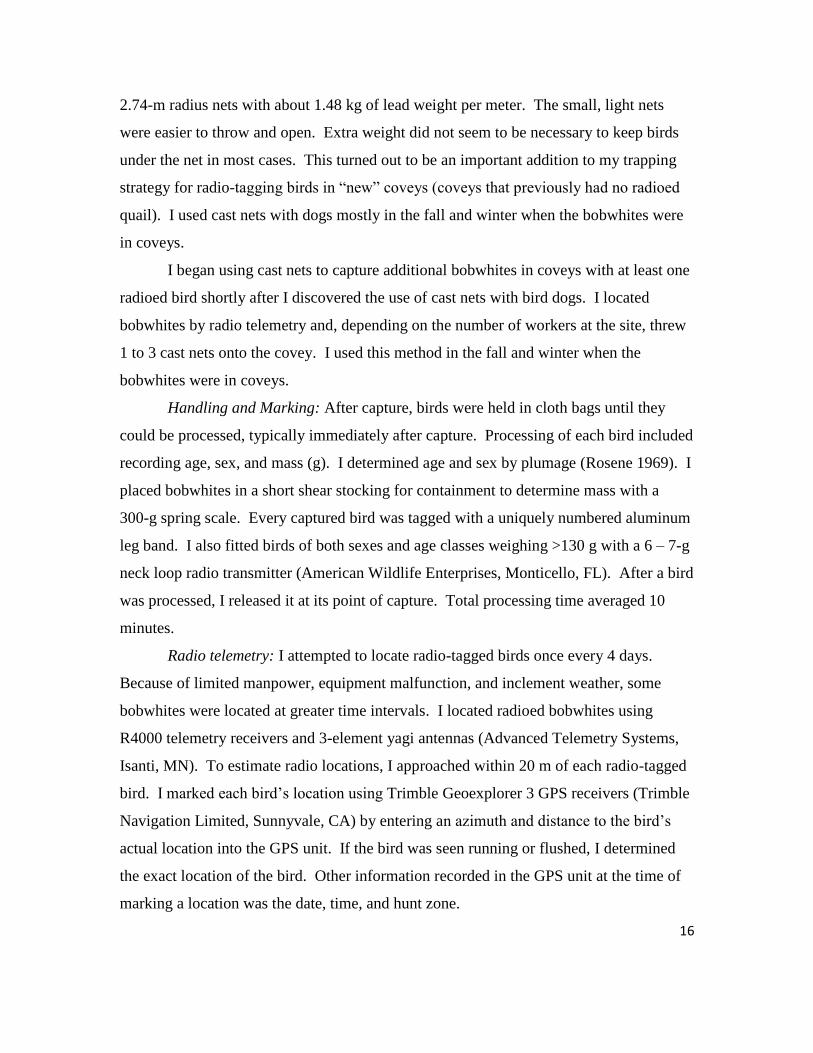
Nest location and monitoring: I used radio telemetry to locate all nests of
monitored birds from mid-March through mid-October. To keep from unnecessarily
flushing the bobwhites, I noted the location of individual birds from week to week. A
bobwhite observed in the same location two times consecutively was checked to
determine if a nest was present. Once I located a nest, I marked the location with GPS,
photographed the nest site and surrounding habitat, and placed flags in the area so that the
nest could be easily relocated. I attempted to check each nest at least every third day
from the time it was located until its fate was determined. If the adult was off the nest
during a nest check, I recorded the number of eggs. Eventually, I assigned each nest to
one of three fates: hatched, destroyed, or abandoned. A hatched nest was a nest with ≥1
egg hatched. A nest was classified as destroyed when it was obvious that the nest did not
hatch and the nest structure and/or eggs were damaged. Abandoned nests were left intact
but were no longer incubated by an adult. I considered a nest successful if it hatched and
failed if it was destroyed or abandoned.
Data Analysis
I estimated various nesting parameters for each sex in a cohort of birds alive and
radio-tagged on 1 April each year. Typically, nests were not located prior to the
incubation stage. Consequently, my estimates for nesting rate and average nesting
attempts likely are lesser and my nest success estimate greater than the true parameter. I
defined nesting rate as the proportion of the cohort attempting to incubate ≥1 nest (Burger
et al. 1995). Bird success rate was the proportion of the cohort that successfully hatched
≥1 nest (Burger et al. 1995). Because of radio failure or loss, contact was lost with 44
females and 82 males originally included in the 1 April cohort. These birds were
excluded from estimates of nesting rate and bird success (Burger et al. 1995). I defined
average nesting attempts as the nests per nesting adult (i.e., the average number of nests
incubated by individuals that incubated ≥1 nest). Nest success rate was the proportion of
all nests that were successful (i.e., hatched ≥1 egg) (Burger et al. 1995). I estimated
mean clutch size from nests with successful egg counts incubated by the 1 April cohorts
of birds.

18
Nest Habitat Selection: I evaluated 3rd
order habitat selection of nesting bobwhites
(Johnson 1980) with the resource selection probability function (RSPF) described by
Arthur et al. (1996). This method uses the technique of maximum likelihood estimation
and allows availability to change among animals. A measure of the proportion of each
cover type available to the animal and one location of habitat use (i.e., only one cover
type is used) is required. I used the proportion of each cover type within each female’s
home range as available habitat and the cover type where the nest was found as the
measure of habitat use.
I calculated the home range of female bobwhites with ≥10 radio locations using
locations from 1 January up to and including the nest location for each breeding season of
the study. The locations for each female were plotted using ArcGIS version 9.3 (ESRI,
Redlands, California). The home range was determined by 100% minimum convex
polygon using the ABODE extension (Laver 2005). If a female had <10 locations prior
to nesting or a male bobwhite was incubating the nest, the available home range for that
nest was determined by creating a circular buffer around the nest location equal in area to
the average area of all the estimated home ranges.
Both female and male bobwhites contribute to nest construction (Stoddard 1931,
Rosene 1969), suggesting that males have some influence on nest-site selection.
However, in south Florida, I observed male bobwhites regularly traveling up to 1 km to
reach females calling in decoy traps during the breeding season. Therefore, only female
home ranges prior to nesting were used to determine the extent of habitat availability and
mean home range size.
Twelve cover types were described on the BWWMA study area (Table 2.1).
Ruderal habitat was classified more in terms of location than vegetation. Because the
purpose of this analysis was to determine if certain cover types defined by vegetation
characteristics were used more than would be expected by availability, I excluded the
ruderal cover type from the analysis. I calculated the proportion of cover types available
to nesting bobwhites using a habitat cover type layer of BWWMA developed by the
Florida Fish and Wildlife Conservation Commission in 2005 – 2006 (Figure 2.2). Home
ranges or nest buffers were used as outlines in ArcGIS to clip the habitat cover layer and

19
determine the proportion of each cover type within the range. I assigned used nest habitat
as the cover type within which the nest was located. I observed that bobwhites seemed to
prefer nesting among palmettos. Therefore, I hypothesized that bobwhites would show
selection for mesic flatwoods and/or dry prairie cover types for nest locations because of
(1) their relatively dry nature, and (2) more palmettos relative to other cover types.
Daily Nest Survival: I used Program MARK nest survival models to calculate the
daily survival rate (DSR) of bobwhite nests (White and Burnham 1999, Dinsmore et al.
2002). Program MARK nest survival models utilize the Mayfield method (Mayfield
1961) for calculating the DSR of nests from exposure days while allowing the inclusion
of covariates for explaining variation in DSR. I modeled the relationship between DSR
and several covariates selected from a priori hypotheses about factors influencing
bobwhite nest DSR. I used a hierarchical modeling approach with three preliminary
model suites, a fourth model suite comparing top models from the preliminary suites and
a fifth model suite with all possible combinations of the most supported models from the
fourth suite. I chose this hierarchical approach to avoid combinations of models which
lacked biological plausibility (Anderson 2008). I added an interaction between basin
marsh and wet flatwoods habitats to models in the fifth suite to determine if there was a
strong difference in effects of the two habitat variables on DSR. I used Akaike’s
information criterion (AICc) for model selection (Burnham and Anderson 2002). Within
each preliminary model suite, I used evidence ratios to determine levels of support.
Evidence ratios (hereafter “ER”) are calculated within a model suite as
ER = wmin / wi
where wmin is the Akaike weight (w) for the best model in the suite and wi is the
individual w for all the models in the suite (i = 1, 2, …..i) (Anderson 2008). Following
this ratio, the best model will have ER = 1. All other models will have ER >1 with less
support as the ER gets larger. ER are likened to odds ratios with raffle tickets, where an
evidence ratio of 100 for model wi is equivalent to model wi having 1 raffle ticket
compared to model wmin having 100 raffle tickets in a drawing to determine which model

20
is most likely given the data (Anderson 2008). Anderson (2008) suggested that an
arbitrary cutoff for model selection (i.e., ∆AICc ≤2) should not be used. I considered all
models within each preliminary suite, and decided which models to include in the fourth
suite based on the range and relative difference of ER.

21
Depression Marsh DM
HHHydric Hammock
Small rounded wetlands maintained by
fire every 1 - 10 years. Vegetation is
herb dominated, but species content
changes from the deep center to the
shallow edges. Typically dry out in
periods lacking rain.
Open pine canopy forests with a diverse
understory of shrubs and herbs.
Maintained by fire every 2 - 5 years.
Distinction from wet flatwoods by
presence and abundance of saw
palmetto.
MFMesic Flatwoods
MHMesic Hammock
Forested wetlands dominated by
hardwood species. Fire is rare because
of saturated soils.
DPDry Prairie
Closed canopy forests of hardwood
species. Fire is rare. Occur along edges
and as islands within basin marsh habitat.
Nearly treeless flatlands dominated by a
variety of herbs and low shrubs.
Maintained by fire every 1 - 4 years.
Distinction from wet prairie by presence
and abundance of saw palmetto.
Habitat Category Abbreviation Description
Large, irregularly shaped wetlands
maintained by fire occurring every 1 -10
years. Vegetation is herb-dominated, but
varies in species content from the deepest
centers to the progressively shallower
edges.
Table 2.1: General descriptions and abbreviations for the twelve habitat categories on
BWWMA in southwest Florida 2002 - 2009.
Basin Marsh BM

22
Wet Flatwoods
RRuderal
Nearly treeless flatlands dominated by a
variety of hydrophytic herbs and shrubs.
Maintained by fire every 2 - 5 years.
Distinction from dry prairie by near
absence of saw palmetto.
Habitat Category Abbreviation Description
A variety of habitat types that have been
altered by human activity but may still
resemble the natural community. Located
in the vicinity of buildings and roads.
Open pine canopy forests with an
understory of hydrophytic shrubs and
herbs. Maintained by fire every 2 - 5
years. Distinction from mesic flatwoods
by near absence of saw palmetto.
Unnatural community dominated by
exotic grasses suitable for cattle grazing.
Silvicultural operations with a dense
monculture of pine trees.
Unnatural community prepared for cattle
grazing, but still resembles a natural
community.
PPPine Plantation
PIImproved Pasture
WPWet Prairie
WF
PSSemi-improved Pasture
Table 2.1: (continued).
23
In the first model suite, I evaluated models with the grouping variables of year,
sex, hunting zone and within-season temporal variables (Table 2.2). I expected annual
variation in DSR because of changes in predator population densities and fluctuations in
broad scale weather patterns (Dinsmore et al. 2002). Whereas the hunting zones
consisted of generally the same cover types, there was variation in overall size, shape,
and juxtaposition of cover types among zones (Figure 2.2). Therefore, I considered
differences in DSR among hunting zones to be plausible. Females typically incubate
more nests than males (Stoddard 1931). Some studies have shown that the gender of the
incubating bird had no effect on nest success (Roseberry and Klimstra 1984, Burger et al.
1995). Nevertheless, I tested that hypothesis on my study population. Variation in DSR
within the nesting season is also expected because of changing weather (i.e., increasing
Figure 2.2: Habitat cover layer for Babcock-Webb WMA in southwest Florida depicting
habitat categories available on the management area during the northern bobwhite study,
2002 - 2009. Hunting zones are labeled in figure 2.1.
24
temperatures and fluctuating precipitation) and also fluctuations in predator activity.
Researchers of avian grassland species found support for models evaluating linear and
quadratic relationships between nest DSR and time (Grant et al. 2005, Davis et al. 2006).
I hypothesized that DSR would either decrease linearly over the nesting season because
of increasing predator activity and increasing severity in temperature and rainfall, or have
a curvilinear (quadratic) relationship with time over the nesting season because of
fluctuations in the aforementioned factors.
In the second suite of models, I evaluated environmental variables associated with
each nest (Table 2.2). Daily rainfall data were available from a Southwest Florida Water
Management District data collection station on the west side of BWWMA. I used these
data to calculate rainfall covariates associated with each nest. The time intervals for the
total rainfall covariates were chosen as divisions of the incubation period of bobwhites.
The total incubation period of bobwhites is 23 days ± 1 day (Rosene 1969, Brennan
1999). Researchers in south Florida have determined that nest flooding of avian
grassland species could be a significant cause of nest mortality (Pranty 2000, Perkins and
Vickery 2005). Therefore, I hypothesized that there was a negative relationship between
the amount of rainfall and DSR. My analysis was exploratory beyond this hypothesis to
determine at what point the relationship with rainfall was negative. The covariates I
included were the total rainfall (cm) 3, 12, and 23 days prior to the fate of the nest,
respectively. By including these three covariates in the daily nest survival models, I
determined first if there was a relationship between rainfall and DSR, and second, at what
time scale and/or quantity of rain the relationship occurred.

25
S(T12*T12)
Model Suite Model Notation
I. Group and Time Models
Year by Quadratic Time Interaction
Year by Linear Time Interaction
Sex
Zone
Quadratic Time
Linear Time
Year
S(year*(T+TT))
S(year*T)
S(sex)
S(zone)
S(year)
S(T+TT)
S(T)
S(burn)
S(AvgT12D)
S(TR3D)
S(TR12D)
S(3in12)
II. Climate Models
Burn status of nest site
% Wet Flatwoods within 1000 m radius of nest
% Wet Flatwoods within 100 m radius of nest
% Basin Marsh within 1000 m radius of nest
% Basin Marsh within 100 m radius of nest
Total rainfall 23 days prior to nest fate
Total rainfall 12 days prior to nest fate
Total rainfall 3 days prior to nest fate
Quadratic AvgT12D
# 7.62 cm rain events 12 days prior to nest fate
Average temperature (°C) 12 days prior to fate
7.62 cm event 3 days prior to nest fate?
Quadratic TR23D
S(TR23D)
S(3in3)
S(23*23)
BM100 + WF100
BM1000 + WF1000
S(BM100+WF100)
S(BM1000+WF1000)
S(BM100)
S(BM1000)
S(WF100)
S(WF1000)
Table 2.2: Description of the three preliminary model suites for daily nest survival rate and the
corresponding model notation used in later results tables. A constant survival model (S(.)) containing only
the intercept was included in each suite, but is not included in this table.
III. Habitat Models

26
I included two other variables associated with rainfall. I hypothesized that rain
events (a short-term continuous amount of rain) may affect the DSR by flooding the
nesting area. These rain events may impact the DSR (1) directly by inundating the nest
causing failure, (2) indirectly by concentrating predators on the high ground where the
nests are located, or (3) by intensifying the scent of the nest and/or incubating adult
resulting in easier location by predators. Frye (1954) used 7.62 cm of rain as a basis for
examining differences in nest success and juvenile recruitment among years of his study
on the BWWMA. Pranty (2000) found Florida grasshopper sparrow (Ammodramus
savannarum floridanus) nests flooded after rain events less than 6.84 cm. I included
covariates of whether the nest experienced a continuous rain event of ≥7.62 cm three
days prior to its fate and the number of rain events ≥7.62 cm twelve days prior to its fate.
Temperature shifts throughout the breeding season could increase activity of
snakes and other nest predators. Extreme temperature has also been shown to negatively
affect bobwhite nesting in Texas through stress on the adult and eggs causing nest
abandonment or failure (Guthery et al. 2001, Guthery et al. 2005). For that reason, I
included the average daily temperature (°C) for the twelve days prior to the fate of the
nest as a climatic variable and hypothesized that DSR would decrease with increasing
average temperature.
In the third model suite, I evaluated models with covariates related to habitat
characteristics (Table 2.2). Burn status was a categorical variable grouping nests by
whether vegetation at the actual nest location had been burned the previous non-breeding
season. Dimmick (1971) suggested that burn status of a nest site could have an indirect
effect on nest success because nests in fields burned the previous fall were initiated later
in the season than nests in unburned fields. He also observed that more bobwhites nested
in unburned fields than fields burned the previous non-breeding season (Dimmick 1971).
I hypothesized that nests in vegetation burned the previous non-breeding season would
have lower DSR than nests in previously unburned vegetation. The other variables
included in this model suite were the proportion of basin marsh cover type within
100-m and 1000-m radii of the nest, and the proportion of wet flatwoods cover type
within 100-m and 1000-m radii of the nest. These cover types were based upon the

27
results of the nest-site habitat selection analysis. I hypothesized a priori that the
proportion of the most favored cover types around each nest location would positively
influence DSR. I chose the radial distances of 100 m and 1000 m to capture local and
landscape habitat scales, respectively, because habitat cover types and their associations
are important to bobwhites at a wide range within landscapes (White et al. 2009).
In the fourth model suite, I compared the most supported models from the first
three suites. I calculated ER for all of the models in the fourth suite and used the ER to
determine the models I included in the fifth model suite. I considered the range and
relative difference of ER for selection of models to include in the fifth suite. In the fifth
model suite, I modeled all combinations of the most supported models from the fourth
model suite. I assumed that the models with enough support to be included in the fifth
suite had justification to be combined because of my conservative hierarchical approach
and model selection methods. I also added an interaction term between habitat variables
to models in the fifth suite to determine support for models allowing cover type
proportions to vary differently. I considered a covariate within a model to be an
important factor if the 95% confidence interval for the beta estimate did not overlap zero.
I used weighted model averaging to average the DSR estimates across all models
in the fifth model suite. I calculated the probability of a nest surviving a given 23-day
incubation period as the product of 23 consecutive daily survival rates starting on day one
of the period. I used a 23-day incubation period because it is a rangewide average
bobwhite incubation period (Rosene 1969, Brennan 1999). I also estimated a constant
breeding season DSR from the constant survival model. The constant 23-day incubation
period survival rate estimate was calculated as the constant DSR to the 23rd
power. The
standard error for the constant 23-day incubation period survival rate was calculated
using the delta method (Powell 2007).
RESULTS
I caught 711 bobwhites (393 males and 318 females) using the baited funnel trap
method, and 755 bobwhites (658 males and 97 females) using the decoy funnel trap
method over the duration of the study. Forty-four bobwhites (24 males and 20 females)
28
were caught using the night cast net method. I caught 459 (225 males and 234 females)
bobwhites using the dog cast net method, and 54 (27 males and 27 females) and 202 (93
males and 109 females) bobwhites by using the night telemetry cast net and diurnal
telemetry cast net methods, respectively.
Bobwhites of both sexes in the 1 April cohort incubated 234 (females) and 64
(males) nests respectively from 2003 to 2009. Nesting rates were consistently greater for
females than males and were variable among years for females and more so for males.
The pooled nesting rates over the seven nesting seasons of the study were 58% for
females and 17% for males (Table 2.3). Yearly bird success rates were also greater for
females than males. Pooled estimates were 39% and 9% for females and males,
respectively. Females averaged 1.23 (SE = 0.03) nests per nesting adult; the average
nesting attempts per male was 1.02 (SE = 0.02; Table 2.3). Nest success rates were
similar for both sexes in most years and the pooled success rates were 59% for females
and 52% for males. The overall mean clutch size (n = 212 nests) was 12.37 (SD = 2.96;
Table 2.3).
Male Female Male Female Male Female Male SE Female SE Male Female Male SD Female SD Overall SD
2003 10 7 10 100 0 57 1.00 0.00 1.14 0.14 0 50 16.00 0.00 12.86 2.12 13.25 2.25
2004 39 31 13 61 10 42 1.00 0.00 1.00 0.00 80 68 15.00 4.73 14.00 2.97 14.10 3.13
2005 73 73 36 62 16 40 1.00 0.00 1.33 0.08 46 58 11.94 3.10 12.62 2.23 12.42 2.51
2006 52 48 17 60 15 42 1.11 0.11 1.24 0.08 80 56 13.43 1.27 11.59 2.85 11.97 2.69
2007 63 70 6 46 3 30 1.00 0.00 1.44 0.11 50 52 9.50 5.67 11.06 3.18 10.86 3.49
2008 62 44 16 57 8 45 1.00 0.00 1.20 0.08 50 67 12.25 2.22 12.85 2.44 12.71 2.34
2009 70 54 11 61 3 41 1.00 0.00 1.06 0.04 25 63 11.86 2.73 13.10 3.09 13.06 3.08
Pooled 369 327 17 58 9 39 1.02 0.02 1.23 0.03 52 59 12.25 3.23 12.40 2.89 12.37 2.96
a Percent of adults in cohort that attempted to incubate a nest.
b Percent of adults in cohort that successfully incubated a nest (i.e., hatched a nest)
c Average number of nests per nesting adult.
d Percent of nests that successfully hatched.
Clutch Size
Table 2.3: Estimates of yearly nesting parameters of northern bobwhites in southwest Florida, 2002 - 2009. Paramter
estimates are derived from a cohort of bobwhites alive and radio-tagged on 1 April each year.
Year
# alive and
radioed 4/1
Nesting
Ratea
Bird
Successb
Nests/Nesting Adultc
Nest
Successd

29
Nest Habitat Selection: I calculated the home range of 168 female bobwhites.
Average home range size was 33.37 ha. A circular buffer (radius = 326 m) was created
around 174 nest locations to estimate habitat availability for incubating females with <10
locations prior to nesting or females constructing nests incubated by males. Of the eleven
habitat types considered for the nest habitat selection analysis, nine were available to
nesting bobwhites by being present in at least one home range or nest buffer boundary.
Therefore, the nest habitat selection analysis considered these nine cover types. Six of
these cover types contained at least one bobwhite nest during the study (Table 2.4).
I analyzed nest habitat selection for 336 out of 400 bobwhite nests. To allow
equal weight within each year among individuals for the analysis, 58 nests were excluded
because they were re-nests of individual bobwhites within breeding seasons. Six
additional nests were excluded from the analysis because they were within the ruderal
cover type.
No overall difference occurred between observed habitat use and what would be
expected by chance (F = 9.80, df = 8, P = 0.279; Table 2.4). Mesic hammock, semi-
improved pasture, and pine plantation were never used for nesting (Table 2.4). Basin
marsh and wet flatwoods were the only two types used at a greater proportion than they
were available (Figure 2.3). These categories also had the greatest RSPF’s of 0.210 and
0.214, respectively (Table 2.5). The other cover types were used proportionally less than
they were available to nesting bobwhites (Figure 2.3).
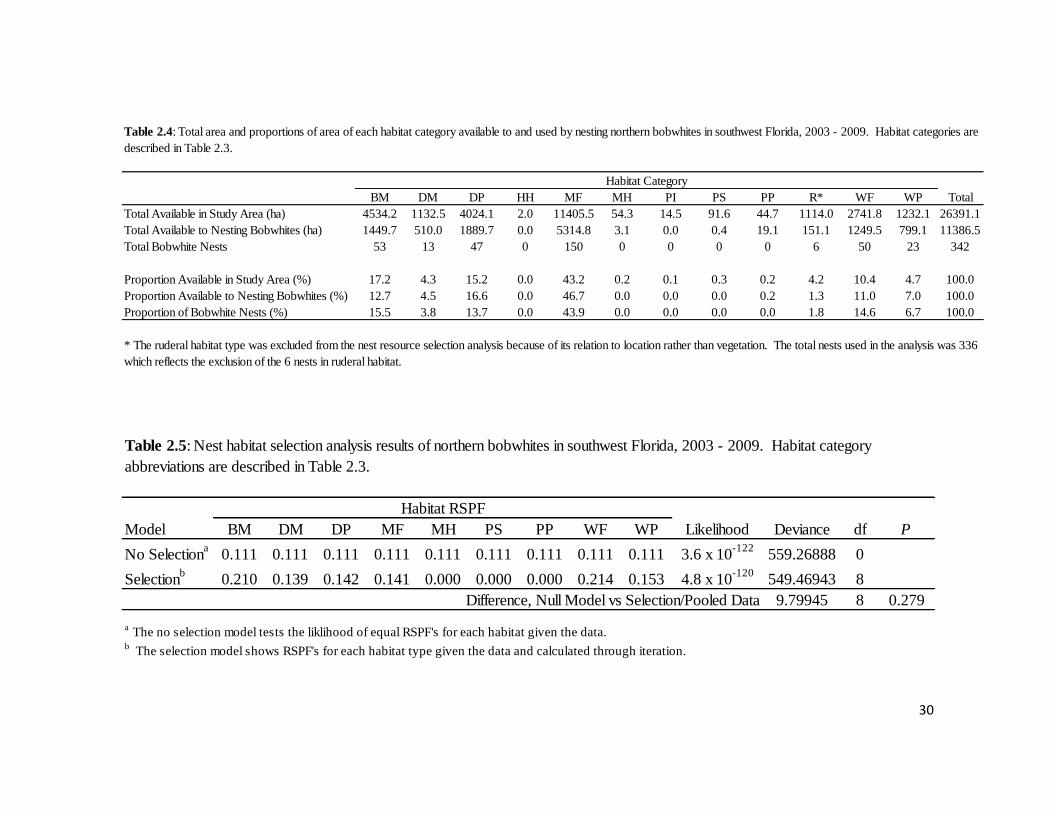
30
BM DM DP HH MF MH PI PS PP R* WF WP Total
Total Available in Study Area (ha) 4534.2 1132.5 4024.1 2.0 11405.5 54.3 14.5 91.6 44.7 1114.0 2741.8 1232.1 26391.1
Total Available to Nesting Bobwhites (ha) 1449.7 510.0 1889.7 0.0 5314.8 3.1 0.0 0.4 19.1 151.1 1249.5 799.1 11386.5
Total Bobwhite Nests 53 13 47 0 150 0 0 0 0 6 50 23 342
Proportion Available in Study Area (%) 17.2 4.3 15.2 0.0 43.2 0.2 0.1 0.3 0.2 4.2 10.4 4.7 100.0
Proportion Available to Nesting Bobwhites (%) 12.7 4.5 16.6 0.0 46.7 0.0 0.0 0.0 0.2 1.3 11.0 7.0 100.0
Proportion of Bobwhite Nests (%) 15.5 3.8 13.7 0.0 43.9 0.0 0.0 0.0 0.0 1.8 14.6 6.7 100.0
Habitat Category
Table 2.4: Total area and proportions of area of each habitat category available to and used by nesting northern bobwhites in southwest Florida, 2003 - 2009. Habitat categories are
described in Table 2.3.
* The ruderal habitat type was excluded from the nest resource selection analysis because of its relation to location rather than vegetation. The total nests used in the analysis was 336
which reflects the exclusion of the 6 nests in ruderal habitat.
Model BM DM DP MF MH PS PP WF WP Likelihood Deviance df P
No Selectiona
0.111 0.111 0.111 0.111 0.111 0.111 0.111 0.111 0.111 3.6 x 10-122
559.26888 0
Selectionb
0.210 0.139 0.142 0.141 0.000 0.000 0.000 0.214 0.153 4.8 x 10-120
549.46943 8
9.79945 8 0.279
Habitat RSPF
Difference, Null Model vs Selection/Pooled Data
Table 2.5: Nest habitat selection analysis results of northern bobwhites in southwest Florida, 2003 - 2009. Habitat category
abbreviations are described in Table 2.3.
a The no selection model tests the liklihood of equal RSPF's for each habitat given the data.
b The selection model shows RSPF's for each habitat type given the data and calculated through iteration.

31
Daily Nest Survival: I determined daily nest survival using the nest histories of
400 nests over the seven breeding seasons of the study from 2003 to 2009. Over the
seven breeding seasons of the study, bobwhite nests were active from 9 March (first nest
located) through 28 September (last checked date for last nest), for a 204-day nesting
period. However, among years, the nesting periods were highly variable (Table 2.6).
In the first model suite, only linear and quadratic time had strong support with ER
of 3.4 and 1.0 respectively (Table 2.7). Models with the grouping variables of year, zone,
and sex had little support (ER >100 for all). Although the constant survival model lacked
Figure 2.3: Available and used habitat category proportions for nesting northern
bobwhites in southwest Florida, 2003 - 2009. Habitat categories are described in
Table 2.3.

32
support (ER = 114.2), I calculated the constant survival model DSR (0.9683; SE =
0.0024) for comparative purposes. Two other models testing for a year by time
interaction were not supported because year differences were not a factor.
In the second suite of models, none of the climatic covariates I evaluated
explained variation in DSR. The constant survival model was the most parsimonious (ER
= 1.0; Table 2.8).
In the third suite, the model S(BM1000) was the most parsimonious model (Table
2.9). With an ER = 16.8, the S(WF1000) model was also included in the fourth suite.
All other models, including the constant survival model, lacked support with ER >100 for
all.
In the fourth model suite, I compared 13 models, 2 from the first suite, 9 from the
second suite, and 2 from the third suite. Four models had support in this fourth suite with
ER <17 (Table 2.10). The model of DSR as a function of the BM1000 covariate was the
n Start Datea
(Day of Period)b
End Datec
(Day of Period) Daysd
2003 18 5/7/2003 (60) 8/10/2003 (155) 96
2004 27 4/28/2004 (51) 6/23/2004 (107) 57
2005 107 4/13/2005 (36) 9/5/2005 (181) 146
2006 57 3/9/2006 (1) 9/1/2006 (177) 177
2007 73 4/25/2007 (48) 9/28/2007 (204) 157
2008 75 4/14/2008 (37) 9/19/2008 (195) 159
2009 43 4/15/2009 (38) 6/30/2009 (114) 77
Table 2.6: Yearly number of nests monitored (n) and nesting periods of northern
bobwhites in southwest Florida, 2002 - 2009.
a Date the first nest was found.
d Total length of nesting period.
c Date of the last day the last nest was checked.
b Numeric location of the date within the 204 day nesting period for the entire study.
Year
Nesting Period

33
most parsimonious with ER = 1. The relationship between DSR and BM1000 was
positive and important: the beta estimate for BM1000 was 2.82. The DSR as a function
of quadratic time model had support with ER = 1.4. The beta estimates for linear time
(-0.03) and quadratic time (0.0001) were important indicating a decline in DSR over the
nesting period with the slope approaching zero near the end of the nesting period. The
model of DSR as a function of linear time only had support with ER = 4.76 and the beta
for linear time (-0.006) was important. The final model with support from the fourth
suite was the WF1000 model with ER = 16.83. This model involved a negative
relationship between DSR and the WF1000 covariate, and the beta for WF1000 (-1.89)
was important.
In the fifth model suite, I evaluated ten additional models with combinations of
the additive effects of the four top models from the fourth suite. Seven of the additive
models were supported in the model suite with ER <37 (Table 2.11). All of the top seven
models included the effect of linear time. In these models, the relationship between
linear time and DSR was consistently negative and important (Table 2.11). Six of the top
models included the basin marsh covariate effect. For all of these models the parameter
estimates for the BM1000 variable were positive and important (Table 2.12). All other
variable beta estimates in the top seven models had confidence intervals that included
zero the majority of the time, suggesting weak relationships (Table 2.12).
DSR estimated from averaging models in the fifth suite ranged from 0.9486 to
0.9916 and exhibited a clear negative linear trend over time with a possible quadratic
effect (Figure 2.4). For a 23-day incubation period, the nest survival rate ranged from
0.2978 for a nest that initiated incubation on day 173 (28 August) to 0.7912 for a nest that
initiated incubation on day 1 (9 March). The overall DSR estimated from the constant
survival model was 0.9683 (SE = 0.0024), and the overall 23-day incubation period
survival rate was 0.4766 (SE = 0.0269).

34
Model K AICc ∆AICc AICc Weights Evidence Ratio Deviance
S(T+TT) 3 1024.2877 0 0.75706 1.0000 1018.2830
S(T) 2 1026.7326 2.4449 0.22296 3.3955 1022.7303
S(zone) 5 1033.6154 9.3277 0.00714 106.0308 1023.6037
S(.) 1 1033.7643 9.4766 0.00663 114.1870 1031.7635
S(sex) 2 1034.2464 9.9587 0.00521 145.3090 1030.2441
S(year) 7 1038.0331 13.7454 0.00078 970.5897 1024.0112
S(year*TT) 15 1041.4263 17.1386 0.00014 5407.5714 1011.3322
S(year*T) 14 1042.6907 18.403 0.00008 9463.2500 1014.6084
Table 2.7: Summary of model-selection results from the first preliminary model suite for nest survival of northern
bobwhites in southwest Florida, 2003 - 2009. Model notation is described in Table 2.1.
Model K AICc ∆AICc AICc Weights Evidence Ratio Deviance
S(.) 1 1033.7643 0 0.18535 1.0000 1031.7635
S(TR23D) 2 1034.1564 0.3921 0.15235 1.2166 1030.1541
S(3in12) 2 1034.5994 0.8351 0.12208 1.5183 1030.5971
S(AvgT12D) 2 1034.9132 1.1489 0.10435 1.7762 1030.9109
S(TR3D) 2 1035.0187 1.2544 0.09899 1.8724 1031.0164
S(TR12D) 2 1035.0578 1.2935 0.09707 1.9094 1031.0555
S(3in3) 2 1035.117 1.3527 0.09424 1.9668 1031.1147
S(AvgT12D*AvgT12D) 3 1035.227 1.4627 0.0892 2.0779 1029.2223
S(23*23) 3 1036.1453 2.381 0.05636 3.2887 1030.1406
Table 2.8: Summary of model-selection results from the second preliminary model suite for nest survival of northern
bobwhites in southwest Florida, 2003 - 2009. Model notation is described in Table 2.1.
Model K AICc ∆AICc AICc Weights Evidence Ratio Deviance
S(BM1000) 2 1023.6105 0 0.92584 1.0000 1017.5467
S(WF1000) 2 1029.2564 5.6459 0.05502 16.8273 1019.6082
S(WF100) 2 1033.5248 9.9143 0.00651 142.2181 1025.2541
S(.) 1 1033.7643 10.1538 0.00578 160.1799 1029.5225
S(BM100) 2 1034.1837 10.5732 0.00468 197.8291 1031.7635
S(burn) 2 1035.7305 12.12 0.00216 428.6296 1030.1814
Table 2.9: Summary of model-selection results from the third preliminary model suite for nest survival of northern
bobwhites in southwest Florida, 2003 - 2009. Model notation is described in Table 2.1.

35
Model K AICc ∆AICc AICc Weights Evidence Ratio Deviance
S(BM1000) 2 1023.6105 0 0.49609 1.0000 1019.6082
S(T+TT) 3 1024.2877 0.6772 0.35359 1.4030 1018.2830
S(T) 2 1026.7326 3.1221 0.10414 4.7637 1022.7303
S(WF1000) 2 1029.2564 5.6459 0.02948 16.8280 1025.2541
S(.) 1 1033.7643 10.1538 0.0031 160.0290 1031.7635
S(TR23D) 2 1034.1564 10.5459 0.00254 195.3110 1030.1541
S(3in12) 2 1034.5994 10.9889 0.00204 243.1814 1030.5971
S(AvgT12D) 2 1034.9132 11.3027 0.00174 285.1092 1030.9109
S(TR3D) 2 1035.0187 11.4082 0.00165 300.6606 1031.0164
S(TR12D) 2 1035.0578 11.4473 0.00162 306.2284 1031.0555
S(3in3) 2 1035.117 11.5065 0.00157 315.9809 1031.1147
S(AvgT12D*AvgT12D) 3 1035.227 11.6165 0.00149 332.9463 1029.2223
S(23*23) 3 1036.1453 12.5348 0.00094 527.7553 1030.1406
Table 2.10: Summary of model-selection results from the fourth and comprehensive model suite for nest survival of northern
bobwhites in southwest Florida, 2003 - 2009. Model notation is described in Table 2.1.
Model K AICc ∆AICc AICc Weights Evidence Ratio Deviance
S(T+TT+BM1000+WF1000+BM*WF) 6 1009.2815 0 0.28275 1.0000 997.2650
S(T+TT+BM1000+WF1000) 5 1009.6936 0.4121 0.2301 1.2288 999.6819
S(T+BM1000+WF1000+BM*WF) 5 1010.5688 1.2873 0.14855 1.9034 1000.5571
S(T+BM1000+WF1000) 4 1010.649 1.3675 0.14271 1.9813 1002.6412
S(T+TT+BM1000) 4 1011.2823 2.0008 0.10397 2.7195 1003.2745
S(T+BM1000) 3 1011.7704 2.4889 0.08146 3.4710 1005.7657
S(T+TT+WF1000) 4 1016.4516 7.1701 0.00784 36.0651 1008.4438
S(T+WF1000) 3 1019.4258 10.1443 0.00177 159.7458 1013.4211
S(BM1000+WF1000) 3 1023.5514 14.2699 0.00023 1229.3478 1017.5467
S(BM1000) 2 1023.6105 14.329 0.00022 1285.2273 1019.6082
S(BM1000+WF1000+BM*WF) 4 1023.8788 14.5973 0.00019 1488.1579 1015.871
S(T+TT) 3 1024.2877 15.0062 0.00016 1767.1875 1018.283
S(T) 2 1026.7326 17.4511 0.00005 5655.0000 1022.7303
S(WF1000) 2 1029.2564 19.9749 0.00001 n/a 1025.2541
S(.) 1 1033.7643 24.4828 0 n/a 1031.7635
Table 2.11: Summary of model-selection results from the fifth model suite for nest survival of northern bobwhites in
southwest Florida, 2003 - 2009. Model notation is described in Table 2.1.
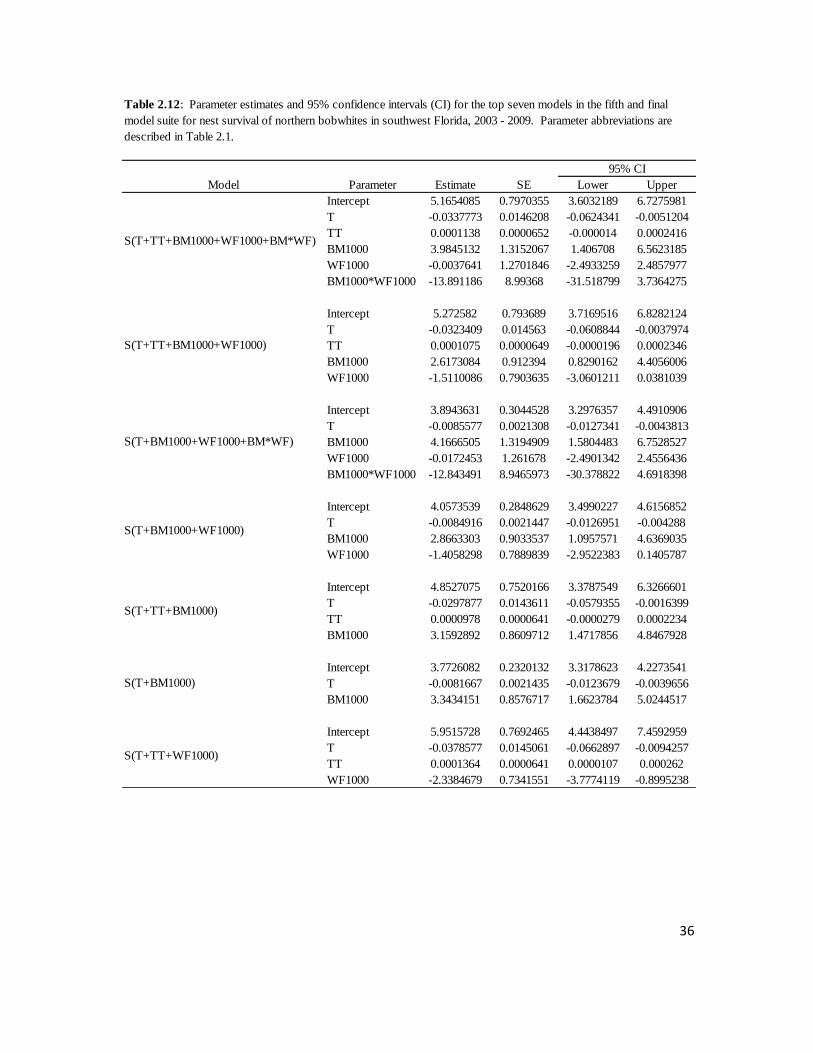
36
Model Parameter Estimate SE Lower Upper
Intercept 5.1654085 0.7970355 3.6032189 6.7275981
T -0.0337773 0.0146208 -0.0624341 -0.0051204
TT 0.0001138 0.0000652 -0.000014 0.0002416
BM1000 3.9845132 1.3152067 1.406708 6.5623185
WF1000 -0.0037641 1.2701846 -2.4933259 2.4857977
BM1000*WF1000 -13.891186 8.99368 -31.518799 3.7364275
Intercept 5.272582 0.793689 3.7169516 6.8282124
T -0.0323409 0.014563 -0.0608844 -0.0037974
TT 0.0001075 0.0000649 -0.0000196 0.0002346
BM1000 2.6173084 0.912394 0.8290162 4.4056006
WF1000 -1.5110086 0.7903635 -3.0601211 0.0381039
Intercept 3.8943631 0.3044528 3.2976357 4.4910906
T -0.0085577 0.0021308 -0.0127341 -0.0043813
BM1000 4.1666505 1.3194909 1.5804483 6.7528527
WF1000 -0.0172453 1.261678 -2.4901342 2.4556436
BM1000*WF1000 -12.843491 8.9465973 -30.378822 4.6918398
Intercept 4.0573539 0.2848629 3.4990227 4.6156852
T -0.0084916 0.0021447 -0.0126951 -0.004288
BM1000 2.8663303 0.9033537 1.0957571 4.6369035
WF1000 -1.4058298 0.7889839 -2.9522383 0.1405787
Intercept 4.8527075 0.7520166 3.3787549 6.3266601
T -0.0297877 0.0143611 -0.0579355 -0.0016399
TT 0.0000978 0.0000641 -0.0000279 0.0002234
BM1000 3.1592892 0.8609712 1.4717856 4.8467928
Intercept 3.7726082 0.2320132 3.3178623 4.2273541
T -0.0081667 0.0021435 -0.0123679 -0.0039656
BM1000 3.3434151 0.8576717 1.6623784 5.0244517
Intercept 5.9515728 0.7692465 4.4438497 7.4592959
T -0.0378577 0.0145061 -0.0662897 -0.0094257
TT 0.0001364 0.0000641 0.0000107 0.000262
WF1000 -2.3384679 0.7341551 -3.7774119 -0.8995238
95% CI
Table 2.12: Parameter estimates and 95% confidence intervals (CI) for the top seven models in the fifth and final
model suite for nest survival of northern bobwhites in southwest Florida, 2003 - 2009. Parameter abbreviations are
described in Table 2.1.
S(T+TT+BM1000+WF1000+BM*WF)
S(T+TT+WF1000)
S(T+BM1000)
S(T+TT+BM1000)
S(T+BM1000+WF1000)
S(T+BM1000+WF1000+BM*WF)
S(T+TT+BM1000+WF1000)

37
DISCUSSION
The estimated nesting rates from my study (58% female, 17% male) were
lower than those reported from declining populations in Missouri (66% female, 29%
male; Burger et al. 1995) and New Jersey (69% female, 20% male; Collins et al. 2009),
higher than Mississippi (38% female, 7% male; Taylor and Burger 1997), and similar to a
female nesting rate of 57% for an abundant population in Georgia (Terhune et al. 2006)
(Table 2.13). Bird success rate on my study area (42% females, 9% males) was greater
than in Mississippi (13% female, 5% male; Taylor and Burger 1997), but similar to
Figure 2.4: Daily nest survival rate trend and 95% confidence interval for the 203
interval nesting period of northern bobwhites in southwest Florida, 2003 - 2009,
estimated from model averaging the models in suite five.
0.86
0.88
0.9
0.92
0.94
0.96
0.98
1
1 9
17
25
33
41
49
57
65
73
81
89
97
10
5
113
12
1
12
9
13
7
14
5
15
3
16
1
16
9
17
7
18
5
19
3
20
1
DS
R
Day of Nesting Period
DSR Estimate 95% CI

38
Missouri (40% female, 14% male; Burger et al. 1995) and Georgia (35% female; Terhune
et al. 2006).
My estimates of average nesting attempts included birds that incubated a nest and
then died before the end of the nesting period. Burger et al. (1995) estimated average
nesting attempts only for birds that survived the entire nesting period. Consequently, their
results for females (1.8 nests/female) were greater than my estimate (1.23 nests/female).
However, their estimate for males (1.0 nests/male) was similar to BWWMA (1.0
nests/male) indicating that incubating males typically incubate only one nest per nesting
period. Dimmick (1974) reported a 39% nest success rate in Tennessee. His estimate
included nests that were located and failed prior to the incubation stage, and therefore, are
not directly comparable to the BWWMA estimate. The overall success rate for nests
reaching the incubation stage was greater on my study area (57%) than others reported
from telemetry studies in the Southeast (45% - DeVos and Mueller 1993, 34% - Puckett
et al. 1995, 49% - Staller et al. 2002, 54% - Terhune et al. 2006). With the exception of
Pucket et al. (1995), whose study site was primarily in an agriculture landscape, these
southeastern telemetry studies were conducted on areas managed specifically for
bobwhites with high bobwhite densities. The average clutch size of 12.37 eggs on
BWWMA was within the range of other studies throughout the bobwhite range (range
11.5 - 14.0 eggs; Sandercock et al. 2009).
Nest Habitat Selection: I used an arbitrary minimum number of ten locations per
female as the criteria for estimating the average home range size because I was not
attempting to describe and report specific conclusions regarding home range size. Ten
locations coincide with a conservative minimum tracking time of five weeks (assuming
one location every four days) that I believed was sufficient to describe available habitat
for a given female.

39
Average
Male Female Male Female Male Female Male Female Pooled Clutch Size
BWWMA FL 0.9683 0.4766 17 58 9 39 1.02 1.23 52 59 57 12.37
Dimmick 1974 TN . . . . . . . . . . 39 11.90
Devos and Mueller 1993 FL . . . . . . . . . . 45 12.80
Burger et al. 1995 MO 0.9661 0.4523* 29 66 14 40 1.00 1.80 47 61 56 13.82
Pucket et al. 1995 NC . . . . . . . . . . 34 11.70
Taylor and Burger 1997 MS 0.9609 0.4000 7 38 5 13 . . . . . 11.70
Staller et al. 2002 FL . . . . . . . . . . 49 .
Terhune et al. 2006 GA 0.9713 0.5118 . 62 . 36 . . . 54 . .
Rader et al. 2007 TX 0.9593 0.3845 . . . . . . . . . .
Collins et al. 2009 NJ 0.9676 0.4688* 20 69 . . . . . . 43 14.20
Bird Success
(%)
Nests/Nesting
Adult Nest Success (%)
Table 2.13: Average estimates of nesting parameters of northern bobwhites in southwest Florida, 2003 - 2009, and other studies throughout the
bobwhite range.
* Estimates converted from a reported 24-day incubation period survival rate to 23-day incubation period survival rate (DSR23
)
Study State DSR
23-day Incubation
Period Survival
(%)
Nesting Rate
(%)
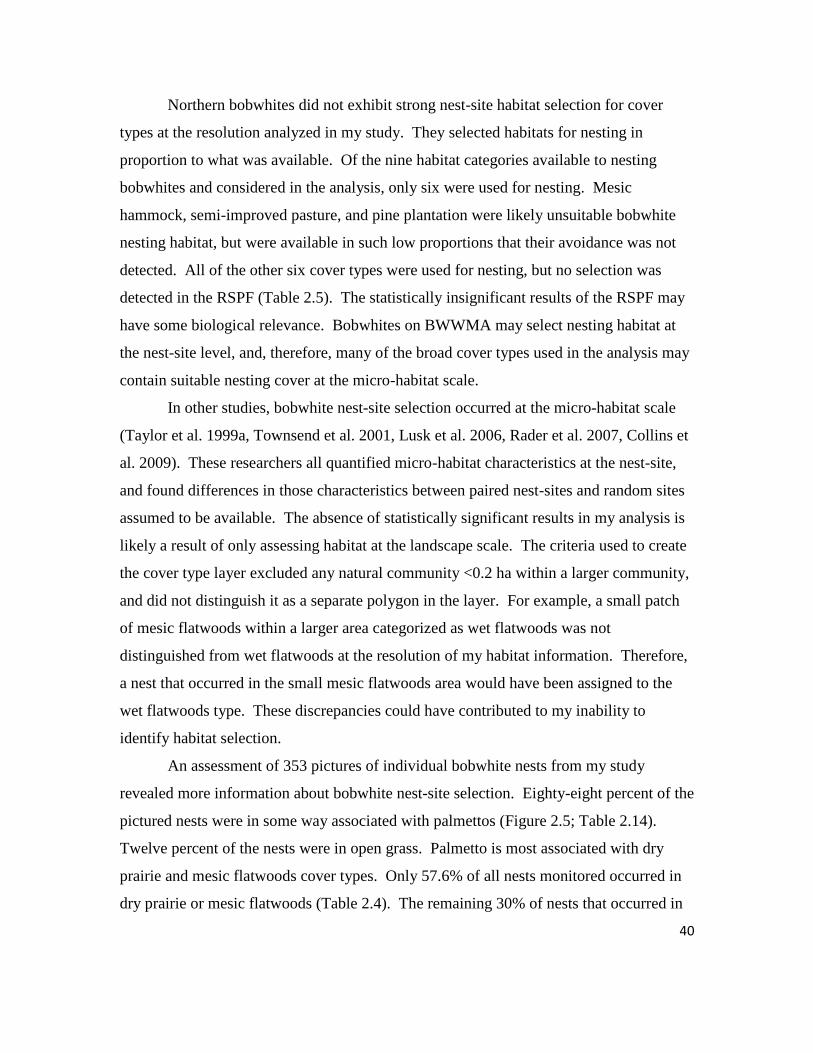
40
Northern bobwhites did not exhibit strong nest-site habitat selection for cover
types at the resolution analyzed in my study. They selected habitats for nesting in
proportion to what was available. Of the nine habitat categories available to nesting
bobwhites and considered in the analysis, only six were used for nesting. Mesic
hammock, semi-improved pasture, and pine plantation were likely unsuitable bobwhite
nesting habitat, but were available in such low proportions that their avoidance was not
detected. All of the other six cover types were used for nesting, but no selection was
detected in the RSPF (Table 2.5). The statistically insignificant results of the RSPF may
have some biological relevance. Bobwhites on BWWMA may select nesting habitat at
the nest-site level, and, therefore, many of the broad cover types used in the analysis may
contain suitable nesting cover at the micro-habitat scale.
In other studies, bobwhite nest-site selection occurred at the micro-habitat scale
(Taylor et al. 1999a, Townsend et al. 2001, Lusk et al. 2006, Rader et al. 2007, Collins et
al. 2009). These researchers all quantified micro-habitat characteristics at the nest-site,
and found differences in those characteristics between paired nest-sites and random sites
assumed to be available. The absence of statistically significant results in my analysis is
likely a result of only assessing habitat at the landscape scale. The criteria used to create
the cover type layer excluded any natural community <0.2 ha within a larger community,
and did not distinguish it as a separate polygon in the layer. For example, a small patch
of mesic flatwoods within a larger area categorized as wet flatwoods was not
distinguished from wet flatwoods at the resolution of my habitat information. Therefore,
a nest that occurred in the small mesic flatwoods area would have been assigned to the
wet flatwoods type. These discrepancies could have contributed to my inability to
identify habitat selection.
An assessment of 353 pictures of individual bobwhite nests from my study
revealed more information about bobwhite nest-site selection. Eighty-eight percent of the
pictured nests were in some way associated with palmettos (Figure 2.5; Table 2.14).
Twelve percent of the nests were in open grass. Palmetto is most associated with dry
prairie and mesic flatwoods cover types. Only 57.6% of all nests monitored occurred in
dry prairie or mesic flatwoods (Table 2.4). The remaining 30% of nests that occurred in

41
palmetto were either in small patches of dry prairie or mesic flatwoods habitat within
larger patches of other habitat, or in palmetto located within the other cover types. Both
are likely because dry prairie and mesic flatwoods can occur in patches <0.2 ha and
palmetto is not completely restricted to dry prairie and mesic flatwoods habitats. No
matter the case, it seems that bobwhites on BWWMA select nest-sites at a much smaller
scale than I analyzed. The abundance of suitable palmetto micro-habitat sites throughout
the major macro-cover types suggests that a lack of suitable nest sites was not a limiting
factor for bobwhite reproduction on BWWMA.
Basin marsh and wet flatwoods cover types, although insignificant in terms of
availability and use, were the only two types used disproportionately more than they were
available (Figure 2.3). The moist nature of both of these cover types may ensure green
vegetation throughout the nesting season supporting adequate insect populations. Insects
are components of the diets of adult and juvenile bobwhites during the summer months
Year n % n %
2003 18 100 3 17 15 83
2004 27 100 2 7 25 93
2005 94 88 3 3 91 97
2006 30 53 2 7 28 93
2007 68 93 11 16 57 84
2008 74 99 15 20 59 80
2009 42 98 6 14 36 86
Pooled 353 88 42 12 311 88
Table 2.14: General site-level nest-site habitat description for northern
bobwhites in southwest Florida, 2003 - 2009. Information gathered from
photographs taken of the nest-sites.
Nests Pictured Nest Location Vegetation
n
% of All
Nests
Grass Palmetto
42
(Stoddard 1931, Rosene 1969), which may explain the disproportionate use of basin
marsh and wet flatwoods.
Daily Nest Survival: The annual chronology of nesting varied widely during my
study (Table 2.6). Frye (1954) observed the pair formation of bobwhites and broods
appearing earlier in years with warm, dry springs. I was unable to find any differences in
average spring temperatures and/or rainfall amounts among years, although I did not have
the precise data to evaluate those relationships in depth. In 2004, heavy rains fell during
mid and late summer and Hurricane Charlie just missed BWWMA on 13 August. The

43
rain and hurricane that summer could have caused bobwhites to prematurely cease
nesting. Also, field work was limited during the latter part of that summer because of
inclement weather; it is possible that some nests were missed. Data collection during the
2009 nesting period suffered similar setbacks because of heavy rains and lack of
manpower in the latter half of the nesting period.
Bobwhite daily nest survival rates changed over time. Parameter estimates for
time generally indicated a negative trend followed by a leveling off at the end of the
nesting season (Table 2.12) portraying a quadratic relationship (Figure 2.4). The 95%
confidence interval for quadratic time included zero in three of the four top models. The
variability can be seen toward the end of the nesting period in the DSR graph (Figure
2.4). Grant et al. (2005) found support for models with linear and quadratic time trends
in their study of two grassland bird species in North Dakota. The ability to evaluate daily
survival rates at such fine time scales has been made possible by recent advancements in
analytical techniques (Dinsmore et al. 2002). Some bobwhite studies have used the
Mayfield (1961) method for calculating daily nest survival rates (Burger et al. 1995,
Harris 1995, Collins et al. 2009). This method allows for the separate analysis of nesting
periods (i.e., egg laying and incubation) but requires daily survival rates to remain
constant within periods. Other studies have used analytical techniques allowing for
bobwhite daily nest survival rates to vary as a function of time (Rader et al. 2007, Potter
et al. 2011). Both Rader et al. (2007) and Potter et al. (2011) tested models allowing
survival rates to vary linearly over time, but neither detected a significant relationship.
They did not develop a model for quadratic time.
My a priori hypothesis of variability in predator population abundance and/or
predator behavior may be supported by the negative DSR trend over time. Staller et al.
(2005) noted that predation rates by bobwhite nest predators varied among years;
however, they did not comment on any changes over the course of a single season.
Raccoon (Procyon lotor), nine-banded armadillo (Dasypus novemcinctus), and Virginia
opossum (Didelphis virginiana) were identified as important bobwhite nest predators in
north Florida and south Georgia (Staller et al. 2005). Reproduction of these predator
species occurs in the spring in Florida (Kern 1991, Smith and Schaefer 1991, Schaefer

44
and Hostetler 1998), which can result in greater abundances of these species in mid to
late summer. Young raccoons and opossums can remain with the mothers for some time
after weaning (Kern 1991, Smith and Schaefer 1991). During this time, the behavior of
the mothers may change, spending less time idle with the young and more time actively
teaching the young to procure food.
During my study, only 28 nests (7.0%) were abandoned. Thirteen nests (3.3%)
were abandoned by the incubating adult for no apparent reason, 7 in May, 3 in June, and
3 in July. Four nests (1.0%) were abandoned because the incubating adult was
depredated off the nest, 2 in May, 1 in July, and 1 in September. Ten nests (2.5%) were
abandoned because the nested was flooded, 7 in June and 3 in July. There was no trend
toward increased abandonment as the nesting season progressed. Also, increased
vulnerability of nests was not apparent. Vegetation provided more cover through growth
as the season progressed. Summer prescribed fires, if used at all, were conducted early in
the nesting season each year to provide ample time for wiregrass regrowth and seed
production. Roller chopping, if used at all, was consistent throughout the nesting season
except for during variable extremely wet periods when it was discontinued. My
hypothesis that increased predator abundance and/or predator behavior may increase nest
failure responsible for the decrease in DSR over time is further supported by these facts.
Another factor could be fluctuations in availability of prey, including nests of
other grassland species, that could distribute predation and relieve pressure on bobwhite
nests. Stoddard (1931:427) commented on the alternate prey theory suggesting that it
may be true in some cases, but in others, more prey may attract more predators increasing
the chance of bobwhite nest predation. Other common ground-nesting bird species that
nested at BWWMA included mourning dove (Zenaida macroura), common ground-dove
(Columbina passerina), common nighthawk (Chordeiles minor), Bachman’s sparrow
(Aimophila aestivalis), and eastern meadowlark (Sturnella magna). On several
occasions, I observed mourning dove nests and unfledged squabs on the ground on
BWWMA. In the Southeast, 80% of mourning dove nests are initiated between 1 April
and 26 August (Otis et al. 2008). Common ground-doves nest from early February to
early October in Florida, but over half of the total nests in a breeding season were

45
initiated between 13 April and 10 June (Bowman and Woolfenden 1997). Information on
common nighthawk nesting in the Southeast is limited, however common nighthawks
nest in June in Texas (Poulin et al. 1996). I observed a common nighthawk nest on
BWWMA on 20 April, 2004 and unfledged common nighthawk chicks on 25 May, 2005.
Bachman’s sparrows in Arkansas nested between 10 April and 26 August with 85% of all
eggs laid between May and July (Haggerty 1988). Eastern meadowlarks nest from March
to August (Lanyon 1995). I found an eastern meadowlark nest on 14 May, 2004 on
BWWMA that was hatched with chicks three days later. Peak bobwhite nesting during
my study occurred between weeks 8 and 15 (27 April to 21 June) of the nesting seasons
(Figure 2.6). While all these species have long nesting seasons in the South, many put
more effort into nesting earlier in the summer than later. This supports my hypothesis
that bobwhite nests may experience relief from predation pressure early in the season
because of a plethora of alternate prey.
Climatic variables did not explain variation in DSR in my study. Rader et al.
(2007) found positive relationships between both temperature and precipitation and
bobwhite nest DSR in southern Texas. Other climatic covariates might have more
effectively captured the relationship between climate and daily nest survival on my study
if one existed. BWWMA is a large study area and climatic variables, particularly
rainfall, may have differed across the region because of the sporadic nature of summer
thunderstorms. I was unable to collect more site-specific climatic information across the
study area, and therefore, these variables may not have been representative of the
conditions occurring at every nest. Alternatively, rainfall and temperature during my
study period may not have been so extreme as to influence bobwhite nest survival.
Although the estimate was consistently negative, the 95% confidence interval for
the WF1000 variable included zero in four of the five top models in which it appeared
(Table 2.12). Therefore, the wet flatwoods cover type did not appear to have a strong
relationship with DSR on my study area. However, its inclusion in five of the top seven
models suggested some level of importance. Wet flatwoods, by description, are wooded
and may harbor known nest predators. Virginia opossums, raccoons, and armadillos

46
inhabit wooded areas (Kern 1991, Smith and Schaefer 1991, Schaefer and Hostetler
1998).
Basin marsh within 1000-m of nests was an important predictor of DSR (Figure
2.7). As nest survival is directly related to fitness and fitness to habitat quality (Van
Horne 1983), nest sites in proximity to areas of basin marsh may be considered
high-quality nesting habitat. The reason for this may be lesser predation pressure (Staller
et al. 2002) and/or shorter distances to food sources for the incubating adults. Insect
abundance and diversity have been found to increase as habitat moisture levels increase
Figure 2.6: Nest incubation activity by week for the 204-day nesting period of northern
bobwhites in southwest Florida, 2003 – 2009. Bars represent the number of nests in the
incubation stage during each week of the breeding period.
0
20
40
60
80
100
120
140
160
Mar
1
Mar
2
Mar
3
Ap
r 4
Ap
r 5
Ap
r 6
Ap
r 7
Ap
r 8
May
9
May
10
May
11
May
12
Jun
13
Jun
14
Jun
15
Jun
16
Jul 1
7
Jul 1
8
Jul 1
9
Jul 2
0
Jul 2
1
Au
g 2
2
Au
g 2
3
Au
g 2
4
Au
g 2
5
Sep
26
Sep
27
Sep
28
Sep
29
# o
f N
ests
Month and Week of Nesting Season
Active Nests

47
(Janzen and Schoener 1968). The moist nature of basin marsh may have supported
abundant insect populations that were an important food source for bobwhites during the
breeding seasons. Incubating bobwhites will attempt to defend the nest from some nest
predators (Staller et al. 2005). Therefore, an incubating adult that had to travel a shorter
distance to a food source might have spent more time at the nest defending it from
predators. Also, the adult itself may have had a lesser chance of being predated as the
travel distance to food, and exposure time to potential predators, decreased.
My a priori approach to determining which habitat variables to include in my nest
DSR analysis was to include only nest buffer compositions of the cover types most
Figure 2.7: Graphical depiction of the relationship between BM1000 and nest
DSR for northern bobwhites in southwest Florida, 2003 – 2009. Graph shows
beta estimate and 95% confidence interval for the BM1000 covariate in the best
model in suite five. Values of other covariates used in the model were 100 for
time and 0 for WF1000.
0.94
0.95
0.96
0.97
0.98
0.99
1
0 0.1 0.2 0.3 0.4 0.5 0.6 0.7 0.8 0.9 1
DS
R
Proportion of BM1000
DSR 95% CI

48
selected for nest sites. However, other cover types were used heavily by nesting
bobwhites, and their compositions around nest sites could have been related to nest DSR.
Future studies may consider an exploratory approach to determine if other cover types
around nest locations have a relationship with nest survival. This may lead to more
informative results with regard to bobwhite habitat management.
The estimate of DSR on my study (0.9683; SE = 0.0024) with the constant
survival model was similar to the DSR from Texas (0.9593 - Rader et al. 2007) (Table
2.13). Burger et al. (1995) reported that DSR was similar for female first nest (0.9692),
renests (0.9458), and male incubated nests (0.9609). Sex was not an important
determinant of DSR in my study (Table 2.7), and my DSR estimates for female (0.9701;
SE = 0.0027) and male (0.9634; SE = 0.0049) incubated nests were like those reported by
Burger et al. (1995) in Missouri. Twenty-three day incubation period nest survival rates
of 0.452 in Missouri (Burger et al. 1995) and 0.469 in New Jersey (Collins et al. 2009)
were reported from study sites with low or declining bobwhite populations in agricultural
settings. They are similar to my 23-day incubation period estimate (0.4766; SE = 0.0269;
Table 2.13). Also, comparable to my estimate, Potter et al. (2011) reported a 23-day
incubation period nest survival rate of 0.495 on a public area in Iowa that had been
undergoing bobwhite management for more than five years. Terhune et al. (2006)
reported a slightly greater 23-day incubation period survival rate (0.512) on Georgia
study sites intensively managed for bobwhites, including supplemental feeding and
predator control. Twenty-three day incubation period survival results from Mississippi
(0.40 - Taylor and Burger 1997) were lower than on BWWMA, however, their study site
was relatively new to bobwhite habitat management. My results compare well to other
bobwhite studies indicating that bobwhites on my study area had similar nest survival
rates to other bobwhite populations with various levels of management intensity, and that
nest survival rates do not vary tremendously across the bobwhite geographic range.
Other ground nesting grassland bird species including eastern meadowlark
[Sturnella magna - 0.927], common ground-dove [Columbina passerine - 0.944], and
common nighthawk [Chordeiles minor - 0.932] had lower DSR in one Florida study
(Perkins and Vickery 2007) than bobwhites on BWWMA. With the exception of the

49
common nighthawk, these estimates included a nestling stage of development that could
have contributed to the lower DSR. Incubation period survival rates would be more
comparable to my results. I used the incubation period for nests of eastern meadowlarks
(13 - 14 days; Lanyon 1995), common ground-doves (12 - 14 days; Bowman 2002) and
common nighthawks (18 days; Brigham et al. 2011) to calculate incubation period
survival rates of 0.359, 0.473, and 0.282 for eastern meadowlarks, common
ground-doves, and common nighthawks, respectively. Bobwhite nests on BWWMA
appear to survive the incubation stage as well as or better than other Florida ground
nesting bird species. Ground nesting passerines likely are vulnerable to a wider array of
mammalian nest predators than bobwhites because small mammals can more readily
consume passerine eggs whereas most small mammals may not be able to directly
consume a bobwhite egg (Ettle et al. 1998).
CONCLUSIONS
Bobwhite nest-site selection in southwest Florida did not differ from available
habitat at the plant community scale. However, compositions of certain cover types
around the nest at the landscape level were related to DSR. Future south Florida
bobwhite research and analyses should test hypotheses of nest-site selection at finer
scales and relate those habitat characteristics to nest survival. This information could
lead to important nest-site-level structural and compositional vegetation characteristics
that have management implications. Furthermore, hypotheses need to be tested as to why
certain cover types or characteristics are important to nest survival (i.e., less predators,
more food, etc.).
Daily nest survival rate varied as a function of linear time throughout the nesting
period, but not by year or as a function of climatic variables. Changes in predator
abundance, alternate prey abundance, or climatic variables not tested in this analysis (i.e.,
site-specific climatic variables) are possible factors related to the decrease in nest survival
during the nesting period. Future research should attempt to identify the factors behind
the relationship between time and bobwhite nest DSR. Relationships existing between

50
variables that can be monitored and nest survival may lead to implications for habitat
management.
My analysis was intended to be descriptive of the reproductive success of
bobwhites in southwest Florida. Two of the results may warrant the attention of
managers in this region. First, basin marsh habitat appears to be positively related to
bobwhite daily nest survival. Maintaining the integrity of this cover type and managing
nesting habitat in and around these communities (i.e., mosaic burns leaving nesting
materials and cover) may promote improved nest success. Second, peak nesting occurred
between late April and late June, and nest survival rates were lowest at the end of the
nesting period (late August to September). Land management conducted during the early
nesting period should be carried out in a way that has the least negative impact on
bobwhite nesting. For example, roller chopping should be restricted to areas with dense
vegetation (i.e., areas least likely to be used for bobwhite nesting). The success of nests
during periods of high nesting rates may be important to juvenile recruitment into the fall
populations.
The bobwhite nesting parameters estimated in my analysis were equal or better
than most other studies from throughout the bobwhite range. Stable and declining
populations with various bobwhite densities had similar nest survival rates to BWWMA.
Therefore, my results suggest that reproduction in the BWWMA bobwhite population is
not clearly responsible for the reported population decline, similar to the conclusions of
Sandercock et al. (2009) that nest survival has a minor bearing on bobwhite population
change.
51
LITERATURE CITED
Anderson, D. R. 2008. Model based inference in the life sciences: a primer on evidence.
Springer, New York, New York, USA.
Arthur, S. M., B. F. J. Manly, L. L. McDonald, and G. W. Garner. 1996. Assessing
habitat selection when availability changes. Ecology 77:215-227.
Black, R. J. 1993. Florida climate data: EES5. University of Florida Institute of Food and
Agricultural Sciences: http://edis.ifas.ufl.edu.
Bowman, R. 2002. Common ground-dove (Columbina passerina). in A. Poole, editor.
The Birds of North America Online. Ithaca: Cornell Lab of Ornithology;
Retrieved from The Birds of North America Online database:
http://bna.birds.cornell.edu/.
Bowman, R., and G. E. Woolfenden. 1997. Nesting chronology of the common ground-
dove in Florida and Texas. Journal of Field Ornithology 68:580-589.
Brennan, L. A. 1991. How can we reverse the northern bobwhite population decline?
Wildlife Society Bulletin 19:544-555.
_____. 1999. Northern bobwhite (Colinus virginianus). in A. Poole, editor. The Birds of
North America Online. Ithaca: Cornell Lab of Ornithology; Retrieved from The
Birds of North America Online database: http://bna.birds.cornell.edu/.
Brennan, L. A. and W. P. Kuvlesky. 2005. Invited paper: North American grassland
birds: an unfolding conservation crisis? Journal of Wildlife Management 69:1-13.
Brigham, R. M., J. Ng, R. G. Poulin, and S. D. Grindal. 2011. Common nighthawk
(Chordeiles minor). in A. Poole, editor. The Birds of North America Online.
Ithaca: Cornell Lab of Ornithology; Retrieved from The Birds of North America
Online database: http://bna.birds.cornell.edu/.
Burger, L. W., Jr., M. R. Ryan, T. V. Dailey, and E. W. Kurzejeski. 1995. Reproductive
strategies, success, and mating systems of northern bobwhite in Missouri. Journal
of Wildlife Management 59:417-426.
Burnham, K. P., and D. R. Anderson. 2002. Model selection and multimodel inference: a
practical information-theoretic approach. 2nd edition. Springer, New York, New
York, USA.
Collins, B. M., C. K. Williams, and P. M. Castelli. 2009. Reproduction and microhabitat
selection in a sharply declining northern bobwhite population. The Wilson Journal
of Ornithology 121:688-695.

52
Cooper, S. M., J. C. Cathey, D. L. Alford, and S. S. Sieckenius. 2009. Influence of
rainfall, type of range, and brush management on abundance of northern
bobwhites (Colinus virginianus) in southern Texas. Southwestern Naturalist
54:13-18.
Curtis, O. E., R. N. Rosenfield, and J. Bielefeldt. 2006. Cooper's hawk (Accipiter
cooperii). in A. Poole, editor. The Birds of North America Online. Ithica: Cornell
Lab of Ornithology.
Davis, S. K., R. M. Brigham, T. L. Shaffer, and P. C. James. 2006. Mixed-grass prairie
passerines exhibit weak and variable responses to patch size. Auk 123:807-821.
DeVos, T., Jr., and B. S. Mueller. 1993. Reproductive ecology of northern bobwhite in
north Florida. Pages 83-90 in K. E. Church, andT. V. Dailey, editors. Quail III:
National Quail Symposium. Kansas Department of Wildlife and Parks, Pratt, KS.
Dimmick, R. W. 1971. The influence of controlled burning on nesting patterns of
bobwhite in west Tennessee. Proceedings of the Annual Conference of the
Southeastern Association of Fish and Wildlife Commissions 25:149-155.
_____. 1974. Populations and reproductive effort among bobwhites in western
Tennessee. Proceedings of the Annual Conference of the Southeastern
Association of Fish and Wildlife Commissions 28:594-602.
Dimmick, R. W., M. J. Gudlin, and D. F. McKenzie. 2002. The Northern Bobwhite
Conservation Initiative. Miscellaneous publication of the Southeastern
Association of Fish and Wildlife Agencies, South Carolina, USA.
Dinsmore, S. J., G. C. White, and F. L. Knopf. 2002. Advanced techniques for modeling
avian nest survival. Ecology 83:3476-3488.
Ettle, T. L., D. A. Buehler, and A. E. Houston. 1998. Egg size and cotton rat predation.
Wilson Bulletin 110:575-578.
Frye, O. E. J. 1954. Charlotte County quail investigation. Report: Pittman-Robertson
Project Florida W-11-2.
Grant, T. A., T. L. Shaffer, E. M. Madden, and P. J. Pietz. 2005. Time-specific variation
in passerine nest survival: new insights into old questions. Auk 122:661-672.
Guthery, F. S., C. L. Land, and B. W. Hall. 2001. Heat loads on reproducing bobwhites in
the semiarid subtropics. Journal of Wildlife Management 65:111-117.
Guthery, F. S., A. R. Rybak, S. D. Fuhlendorf, T. L. Hiller, S. G. Smith, W. H. Puckett,
and R. A. Baker. 2005. Aspects of the thermal ecology of bobwhites in north
Texas. Wildlife Monographs:1-36.

53
Haggerty, T. M. 1988. Aspects of the breeding biology and productivity of Bachman's
sparrow in central Arkansas. Wilson Bulletin 100:247-255.
Harris, B. W., II. 1995. Nesting success and nesting ecology of northern bobwhite in
western Tennessee. M.S. Thesis. University of Tennessee, Knoxville, TN.
Hernández, F., F. Hernández, J. A. Arredondo, F. C. Bryant, L. A. Brennan, and R. L.
Bingham. 2009. Influence of precipitation on demographics of northern
bobwhites in southern Texas. Wildlife Society Bulletin 33:1071-1079.
Janzen, D. H., and T. W. Schoener. 1968. Differences in Insect Abundance and Diversity
Between Wetter and Drier Sites During a Tropical Dry Season. Ecology 49:96-
110.
Johnson, D. H. 1980. The comparison of usage and availibility measurements for
evaluating resource preference. Ecology 61:65-71.
Kern, W. H., Jr. 1991. Raccoons:WEC34. University of Florida Institute of Food and
Agricultural Sciences: http://edis.ifas.ufl.edu.
Lanyon, W. E. 1995. Eastern Meadowlark (Sturnella magna). in A. Poole, editor. The
Birds of North America Online. Ithaca: Cornell Lab of Ornithology; Retrieved
from The Birds of North America Online database: http://bna.birds.cornell.edu/.
Laver, P. N. 2005. ABODE: kernal home range estimation for ArcGIS, using VBA and
ArcObjects, Beta v. 2. http://filebox.vt.edu/users/plaver/abode/home.html.
Lusk, J. J., F. S. Guthery, and S. J. DeMaso. 2001. Northern bobwhite (Colinus
virginianus) abundance in relation to yearly weather and long-term climate
patterns. Ecological Modelling 146:3-15.
Lusk, J. J., F. S. Guthery, R. R. George, M. J. Peterson, and S. J. DeMaso. 2002. Relative
abundance of bobwhites in relation to weather and land use. Journal of Wildlife
Management 66:1040-1051.
Lusk, J. J., S. G. Smith, S. D. Fuhlendorf, and F. S. Guthery. 2006. Factors influencing
northern bobwhite nest-site selection and fate. Journal of Wildlife Management
70:564-571.
Mayfield, H. 1961. Nesting success calculated from exposure. The Wilson Bulletin
73:255-261.
Miley, B. D., and M. Lichtler. 2006. Influence of habitat, fire, and weather on bobwhite
abundance at Avon Park Air Force Range, Florida. Pages 193 - 209 in S. B.
Cederbaum, B. C. Faircloth, T. M. Terhune, J. J. Thompson, andJ. P. Carroll,

54
editors. Gamebird 2006: Quail VI and Perdix XII. Warnell School of Forestry and
Natural Resources, Athens, GA, USA.
Otis, D. L., J. H. Schulz, D. Miller, R. E. Mirarchi, and T. S. Basket. 2008. Mourning
Dove (Zenaida macroura). in A. Poole, editor. The Birds of North America
Online. Ithaca: Cornell Lab of Ornithology; Retrieved from The Birds of North
America Online database: http://bna.birds.cornell.edu/.
Perkins, D. W., and P. D. Vickery. 2005. Effects of altered hydrology on the breeding
ecology of the Florida grasshopper sparrow and Bachman's sparrow. Florida Field
Naturalist 33(2):29-40.
_____. 2007. Nest success of grassland birds in Florida dry prairie. Southeastern
Naturalist 6:283-292.
Potter, L. M., D. L. Otis, and T. R. Bogenschutz. 2011. Nest success of northern
bobwhite on managed and unmanaged landscapes in southeast Iowa. Journal of
Wildlife Management 75:46-51.
Poulin, R. G., S. D. Grindal, and R. M. Brigham. 1996. Common Nighthawk (Chordeiles
minor). in A. Poole, editor. The Birds of North America Online. Ithaca: Cornell
Lab of Ornithology; Retrieved from the Birds of North America Online:
http://bna.birds.cornell.edu/bna/species/213.
Powell, L. A. 2007. Approximating variance of demographic parameters using the delta
method: a reference for avian biologists. Condor 109:949-954.
Pranty, B. 2000. Three sources of Florida grasshopper sparrow mortality. Florida Field
Naturalist 28(1):27-29.
Puckett, K. M., W. E. Palmer, P. T. Bromley, J. R. Anderson, Jr., and T. L. Sharpe. 1995.
Bobwhite nesting ecology and modern agriculture: a management experiment.
Proceedings of the Annual Conference Southeastern Association of Fish and
Wildlife Agencies 49:505-515.
Rader, M. J., L. A. Brennan, F. Hernandez, N. J. Silvy, and B. Wu. 2007. Nest-site
selection and nest survival of northern bobwhite in southern Texas. Wilson
Journal of Ornithology 119:392-399.
Roseberry, J. L., and W. D. Klimstra. 1984. Population ecology of the bobwhite.
Southern Illinois University Press, Carbondale, USA.
Rosene, W. 1969. The bobwhite quail: its life and management. Rutgers University Press,
New Brunswick, New Jersey, USA.

55
Sandercock, B. K., W. E. Jensen, C. K. Williams, and R. D. Applegate. 2009.
Demographic sensitivity of population change in northern bobwhite. Journal of
Wildlife Management 72:970-982.
Schaefer, J. M., and M. E. Hostetler. 1998. The nine-banded armadillo (Dasypus
novemcinctus): WEC76. University of Florida Institute of Food and Agricultural
Sciences: http://edis.ifas.ufl.edu.
Smith, R., and J. Schaefer. 1991. Opossums: WEC28. University of Florida Institute of
Food and Agricultural Sciences: http://edis.ifas.ufl.edu.
Staller, E. L., W. E. Palmer, and J. P. Carroll. 2002. Macrohabitat composition
surrounding successful and depredated northern bobwhite quail nests. Pages 61-
64 in S. J. DeMaso, J. W. P. Kuvlesky, F. Hernández, andM. E. Berger, editors.
Quail V: Proceedings of the Fifth National Quail Symposium. Texas Parks and
Wildlife Department, Austin, TX.
Staller, E. L., W. E. Palmer, J. P. Carroll, R. P. Thornton, and D. C. Sisson. 2005.
Identifying predators at northern bobwhite nests. Journal of Wildlife Management
69:124-132.
Stoddard, H. L. 1931. The bobwhite quail: its habits, preservation and increase. Charles
Scribner's Sons, New York, New York, USA.
Taylor, J. D., II, and L. W. Burger, Jr. 1997. Reproductive effort and success of northern
bobwhite in Mississippi. Proceedings of the Annual Conference Southeastern
Association of Fish and Wildlife Agencies 51:329-341.
_____. 2000. Habitat use by breeding northern bobwhites in managed old-field habitats in
Mississippi. Pages 7-15 in L. A. Brennan, W. E. Palmer, L. W. Burger, Jr., andT.
L. Pruden, editors. Quail IV: Proceedings of the Fourth National Quail
Symposium. Tall Timbers Research Station, Tallahassee, FL.
Taylor, J. S., K. E. Church, and D. H. Rusch. 1999a. Microhabitat selection by nesting
and brood-rearing northern bobwhite in Kansas. Journal of Wildlife Management
63:686-694.
Taylor, J. S., K. E. Church, D. H. Rusch, and J. R. Cary. 1999b. Macrohabitat effects on
summer survival, movements, and clutch success of northern bobwhite in Kansas.
Journal of Wildlife Management 63:675-685.
Terhune, T. M., D. C. Sisson, and H. L. Stribling. 2006. The efficacy of relocating wild
northern bobwhites prior to breeding season. Journal of Wildlife Management
70:914-921.

56
Townsend, D. E., II, R. E. Masters, R. L. Lochmiller, D. M. Leslie, Jr., S. J. Demaso, and
A. D. Peoples. 2001. Characteristics of nest sites of northern bobwhites in western
Oklahoma. Journal of Range Management 54:260-264.
Van Horne, B. 1983. Density as a misleading indicator of habitat quality. Journal of
Wildlife Management 47:893-901.
White, G. C., S. H. Schweitzer, C. T. Moore, I. B. Parnell, L. A. Lewis-Weis, and
Peterson. 2009. Evaluation of the landscape surrounding northern bobwhite nest
sites: a multiscale analysis. Journal of Wildlife Management 69:1528-1537.
White, G. C., and K. P. Burnham. 1999. Program MARK: survival estimation from
populations of marked animals. Bird Study 46:120-139.
Ziolkowski, D. J., Jr, K. L. Pardieck, and J. R. Sauer. 2010. The 2003 - 2008 summary of
the North American breeding bird survey. Bird Populations 10:90-109.

57
PART III
OVER-WINTER SURVIVAL OF A NORTHERN BOBWHITE (Colinus
Virginianus) POPULATION IN SOUTHWEST FLORIDA
58
ABSTRACT
I estimated over-winter survival and addressed six management oriented
questions for a hunted northern bobwhite population in southwest Florida over a 6-year
study period. I modeled over-winter (1 October to 31 March) survival using Program
MARK for six winter periods as a function of temporal, spatial, hunting pressure,
climatic, and habitat variables. Model selection results indicated that survival varied over
space and time, and that hunting pressure was the single most important factor related to
over-winter survival. Other factors related to over-winter survival were pre-hunt
bobwhite density and temperature. For the over-winter period across the six years of
study, the survival rate averaged 0.402 (SE = 0.023) and the harvest rate averaged 38%
during the regular hunting season. Survival decreased as harvest rate increased indicating
that some level of harvest was additive to natural mortality during the over-winter period.
Management practices of food strip planting and prescribed burning were not directly
related to over-winter survival. Lowering harvest rates through reduced hunting pressure
may be the single most effective management action to increase bobwhite over-winter
survival and potentially stabilize the local bobwhite population.
INTRODUCTION
Northern bobwhite (hereafter “bobwhite”) hunting is a popular sport and is deeply
engrained in the heritage of many families throughout the bobwhite’s range. Not only is
bobwhite hunting part of a culture, it is important for economic and conservation reasons.
In 1991, bobwhite hunters in the Southeast spent about $95 million on their sport; spent
in rural communities with few other sources of income (Burger et al. 1999). The loss or
decline of local bobwhite populations could therefore be detrimental to those small
communities that rely on bobwhites and the hunters they attract. Also, the management
and conservation of bobwhites are funded in part by hunter dollars. Bobwhite
constituency groups are largely responsible for public awareness and financial resources
that aid in the management of bobwhites and their habitat (Burger et al. 1999).
Management for bobwhites also provides suitable habitat for a number of other grassland
avian species (Giocomo et al. 2008).

59
Although, reliable bobwhite survival and abundance estimates can be obtained
from well designed studies, factors limiting survival and abundance are difficult to
isolate. Weather conditions and fluctuations in predator populations can have
tremendous effects on bobwhite populations (Landers and Mueller 1986). Understanding
the relationships between bobwhite populations, hunting pressure, and harvest is
important because these parameters can be managed. Many studies that focus in part on
these relationships have been conducted over the years (Frye 1954, Roseberry and
Klimstra 1984, Burger et al. 1995, Guthery et al. 2004, Williams et al. 2009).
In the past, it was thought that harvest had little effect on a bobwhite population’s
fluctuations and that harvest only affected the composition of a bobwhite population and
not its abundance (Frye 1954). Bobwhites may exhibit density dependent responses
when hunted such that populations experience greater recruitment (Frye 1954, Roseberry
and Klimstra 1984). Yet this is only one factor in a complex combination of limiting
factors contributing to the success or failure of local bobwhite populations.
More recently, biologists have concluded that harvest can be additive or
compensatory to natural mortality depending on the level or intensity of the harvest.
Harvest may stimulate compensation by increasing reproductive effort, although the
amount of compensation may be insufficient to offset the impact of harvest in some
situations (Roseberry and Klimstra 1984). Williams et al. (2009) found that over-winter
survival decreased from 47.9% on non-hunted to 20.9% on hunted study sites and
concluded that a harvest rate >60% was additive to natural mortality. Another study
found that harvest rates >30% will cause a bobwhite population to decline (Landers and
Mueller 1986). It is clear that a better understanding of the impact of harvest is needed
and that harvest may affect bobwhite populations differently throughout the geographic
range.
Reductions in harvest mortality may be necessary when the focus of management
is stabilizing or increasing bobwhite populations (Burger et al. 1995). Various methods
have been used to attempt to decrease harvest of bobwhites including reduced bag limits,
quotas, and restricted access. All methods reduce the opportunity of individual hunters to
hunt. Reducing the bag limit in bobwhite populations with low numbers may affect the

60
daily harvest of only a small percentage of hunters (Guthery et al. 2004). Since many
hunters rarely approach the daily bag limit in these small populations, lowering the bag
limit has little effect on the total harvest of populations. Other methods of harvest
reduction should be explored and their impacts understood including how much they
decrease hunting opportunity.
Climatic factors such as temperature and rainfall have been related to bobwhite
abundance (Lusk et al. 2001, Hernández et al. 2009). Robel and Kemp (1997) reported
that winter bobwhite mortality increased with extended periods of low temperatures and
snow cover in Kansas. In the Deep South, extreme amounts of precipitation and cold
temperatures are uncommon. However, cool, moist conditions are thought by hunters to
be the most conducive for locating bobwhite coveys. Therefore, temperature and
precipitation may be related to harvest, and consequently, to survival during the hunting
season.
Habitat characteristics and management have also been related to over-winter
survival. Terhune et al. (2007) concluded that habitat suitability and recent habitat
manipulations were two likely reasons for site variability in their estimates of over-winter
survival of bobwhites in Georgia. Escape cover is a habitat characteristic that is
important for bobwhites (Stoddard 1931, Rosene 1969) and has been identified as a
limiting factor related to bobwhite population survival (Brennan 1991). Prescribed fire
and the establishment of food strips alter the amounts of both escape cover and food
available on the landscape. Robel and Kemp (1997) reported that winter survival of
bobwhites near food plots was greater than survival of bobwhites far from food plots in
Kansas. Other researchers found similar results in Oklahoma with regard to
supplemental feeding of bobwhites (Townsend et al. 1999).
I evaluated over-winter (1 October – 31 March) survival of bobwhites in
southwestern Florida from 2003 – 2009. The objectives of my study were to (1) model
over-winter survival of bobwhites related to hunting pressure and spatial, temporal,
biological, and climatic factors, and (2) answer specific management oriented questions
related to over-winter survival: (a) what was the relationship between sesbania food strips
and over-winter survival?, (b) what was the relationship between prescribed fire the
61
previous winter and over-winter survival?, (c) what level of hunting pressure during the
regular hunt period was related to harvest rates of 15, 20, and 30%?, (d) what were the
harvest rates during the regular hunt and zone F hunt each year?, (e) what was the
relationship between harvest mortality and over-winter survival?, and (f) was the pre-hunt
density the following year related to over-winter survival?
STUDY AREA
The study was conducted on the Fred C. Babcock-Cecil M. Webb Wildlife
Management Area (hereafter “BWWMA”). BWWMA is a 26,302-ha state-owned
wildlife management area managed by the Florida Fish and Wildlife Conservation
Commission, located about 8 km east of Punta Gorda, Charlotte County, Florida. The
habitat was southern pine flatwoods with south Florida slash pine (Pinus elliottii var.
densa) dominating the overstory. Other tree species included cabbage palm (Sabal
palmetto), live oak (Q. virginiana), and laurel oak (Q. laurifolia). The understory was
dominated by saw palmetto (Serenoa repens) intermixed with other woody shrub species
such as southern waxmyrtle (Myrica cerifera), gallberry (Illex glabra), and dwarf live
oak (Q. minima). Herbaceous vegetation in the understory included broomsedge
(Andropogon spp.), wiregrass (Aristida stricta), and slough grass (Scleria muhlenbergii).
Sesbania (Sesbania sp.) food strips were planted each spring to provide food and cover
for bobwhites and other species throughout the fall and winter months. Seasonal and
perennial ponds and wetlands of various sizes were dispersed throughout the landscape.
Frye (1954) described BWWMA’s vegetation, geology, soils, and land uses in detail.
Prior to the initiation of the bobwhite study, BWWMA was divided into five hunt
zones to be used as treatment areas for various hunting regulations. Zones were labeled
A, B, C, D, and F and ranged from 3,132 ha to 6,258 ha (Figure 3.1). In most cases zone
boundaries were delineated by barbed wire fences. Zones A – D were the largest in size.
Bobwhite hunting was allowed on them four days each week for six weeks throughout
the regular BWWMA quail hunting season from mid-November through the end of
December. Zone F was the smallest zone. Bobwhite hunting was allowed only on two
consecutive days in late January each year.

62
Wildlife management on BWWMA included cattle grazing, prescribed fire, and
roller chopping to maintain early successional habitat. Grazing was permitted in various
sections of zones A, B, C, and D at various times of year throughout the study. Each
year, prescribed fires were implemented from December to March. The majority of the
BWWMA (i.e., 50 – 100%) was prescribe-burned each year. Summer burns were added
to the burn plan to promote seed production of wiregrass. Roller chopping occurred year
round to reduce saw palmetto coverage, set back overall habitat succession and promote
vegetation growth.
Figure 3.1: Babcock-Webb Wildlife Management Area in southwest Florida
with five hunt management zones, 2002 - 2009.

63
METHODS
Field Methods
Trapping: I began trapping bobwhites on the study area in October 2002 and
continued year round until 31 March 2009. Trapping ceased for six weeks in zones A-D
each year during the regular BWWMA quail hunting season and for two days in zone F
during the quota bobwhite hunt each January. I used six trapping methods throughout the
study: baited funnel trap, funnel live decoy trap, night mist netting using radio telemetry,
night cast netting using radio telemetry, diurnal cast netting using radio telemetry, and
diurnal cast netting using bird dogs.
I utilized baited funnel traps year round for the entire duration of the study. Traps
were constructed of 2.54 x 5.08 cm welded wire and were 76.20 x 76.20 cm and about
25.40 cm tall, resembling the Stoddard (1931) trap. Two funnels constructed of the same
welded wire were placed on opposite sides of each trap offset from each other. Initially, I
placed traps at varying intervals along roads and fire breaks and baited the traps with
milo (Sorghum spp.). Because wild hogs regularly disrupted or destroyed baited traps, I
changed the bait to wild bird seed, which included only a small amount of milo and corn
(Zea mays) to reduce the attraction to hogs. I also modified trap locations and placed
them where I observed bobwhites. After setting, I covered the trap with cut palmetto or
cabbage palm fronds for camouflage and to resemble escape cover. I checked traps twice
daily, in early morning and late evening. The traps were typically left set until they were
moved.
I used pen-reared female bobwhites as live decoys in funnel traps during the
breeding season (April to October). I constructed holding cubes to contain the live
females inside the traps. The cubes were built using the same welded wire that was used
for the funnel traps, 20.32 cm wide by 20.32 cm deep by 15.24 cm tall, with one side
hinged allowing opening to insert and remove the female bobwhite decoys. The floor of
the cube was solid and made of white corrugated plastic. I placed traps where males had
been observed, and I did not restrict the traps to roads and firebreaks. I placed wild game
callers (Western Rivers, Lewisburg, TN) broadcasting female bobwhite calls at many of
64
the trap sites to attract males and to entice the female decoys to call. I incorporated bait
with this method in August to October to further entice birds into the live decoy traps.
I tried night mist netting during fall and winter 2003 to 2004. Using radio
telemetry, I located coveys at night and set two mist nets in a “V” shape adjacent to the
roosting covey. Once set, I attempted to flush the birds into the nets. This procedure was
done at night because it was discovered that the coveys were less likely to run or flush
before the nets could be set. The greatest success with this method was on the darkest,
coldest nights.
In January 2003, I first attempted to throw a cast net over a covey pointed by bird
dogs. I tried various net sizes and weights over the years, but the most success was with
2.74-m radius nets with about 1.48 kg of lead weight per meter. The small, light nets
were easier to throw and open. Extra weight did not seem to be necessary to keep birds
under the net in most cases. This turned out to be an important addition to my trapping
strategy for radio-tagging birds in “new” coveys (coveys that previously had no radioed
quail). I used cast nets with dogs mostly in the fall and winter when the bobwhites were
in coveys.
I began using cast nets to capture additional bobwhites in coveys with at least one
radioed bird shortly after I discovered the use of cast nets with bird dogs. I located
bobwhites by radio telemetry and, depending on the number of workers at the site, threw
1 to 3 cast nets onto the covey. I used this method in the fall and winter when the
bobwhites were in coveys.
Handling and Marking: After capture, birds were held in cloth bags until they
could be processed, typically immediately after capture. Processing of each bird included
recording age, sex, and mass (g). I determined age and sex by plumage (Rosene 1969). I
placed bobwhites in a short shear stocking for containment to determine mass with a
300-g spring scale. Every captured bird was tagged with a uniquely numbered aluminum
leg band. I also fitted birds of both sexes and age classes weighing >130 g with a 6 – 7-g
neck loop radio transmitter (American Wildlife Enterprises, Monticello, FL). After a bird
was processed, I released it at its point of capture. Total processing time averaged 10
minutes.

65
Radio telemetry: I attempted to locate radio-tagged birds once every 4 days.
Because of limited manpower, equipment malfunction, and inclement weather, some
bobwhites were located at greater time intervals. I located radioed bobwhites using
R4000 telemetry receivers and 3-element yagi antennas (Advanced Telemetry Systems,
Isanti, MN). To estimate radio locations, I approached within 20 m of each radio-tagged
bird. I marked each bird’s location using Trimble Geoexplorer 3 GPS receivers (Trimble
Navigation Limited, Sunnyvale, CA) by entering an azimuth and distance to the bird’s
actual location into the GPS unit. If the bird was seen running or flushed, I determined
the exact location of the bird. Other information recorded in the GPS unit at the time of
marking a location was the date, time, and hunt zone.
Harvest Data Collection: Harvest records were collected from the bobwhite
hunting seasons on BWWMA from 2002 to 2009. All hunters were required to check
their harvest at the one and only check station when leaving the area. The hunters
showed harvested bobwhites to the check-station attendants and were asked to estimate
the number of crippled birds they could not retrieve. All bobwhites were checked by the
check station attendants for radio collars and/or leg bands. During the first three days of
the hunting season, wings were collected and aged from each checked bird. Records
from the check station include the daily and total number of bobwhites harvested per
zone by sex, the daily and total number of radio-collared bobwhites harvested per zone
by sex, and the daily and total hunter days for each zone.
From 2002 through 2006, harvest regulations were the same for the regular
BWWMA quail hunt. These regulations allowed hunting only on Wednesday, Thursday,
Saturday, and Sunday for a 6-week period from the middle of November to the end of
December. Only 10 hunters were allowed each hunt-day in zones A and B; and zones C
and D accommodated the rest of the hunters each day with no limit to the amount of
hunter days.
Regulations were altered for the 2007 and 2008 regular hunting seasons. The
days of hunting and the maximum (6 week) season length stayed the same, but there was
an overall hunter-day quota allotted to the 2007 and 2008 seasons. The average total
hunter-days from 2002 – 2006 was 1141. Total hunter-days were reduced to 876 in 2007

66
and 849 in 2008. In 2007, daily hunter-days were kept as even as possible after each
zone received 10 hunters. The hunting season ended for all zones on the day when the
overall hunter-day quota was reached. In 2008, regulations were similar to 2007 except
that the total allotted hunter-days were divided among the zones. For instance, when
zone C reached its quota of 212 hunter days, it was closed to quail hunting for the season
and only the other zones could be chosen.
Data Analysis
Over-winter survival: I used Program MARK known-fate models to estimate
over-winter survival of 1549 bobwhites on BWWMA in southwest Florida from winters
2003 – 2004 to 2008 – 2009 (White and Burnham 1999). I omitted the 2002 – 2003 data
because the sample size was smaller during that over-winter period. I used several
covariates to evaluate a priori hypotheses about factors influencing over-winter survival.
My encounter histories were set up as twelve 2-week periods and one 1-week period
totaling 13 periods for each over-winter season. I structured my encounter histories as
two-week intervals to meet the assumption of known-fate models that the fate of all
marked individuals is known within each encounter period. For each year, I started the
two-week period divisions at the beginning of the regular hunting season (i.e.,
Wednesday each year) and based all other periods on that starting point. I set up the
encounter periods this way because I wanted to keep the hunting periods in the same
over-winter period each year (i.e., periods 4, 5, and 6 of the 13 over-winter periods
contained the main hunt each year). This approach also caused the field trial hunt to be in
the same over-winter period each year (period 9) except for the 2008 – 2009 over-winter
period when it occurred during period 8.
For the global over-winter survival analysis, I used a hierarchical modeling
approach with four preliminary model suites, a fifth model suite comparing the top
models from the preliminary suites, and a sixth suite with meaningful combinations of the
best models from the fifth suite. I chose this hierarchical approach to avoid the many
possible combinations of models including all variables, an approach that could lead to
biologically implausible results (Anderson 2008). I used Akaike’s information criterion
(AICc) for model selection (Burnham and Anderson 2002). Within each preliminary
67
model suite, I used evidence ratios to determine which model(s) had enough support to
include in the comprehensive model suite. Evidence ratios (hereafter “ER”) are
calculated within a model suite as
ER = wmin / wi
where wmin is the Akaike weight (w) for the best model in the suite and wi is the
individual w for all the models in the suite (i = 1, 2, …..i) (Anderson 2008). Following
this ratio, the best model will have ER = 1. All other models will have ER >1 with less
support as the ER gets larger. ER are likened to odds ratios with raffle tickets, where an
evidence ratio of 100 is for model wi equivalent to model wi having 1 raffle ticket
compared to model wmin having 100 raffle tickets in a drawing to determine which model
is most likely given the data (Anderson 2008). Anderson (2008) suggested that an
arbitrary cutoff for model selection (i.e., ∆AICc ≤2) should not be used. I considered all
models within each preliminary suite, and decided which models to pass to the
comprehensive suite based on the range and relative difference of the ER.
In the first model suite, I evaluated models with grouping variables of sex and age
as well as models estimating survival with temporal variation (Table 3.1). I modeled sex
and age effects on survival because behavior and experience differences could result in
gender and age specific survival (Burger et al. 1995, Suchy and Munkel 2000, Taylor et
al. 2000). I expected survival to differ each year because of variation in hunting pressure,
hunter behavior, regulation changes, weather patterns, and predator abundance. I
expected within-year time to be a factor because I hypothesized that survival would be
lower during the hunting periods. I evaluated several models allowing survival to vary
differently over periods of time to determine which, if any, patterns daily survival
exhibited throughout the over-winter period. I added sex and age to the time models with
most support in all possible combinations.
In the second model suite, I evaluated the effects of climatic factors on
over-winter survival (Table 3.1). I included covariates of the number of days within each
encounter period with measureable rainfall, the average rainfall per encounter period, and

68
the mean temperature for each encounter period. The over-winter period is typically dry
and mild in south Florida. Therefore, I wasn’t expecting any major influences of these
covariates. However, from personal experience and according to hunters, bobwhites are
located more readily by bird dogs on cool days and just after or during rain. For this
reason, I included these covariates to determine if they influenced over-winter survival,
particularly during the hunting seasons. For each of the rainfall and temperature
covariates, I evaluated the constant influence on survival. For example, the constant
influence of temperature model estimated one beta (i.e., slope) for the relationship
between temperature and survival. I also evaluated the climatic covariate influences on
survival separately during the no-hunting and hunting periods. For example, the separate
influence of temperature model estimated two betas, one for the relationship of
temperature to survival during the no-hunting periods, and one for the relationship of
temperature to survival during the hunting periods. I did this because I hypothesized that
rainfall and temperature do not affect survival during no hunting periods, but may affect
survival during the hunting periods. First, I evaluated models with one covariate in each,
and then combined the models with the most support in all possible combinations. I did
not combine the two rainfall covariate models as I considered these to be redundant.

69
I evaluated habitat covariates as well as hunting zone as factors influencing
over-winter survival in the third model suite (Table 3.1). Hunting zone was a grouping
variable. Bobwhites did occasionally move from zone to zone. For analysis purposes,
each bobwhite was assigned to only one zone per over-winter period. If a bobwhite died,
it was assigned to the zone in which it died. If a bobwhite survived the over-winter
period, it was assigned to the zone in which it was located most frequently. Habitat
covariates were specific to each hunt zone and varied from bird to bird according to the
hunt zone in which they were assigned. The covariates were the percentage of mesic
Hunting Zones applied separately to no hunting and hunting periods S(NHZone)
IV
III
II
I
Total Season Hunting Pressure (Hunter Days/1000 ha)
Pre-hunt bobwhite density applied separately to no hunting and hunting periodsPre-hunt bobwhite density
Climate
Models
Habitat
Models
Hunting
Models
Time
Hunting Zones
% Food Strips within hunting zone
Quadratic Time
Linear Time
S(NHDENS)S(DENS)S(THP)S(PHP)
% Mesic Flatwoods applied separately to no hunting and hunting periods S(NHMF)
% Food Strips applied separately to no hunting and hunting periods S(NHFP)
% Burned applied separately to no hunting and hunting periods S(NHBURN)
% Dry Prairie applied separately to no hunting and hunting periods S(NHDP)
S(T)
S(BURN)% of hunting zone that was burned the previous winter
Encounter period Hunting Pressure (Hunter Days/1000 ha)
S(TT)
Cubic Time S(TTT)
Sex S(Sex)
S(FP)
S(NHAvgRain)
Days of rainfall applied separately to no hunting and hunting periods S(NHDayRain)
Average rainfall applied separately to no hunting and hunting periods
S(Zone)
% Mesic Flatwoods within hunting zone S(MF)
% Dry Prairie within hunting zone S(DP)
S(DayRain)
Average temperature (°F) during encounter period
S(NHAvgTemp)
Days of rainfall during eoncounter period
Average daily rainfall (cm) during encounter period S(AvgRain)
Average temp applied separately to no hunting and hunting periods
S(AvgTemp)
Table 3.1: Description of the core models and the corresponding model notation in the four preliminary model suites for the
over-winter survival analysis of northern bobwhites in southwest Florida, 2003 - 2009. A constant survival model [S(.)] and
combinations of the models listed here were evaluated within each model suite.
Model Suite NotationYear S(year)
Model
Group
and Time
Models
S(t)
Age S(Age)
Time (Pre-hunt, Hunt, Post hunt, Field trial hunt, Post field trial hunt) S(PreHuntPostFTHPostFTH)
Time (Pre-hunt, All hunts, Post hunt) S(PreHuntPost)
Time (No hunting, Hunting) S(NoHunt)

70
flatwoods habitat within the hunt zone, the percentage of dry prairie habitat within the
hunt zone, the percentage of the hunt zone that was burned the previous year, and the
percentage of each zone in sesbania food strips. With the exception of the burn covariate,
the habitat covariates were constant from year to year within zones. As with the climatic
covariates, I evaluated the hunting zone and habitat covariates as a constant influence on
survival throughout the season as well as separate influences during the no-hunting and
hunting periods.
Saw palmetto is the primary escape cover for bobwhites on BWWMA in
southwest Florida (Frye 1954). Mesic flatwoods and dry prairie cover types have an
abundance of saw palmetto. I determined the percentages of those two cover types
within each zone using ArcGIS and a habitat cover type layer of BWWMA developed by
the Florida Fish and Wildlife Conservation Commission in 2005 – 2006 (Figure 3.2).
The percentages of each of these cover types did not change over the six years of my
study. I hypothesized that survival would be greater for bobwhites located in zones with
greater percentages of one or both of the mesic flatwoods and dry prairie cover types
because they would have access to more escape cover. I also hypothesized that the
influences of the cover types on survival would differ between the no-hunting and
hunting periods. By winter, most of the vegetation burned the previous year had
recovered almost completely. However, with at least two growing seasons of growth,
vegetation not burned the previous year was thicker and denser, possibly providing better
escape cover. Because of this, I hypothesized that over-winter survival would decrease
as the percentage of habitat burned the previous year increased. I included the percentage
of the hunt zone in food strip coverage as a covariate. The food strips were planted in the
spring, mainly as a food source for bobwhites and other wildlife in late winter when other
seed sources had been depleted. Food strips also grew tall and dense providing cover for
bobwhites. With zone F as the exception, the food plots did not meander over the entire
zone (Figure 3.3). Nevertheless, I included the food strips as a covariate in this analysis
to determine their effect, if any, on over-winter survival.
The fourth suite included models factoring pre-hunt bobwhite density
(bobwhites/ha) and hunting pressure (hunter days/1000 ha) into over-winter survival
71
(Table 3.1). These covariates were specific to hunt zones and varied by year. I
determined the pre-hunt bobwhite population for each zone using the Lincoln-Peterson
estimate and the harvest records each year (Dimmick et al. 1982). I hypothesized that
hunting zones with greater pre-hunt bobwhite densities would experience greater survival
rates during the no-hunting periods because of predator satiation. However, hunter
behavior may be influenced by pre-hunt density in that hunters concentrated their efforts
on hunting zones with greater bobwhite densities. If that were the case, I would expect
survival during the hunting periods to decrease with increasing pre-hunt density. I
evaluated two measurements of hunting pressure, the hunting pressure per encounter
period per zone and the total season hunting pressure per zone. I hypothesized that
survival would decrease as hunting pressure increased.
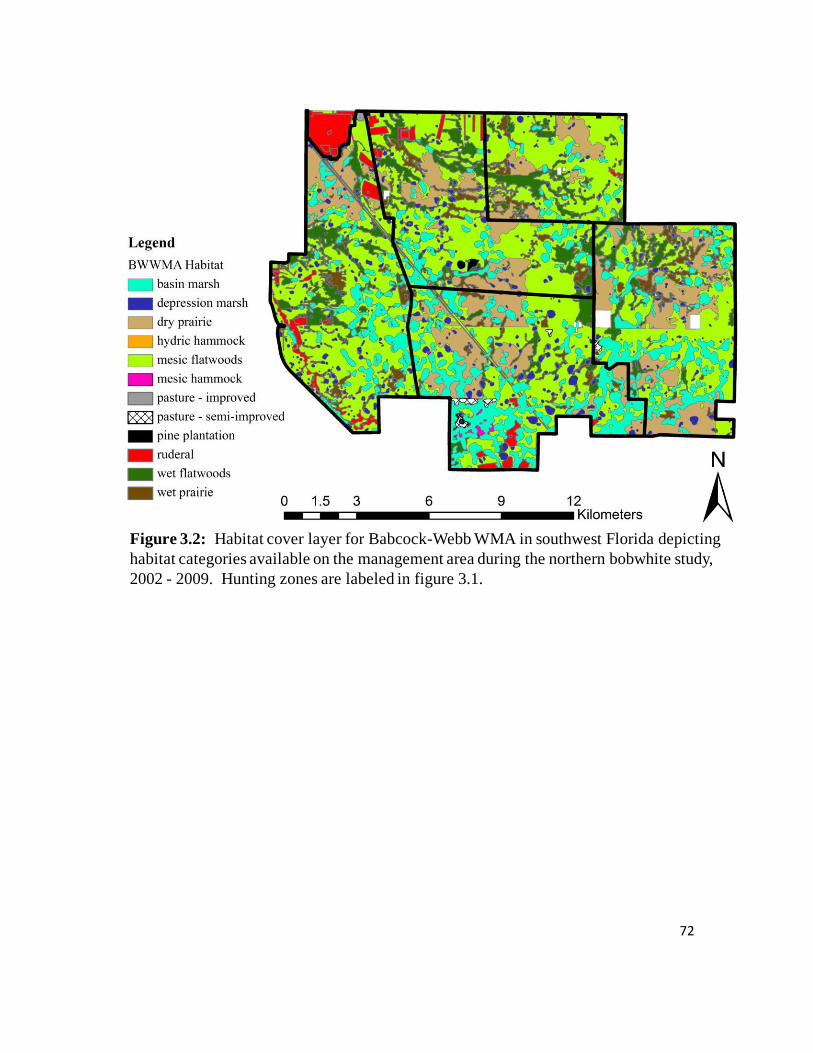
72
Figure 3.2: Habitat cover layer for Babcock-Webb WMA in southwest Florida depicting
habitat categories available on the management area during the northern bobwhite study,
2002 - 2009. Hunting zones are labeled in figure 3.1.

73
In the fifth model suite, I compared the top models from the preliminary model
suites. In the sixth suite, I evaluated plausible additive combinations of the models from
the fifth suite to determine the most parsimonious model(s) that described bobwhite
over-winter survival on my study area. I used model averaging to estimate the final
survival parameter for each encounter period. In all model suites, I defined a covariate as
important if the beta 95% confidence interval did not overlap zero (i.e., there was a
significant relationship between the covariate and survival).
Management Questions: I answered six specific management oriented questions.
Question 1: Do sesbania food strips affect over-winter survival and if so, how? Food
Figure 3.3: Babcock-Webb Wildlife Management Area in southwest Florida
with food strips in red and five hunt management zones, 2002 - 2009.

74
plots have been associated with increased late-winter survival (Robel and Kemp 1997).
Sesbania food strips were planted on my study area to provide food for bobwhites and
other wildlife during times of food shortage. They were planted each spring after the
paths were disked and fertilized. There was much time and money allotted to
establishing the food strips each year. Therefore, I evaluated the relationship between the
percentage of food strip area within each hunt zone and over-winter survival. I did so by
comparing a constant survival model with a model estimating survival as a function of
the percentage of food strips. I hypothesized that there would be a positive relationship
between the food strips and over-winter survival because of the additional food and cover
supplied by the food strips.
Question 2: Does the percentage of a zone burned the previous year influence
over-winter survival? Vegetation burned the previous winter had typically recovered by
the following winter in southwest Florida. However, I addressed this question because
burning is management that can be altered, and it is possible that even though the
vegetation had recovered, it may not have provided adequate escape cover during winter.
I evaluated a model estimating survival as a function of the percent of a hunting zone
burned the previous year against a constant survival model first to determine if there was
a relationship. I checked the beta estimates for burning to identify the direction of the
relationship, if any, that burning had with survival.
Question 3: At what point does the amount of hunting pressure result in harvest
rates of 15%, 20%, and 30%? Landers and Mueller (1986) reported that harvest rates
>30% can cause a population to decline. Because the BWWMA bobwhite population
was already thought to be low relative to area and declining, reducing the hunting season
harvest rate to a more conservative 15% or 20% may be warranted. I answered this
question by modeling total hunting pressure as a factor related to survival during the
regular hunt encounter periods. I then took the intercept estimate and beta estimate for
total hunting pressure and calculated the corresponding period survival rate estimates for
hunting pressure amounts ranging from 0 to 100 hunter days/1000 ha. Not all mortality
during the hunting period was related to hunting, so I assumed that non-hunting related
mortality was the difference between one and the estimated survival rate when hunting
75
pressure equaled zero (i.e., 1 – survival rate at hunting pressure of 0 hunter days/1000
ha). Therefore, to account for non-hunting related mortality, I added one minus the
survival rate estimate when hunting pressure equaled zero to each survival rate calculated
from the model. I graphed total hunting pressure against the adjusted hunting period
mortality rate (1 – survival rate) with 95% confidence intervals to visualize the point
which hunting mortality rate reached a desired threshold of 15 to 30%.
Question 4: What were the average harvest rates each year during the regular
hunt and the zone F hunt? I answered this question so that I could compare harvest rates
observed on BWWMA to other harvested bobwhite populations. If harvest rates on
BWWMA were similar to harvest rates of stable or increasing bobwhite populations, then
harvest rates on BWWMA may have little bearing on the population decline. I estimated
harvest rates for each hunt each year as the proportion of radio-tagged bobwhites alive at
the beginning of the hunt that were harvested and crippled (i.e., shot by a hunter but not
retrieved).
Question 5: How did harvest rate relate to over-winter survival of bobwhites? I
answered this question to assess whether harvest mortality was additive or compensatory
to natural mortality during the over-winter period. If over-winter survival rates decreased
as harvest rates increased, then harvest mortality was, to some degree, additive to natural
mortality (Sparkman et al. 2011). If over-winter survival rates did not change as harvest
rates increased, then harvest mortality was compensated by natural mortality. To answer
this question, I evaluated a model relating the annual harvest rates for hunt zones to the
over-winter survival rates. I then compared the model to the constant survival model. I
considered harvest rate to be an important effect if the model was more parsimonious
than the constant survival model and if the 95% confidence interval for the harvest rate
parameter did not overlap zero.
Question 6: Is the pre-hunt density the following year related to over-winter
survival? The answer to this question and the magnitude of the relationship may give
insight into how the over-winter period survival one year affected density the following
fall. If pre-hunt density the following year increased as over-winter survival increased,
then over-winter survival could be an important predictor of the fall population the next

76
year. To answer this question, I evaluated a model with pre-hunt density the following
year per hunting zone as a factor of over-winter survival. Because I had no pre-hunt
population estimate for 2009, I used the average pre-hunt population estimation for years
2003 – 2008 for the 2009 estimation applied to over-winter survival in 2008. I compared
this model to a constant survival model first to determine which had the most support.
Then, I checked the beta estimate for following year’s pre-hunt density for an important
relationship.
RESULTS
I caught 711 bobwhites (393 males and 318 females) using the baited funnel trap
method, and 755 bobwhites (658 males and 97 females) using the decoy funnel trap
method over the duration of the study. Forty-four bobwhites (24 males and 20 females)
were caught using the night cast net method. I caught 459 (225 males and 234 females)
bobwhites using the dog cast net method, and 54 (27 males and 27 females) and 202 (93
males and 109 females) bobwhites by using the night telemetry cast net and diurnal
telemetry cast net methods, respectively.
Over-winter Survival
I analyzed the over-winter survival histories for 1549 bobwhites from 1 October
2003 – 31 March 2009. Each encounter history spanned 175 days between 1 October and
31 March for each of the six yearly over-winter periods analyzed (Table 3.2).
In the first model suite, the additive model of year and time had the most support
with ER = 1 (Table 3.3). Survival for each encounter period differed within years, but
the pattern of survival estimates across each over-winter year was generally the same.
With ER <3, the additive models with year, time, sex, and age were also supported.
Models evaluating differences in survival between sexes and ages alone had little
support. There appeared to be no difference in survival between males and females or
adults and juveniles because the beta estimates for sex and age included zero in their 95%
confidence intervals (Table 3.4). However, when combined with the year plus time
model, sex added some value by reducing the deviance from the year plus time model.
The addition of age also appeared to be supported, but the model deviance was not

77
decreased by the addition and therefore, age did not explain variation in survival. None
of the models with time divided into no-hunting and hunting periods had support relative
to the most parsimonious models in this suite. Survival decreased during the hunting
periods, but there was too much variation in survival within no-hunting and hunting
periods to be constrained to singular estimates for each.
Length
2003-2004 2004-2005 2005-2006 2006-2007 2007-2008 2008-2009 (days) Hunting?
Start Date 10/1/2003 10/6/2004 10/5/2005 10/4/2006 10/3/2007 10/8/2008
End Date 10/14/2003 10/19/2004 10/18/2005 10/17/2006 10/16/2007 10/21/2008
Start Date 10/15/2003 10/20/2004 10/19/2005 10/18/2006 10/17/2007 10/22/2008
End Date 10/28/2003 11/2/2004 11/1/2005 10/31/2006 10/30/2007 11/4/2008
Start Date 10/29/2003 11/3/2004 11/2/2005 11/1/2006 10/31/2007 11/5/2008
End Date 11/11/2003 11/16/2004 11/15/2005 11/14/2006 11/13/2007 11/18/2008
Start Date 11/12/2003 11/17/2004 11/16/2005 11/15/2006 11/14/2007 11/19/2008
End Date 11/25/2003 11/30/2004 11/29/2005 11/28/2006 11/27/2007 12/2/2008
Start Date 11/26/2003 12/1/2004 11/30/2005 11/29/2006 11/28/2007 12/3/2008
End Date 12/9/2003 12/14/2004 12/13/2005 12/12/2006 12/11/2007 12/16/2008
Start Date 12/10/2003 12/15/2004 12/14/2005 12/13/2006 12/12/2007 12/17/2008
End Date 12/23/2003 12/28/2004 12/27/2005 12/26/2006 12/25/2007 12/30/2008
Start Date 12/24/2003 12/29/2004 12/28/2005 12/27/2006 12/26/2007 12/31/2008
End Date 1/6/2004 1/11/2005 1/10/2006 1/9/2007 1/8/2008 1/13/2009
Start Date 1/7/2004 1/12/2005 1/11/2006 1/10/2007 1/9/2008 1/14/2009
End Date 1/20/2004 1/25/2005 1/24/2006 1/23/2007 1/22/2008 1/27/2009
Start Date 1/21/2004 1/26/2005 1/25/2006 1/24/2007 1/23/2008 1/28/2009
End Date 2/3/2004 2/8/2005 2/7/2006 2/6/2007 2/5/2008 2/10/2009
Start Date 2/4/2004 2/9/2005 2/8/2006 2/7/2007 2/6/2008 2/11/2009
End Date 2/17/2004 2/22/2005 2/21/2006 2/20/2007 2/19/2008 2/24/2009
Start Date 2/18/2004 2/23/2005 2/22/2006 2/21/2007 2/20/2008 2/25/2009
End Date 3/2/2004 3/8/2005 3/7/2006 3/6/2007 3/4/2008 3/10/2009
Start Date 3/3/2004 3/9/2005 3/8/2006 3/7/2007 3/5/2008 3/11/2009
End Date 3/16/2004 3/22/2005 3/21/2006 3/20/2007 3/18/2008 3/24/2009
Start Date 3/17/2004 3/23/2005 3/22/2006 3/21/2007 3/19/2008 3/25/2009
End Date 3/23/2004 3/29/2005 3/28/2006 3/27/2007 3/25/2008 3/31/2009
Table 3.2: Encounter period dates, lengths, and hunting for each over-winter period of the southwest Florida bobwhite
study, 2003 - 2009. Hunting occurred during the highlighted periods.
14 No
14 No
Hunt
14 Hunt
14 Hunt
14 No
11
12
YearEncounter
Period
1
2
7 No
14Field Trial
'09
14Field Trial
'04 - '08
14 No
3
4
13
14 No
14 No
14 No
14
5
6
7
8
9
10

78
Model K AICc ∆AICc AICc Weights Evidence Ratio Deviance
S(year+t) 18 4314.711 0 0.31045 1 4278.632
S(year+t+Sex) 19 4314.815 0.1042 0.29469 1.0535 4276.728
S(year+t+Sex+Age) 20 4316.366 1.6548 0.13572 2.2874 4276.269
S(year+t+Age) 19 4316.514 1.8028 0.12604 2.4631 4278.426
S(t) 13 4318.573 3.8626 0.045 6.8989 4292.532
S(t+Sex) 14 4318.665 3.9543 0.04299 7.2214 4290.617
S(t+Sex+Age) 15 4319.889 5.1782 0.02331 13.3183 4289.834
S(t+Age) 14 4320.151 5.4405 0.02045 15.1809 4292.103
S(year*t) 78 4325.569 10.8587 0.00136 228.2721 4168.146
S(year*PreHuntPostFTHPostFTH) 30 4345.226 30.5148 0 n/a 4285.012
S(year+PreHuntPostFTHPostFTH) 10 4353.645 38.9345 0 n/a 4333.62
S(PreHuntPostFTHPostFTH) 5 4357.687 42.976 0 n/a 4347.68
S(year*PreHuntPost) 18 4385.608 70.8977 0 n/a 4349.53
S(year+PreHuntPost) 8 4386.631 71.9203 0 n/a 4370.615
S(year*NoHunt) 12 4388.689 73.9787 0 n/a 4364.654
S(year+NoHunt) 7 4388.69 73.9791 0 n/a 4374.677
S(PreHuntPost) 3 4391.548 76.8376 0 n/a 4385.546
S(NoHunt) 2 4392.978 78.2676 0 n/a 4388.977
S(TTT) 4 4497.585 182.8738 0 n/a 4489.58
S(TT) 3 4560.415 245.7042 0 n/a 4554.412
S(T) 2 4617.42 302.7095 0 n/a 4613.419
S(year) 6 4634.174 319.4636 0 n/a 4622.165
S(Sex) 2 4637.581 322.8702 0 n/a 4633.58
S(.) 1 4638.271 323.5604 0 n/a 4636.271
S(Sex+Age) 3 4639.069 324.3579 0 n/a 4633.066
S(Age) 2 4640.075 325.3644 0 n/a 4636.074
Table 3.3: Summary of model-selection results from the first model suite for over-winter survival of northern
bobwhites in southwest Florida, 2003 - 2009. Model notation is described in Table 3.1.
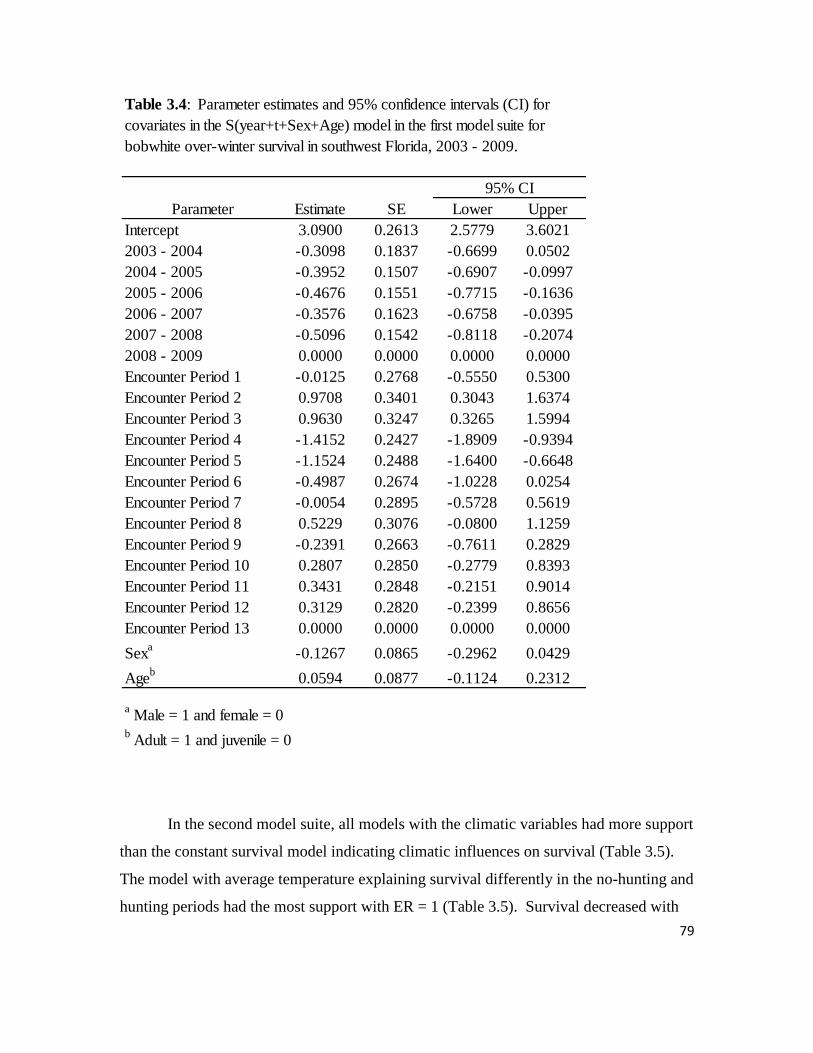
79
In the second model suite, all models with the climatic variables had more support
than the constant survival model indicating climatic influences on survival (Table 3.5).
The model with average temperature explaining survival differently in the no-hunting and
hunting periods had the most support with ER = 1 (Table 3.5). Survival decreased with
Parameter Estimate SE Lower Upper
Intercept 3.0900 0.2613 2.5779 3.6021
2003 - 2004 -0.3098 0.1837 -0.6699 0.0502
2004 - 2005 -0.3952 0.1507 -0.6907 -0.0997
2005 - 2006 -0.4676 0.1551 -0.7715 -0.1636
2006 - 2007 -0.3576 0.1623 -0.6758 -0.0395
2007 - 2008 -0.5096 0.1542 -0.8118 -0.2074
2008 - 2009 0.0000 0.0000 0.0000 0.0000
Encounter Period 1 -0.0125 0.2768 -0.5550 0.5300
Encounter Period 2 0.9708 0.3401 0.3043 1.6374
Encounter Period 3 0.9630 0.3247 0.3265 1.5994
Encounter Period 4 -1.4152 0.2427 -1.8909 -0.9394
Encounter Period 5 -1.1524 0.2488 -1.6400 -0.6648
Encounter Period 6 -0.4987 0.2674 -1.0228 0.0254
Encounter Period 7 -0.0054 0.2895 -0.5728 0.5619
Encounter Period 8 0.5229 0.3076 -0.0800 1.1259
Encounter Period 9 -0.2391 0.2663 -0.7611 0.2829
Encounter Period 10 0.2807 0.2850 -0.2779 0.8393
Encounter Period 11 0.3431 0.2848 -0.2151 0.9014
Encounter Period 12 0.3129 0.2820 -0.2399 0.8656
Encounter Period 13 0.0000 0.0000 0.0000 0.0000
Sexa
-0.1267 0.0865 -0.2962 0.0429
Ageb
0.0594 0.0877 -0.1124 0.2312
Table 3.4: Parameter estimates and 95% confidence intervals (CI) for
covariates in the S(year+t+Sex+Age) model in the first model suite for
bobwhite over-winter survival in southwest Florida, 2003 - 2009.
95% CI
a Male = 1 and female = 0
b Adult = 1 and juvenile = 0

80
increasing temperature during both periods (hunting period beta = -0.04; no-hunting
period beta = -0.02; Table 3.6). Models with average rainfall and days of rain alone did
not have enough support to be included in the fifth model suite; however, they did
provide some value to model fit by reducing the deviance when added to the average
temperature model (Table 3.5). Average rainfall and days of rain were not important
effects because their beta 95% confidence intervals included zero (Table 3.6).
Model K AICc ∆AICc AICc Weights Evidence Ratio Deviance
S(NHAvgTemp) 3 4376.823 0 0.53613 1 4370.82
S(NHAvgTemp+NHDayRain) 5 4378.341 1.5179 0.251 2.1360 4368.334
S(NHAvgTemp+NHAvgRain) 5 4378.67 1.8474 0.21287 2.5186 4368.663
S(NHDayRain) 3 4523.315 146.4924 0 n/a 4517.312
S(NHAvgRain) 3 4590.236 213.4136 0 n/a 4584.234
S(AvgTemp) 2 4634.639 257.8167 0 n/a 4630.638
S(DayRain) 2 4634.73 257.907 0 n/a 4630.728
S(AvgRain) 2 4637.209 260.386 0 n/a 4633.207
S(.) 1 4638.271 261.4484 0 n/a 4636.271
Table 3.5: Summary of model-selection results from the second model suite for over-winter survival of northern
bobwhites in southwest Florida, 2003 - 2009. Model notation is described in Table 3.1.

81
In the third model suite, the model with the most support was the hunting-zone
model set to explain survival differently in the no-hunting and hunting periods (Table
3.7). In this model, all zones had positive relationships with survival during the
no-hunting period (Table 3.8). Zones A and F were the only hunting zones that did not
have important negative survival during the hunting period (Table 3.8). During the
no-hunting period there was no difference in encounter period survival estimates among
zones (Table 3.9). Zone F had greater encounter period survival estimates during the
hunting period than zones B, C, and D (Table 3.9). With the exception of zones A and F,
zones had greater encounter period survival estimates during the no-hunting period than
during the hunting period (Table 3.9). The models with habitat covariates describing
zones did not explain the variation in survival as well as the model with the categorical
zone descriptions.
Model Parameter Estimate SE Lower Upper
Intercept 4.3969 0.5641 3.2913 5.5026
No Hunting Avg. Temp -0.0196 0.0082 -0.0356 -0.0036
Hunting Avg. Temp -0.0411 0.0087 -0.0581 -0.0240
Intercept 4.3743 0.5706 3.2559 5.4927
No Hunting Avg. Temp -0.0178 0.0083 -0.0340 -0.0016
Hunting Avg. Temp -0.0416 0.0087 -0.0586 -0.0245
No Hunting Days of Rain -0.0349 0.0292 -0.0922 0.0224
Hunting Days of Rain 0.0260 0.0255 -0.0239 0.0760
Intercept 4.3930 0.5657 3.2843 5.5017
No Hunting Avg. Temp -0.0187 0.0082 -0.0347 -0.0026
Hunting Avg. Temp -0.0412 0.0087 -0.0582 -0.0242
No Hunting Avg. Rain -0.2663 0.1835 -0.6260 0.0934
Hunting Avg. Rain 0.1269 0.3175 -0.4953 0.7492
95% CI
S(NHAvgTemp)
S(NHAvgTemp+NHDayRain)
S(NHAvgTemp+NHAvgRain)
Table 3.6: Parameter estimates and 95% confidence intervals (CI) for the three most supported models in
the second suite for over-winter survival of bobwhites in southwest Florida, 2003 - 2009. Model notation is
described in Table 3.1.

82
Model K AICc ∆AICc AICc Weights Evidence Ratio Deviance
S(NHZone) 10 4323.343 0 0.99965 1 4303.318
S(NHMF+NHDP+NHFP+NHBURN) 9 4339.844 16.5009 0.00026 3844.8077 4321.824
S(NHDP+NHFP+NHBURN) 7 4341.978 18.6347 0.00009 11107.2222 4327.965
S(NHMF+NHDP+NHFP) 7 4352.348 29.0047 0 n/a 4338.335
S(NHMF+NHFP+NHBURN) 7 4356.865 33.5217 0 n/a 4342.852
S(NHMF+NHDP+NHBURN) 7 4368.924 45.5806 0 n/a 4354.911
S(NHDP+NHFP) 5 4372.393 49.0502 0 n/a 4362.387
S(NHDP+NHBURN) 5 4375.432 52.0888 0 n/a 4365.425
S(NHFP+NHBURN) 5 4375.78 52.437 0 n/a 4365.773
S(NHMF+NHFP) 5 4384.045 60.702 0 n/a 4374.038
S(NHMF+NHDP) 5 4384.19 60.8472 0 n/a 4374.184
S(NHDP) 3 4386.829 63.4858 0 n/a 4380.826
S(NHMF+NHBURN) 5 4387.351 64.0074 0 n/a 4377.344
S(NHBURN) 3 4396.025 72.6818 0 n/a 4390.022
S(NHMF) 3 4419.934 96.5909 0 n/a 4413.931
S(NHFP) 3 4546.24 222.8963 0 n/a 4540.237
S(MF) 2 4628.076 304.7326 0 n/a 4624.074
S(Zone) 5 4629.154 305.8112 0 n/a 4619.148
S(MF+DP+FP+BURN) 5 4630.279 306.9358 0 n/a 4620.272
S(DP) 2 4633.682 310.3387 0 n/a 4629.681
S(FP) 2 4638.086 314.7428 0 n/a 4634.085
S(.) 1 4638.271 314.9279 0 n/a 4636.271
S(BURN) 2 4638.465 315.1221 0 n/a 4634.464
Table 3.7: Summary of model-selection results from the third model suite for over-winter survival of northern
bobwhites in southwest Florida, 2003 - 2009. Model notation is described in Table 3.1.

83
In the fourth model suite, the additive model with period hunting pressure and
pre-hunt density had the most support with ER = 1 (Table 3.10). Two other models,
period hunting pressure alone and additive period hunting pressure with no hunting and
hunting effects of pre-hunt density, had enough support to pass to the fifth model suite
with ER <3. In all three top models, period hunting pressure had an important negative
relationship (beta = -0.07) with survival (Table 3.11). Pre-hunt density effects were not
Model Parameter Estimate SE Lower Upper
Intercept 2.3437 0.1330 2.0831 2.6043
No Hunt Zone A 0.6187 0.1869 0.2525 0.9850
Hunt Zone A -0.1367 0.1928 -0.5145 0.2411
No Hunt Zone B 0.8962 0.2196 0.4657 1.3267
Hunt Zone B -1.1658 0.1750 -1.5088 -0.8228
No Hunt Zone C 1.1461 0.2171 0.7207 1.5716
Hunt Zone C -0.9493 0.1763 -1.2950 -0.6037
No Hunt Zone D 0.7182 0.2023 0.3216 1.1147
Hunt Zone D -0.7745 0.1805 -1.1284 -0.4207
No Hunt Zone F 0.3953 0.1730 0.0563 0.7343
Hunt Zone F 0.0000 0.0000 0.0000 0.0000
Table 3.8: Parameter estimates and 95% confidence intervals (CI) for the top model in the third model suite
for over-winter survival of bobwhites in southwest Florida, 2003 - 2009. Model notation is described in Table
3.1.
95% CI
S(NHZone)
Zone No Hunting Lower Upper Hunting Lower Upper
A 0.9508 0.9118 0.9731 0.9009 0.8276 0.9451
B 0.9623 0.9275 0.9808 0.7646 0.6398 0.8559
C 0.9704 0.9429 0.9849 0.8013 0.6874 0.8809
D 0.9553 0.9172 0.9763 0.8277 0.7221 0.8988
F 0.9393 0.8947 0.9657 0.9124 0.8892 0.9311
Survival Estimates
95% CI 95% CI
Table 3.9: Encounter period survival estimates and 95% confidence intervals (CI) for northern bobwhites in
each hunt zone on BWWMA in southwest Florida, 2003 - 2009. Estiamtes calculated from the top model in
suite 3.

84
important in the two models in which it was included, but in both cases pre-hunt density
did explain some of the variation in the data as evidenced by lower deviances.
Model K AICc ∆AICc AICc Weights Evidence Ratio Deviance
S(PHP+DENS) 3 4256.15 0 0.46097 1 4250.147
S(PHP) 2 4256.928 0.778 0.31241 1.4755 4252.927
S(PHP+NHDENS) 4 4257.57 1.4201 0.22662 2.0341 4249.566
S(NHDENS) 3 4563.853 307.7027 0 n/a 4557.85
S(DENS) 2 4630.312 374.162 0 n/a 4626.311
S(THP+DENS) 3 4631.867 375.7173 0 n/a 4625.865
S(THP) 2 4636.557 380.4073 0 n/a 4632.556
S(.) 1 4638.271 382.121 0 n/a 4636.271
Table 3.10: Summary of model-selection results from the fourth model suite for over-winter survival of northern
bobwhites in southwest Florida, 2003 - 2009. Model notation is described in Table 3.1.
Model Parameter Estimate SE Lower Upper
Intercept 2.7970 0.0777 2.6446 2.9494
Period hunting pressure -0.0723 0.0037 -0.0796 -0.0651
Pre-hunt density 0.3261 0.1982 -0.0624 0.7145
Intercept 2.8959 0.0511 2.7958 2.9960
Period hunting pressure -0.0728 0.0037 -0.0801 -0.0656
Intercept 2.8104 0.0797 2.6541 2.9667
Period hunting pressure -0.0740 0.0043 -0.0825 -0.0655
No Hunting Density 0.2246 0.2365 -0.2389 0.6881
Hunting Density 0.4367 0.2483 -0.0500 0.9234
Table 3.11: Parameter estimates and 95% confidence intervals (CI) for the three most supported models in
the fourth model suite for over-winter survival of bobwhites in southwest Florida, 2003 - 2009. Model
notation is described in Table 3.1.
95% CI
S(PHP+DENS)
S(PHP+NHDENS)
S(PHP)

85
Twelve models were compared in the fifth model suite, four from suite 1, three
from suite 2, one from suite 3, three from suite 4, and the constant survival model (Table
3.12). The models from suite 4, hunting pressure and density, had all the support when
compared to models from the other preliminary suites. The models with year, time, sex,
and age from suite 1 were second to the suite 4 models. The zone model from suite 3 fit
the data better than the climatic models from suite 2. However, all the models explained
survival better than the constant survival model.
In the sixth model suite, I combined models from the fifth suite to compile a
model set to average and calculate my final over-winter survival estimates (Table 3.13).
Ten models had reasonable support with ER <10, and 17 total models were averaged to
get the final survival estimates. All of the top models (i.e., ER <10) included year, time,
period hunting pressure, and no-hunting and hunting applications of density, average
temperature, and zone. Sex was included in six of the top ten models (Table 3.13).
However, there was no difference in survival between males and females. Hunting
pressure had an important negative relationship with survival (Table 3.14). Density was
Model K AICc ∆AICc AICc Weights Evidence Ratio Deviance
S(PHP+DENS) 3 4256.15 0 0.46097 1 4250.147
S(PHP) 2 4256.928 0.778 0.31241 1.4755 4252.927
S(PHP+NHDENS) 4 4257.57 1.4201 0.22662 2.0341 4249.566
S(year+t) 18 4314.711 58.5606 0 n/a 4278.632
S(year+t+Sex) 19 4314.815 58.6648 0 n/a 4276.728
S(year+t+Sex+Age) 20 4316.366 60.2154 0 n/a 4276.269
S(year+t+Age) 19 4316.514 60.3634 0 n/a 4278.426
S(NHZone) 10 4323.343 67.1931 0 n/a 4303.318
S(NHAvgTemp) 3 4376.823 120.6726 0 n/a 4370.82
S(NHDayRain+NHAvgTemp) 5 4378.341 122.1905 0 n/a 4368.334
S(NHAvgRain+NHAvgTemp) 5 4378.67 122.52 0 n/a 4368.663
S(.) 1 4638.271 382.121 0 n/a 4636.271
Table 3.12: Summary of model-selection results from the fifth model suite for over-winter survival of northern
bobwhites in southwest Florida, 2003 - 2009. Model notation is described in Table 3.1.

86
an important factor explaining variation in survival, the greater the pre-hunt density, the
greater the survival during the hunting period (Table 3.14). The relationship of average
temperature to survival was also positive during the hunting period with an increase in
survival as temperature increased (Table 3.14). Hunting zone remained an important
factor related to survival. However, the differences among zones and between
no-hunting and hunting periods were not evident when the zone effect was included in
models with other covariates, indicating that other covariates explained survival more
effectively than zone. Model averaged period survival estimates declined within years
during the regular hunt periods (periods 4 – 6; Figure 3.4). Among years, the
model-averaged over-winter survival rate estimates ranged from 0.310 (2007 – 2008) to
0.480 (2008 – 2009), but did not differ except between 2007 – 2008 and 2008 – 2009
(Figure 3.5). Average over-winter survival rate was 0.402 (SE = 0.023).
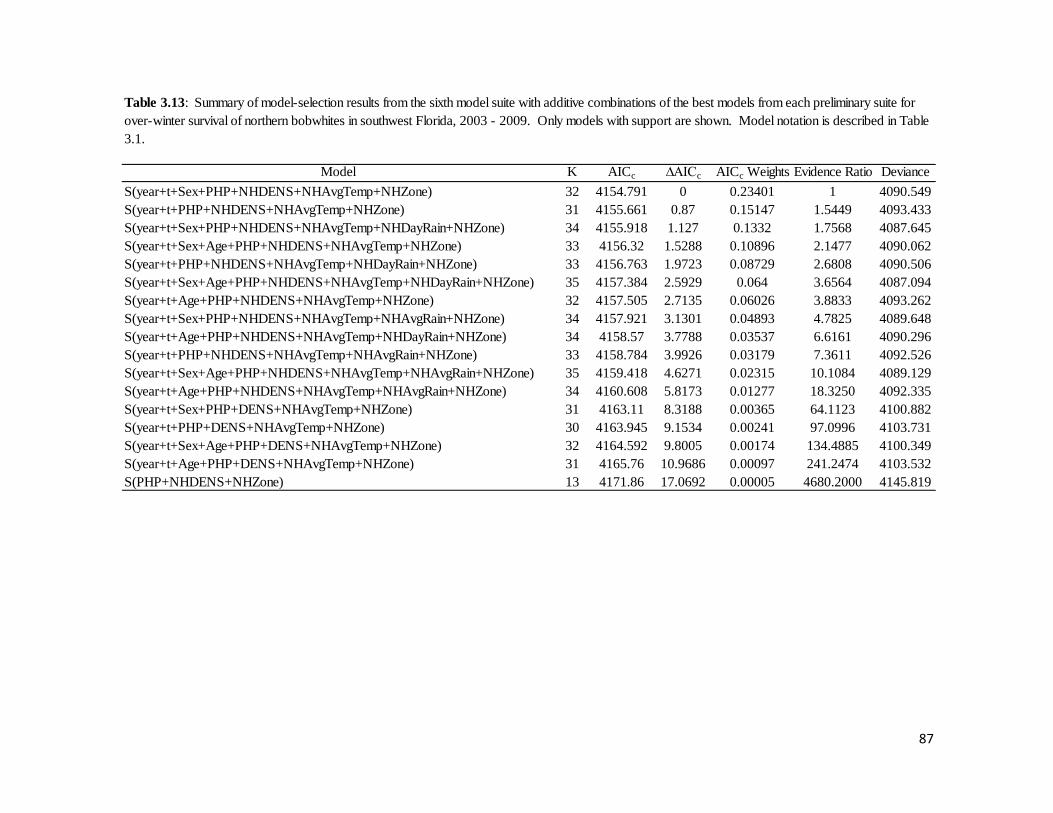
87
Model K AICc ∆AICc AICc Weights Evidence Ratio Deviance
S(year+t+Sex+PHP+NHDENS+NHAvgTemp+NHZone) 32 4154.791 0 0.23401 1 4090.549
S(year+t+PHP+NHDENS+NHAvgTemp+NHZone) 31 4155.661 0.87 0.15147 1.5449 4093.433
S(year+t+Sex+PHP+NHDENS+NHAvgTemp+NHDayRain+NHZone) 34 4155.918 1.127 0.1332 1.7568 4087.645
S(year+t+Sex+Age+PHP+NHDENS+NHAvgTemp+NHZone) 33 4156.32 1.5288 0.10896 2.1477 4090.062
S(year+t+PHP+NHDENS+NHAvgTemp+NHDayRain+NHZone) 33 4156.763 1.9723 0.08729 2.6808 4090.506
S(year+t+Sex+Age+PHP+NHDENS+NHAvgTemp+NHDayRain+NHZone) 35 4157.384 2.5929 0.064 3.6564 4087.094
S(year+t+Age+PHP+NHDENS+NHAvgTemp+NHZone) 32 4157.505 2.7135 0.06026 3.8833 4093.262
S(year+t+Sex+PHP+NHDENS+NHAvgTemp+NHAvgRain+NHZone) 34 4157.921 3.1301 0.04893 4.7825 4089.648
S(year+t+Age+PHP+NHDENS+NHAvgTemp+NHDayRain+NHZone) 34 4158.57 3.7788 0.03537 6.6161 4090.296
S(year+t+PHP+NHDENS+NHAvgTemp+NHAvgRain+NHZone) 33 4158.784 3.9926 0.03179 7.3611 4092.526
S(year+t+Sex+Age+PHP+NHDENS+NHAvgTemp+NHAvgRain+NHZone) 35 4159.418 4.6271 0.02315 10.1084 4089.129
S(year+t+Age+PHP+NHDENS+NHAvgTemp+NHAvgRain+NHZone) 34 4160.608 5.8173 0.01277 18.3250 4092.335
S(year+t+Sex+PHP+DENS+NHAvgTemp+NHZone) 31 4163.11 8.3188 0.00365 64.1123 4100.882
S(year+t+PHP+DENS+NHAvgTemp+NHZone) 30 4163.945 9.1534 0.00241 97.0996 4103.731
S(year+t+Sex+Age+PHP+DENS+NHAvgTemp+NHZone) 32 4164.592 9.8005 0.00174 134.4885 4100.349
S(year+t+Age+PHP+DENS+NHAvgTemp+NHZone) 31 4165.76 10.9686 0.00097 241.2474 4103.532
S(PHP+NHDENS+NHZone) 13 4171.86 17.0692 0.00005 4680.2000 4145.819
Table 3.13: Summary of model-selection results from the sixth model suite with additive combinations of the best models from each preliminary suite for
over-winter survival of northern bobwhites in southwest Florida, 2003 - 2009. Only models with support are shown. Model notation is described in Table
3.1.

88
Parameter Estimate SE Lower Upper
2003 - 2004 -0.1969 0.2132 -0.6147 0.2209
2004 - 2005 -0.2398 0.1585 -0.5505 0.0709
2005 - 2006 -0.2889 0.1693 -0.6208 0.0430
2006 - 2007 -0.3519 0.1697 -0.6845 -0.0194
2007 - 2008 -0.5999 0.1686 -0.9304 -0.2693
2008 - 2009 0.0000 0.0000 0.0000 0.0000
Encounter Period 1 -0.2715 0.3445 -0.9466 0.4037
Encounter Period 2 0.7813 0.3581 0.0795 1.4831
Encounter Period 3 0.8472 0.3247 0.2109 1.4836
Encounter Period 4 0.4651 0.5298 -0.5734 1.5036
Encounter Period 5 -0.0125 0.5167 -1.0253 1.0003
Encounter Period 6 0.4653 0.5009 -0.5164 1.4470
Encounter Period 7 0.1030 0.3109 -0.5063 0.7122
Encounter Period 8 0.8257 0.3515 0.1368 1.5147
Encounter Period 9 0.6765 0.4759 -0.2562 1.6092
Encounter Period 10 0.4470 0.3335 -0.2066 1.1005
Encounter Period 11 0.4265 0.2987 -0.1590 1.0120
Encounter Period 12 0.3422 0.2853 -0.2169 0.9013
Encounter Period 13 0.0000 0.0000 0.0000 0.0000
Sex -0.1484 0.0877 -0.3203 0.0235
Period hunting pressure -0.0743 0.0077 -0.0894 -0.0593
No Hunting Density -0.3932 0.4673 -1.3092 0.5227
Hunting Density 1.5644 0.4999 0.5847 2.5442
No Hunting Avg. Temp 0.0184 0.0242 -0.0291 0.0659
Hunting Avg. Temp 0.0311 0.0094 0.0128 0.0495
No Hunting Zone A 1.7931 1.7028 -1.5444 5.1305
Hunting Zone A 0.6699 0.2802 0.1207 1.2191
No Hunting Zone B 2.0193 1.7047 -1.3220 5.3606
Hunting Zone B -0.2520 0.3008 -0.8416 0.3377
No Hunting Zone C 2.3512 1.7078 -0.9962 5.6986
Hunting Zone C 0.9065 0.3133 0.2924 1.5207
No Hunting Zone D 1.9317 1.7111 -1.4221 5.2856
Hunting Zone D 0.3685 0.2729 -0.1663 0.9034
No Hunting Zone F 1.7558 1.7105 -1.5967 5.1083
Hunting Zone F 0.0000 0.0000 0.0000 0.0000
95% CI
Table 3.14: Parameter estimates and 95% confidence intervals (CI) for
covariates in the best model of the sixth model suite for bobwhite over-
winter survival in southwest Florida, 2003 - 2009.

89
Figure 3.4: Encounter period survival rate estimates (solid line) and 95% confidence intervals
(dotted lines) for each year of the northern bobwhite study in southwest Florida, 2003 – 2009.
Estimates were calculated from model averaging.
0.5
0.6
0.7
0.8
0.9
1
1 2 3 4 5 6 7 8 9 10 11 12 13
Su
rviv
al
Encounter Period
2003 - 2004
0.5
0.6
0.7
0.8
0.9
1
1 2 3 4 5 6 7 8 9 10 11 12 13
Su
rviv
al
Encounter Period
2004 - 2005
0.5
0.6
0.7
0.8
0.9
1
1 2 3 4 5 6 7 8 9 10 11 12 13
Su
rviv
al
Encounter Period
2005 - 2006
0.5
0.6
0.7
0.8
0.9
1
1 2 3 4 5 6 7 8 9 10 11 12 13
Su
rviv
al
Encounter Period
2006 - 2007
0.5
0.6
0.7
0.8
0.9
1
1 2 3 4 5 6 7 8 9 10 11 12 13
Su
rviv
al
Encounter Period
2007 - 2008
0.5
0.6
0.7
0.8
0.9
1
1 2 3 4 5 6 7 8 9 10 11 12 13
Su
rviv
al
Encounter Period
2008 - 2009

90
Management Questions
The six management related questions and answers are summarized in Table 3.15.
When modeled alone, the proportion of a hunt zone covered in sesbania food strips did
not have an important effect on over-winter survival. The model evaluating a
relationship between food strips and over-winter survival had only slightly more support
than the constant survival model (Table 3.16). Therefore, food strips did not appear to
influence over-winter survival. The model with the interaction between food strips and
hunting pressure had the most support in the model set with ER = 1 (Table 3.16). The
only important beta estimate in this model was the period hunting pressure (-0.08; Table
3.17). The constant food strip effect and the interaction term both had beta estimate 95%
confidence intervals that included zero (Table 3.17). Because the interaction term was
Figure 3.5: Over-winter survival rate estimates and 95% confidence intervals for each year of
the northern bobwhite study in southwest Florida, 2003 – 2009. Yearly estimates were
calculated from the final model averaged estimates.
0
0.1
0.2
0.3
0.4
0.5
0.6
0.7
2003 - 2004 2004 - 2005 2005 - 2006 2006 - 2007 2007 - 2008 2008 - 2009
Ov
erw
inte
r S
urv
iva
l
Year
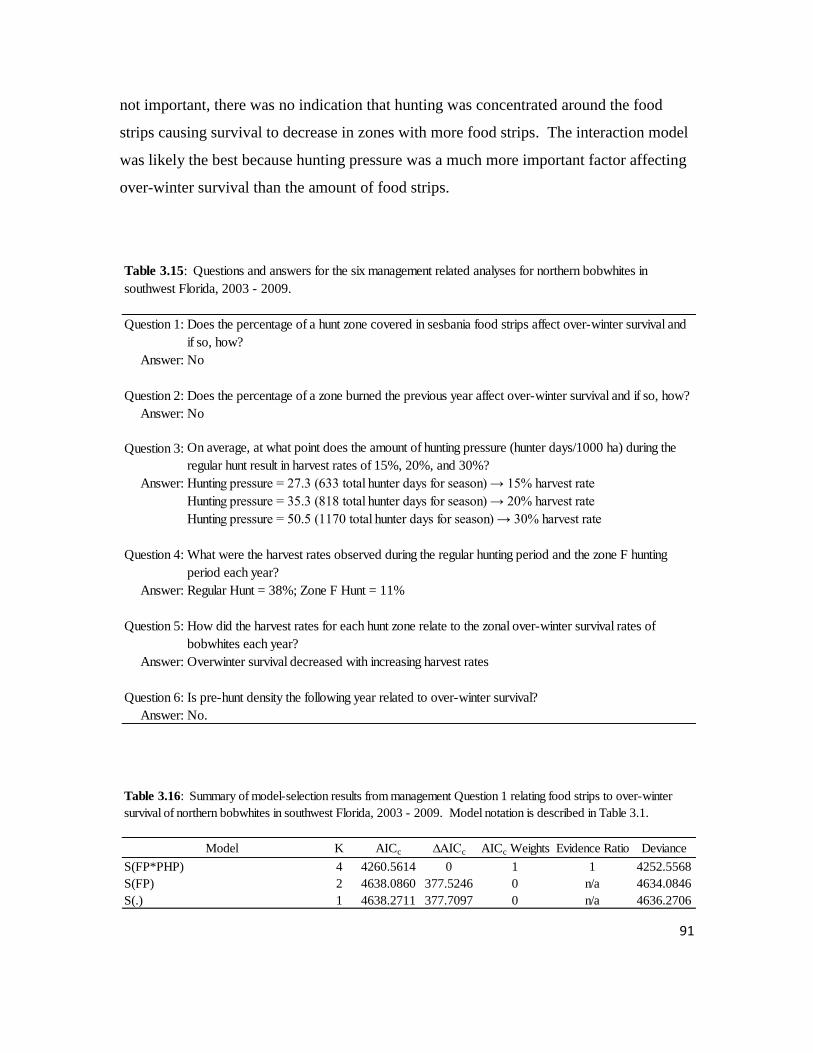
91
not important, there was no indication that hunting was concentrated around the food
strips causing survival to decrease in zones with more food strips. The interaction model
was likely the best because hunting pressure was a much more important factor affecting
over-winter survival than the amount of food strips.
Question 1:
Answer: No
Question 2: Does the percentage of a zone burned the previous year affect over-winter survival and if so, how?
Answer: No
Question 3:
Answer: Hunting pressure = 27.3 (633 total hunter days for season) → 15% harvest rate
Hunting pressure = 35.3 (818 total hunter days for season) → 20% harvest rate
Hunting pressure = 50.5 (1170 total hunter days for season) → 30% harvest rate
Question 4:
Answer: Regular Hunt = 38%; Zone F Hunt = 11%
Question 5:
Answer: Overwinter survival decreased with increasing harvest rates
Question 6: Is pre-hunt density the following year related to over-winter survival?
Answer: No.
Table 3.15: Questions and answers for the six management related analyses for northern bobwhites in
southwest Florida, 2003 - 2009.
How did the harvest rates for each hunt zone relate to the zonal over-winter survival rates of
bobwhites each year?
What were the harvest rates observed during the regular hunting period and the zone F hunting
period each year?
On average, at what point does the amount of hunting pressure (hunter days/1000 ha) during the
regular hunt result in harvest rates of 15%, 20%, and 30%?
Does the percentage of a hunt zone covered in sesbania food strips affect over-winter survival and
if so, how?
Model K AICc ∆AICc AICc Weights Evidence Ratio Deviance
S(FP*PHP) 4 4260.5614 0 1 1 4252.5568
S(FP) 2 4638.0860 377.5246 0 n/a 4634.0846
S(.) 1 4638.2711 377.7097 0 n/a 4636.2706
Table 3.16: Summary of model-selection results from management Question 1 relating food strips to over-winter
survival of northern bobwhites in southwest Florida, 2003 - 2009. Model notation is described in Table 3.1.

92
The proportion of the hunting zone burned each year also was not related to
over-winter survival. The model with burning as a covariate had slightly less support
than the constant survival model (Table 3.18), and the 95% confidence interval for the
burning parameter estimate included zero (Table 3.19).
Model Parameter Estimate SE Lower Upper
Intercept 2.9406 0.0904 2.7633 3.1178
Food strips -6.1443 10.1000 -25.9403 13.6516
Period hunting pressure -0.0755 0.0077 -0.0906 -0.0605
Food strips * Period hunting pressure 0.4178 1.1344 -1.8056 2.6411
Intercept 2.3844 0.0706 2.2460 2.5227
Food strips 11.8920 8.1177 -4.0187 27.8026S(FP)
Table 3.17: Parameter estimates and 95% confidence intervals (CI) for the models evaluated for
Question 1 relating food strips to over-winter survival of bobwhites in southwest Florida, 2003 - 2009.
Model notation is described in Table 3.1.
95% CI
S(FP+PHP+FP*PHP)
Model K AICc ∆AICc AICc Weights Evidence Ratio Deviance
S(.) 1 4638.2711 0 0.52426 1 4636.2706
S(BURN) 2 4638.4653 0.1942 0.47574 1.1020 4634.4639
Table 3.18: Summary of model-selection results from management Question 2 relating burning to over-winter
survival of northern bobwhites in southwest Florida, 2003 - 2009. Model notation is described in Table 3.1.
Model Parameter Estimate SE Lower Upper
Intercept 2.3247 0.1145 2.1003 2.5490
Burn 0.2357 0.1745 -0.1063 0.5778
Table 3.19: Parameter estimates and 95% confidence intervals (CI) for the model evaluated for Question
2 relating burning to over-winter survival of bobwhites in southwest Florida, 2003 - 2009. Model notation
is described in Table 3.1.
95% CI
S(BURN)

93
The model with total hunting pressure as a factor describing the regular hunt
period survival had more support than the constant survival model (Table 3.20). The
relationship was negative and important (Table 3.21). Survival decreased as hunting
pressure increased. The estimate for the total number of hunter days/1000 ha that
resulted in 30% hunting related mortality was 50.5 (95% CI = 31.3 to 94.7; Figure 3.6).
That hunting intensity would equate to 1,170 total hunter days for hunt zones A – D,
which total 23,170 ha. The estimates for 20% and 15% harvest rates were 35.3 (95% CI
= 21.5 to 67.8) and 27.3 (95% CI = 16.4 to 53.1) hunter days/1000 ha (818 and 633 total
hunter days for the regular hunting season), respectively (Figure 3.6).
Model K AICc ∆AICc AICc Weights Evidence Ratio Deviance
S(THP) 2 1575.5081 0 1 1 1571.5004
S(.) 1 1600.0318 24.5237 0 n/a 1598.0292
Table 3.20: Summary of model-selection results from management Question 3 relating hunting pressure to survival of
bobwhites during the regular hunting season on BWWMA in southwest Florida, 2003 - 2009. Model notation is
described in Table 3.1.
Model Parameter Estimate SE Lower Upper
Intercept 2.10934 0.1628 1.79017 2.428504
Total hunting pressure -0.0167 0.0032 -0.0229 -0.01054
Table 3.21: Parameter estimates and 95% confidence intervals (CI) for the model evaluated for Question
3 relating hunting pressure to survival of bobwhites during the regular hunting season on BWWMA in
southwest Florida, 2003 - 2009. Model notation is described in Table 3.1.
95% CI
S(THP)

94
On average, the harvest rate during the regular hunting period was 38% (Table
3.22). Yearly harvest rates ranged from 28% in 2008 – 2009 to 48% in 2004 – 2005.
The average harvest rate during the zone F hunt was 11% (Table 3.23). Yearly harvest
rates ranged from 2% in 2008 – 2009 to 22% in 2003 – 2004.
Figure 3.6: Relationship between total hunting pressure and harvest rate of northern bobwhites in
southwest Florida, 2003 – 2009. Red lines indicate total hunting pressure amounts yielding 15, 20, and
30% hunting mortality.
0.0000
0.0500
0.1000
0.1500
0.2000
0.2500
0.3000
0.3500
0.4000
0.4500
0.5000
0.5500
0.6000
0.6500
0.7000
0.7500
0.8000
0.8500
0.9000
0.9500
1.0000
0 5 10 15 20 25 30 35 40 45 50 55 60 65 70 75 80 85 90 95 100
Harv
est
Rate
Total Season Hunter Days / 1000 ha
Harvest Rate 95% CI
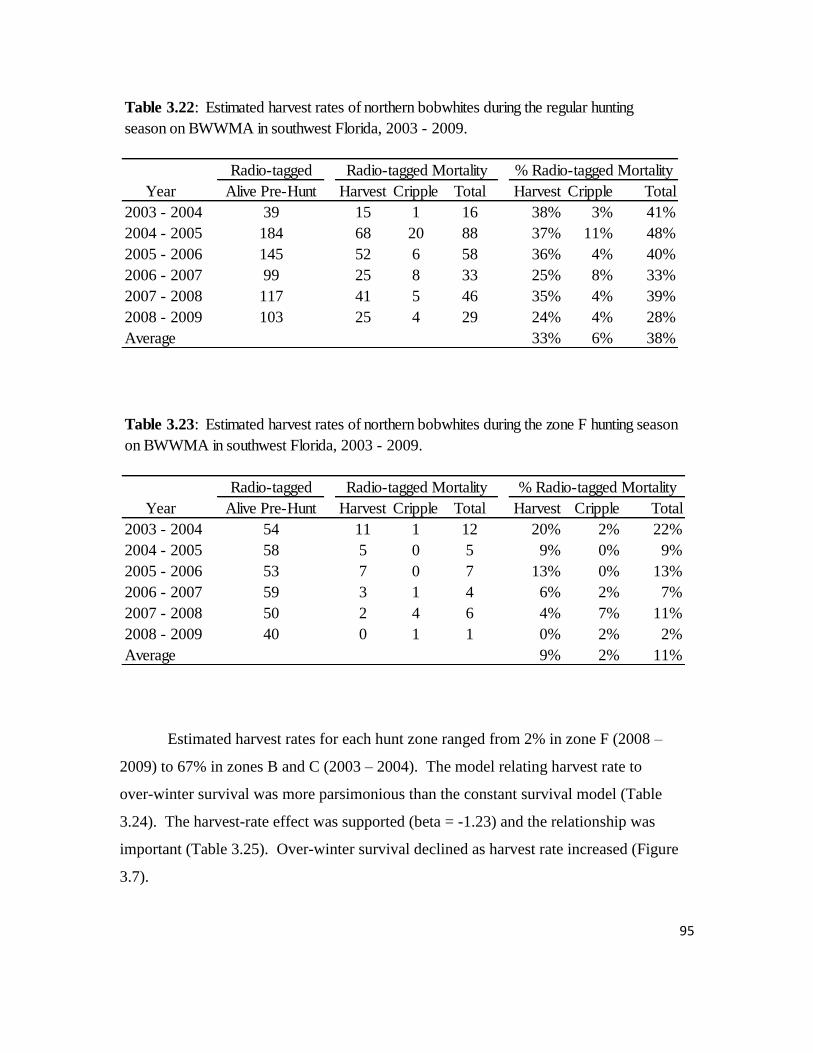
95
Estimated harvest rates for each hunt zone ranged from 2% in zone F (2008 –
2009) to 67% in zones B and C (2003 – 2004). The model relating harvest rate to
over-winter survival was more parsimonious than the constant survival model (Table
3.24). The harvest-rate effect was supported (beta = -1.23) and the relationship was
important (Table 3.25). Over-winter survival declined as harvest rate increased (Figure
3.7).
Radio-tagged
Alive Pre-Hunt Harvest Cripple Total Harvest Cripple Total
39 15 1 16 38% 3% 41%
184 68 20 88 37% 11% 48%
145 52 6 58 36% 4% 40%
99 25 8 33 25% 8% 33%
117 41 5 46 35% 4% 39%
103 25 4 29 24% 4% 28%
33% 6% 38%
2008 - 2009
Average
Year
2003 - 2004
2004 - 2005
2005 - 2006
Radio-tagged Mortality % Radio-tagged Mortality
Table 3.22: Estimated harvest rates of northern bobwhites during the regular hunting
season on BWWMA in southwest Florida, 2003 - 2009.
2006 - 2007
2007 - 2008
Radio-tagged
Alive Pre-Hunt Harvest Cripple Total Harvest Cripple Total
54 11 1 12 20% 2% 22%
58 5 0 5 9% 0% 9%
53 7 0 7 13% 0% 13%
59 3 1 4 6% 2% 7%
50 2 4 6 4% 7% 11%
40 0 1 1 0% 2% 2%
9% 2% 11%
2004 - 2005
Table 3.23: Estimated harvest rates of northern bobwhites during the zone F hunting season
on BWWMA in southwest Florida, 2003 - 2009.
Radio-tagged Mortality % Radio-tagged Mortality
Year
2003 - 2004
2005 - 2006
2006 - 2007
2007 - 2008
2008 - 2009
Average

96
Model K AICc ∆AICc AICc Weights Evidence Ratio Deviance
S(HR) 2 4612.3242 0 1 1 4636.2706
S(.) 1 4638.2711 25.9469 0 n/a 4634.4639
Table 3.24: Summary of model-selection results from management Question 5 about the effects of harvest rates
(HR) on over-winter survival of northern bobwhites in southwest Florida, 2003 - 2009.
Model Parameter Estimate SE Lower Upper
Intercept 2.8817 0.0914 2.7025 3.0608
Harvest Rate -1.2346 0.2346 -1.6943 -0.7748
95% CI
S(HR)
Table 3.25: Parameter estimates and 95% confidence intervals (CI) for the model evaluated for Question
5 on the effects of harvest rates on over-winter survival of bobwhites in southwest Florida, 2003 - 2009.
Figure 3.7: Over-winter survival rate estimates and 95% confidence intervals
related to harvest rates of the northern bobwhites in southwest Florida, 2003 –
2009.
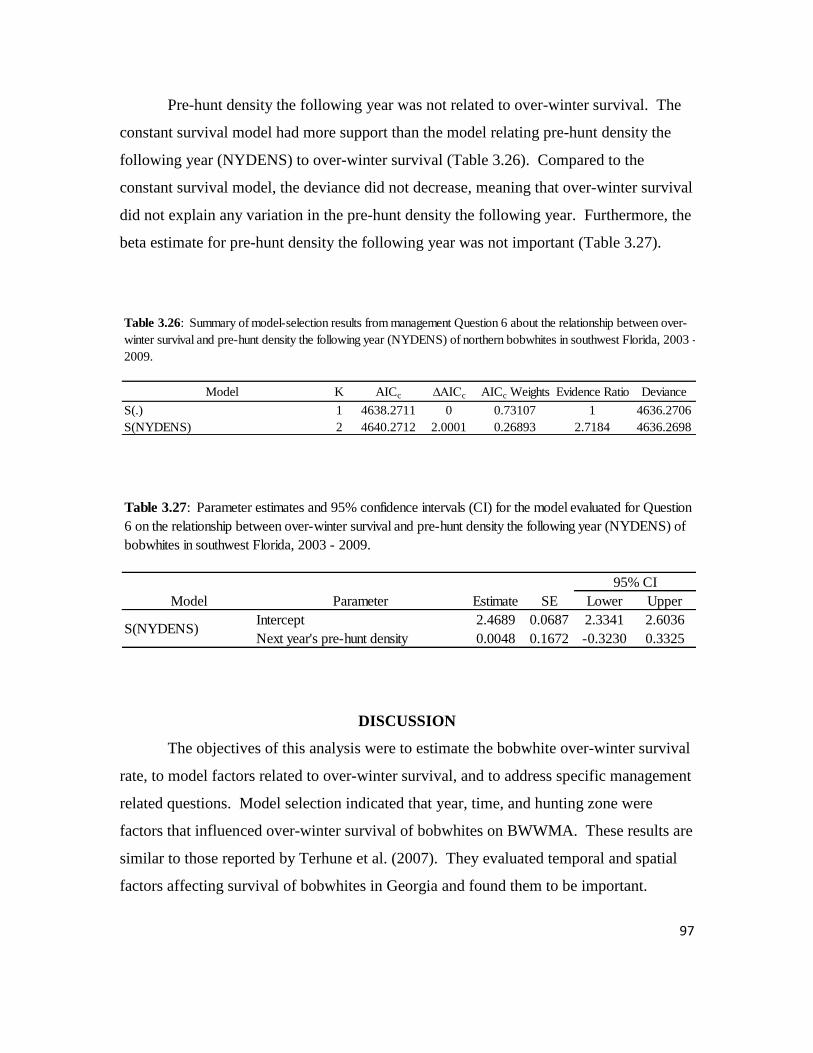
97
Pre-hunt density the following year was not related to over-winter survival. The
constant survival model had more support than the model relating pre-hunt density the
following year (NYDENS) to over-winter survival (Table 3.26). Compared to the
constant survival model, the deviance did not decrease, meaning that over-winter survival
did not explain any variation in the pre-hunt density the following year. Furthermore, the
beta estimate for pre-hunt density the following year was not important (Table 3.27).
DISCUSSION
The objectives of this analysis were to estimate the bobwhite over-winter survival
rate, to model factors related to over-winter survival, and to address specific management
related questions. Model selection indicated that year, time, and hunting zone were
factors that influenced over-winter survival of bobwhites on BWWMA. These results are
similar to those reported by Terhune et al. (2007). They evaluated temporal and spatial
factors affecting survival of bobwhites in Georgia and found them to be important.
Model K AICc ∆AICc AICc Weights Evidence Ratio Deviance
S(.) 1 4638.2711 0 0.73107 1 4636.2706
S(NYDENS) 2 4640.2712 2.0001 0.26893 2.7184 4636.2698
Table 3.26: Summary of model-selection results from management Question 6 about the relationship between over-
winter survival and pre-hunt density the following year (NYDENS) of northern bobwhites in southwest Florida, 2003 -
2009.
Model Parameter Estimate SE Lower Upper
Intercept 2.4689 0.0687 2.3341 2.6036
Next year's pre-hunt density 0.0048 0.1672 -0.3230 0.3325
Table 3.27: Parameter estimates and 95% confidence intervals (CI) for the model evaluated for Question
6 on the relationship between over-winter survival and pre-hunt density the following year (NYDENS) of
bobwhites in southwest Florida, 2003 - 2009.
95% CI
S(NYDENS)

98
Terhune et al. (2007) attributed the variation to differences in habitat suitability, predator
abundance, and habitat manipulations among study sites and years. The same underlying
factors may have been responsible for the variation in survival rates during the
over-winter period and among hunt zones on my study area. However, the habitat among
zones on BWWMA was generally managed similarly (i.e., prescribed fire and roller
chopping). Furthermore, the models I evaluated that specifically related habitat
characteristics to survival were not as well supported as the model that explained survival
influenced by hunting zone. Predator abundance could have varied from one zone to
another and certainly among encounter periods and years. However, an important factor
that varied over time and space and explained variation in my data was the amount of
hunting pressure.
Over-winter survival in BWWMA decreased as hunting pressure increased. In
Iowa, Suchy and Munkel (2000) reported that the over-winter survival rate was lower on
the more heavily hunted site of two sites with different levels of hunting pressure.
Likewise, Williams et al. (2009) reported lower over-winter survival on their study site
with greater harvest mortality. In North Carolina, the difference in over-winter survival
rates between hunted (0.45) and non-hunted (0.65) study sites was significant (Robinette
and Doerr 1993). Curtis et al. (1988) also reported lower winter and annual survival rates
for a hunted population in North Carolina compared to a non-hunted population in north
Florida. Concurring with my results, these other studies indicated that any hunting or
increased hunting generally reduces over-winter survival. It appears that, at least in some
cases, some level of hunting mortality is additive to natural mortality.
During the no-hunting period, pre-hunt bobwhite density was not related to
survival. Therefore, there was no evidence that predator satiation (i.e., maximum
predation threshold) was reached during the no-hunting period. Conversely, during the
hunting period, survival increased as pre-hunt density increased. My hypothesis that
hunters chose to hunt more frequently, and harvest birds at greater rates, in zones with
greater bobwhite densities was not supported by the results. However, access limitations
to some hunting zones over the duration of the study likely influenced hunter behavior

99
more than free will. Consequently, I cannot conclude that hunters chose to hunt locations
with greater densities of bobwhites.
Survival during the hunting period increased as average temperature increased.
My hypothesis about the relationship between temperature and survival during the
hunting period was supported. Bird dogs may not be able to track bobwhites effectively
in warmer temperatures. Also, hunters may not exert as much hunting effort during
periods of warmer weather. Rainfall, during the no-hunting period and the hunting
period, was not an important factor related to survival. The days of rain covariate did
explain a small amount of variation in the data as seen by the slight reduction in deviance
when added to models (Table 3.12). My hypothesis, that increased rainfall during the
hunting periods would decrease survival because bird dogs would detect bobwhites more
effectively in the moist conditions, was not supported.
My model-averaged estimates for over-winter survival ranged from 0.310 in 2007
– 2008 to 0.480 in 2008 – 2009. These estimates are in the top half of the range of
estimates from studies examined by Sandercock et al. (2009). One study in Georgia
reported more variable over-winter survival estimates ranging from 0.238 – 0.647 over an
8-year study (Terhune et al. 2007). Hughes et al. (2005) reported a range of over-winter
survival estimates of 0.25 – 0.36 on an agricultural area in Georgia and 0.51 – 0.58 on an
intensively managed bobwhite plantation in Georgia. My results compare well to these
studies, however, my results are less variable and the upper end of my range is lower.
Average harvest rates (38%) during the regular hunting period on BWWMA were much
greater than the <12% harvest rates on study sites in Georgia (Hughes et al. 2005,
Terhune et al. 2007) and the 23.3% reported from north Florida (Pollock et al. 1989).
The low variability of my estimates suggests that over-winter survival is relatively stable
on BWWMA. However, the great level of hunting mortality during my study may have
resulted in the upper range of my survival estimates being lesser than those reported from
Georgia.
The percentage of a hunting zone covered in food strips was not related to
over-winter survival. Increased hunting-related mortality because of more food strips
was not supported because the interaction between food strips and hunting pressure was

100
not an important factor. Madison et al. (2002) reported similar findings in Kansas that
bobwhite survival was no different near food plots. In my analysis, I simply used the
amount of food strips at the zone level as a covariate to evaluate this relationship. A
more fine-scaled assessment of food strips within individual bobwhite home ranges may
have yielded more precise results. Future analyses may consider this when relating food
plots to over-winter survival.
The percentage of the hunting zone burned the previous year also was not related
to over-winter survival. This is not surprising because the vegetation appeared to have
recovered to the pre-burned state by the following winter. As with food strips, it may be
of interest to analyze the amount of an individual bird’s home range that was burned the
previous year to obtain more precise results.
The results of my analysis relating survival to harvest rate indicated that harvest
was at least partially additive to mortality during the over-winter period. I could not
compare hunting pressure with other studies because it was either not reported, or not
translatable to my measure of hunting pressure. Dixon et al. (1996) reported that a
harvest mortality rate of 33% for a population on a managed hunting plantation in South
Carolina may have been additive to bobwhite mortality in late winter, and concluded that
hunting pressure should be restricted to ensure bobwhite population persistence. In North
Carolina, Curtis et al. (1988) reported 19% and Robinette and Doerr (1993) reported 14%
harvest mortality. Both of these studies were conducted on Fort Bragg Military
Reservation where the bobwhite population had declined from the early 1970s to the
mid-1980’s (Curtis et al. 1988) and was described as “low” by Robinette and Doerr
(1993). Madison et al. (2002) estimated harvest mortality rates in Kansas of 19% and
17% in areas near to and far from food plots, respectively. Other studies have reported
greater harvest mortality rates. Burger et al. (1995) estimated a harvest mortality rate of
28% for a declining population in Missouri. Utilizing census data in Illinois, Roseberry
and Klimstra (1984) and Vance and Ellis (1972) reported harvest rates of 44% and 70%,
respectively. However, these harvest rates were estimated during times when natural
predator population levels may have been lower and also may have been biased by the
methods used. Bobwhite harvest rate during the regular hunting season on BWWMA

101
appears to be high compared to other studies. Hunting pressure may have been greater on
BWWMA resulting in greater harvest mortality rates. I concur with Dixon et al. (1996)
that in the future it would be useful for studies estimating over-winter survival and
harvest mortality to report a standardized measurement of hunting pressure so that results
are more comparable.
The confidence intervals for the effect of total season hunting pressure on survival
during the regular hunting period were wide; however, the model does give some idea of
the amount of hunting pressure that should be allowed for desired harvest rates. I plotted
the observed hunting pressures and corresponding harvest rates for the 2003 to 2008
regular hunting seasons (Figure 3.8). The model seemed to underestimate harvest rates
because the range between the estimated harvest rate and the more conservative
confidence interval appeared to provide the most realistic harvest rate predictions.
Terhune et al. (2007) concluded that the harvest rates <12% on their study sites were
adequate to maintain consistent bobwhite population levels. Although the disparity is
large, this is in agreement with the conclusion that harvest rates >30% can cause
population decline (Landers and Mueller 1986). The average harvest rate during the zone
F hunt over the six years of my study was 11%. Pre-hunt density estimates for zone F
were consistently greater than any other hunt zone (Table 3.28). This result strengthens
the indication that the harvest rate during the BWWMA regular hunting season. If the
goal of management is to increase the bobwhite population on BWWMA, the target
harvest rate during the regular hunting season should be much lower than observed.
Pre-hunt density the following year was not related to the over-winter survival
rates observed during my study. This result suggests that other factors during the
summer (i.e., number of nesting attempts and brood survival) were affecting the pre-hunt
density in the fall. In their sensitivity analysis, Sandercock et al. (2009) identified
bobwhite winter survival, summer survival, and chick survival as the key factors related
to variance in population change. Sub-adult fertility and over-winter survival were the
two demographic parameters most influential to bobwhite population change in Alabama
(Folk et al. 2007). One possible explanation for my result is that the range of over-winter
survival evaluated in my study was below the threshold for a positive population

102
response the following year. Over-winter survival rates above the threshold may increase
the breeding season population to a level that increases overall reproduction and,
therefore, the fall population. Nevertheless, further investigation into bobwhite
demographic parameters during the summer on BWWMA may identify other factors that
are limiting population growth.
Year A B C D F
2003-2004 0.213 0.068 0.116 0.106 0.276
2004-2005 0.257 0.120 0.178 0.302 0.625
2005-2006 0.227 0.185 0.216 0.116 0.392
2006-2007 0.268 0.139 0.203 0.600 0.747
2007-2008 0.104 0.081 0.151 0.154 0.782
2008-2009 0.154 0.101 0.524 0.081 0.920
Pre-hunt Bobwhite Density Estimates (birds/ha) by Zone
Table 3.28: Pre-hunt density estimates for bobwhites in each hunting zone on
BWWMA in southwest Florida, 2003 - 2009.

103
MANAGEMENT IMPLICATIONS
My results indicated that food strips and prescribed burning appeared to have a
minimal effect on over-winter survival. As food-strip planting and prescribed burning
are two of the main management practices on BWWMA, I believe more information and
more specific analyses (i.e., food strip and burning proportions of individual home
ranges) are needed to truly understand the relationships food strips and burning have with
survival.
Figure 3.8: Predicted harvest rates in relation to observed hunting pressures and associated
harvest rates during the northern bobwhite study in southwest Florida, 2003 – 2009. The
predicted relationship (solid line) and 95% confidence intervals (dashed lines) were derived and
extrapolated in Program MARK from the relationship between over-winter survival and hunting
pressure. The observed hunting pressure and associated harvest rates (dots) are the actual data
for each year.
0.0000
0.0500
0.1000
0.1500
0.2000
0.2500
0.3000
0.3500
0.4000
0.4500
0.5000
0.5500
0.6000
0.6500
0.7000
0.7500
0.8000
0.8500
0.9000
0.9500
1.0000
0 5 10 15 20 25 30 35 40 45 50 55 60 65 70 75 80 85 90 95 100
Ha
rves
t R
ate
Total Season Hunter Days / 1000 ha
Harvest Rate 95% CI
2004
2005
2006
2007
2008
2003

104
Hunting pressure was the most important factor influencing over-winter survival
on BWWMA. For example, in the 2008 – 2009 over-winter period, survival was the
greatest of the six years studied and hunting pressure was the least. Hunting pressure and
the related harvest rates observed on BWWMA may be additive to natural mortality and
too great to sustain the bobwhite population according to other research (Landers and
Mueller 1986, Terhune et al. 2007). The habitat appeared to be adequate for bobwhites
and management practices that I evaluated did not seem to be negatively impacting the
bobwhites. Predator management is an option to reduce natural predation, but to be done
effectively, it is expensive and time consuming. Also, federal laws prevent the control of
avian predators. Therefore, for BWWMA, under the current management regime, the
only pragmatic option to increase the bobwhite population appears to be harvest
management. Reducing the target harvest rate may be the most reasonable way to
increase the population. Reductions in bag limits affect only a small number of hunters
and do not contribute much to harvest rate reduction (Guthery et al. 2004). Individual
bird quotas (i.e., seasonal limits to the number of bobwhites harvested) are difficult to
regulate. According to my model, harvest rate reduction can be achieved by reducing the
number of hunter days (Table 3.29). A desired harvest rate could be achieved by a zonal
hunter-day quota. For example, if a 15% harvest rate is desired, zone A could be closed
after reaching 131 hunter days. Or, the current season length could be maintained and the
number of hunters allowed to hunt in each zone each day reduced to the zone season total
hunter days divided by the number of hunt days in the season (i.e., for 15% harvest rate in
zone C, 118/24 hunt days ≈ 5 hunter days per bobwhite hunt day). Finally, the number of
bobwhite hunt days per week could be reduced from four to allow more hunting
opportunity each hunt day, but for fewer days during the 6-week bobwhite hunting
season.

105
Zone A Zone B Zone C Zone D
(5,977 ha) (6,258 ha) (5,396 ha) (5,539 ha)
12% 18.3 109 115 99 101 424
15% 21.9 131 137 118 121 506
20% 28.4 170 178 153 157 658
30% 40.9 244 256 221 227 948
* Average of the low- and mid- range estimates from the model relating hunting pressure to harvest rate in Question 4.
Hunting Pressure
Harvest Rate Hunter days/1000 ha*
Total Hunter
Days
Table 3.29: Harvest rates and associated hunting pressures for bobwhite hunting on BWWMA in
southwest Florida.

106
LITERATURE CITED
Anderson, D. R. 2008. Model based inference in the life sciences: a primer on evidence.
Springer, New York, New York, USA.
Brennan, L. A. 1991. How can we reverse the northern bobwhite population decline?
Wildlife Society Bulletin 19:544-555.
Burger, L. W., Jr., T. V. Dailey, E. W. Kurzejeski, and M. R. Ryan. 1995. Survival and
cause-specific mortality of northern bobwhite in Missouri. Journal of Wildlife
Management 59:401-410.
Burger, L. W., D. A. Miller, and R. I. Southwick. 1999. Economic impact of northern
bobwhite hunting in the southeastern United States. Wildlife Society Bulletin
27:1010-1018.
Burnham, K. P., and D. R. Anderson. 2002. Model selection and multimodel inference: a
practical information-theoretic approach. 2nd edition. Springer, New York, New
York, USA.
Curtis, P. D., B. S. Mueller, P. D. Doerr, and C. F. Robinette. 1988. Seasonal survival of
radio-marked northern bobwhite quail from hunted and non-hunted populations.
Proceedings of the International Biotelemetry Symposium 10:263-275.
Dimmick, R. W., F. E. Kellogg, and G. L. Doster. 1982. Estimating bobwhite population
size by direct counts and the Lincoln Index. Pages 13-18 in F. Schitoskey, Jr., E.
C. Schitoskey, andL. G. Talent, editors. Proceedings Second National Bobwhite
Quail Symposium. Stillwater, Oklahoma.
Dixon, K. R., M. A. Horner, S. R. Anderson, W. D. Henriques, D. Durham, and R. J.
Kendall. 1996. Northern bobwhite habitat use and survival on a South Carolina
plantation during winter. Wildlife Society Bulletin 24:627-635.
Folk, T., R. Holmes, and J. Grand. 2007. Variation in northern bobwhite demography
along two temporal scales. Population Ecology 49:211-219.
Frye, O. E. J. 1954. Charlotte County quail investigation. Report: Pittman-Robertson
Project Florida W-11-2.
Giocomo, J. J., D. A. Buehler, and J. Fitzgerold. 2008. Integrating grassland and
shrubland bird conservation with the northern bobwhite conservation initiative for
the central hardwoods bird conservation region. Pages 545-556 in T. D. Rich, C.
Arizmendi, D. Demarest, andC. Thompson, editors. Proceedings of the Fourth
International Partners in Flight Conference: Tundra to Tropics. McAllen, Texas.

107
Guthery, F. S., A. K. Crews, J. J. Lusk, R. N. Chapman, and M. Sams. 2004. Effects of
bag limits on bobwhite hunters and harvest. Journal of Wildlife Management
68:1095-1103.
Hernández, F., F. Hernández, J. A. Arredondo, F. C. Bryant, L. A. Brennan, and R. L.
Bingham. 2009. Influence of precipitation on demographics of northern
bobwhites in southern Texas. Wildlife Society Bulletin 33:1071-1079.
Hughes, D. W., T. M. Terhune, D. C. Sisson, and H. L. Stribling. 2005. Demographics of
northern bobwhite on agricultural and intensively-managed bobwhite plantation
landscapes. Proceedings of the Annual Conference Southeastern Association of
Fish and Wildlife Agencies 59:30-42.
Landers, J. L., and B. S. Mueller. 1986. Bobwhite quail management: a habitat approach.
Miscellaneous Publication 6. Tall Timbers Research Station, Tallahassee, FL,
USA.
Lusk, J. J., F. S. Guthery, and S. J. DeMaso. 2001. Northern bobwhite (Colinus
virginianus) abundance in relation to yearly weather and long-term climate
patterns. Ecological Modelling 146:3-15.
Madison, L. A., R. J. Robel, and D. P. Jones. 2002. Hunting mortality and overwinter
survival of northern bobwhites relative to food plots in Kansas. Wildlife Society
Bulletin 30:1120-1127.
Pollock, K. H., T. M. Clinton, W. R. Davidson, F. E. Kellogg, and G. L. Doster. 1989.
Survival rates of bobwhite quail based on band recovery analyses. Journal of
Wildlife Management 53:1-6.
Robel, R. J., and K. E. Kemp. 1997. Winter mortality of northern bobwhites: effects of
food plots and weather. The Southwestern Naturalist 42:59-67.
Robinette, C. F., and P. D. Doerr. 1993. Survival of northern bobwhite on hunted and
nonhunted study areas in the North Carolina sandhills. Pages 74-78 in K. E.
Church, andT. V. Dailey, editors. Quail III: National Quail Symposium. Pratt,
Kansas.
Roseberry, J. L., and W. D. Klimstra. 1984. Population ecology of the bobwhite.
Southern Illinois University Press, Carbondale, USA.
Rosene, W. 1969. The bobwhite quail: its life and management. Rutgers University Press,
New Brunswick, New Jersey, USA.
Sandercock, B. K., W. E. Jensen, C. K. Williams, and R. D. Applegate. 2009.
Demographic sensitivity of population change in northern bobwhite. Journal of
Wildlife Management 72:970-982.

108
Sparkman, A. M., L. P. Waits, and D. L. Murray. 2011. Social and demographic effects
of anthropogenic mortality: a test of the compensatory mortality hypothesis in the
red wolf. PLoS ONE 6(6):e20868. doi:20810.21371/journal.pone.0020868.
Stoddard, H. L. 1931. The bobwhite quail: its habits, preservation and increase. Charles
Scribner's Sons, New York, New York, USA.
Suchy, W. J., and R. J. Munkel. 2000. Survival rates for northern bobwhites on two areas
with different levels of harvest. Pages 140-146 in L. A. Brennan, W. E. Palmer, L.
W. Burger, Jr., andT. L. Pruden, editors. Quail IV: Proceedings of the Fourth
National Quail Symposium. Tall Timbers Research Station, Tallahassee, FL.
Taylor, J. D., II, L. W. Burger, Jr., S. W. Manley, and L. A. Brennan. 2000. Seasonal
survival and cause-specific mortality of northern bobwhites in Mississippi. Pages
103-107 in L. A. Brennan, W. E. Palmer, L. W. Burger, Jr., andT. L. Pruden,
editors. Quail IV: Proceedings of the Fourth National Quail Symposium. Tall
Timbers Research Station, Tallahassee, FL.
Terhune, T. M., D. C. Sisson, J. B. Grand, and H. L. Stribling. 2007. Factors influencing
survival of radiotagged and banded northern bobwhites in Georgia. Journal of
Wildlife Management 71:1288-1297.
Townsend, D. E., R. L. Lochmiller, S. J. DeMaso, D. M. Leslie, A. D. Peoples, S. A.
Cox, and E. S. Parry. 1999. Using supplemental food and its influence on survival
of northern bobwhite (Colinus virginianus). Wildlife Society Bulletin 27:1074-
1081.
Vance, D. R., and J. A. Ellis. 1972. Bobwhite populations and hunting on Illinois public
hunting areas. Pages 165-173 in J. A. Morrison, andJ. C. Lewis, editors.
Proceedings First National Bobwhite Symposium. Stillwater, Oklahoma.
White, G. C., and K. P. Burnham. 1999. Program MARK: survival estimation from
populations of marked animals. Bird Study 46:120-139.
Williams, C. K., R. S. Lutz, R. D. Applegate, and P. William. 2009. Winter survival and
additive harvest in northern bobwhite coveys in Kansas. Journal of Wildlife
Management 68:94-100.

109
PART IV
CONCLUSIONS
110
The two primary objectives of my research were to (1) determine factors related
to nest survival of northern bobwhites on Babcock-Webb Wildlife Management Area
(BWWMA) in southwest Florida (Part II); and (2) determine the factors related to
over-winter survival of northern bobwhites on BWWMA in southwest Florida (Part III).
My key conclusions from the analyses are briefly discussed below.
Nest survival has not been found to be an important factor related to bobwhite
population change (Sandercock et al. 2009). Incubation period nest survival rates on
BWWMA were similar to other estimates reported from studies throughout the bobwhite
range (Burger et al. 1995, Terhune et al. 2006, Collins et al. 2009, Potter et al. 2011).
Reproductive parameter estimates from BWWMA were very comparable to those from a
Georgia study (Terhune et al. 2006) which supported far greater bobwhite densities.
These results suggest that recruitment in the population is probably not a key limiting
factor for bobwhites on BWWMA. Nest survival was best described as a function of
quadratic time and broad-scale habitat characteristics. Daily nest survival decreased
throughout the nesting period, slightly leveled off at the end, and was positively related to
the proportion of the 1000-m radius area around a nest comprised of basin marsh habitat.
The peak nesting occurred between late April and late June. Managers should keep this
in mind when conducting habitat management (i.e., chopping and burning) during the
breeding season. An effort should be made to reduce the impact of management on
bobwhite nest survival during this period as survival of these nests may be extremely
important to fall populations.
Based on my results, harvest appeared to be additive to natural mortality and
hunting pressure was the main factor related to bobwhite over-winter survival (Part III).
Over-winter survival has been identified as a parameter highly associated with bobwhite
population change (Folk et al. 2007, Sandercock et al. 2009). Other factors found to be
associated with over-winter survival in my analysis (i.e., temperature and pre-hunt
density) are not directly manageable. Therefore, until factors affecting other important
bobwhite demographic parameters are identified, reducing over-winter mortality by
regulating hunting pressure may be the best opportunity to increase the BWWMA
bobwhite population. The significant reduction in over-winter mortality in 2008 in

111
response to reduction in hunting pressure is an indication that this management strategy
will be effective.
Finally, future research could investigate summer adult survival, chick survival
(Sandercock et al. 2009), and sub-adult fertility (Folk et al. 2007) which are other
parameters that have been identified as highly associated with bobwhite population
change. All factors (i.e., spatial, temporal, biological, climatic) should be evaluated as to
their relation to bobwhite demographic parameters, because it is important to understand
how these factors affect bobwhites. However, an emphasis should be placed on factors
controlled via management. If other manageable variables strongly related to these
population parameters can be identified and understood, bobwhite population recovery
could be expedited by addressing limiting factors on all fronts. In all likelihood, the
BWWMA bobwhite population is not being limited by simply one factor but instead by
the complex interaction of several key factors linked to survival and recruitment.
Managing for improvement in both recruitment and survival is likely to have the best
chance for successful restoration of the bobwhite population.
112
LITERATURE CITED
Burger, L. W., Jr., M. R. Ryan, T. V. Dailey, and E. W. Kurzejeski. 1995. Reproductive
strategies, success, and mating systems of northern bobwhite in Missouri. The
Journal of Wildlife Management 59:417-426.
Collins, B. M., C. K. Williams, and P. M. Castelli. 2009. Reproduction and microhabitat
selection in a sharply declining northern bobwhite population. The Wilson Journal
of Ornithology 121:688-695.
Folk, T., R. Holmes, and J. Grand. 2007. Variation in northern bobwhite demography
along two temporal scales. Population Ecology 49:211-219.
Potter, L. M., D. L. Otis, and T. R. Bogenschutz. 2011. Nest success of northern
bobwhite on managed and unmanaged landscapes in southeast Iowa. Journal of
Wildlife Management 75:46-51.
Sandercock, B. K., W. E. Jensen, C. K. Williams, and R. D. Applegate. 2009.
Demographic sensitivity of population change in northern bobwhite. Journal of
Wildlife Management 72:970-982.
Terhune, T. M., D. C. Sisson, and H. L. Stribling. 2006. The efficacy of relocating wild
northern bobwhites prior to breeding season. Journal of Wildlife Management
70:914-921.

113
VITA
Steven was born and raised in Columbia, TN. Though his parents lived in a
neighborhood, there was a creek nearby and wooded areas around that were his
playgrounds. He also spent time during summers at family farms in Rives, TN and
Fayetteville, TN, where he gained a love and appreciation for nature and the outdoors. At
the age of ten, Steven met a couple of excellent birders who taught him bird identification
and banding. Steven also grew up in the Boy Scouts of America and was lucky to have
two excellent scoutmasters who took him on local and national high adventure camping,
canoeing, and backpacking trips. He earned his Eagle Scout honor and graduated from
Columbia Central High School in the spring of 1998, and enrolled in the University of
Tennessee, Knoxville as a Wildlife and Fisheries Science major the following fall.
Steven interned with the U.S. Fish and Wildlife Service at Seedskadee National Wildlife
Refuge in southwestern Wyoming during the summer of 2001. His main duties there
were surveying and reporting results of raptor, waterfowl, and sage grouse populations on
the refuge. After receiving his Bachelor of Science degree in the spring of 2002, Steven
returned to Seedskadee NWR as a seasonal biotech performing many of the same duties
he had as an intern. He also met his future wife, Amy, in Wyoming. In September of
2002, he accepted a job with the Florida Fish and Wildlife Conservation Commission
studying northern bobwhites in southwest Florida. After two years as a field technician,
Steven was promoted to field supervisor and retained that position until the end of the
study in June of 2009. The research involved trapping and radio tracking wild bobwhites
to determine survival rates of adults and nest survival. In the spring of 2010, with
permission from the State of Florida, Steven took the data he collected on the bobwhite
study to the University of Tennessee to pursue a Master of Science degree. He graduated
with that degree in December 2011. Steven is married to his beautiful wife, Amy. They
have two English pointers, Scout and Nash. Someday, they hope to be able to put them
on bobwhites again.