factory facilities programs: phase 2
TRANSCRIPT
Factory Facilities Programs: Phase 2 An NADA/CADA Research Project
By Glenn A. Mercer
February, 2013
1
Factory Facilities Programs: Phase 2 An NADA/CADA Research Project
By Glenn Mercer
Introduction The purpose of this report is to build on the results of our project’s Phase 1 report, released about one
year ago. Both phases are focused on the challenge of trying to better understand the economics of
investments in new-car dealership facilities, especially as requested by car company “image” programs.
Phase 1 relied on a broad range of about 75 fairly short interviews with OEMs, dealers, and other
industry experts, and focused on the impact on dealer economics (ROI) in the present day. Phase 2, in
attempting to build on and improve upon the Phase 1 results, shifted methodology to a smaller sample
of about 35 more in-depth interviews and visits with dealers and experts. Phase 2 also broadened its
focus from the implications of facility investments on today’s dealership, to the implications for
tomorrow’s dealership as well. (That is, even if an upgrade to a store makes sense in 2013, how can a
dealer be sure that this upgrade will not have to be scrapped in a few years, as market conditions shift?)
The impetus for this second phase came once again from NADA, who, responsive to the ongoing
concerns expressed by its members about factory image programs, decided to request these additional
analyses and findings.
Besides the changes in methodology and focus, this Phase 2 report has an additional new element: the
participation of Canadian dealerships. Factory facilities programs are of course not unique to the United
States, and so, after Phase 1 concluded, the Canadian Automobile Dealers Association (CADA) asked for
us to include a sample of its members in this Phase, and we have done so. Since the issues – and the
way dealerships operate – are similar on both sides of our mutual border, we have not generally in this
report identified whether a particular store is Canadian or American, but we have inserted a separate
section that discusses how our general findings may vary from one country to the other. We are very
happy to have CADA’s participation, as we believe this only makes our findings more robust, and thank
them for their support of this project.
The contents of the rest of this report are as follows. After acknowledgements of those participants to
whom we owe particular thanks, we will proceed to a summary of all our findings and
recommendations. A recap of the Phase 1 findings follows, for the sake of completeness, but this can be
skipped by readers familiar with the Phase 1 report (which is freely available on the NADA website).
From there we go into the three main substantive topics of Phase 2: What has changed since Phase 1?;
What have we learned further about facilities ROI?; and Where do we see the physical facilities of the
dealership of the future heading? We close the second and third second sections with
recommendations for action, and then wrap up with some appendix material.
2
Acknowledgements As in Phase 1, to enable all participants to speak freely, we have followed a policy of absolute
confidentiality: no names of any individuals, dealerships, or car companies disclosed without their
explicit permission.1
However, several contacts did agree to disclosure, and we would like to take the opportunity here to
offer thanks to several firms and individuals that were of particular help to us. These include
Scott Watkins, Anderson Economic Group
Joe Magyar and Greg Dougherty, Crowe Horwath LLP
Jeremy Anwyl and Lacey Plache, Edmunds.com
Alan Haig and Erin Kerrigan, The Presidio Group LLC.
Stephen Kay, Cushman & Wakefield
Dealership design expert John J. Buono, Senior
Architect Simon Yu
Ralph Idems and Chester Nizol, of Design Science and OmniPlan
A special note of thanks must go to Charles Seguin and Patrice Maltais in Canada. Patrice was our
invaluable CADA liaison; Chuck is President of Seguin Advisory Services. These two proposed, arranged,
and participated in all our interviews right across Canada. In particular, Chuck’s relationships within the
Canadian industry, and knowledge of the Canadian dealership landscape, were extremely helpful. Given
this division of labor, for questions about this report, please contact Glenn Mercer for USA-specific
issues ([email protected]) and Chuck Seguin for specifically Canadian questions
([email protected]). Readers who are also dealers can of course get in touch with their respective
NADA or CADA representatives for more information about this project.
Note that none of the opinions expressed in this report should be attributed directly to any particular
one of these people. Of course, any errors in this report are not theirs, but my own. Also, please
contact Glenn Mercer if you’d like to be put in touch with any of these experts.
I would also like to thank all the good people at NADA who assisted me in this work, and especially thank
them for their patience with and confidence in me, as various issues forced me to delay the production
of this report by over a month. And also, it is important to remind all our readers that the opinions
expressed in this report are my own, and do not necessarily reflect those of the National Automobile
Dealers Association.
Finally, my heartfelt thanks go out to the many dealers, architects, designers, attorneys, accountants,
OEM personnel, appraisers, and others who gave generously of their time and insights to us. Though
they mostly remain nameless here, they know who they are, and they have the sincere thanks of both
myself as author, and of NADA and CADA as project sponsors.
1 Some names appear in an indirect sense: for example, our discussions of Apple and Tesla are based on public
records, but not on any direct communications with personnel at those firms.
3
Executive Summary This Phase 2 report is split across three main sections, following a recap of Phase 1’s findings.
In the first section we briefly examine whether the facility image program issue is still as painful for
dealers as it was in 2010 and 2011, and conclude that indeed it is not, in part because business
conditions have improved. However, there is still great room for improvement (which is one reason we
are writing this report), as dealers overall still give facility image programs only lukewarm support.
In the second section we revisit the ROI issue from Phase 1, this time including a wide range of
individual dealership case studies so that we are working with even more data. As a result, we
essentially reconfirm our Phase 1 findings: that expansion of the facility can pay off well, that
modernization is harder to justify, and standardization (as we define it, which is replication of features
from store to store far above and beyond logos and signage) seems to be of no benefit. But we add
more color and detail to the story, pointing out that some spending provides lucrative returns (typically
through the refurbishment of a totally run-down store), and that some maintenance spending should
not be expected to yield any significant return at all, as it represents the “table stakes” that dealers need
to spend just to stay in the business. We, as before, add insights from other retailing industries,
pointing out in particular that some of these have been pretty good at developing the solid, quantified
business cases for facility upgrades that we find are lacking among some – but not all – automotive
OEMs. As a result, we repeat our request to the OEMs, that they redouble their efforts to provide
dealers with better business cases in conjunction with their requests for facility investments – and
especially, to ease off on standardization demands that seem to us very hard to justify.
In the third section we break newer ground, in looking at “the dealership of the future” (DOF). This
topic came onto the radar screen when dealers began to ask, “Even if the investments I am making
today pay off over the next few years, am I building a store that will be obsolete soon after that?” These
concerns emerged as all of us noticed turmoil in other retail sectors, such as the closing of Border’s
stores and the downsizing of Best Buy and other “big box” outlets. We cast our research net wide here,
taking into account the past evolution of our industry, previous predictions about where it was headed,
insights from consumer research broadly, interviews of dealers and other experts, and more. Our
conclusion is that the dealership of 2025 or so will be an evolution of today’s store – the dealership
system will stay fundamentally intact – but with the possibility for much greater efficiency of operations
through the use of various innovations, from the moving offsite of support functions to the use of new
approaches to grow service volumes, and more. But we are very worried that the present trend to ever
more-expensive and more-brand-customized stores will lead to excessive and wasteful spending, as
dealers repeatedly “raze and rebuild” their facilities to keep up with constantly-updated OEM brand
campaigns. And meanwhile, customer needs and behaviors continue to shift. Therefore we urge that
OEMs and dealers alike get more creative in addressing those changing needs and behaviors (especially
in the crucial area of service work), and that OEMs become more flexible in approving low-cost ways to
implement these ideas. In particular, we urge movement toward lower-cost ways of reconfiguring
stores: for example, using reprogrammable graphic displays and projections to reflect changes in brand
campaigns can be a lot cheaper and less disruptive than continually jackhammering up floor tile and
4
knocking down walls. If we head this way, the Dealership of the Future in North America will be less of
an overbuilt and expensive “Garage Mahal,” and more of a right-sized model of retailing efficiency.
As before, there is no one-size-fits-all solution in these pages, but we hope that the information and
opinions contained herein will assist both dealers and OEMS to, on the one hand, understand each
other’s points of view better, and on the other, to negotiate on a more informed basis the most efficient
(low cost) and effective (high growth) way to invest in dealership facilities, for today and for tomorrow.
Main Findings I. Phase 1 Recap
This chapter can be skipped by readers who have gone through the Phase 1 report. Please see that
report (available on the NADA website, www.nada.org) for more details about the condensed version
presented below.
Genesis. Our original project was launched by NADA in August of 2011, in response to numerous
communications from NADA members expressing concerns and frustrations about how factory facility
programs were both designed and executed. However, when in response to such concerns, NADA first
began investigating factory facility programs, they were surprised to find that little hard evidence exists
as to the return on investment (ROI) in facilities, either to the OEM or to the dealer (not to mention to
the customer!). As a result, the facility investment decision is often based on subjective factors such as
opinions, assertions, and anecdotes, which is no way to guide such massive spending. Accordingly,
NADA undertook Phase 1 of this project. It was intended to be an objective, unbiased study of the
various factors that drive the economics of facility programs, both positively and negatively, in order to
move the facility investment decision onto a more rational, informed and fact-driven footing.
Context. At a very high level, this project was over the very day it started. That is, if we speak in the
most general terms, virtually everyone in the American auto industry agreed that dealers, OEMs, and
consumers alike are justified in expecting that new cars be sold from clean and modern facilities that are
supportive of the car brand a given dealer is carrying. However, "the devil is in the details," and this
phase dealt with those details, about which there was much less agreement. The details we focused on
are those involved with car company facility programs. These go by various names, but in every case
they involve the Original Equipment Manufacturer (OEM, aka "the factory"), such as Ford or Fiat,
requesting that its dealers expand, modernize, or standardize their facilities (aka "stores") in order to
meet a projected quantity of sales and service demand, and with the appropriate quality of customer
satisfaction. The required expenditures can be very significant: it is hard to imagine a program whose
cost is under $100,000, and it is common to see outlays exceeding $5,000,000.
Caveat. It soon became clear that agreement on dealership facilities, virtually unanimous at a very high
level, would be essentially impossible at the detailed level. There was no reasonable way for an
industry-wide project to say that "The dealers want this…" or "The factories think this…" ─ there is too
5
much divergence of circumstances, experiences, values, and beliefs. In the absence of a one-size-fits-all
solution, therefore, we adopted a more modest goal: if we can't eliminate tensions with a universal
solution, then at least we can reduce tensions by bringing as many opinions, issues, and perspectives as
possible out into the open, from a variety of industry participants. And we did in our research uncover
several areas where we thought there was real room for improvement, in program design and
execution, that would benefit most participants in most situations.
Methodology. Our process for finding these answers was straightforward: we would try to carry out in-
depth interviews with everyone and anyone who might have insight into the topic. In Phase 1,
therefore, we spoke to dozens of dealers (public and private, large and small, highline and mass-
market), OEMs (twelve in all), and experts in various aspects of automotive retailing (dealership-focused
attorneys, CPAs, buy/sell brokers, facility appraisers, architects, designers, lenders, economists, vendors,
and more). We also sought insights from other retailing industries with experience in facility upgrade
programs, including franchised restaurants and hotels. And, of course, we surveyed customers ─ car
buyers ─ for their views. We then supplemented these interviews (numbering about 75, both in-person
and via phone) with desk research covering automotive industry periodicals, economic journals, facility
program manuals, and various other sources.
Overall Findings. We first identified the overall views of four key constituencies, or groups of industry
participants with a stake in the answer: dealers, OEMs, supporting players (experts such as CPAs,
lenders, attorneys, dealership brokers, etc.), and consumers. In summary, we found that dealers are
supportive of the concept of facility programs, but wary of their economics. Expert observers tend to
echo this view. The OEMs are understandably enthusiastic about the programs, but approach them in
very different ways. And consumers, if what they are telling us reflects their actual behavior, are mostly
indifferent. But we cannot draw too many conclusions from these views, or make recommendations as
to how to align programs with them, because as noted at the outset, the devil is in the details when it
comes to these programs. We needed some way to tackle those details, and came up with a three-layer
analytical approach.
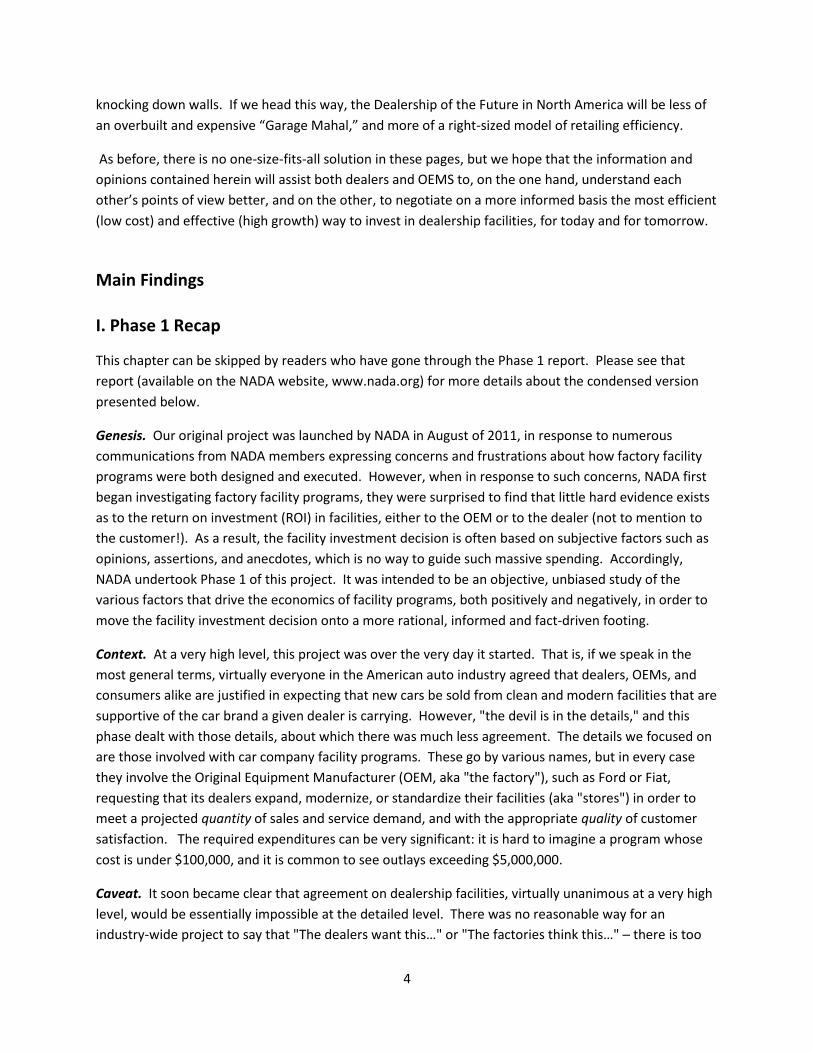
Findings by Layer: Definitions. Almost from the day this project kicked off it became clear that the
phrases "facilities programs" or "image programs" meant very different things to different people.
Some interviewees wanted to talk about signage requirements, others about service bay or stall
additions, others about floor tile upgrades. A better definition of what we were investigating was
necessary. What we came up with, which was then confirmed and fine-tuned in numerous later
interviews, is the pyramid model shown below.
6
Source: Phase 1 report
Basically, the pyramid recognizes that there are at least three "layers" to facility programs: Expansion,
Modernization, and Standardization. The issues around each layer tend to be different (even though all
three might be bundled together in any particular program), and so in our research we needed to
address them separately. We defined each layer as follows:
When an OEM and a dealer discuss adding things like parking space (for customers or for vehicle
inventory), service stalls, and interior space (such as showroom or service waiting area square
footage), they are discussing Expansion. Typically the Expansion discussion starts because a
brand's UIO (units in operation) has grown rapidly (necessitating adding service bays to repair
the larger fleet), or because an OEM is adding new models (necessitating a larger showroom), or
forecasting higher future sales or market share (requiring expansion of the entire store).
Tension here tends to arise when the factory asks for more expansion than the dealer thinks is
necessary, e.g. due to inflated volume forecasts.
Assuming the dealership facility is sized correctly, the next layer at issue is Modernization:
bringing the store up to contemporary standards both inside and out, for example with new
building fascia or windows outside, or with upgraded furniture, fixtures, and equipment (e.g.
free Wi-Fi) inside. The goal of Modernization is of course both to attract more customers and
then to better satisfy them, by surrounding them with a pleasant and up-to-date environment.
Tensions can arise both on the cost and benefit side of the equation: one dealer might see the
value in the upgrade, but believe that the factory's approved materials vendors are too costly;
another might not have a problem with the cost of the specified fixtures, but not see any value
in the project, in terms of either increased sales (in cars or service) or customer satisfaction.
If the store is now the right size and is sufficiently up-to-date, the next layer facility programs
often tackle is Standardization: ensuring that the updated facility looks as much as possible like
those of other dealers carrying the same brand, via the use of similar or identical materials,
7
floorplan templates, and commonized furniture and fixtures.2 The goal of Standardization
seems to be to somehow reinforce the power of the brand by providing a similar look, feel, and
experience for a customer of a given brand ─ whichever store she or he happens to visit.
Tensions arise here in part over the cost of Standardization, but especially over its worth: as will
be discussed later, many interviewees had trouble seeing why and how Standardization ─ as
defined by some, but not by all OEMs ─ might be valued by a customer.
Findings by Layer: Issues. The Expansion aspect of a facility program generated the least argument and
OEM/dealer tension among our interviewees, partly because it is the only layer where hard numbers are
very often available. For example, a dealer can calculate the cost of a new service bay and also calculate
the return on that cost, based on utilization percentages, technician billing rates, and parts markups.
UIO can be measured and projections made (which of course can turn out to be wrong). The return on
showroom expansion is of course more problematic. But even though this was the least contentious of
the three layers, there were four areas where it seemed that improvements could be made. In brief, we
found OEM forecasts for expansion requirements first, were generally too high or too optimistic; and
second, that they were too frequently changed to be useful planning guides; third, we saw that in
planning expansion requirements OEMs often did not take into account capacity-boosting techniques
such as 24/7 bay service bay operation; and fourth, when it came to showroom expansion we could not
identify strong business cases as to how and why this would pay off.
The Modernization aspect of a facility program generated a great deal of controversy, because while the
costs are painfully clear, the benefits are at worst minimal (the view of the most skeptical dealers and
experts) and at best unquantified (although one OEM did share with us some very useful numbers, as
discussed below). Furthermore, even those who see the benefits of Modernization often feel that its
cost, as driven by the factory's requirements and procedures, is too high. These two problems led to the
two areas where we see improvement can be made to the Modernization component of facility
programs: First and foremost, we believe it is incumbent upon OEMs to apply their enormous analytical
resources to making renewed efforts to demonstrate the value of Modernization at the dealership level,
whether to themselves, to dealers, or to customers; and secondly, even for those dealers who are
convinced of the need for and benefits of Modernization (by our estimate probably three-quarters of
the dealers we spoke with), there is a strong sense that the cost of renovating a store according to an
OEM facility program is needlessly high, relative to what it would have cost the dealer on her or his own.
The average estimate of this cost overrun was 20-30%, which of course varied dramatically by program.
Finally, we came to the Standardization layer of factory facility programs. This layer of spending
generated the most controversy, because Standardization's benefits are very unclear. Some
interviewees thought there were benefits, but that they were minimal. Others thought there were
benefits, but that they flowed all to the OEM, and not to the dealer (although in the long run the
interests of the two must to some extent converge). Others thought Standardization had no positive
2 We did not focus on signage when we discussed Standardization issues, as the great majority of our interviewees,
whether OEMs, dealers, or others, acknowledged the reasonableness of the OEM's requirement for tight control over, and standardization of, brand logos, images, signs and even exterior building color generally.
8
value at all, and actually was a drag on dealership and brand performance. The experts in particular
were unenthusiastic: economists did not see how standardization made much sense in a car retailing
environment; some marketing professionals were wary that standardization would make promises to
consumers that could not be kept; and financial advisors saw spending on standardization as actually
eroding dealership value. Perhaps the best summary of these negative views was, as one dealer put it:
"Standardization costs are just the franchise tax I have to pay."
Cross-cutting Findings. In addition to the concerns raised in our layer-by-layer review of facility
programs, we came across four sets of issues that cut across all three of these layers. These included:
Timing: was now (2011/2012) a good time to invest in a facility program?
Size bias: do OEM facility programs disproportionately burden smaller dealerships?
Incentives: are there better ways to design the incentives factories sometimes offer to dealers?
Store evolution: are we building today dealership formats that will be obsolete tomorrow?
For details of our findings in the first three of these areas, please see the Phase 1 report. The fourth
area, renamed “Dealership of the Future,” was considered to be important enough to revisit in real
depth in the Phase 2 effort, and our findings about this topic are presented later on in this report.
Recommendations. We made several recommendations at the conclusion of Phase 1, with the three
primary ones being these:
OEMs need to show better demonstration and quantification of the VALUE of investment in
facilities. This is needed not so much in Expansions, but certainly in Modernizations, and
especially in Standardizations, where the value is completely unclear.
OEMs and dealers need to work together to demonstrate how programs can be executed at
lower COST, both by more flexibility as regards designed-in cost (e.g. material specifications,
vendor approval lists) and by better implementation of program execution cost (e.g. fewer
shifting deadlines, fewer squabbles over exceptions sought or granted, less confusion caused by
outsourcing decisions to third-parties such as design firms).
All parties involved should move quickly to research and share their views of the dealership of
the future, so as to avoid facility programs encouraging the building of stores that are quickly
made obsolete, by evolution in consumer shopping and buying behavior. ( This Phase 2 report
represents an attempt – by NADA at least – to do its part in advancing this research.)
II. What Has Changed Since Phase 1 Completed? The importance of the factory facilities program issue for dealers is very significant, and accordingly,
NADA has responded to their members’ concerns about this issue with a variety of actions (including, for
example lobbying meetings with OEMs, consultations with state dealer associations, etc.). This report,
in both its Phases 1 and 2, is another aspect of NADA’s response. Additionally, NADA has recognized the
importance of these issues by building them into the ongoing Dealer Attitude Survey (DAS), which
gathers dealer opinions on the industry’s franchises, in order to help enhance dealer/manufacturer
9
relationships. The first DAS to include questions on facility programs topics was run in mid-2012, and
feedback from that has been provided to the appropriate dealerships and OEMs. In this section we will
review briefly some of the relevant findings, although only at the industry level, since brand-specific
results are only shared with the factories and dealers involved. Since this is the first DAS to contain such
questions, we can’t see precisely how dealer views about image programs have changed since 2010 or
so, but we can make some general observations based on our field work, combined with the DAS.
First, and most surprising, we were impressed by the amount of confusion in the industry about
factory image programs. For most franchises, dealers cannot figure out if an image program is
currently active or not. That is, when we asked 100 dealers of Brand X if there was an active
image program, 60 dealers might say “yes” and 30 might say “no,” and 10 would be unsure.
Obviously, there is an opportunity here for factory communications to improve.
Second, and less of a surprise, we found that participation by dealers in programs varies widely:
Asian and European brands saw roughly 75% of their stores in the process, one way or the
other, in mid-2012; domestic American brands ran closer to 50%.
Third, dealers seem mildly positive about the programs: on a 10-point approval scale all dealers
averaged together came out at 6.5-7.0. This is not what one would call a sign of much
enthusiasm, but it is broadly on the plus side of neutral. And in our opinion, this is a much more
positive answer than we would have gotten if we had asked the question in 2010 or 2011.
Fourth, there was a clear imbalance as regards dealer enthusiasm, and not just by brand:
dealers who stated that they were participating in a program are slightly more positive about
them (7.0-7.5), while dealers not participating are much more negative (4.0-5.0). In other
words, those on board are only somewhat happy about it, and those not on board are very
unhappy. The inference might be that dealers who were worried about a program before
signing on are finding from actual experience that they are not as bad as they feared.
Fifth, a very short list of OEMs dominates the lower range of opinions. No OEM got a perfect
score, and most did fairly well, but a small number rated very unpopular.
Obviously, there is a great deal of room for improvement, but our “gut feel” is that dealer attitudes
about image programs are somewhat more positive than they were in, say, late 2010. There are several
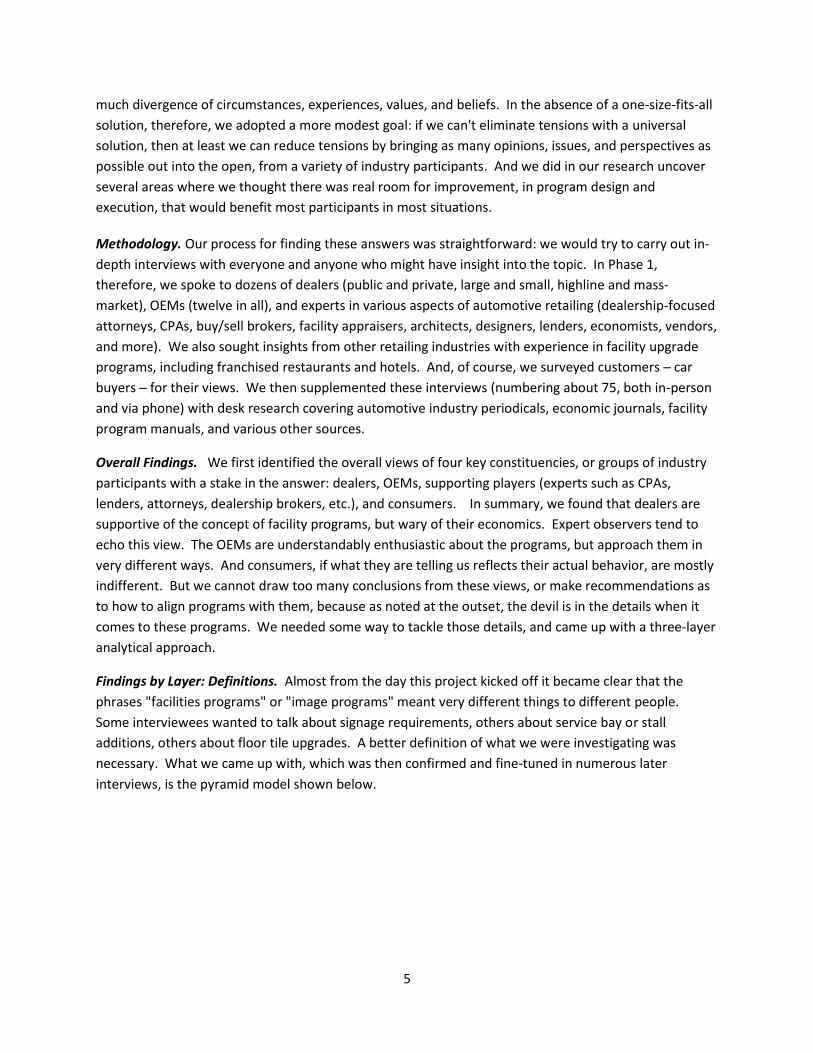
reasons for this. First, steadily improving business conditions make the issue less painful: of course, it is
easier to spend more money on the store if it is making more money. A proxy indicator for this is rent
as a percent of sales, which is shown over time on the graph below.
10
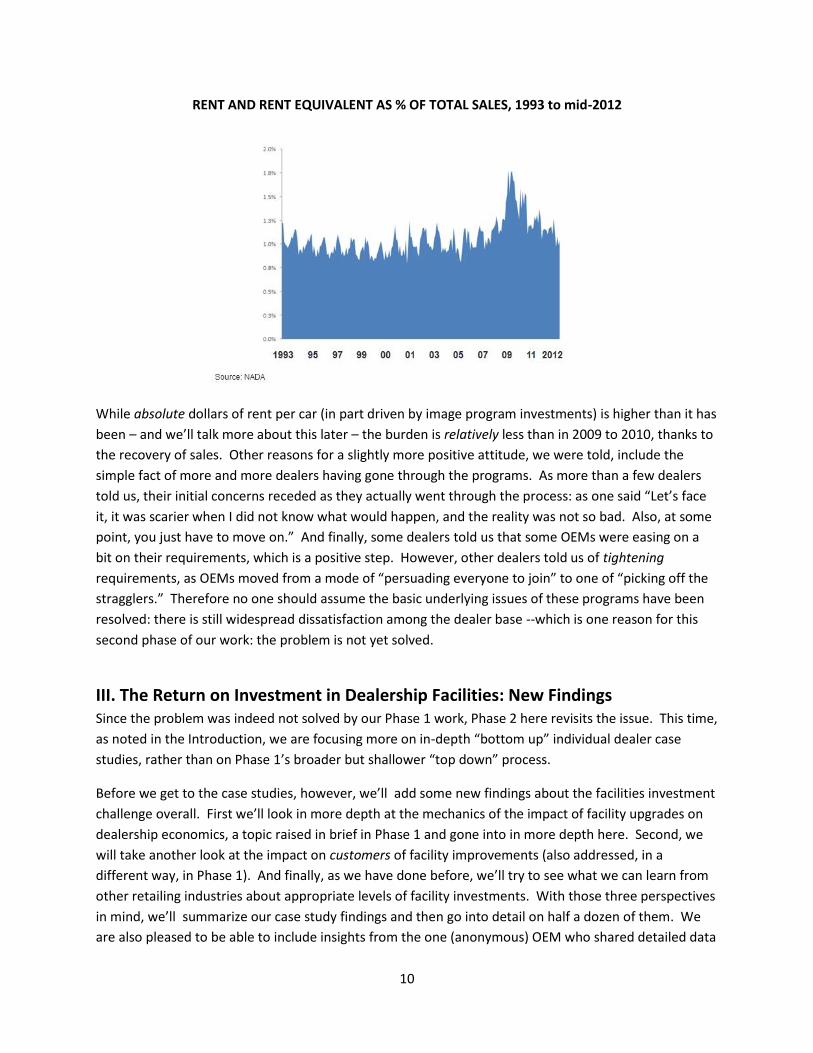
RENT AND RENT EQUIVALENT AS % OF TOTAL SALES, 1993 to mid-2012
While absolute dollars of rent per car (in part driven by image program investments) is higher than it has
been – and we’ll talk more about this later – the burden is relatively less than in 2009 to 2010, thanks to
the recovery of sales. Other reasons for a slightly more positive attitude, we were told, include the
simple fact of more and more dealers having gone through the programs. As more than a few dealers
told us, their initial concerns receded as they actually went through the process: as one said “Let’s face
it, it was scarier when I did not know what would happen, and the reality was not so bad. Also, at some
point, you just have to move on.” And finally, some dealers told us that some OEMs were easing on a
bit on their requirements, which is a positive step. However, other dealers told us of tightening
requirements, as OEMs moved from a mode of “persuading everyone to join” to one of “picking off the
stragglers.” Therefore no one should assume the basic underlying issues of these programs have been
resolved: there is still widespread dissatisfaction among the dealer base --which is one reason for this
second phase of our work: the problem is not yet solved.
III. The Return on Investment in Dealership Facilities: New Findings Since the problem was indeed not solved by our Phase 1 work, Phase 2 here revisits the issue. This time,
as noted in the Introduction, we are focusing more on in-depth “bottom up” individual dealer case
studies, rather than on Phase 1’s broader but shallower “top down” process.
Before we get to the case studies, however, we’ll add some new findings about the facilities investment
challenge overall. First we’ll look in more depth at the mechanics of the impact of facility upgrades on
dealership economics, a topic raised in brief in Phase 1 and gone into in more depth here. Second, we
will take another look at the impact on customers of facility improvements (also addressed, in a
different way, in Phase 1). And finally, as we have done before, we’ll try to see what we can learn from
other retailing industries about appropriate levels of facility investments. With those three perspectives
in mind, we’ll summarize our case study findings and then go into detail on half a dozen of them. We
are also pleased to be able to include insights from the one (anonymous) OEM who shared detailed data
11
on the ROI of their image program with us, as a final case study. These discussions will be followed by
our summary of the ROI implications – and then recommendations for both OEMs and dealers alike as
to what to do with these results.
How Big is the Problem? Dealer Perspective
While no one we know keeps good statistics on the actual amount of facility investments dealerships
make in a given year, a review of dealers we sampled indicates the number is probably between $10 and
$15 billion annually, between the USA and Canada. But the total amount is not as important as the
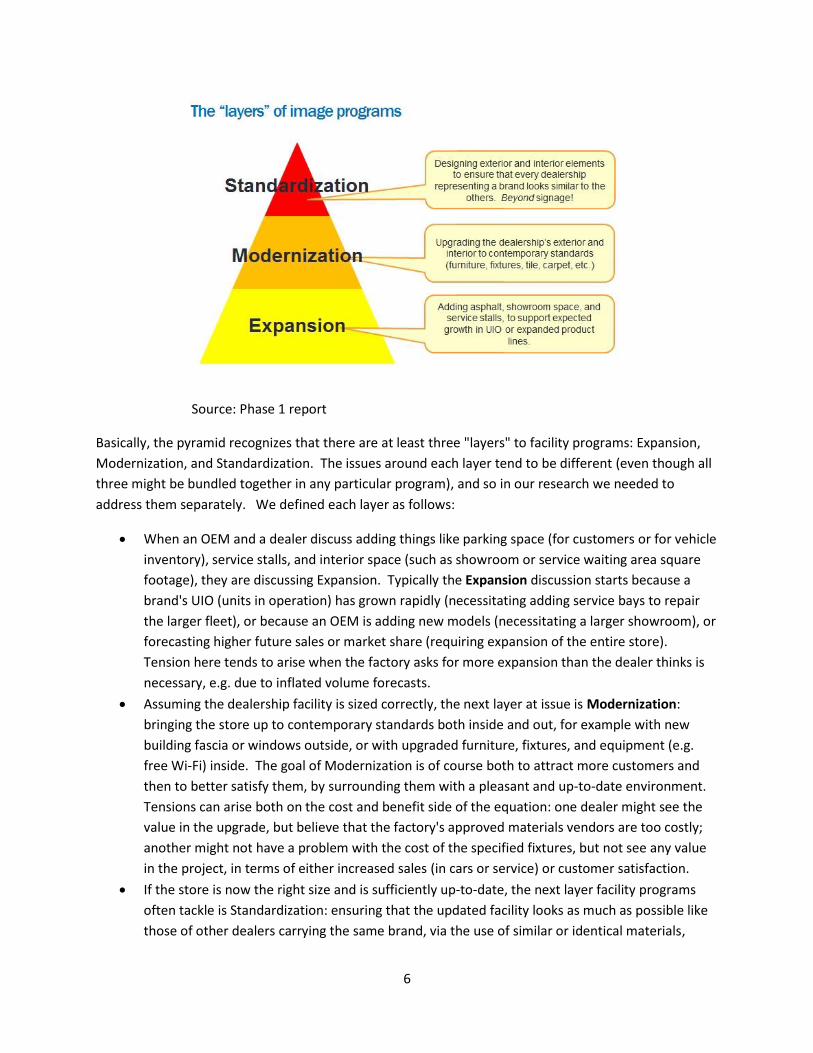
impact of image program spending on the individual dealership. One way of estimating that impact is to
look at average rent figures, as shown below:
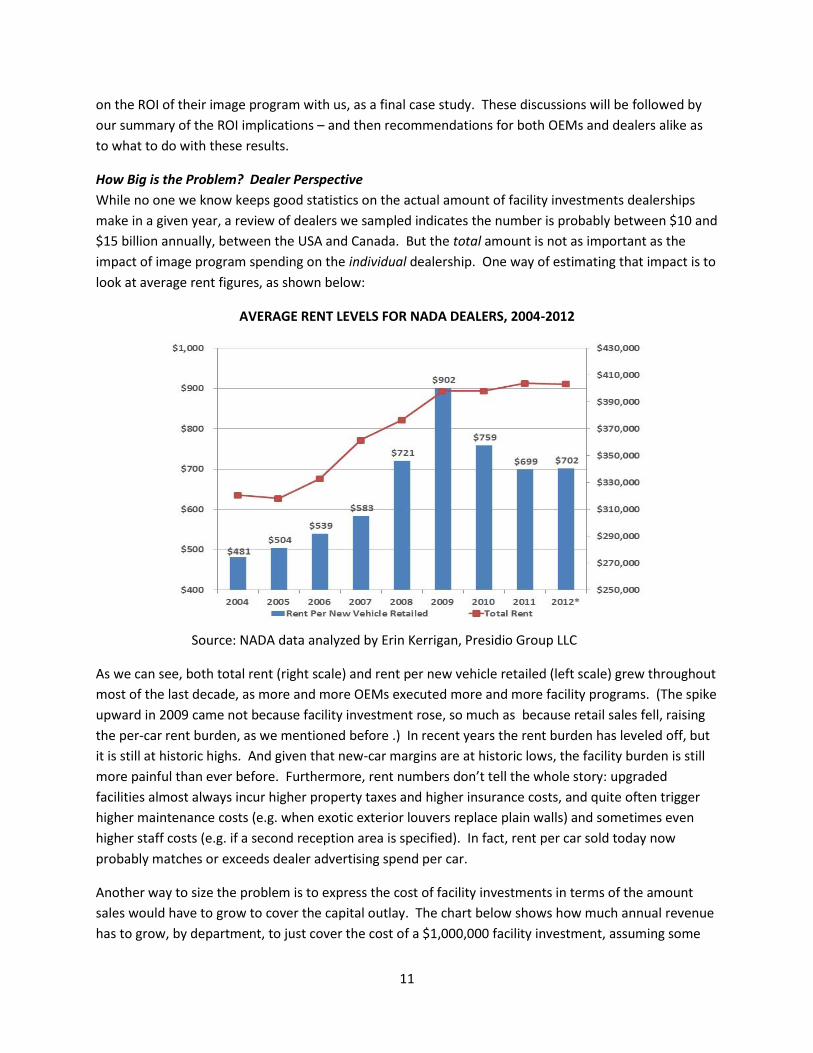
AVERAGE RENT LEVELS FOR NADA DEALERS, 2004-2012
Source: NADA data analyzed by Erin Kerrigan, Presidio Group LLC
As we can see, both total rent (right scale) and rent per new vehicle retailed (left scale) grew throughout
most of the last decade, as more and more OEMs executed more and more facility programs. (The spike
upward in 2009 came not because facility investment rose, so much as because retail sales fell, raising
the per-car rent burden, as we mentioned before .) In recent years the rent burden has leveled off, but
it is still at historic highs. And given that new-car margins are at historic lows, the facility burden is still
more painful than ever before. Furthermore, rent numbers don’t tell the whole story: upgraded
facilities almost always incur higher property taxes and higher insurance costs, and quite often trigger
higher maintenance costs (e.g. when exotic exterior louvers replace plain walls) and sometimes even
higher staff costs (e.g. if a second reception area is specified). In fact, rent per car sold today now
probably matches or exceeds dealer advertising spend per car.
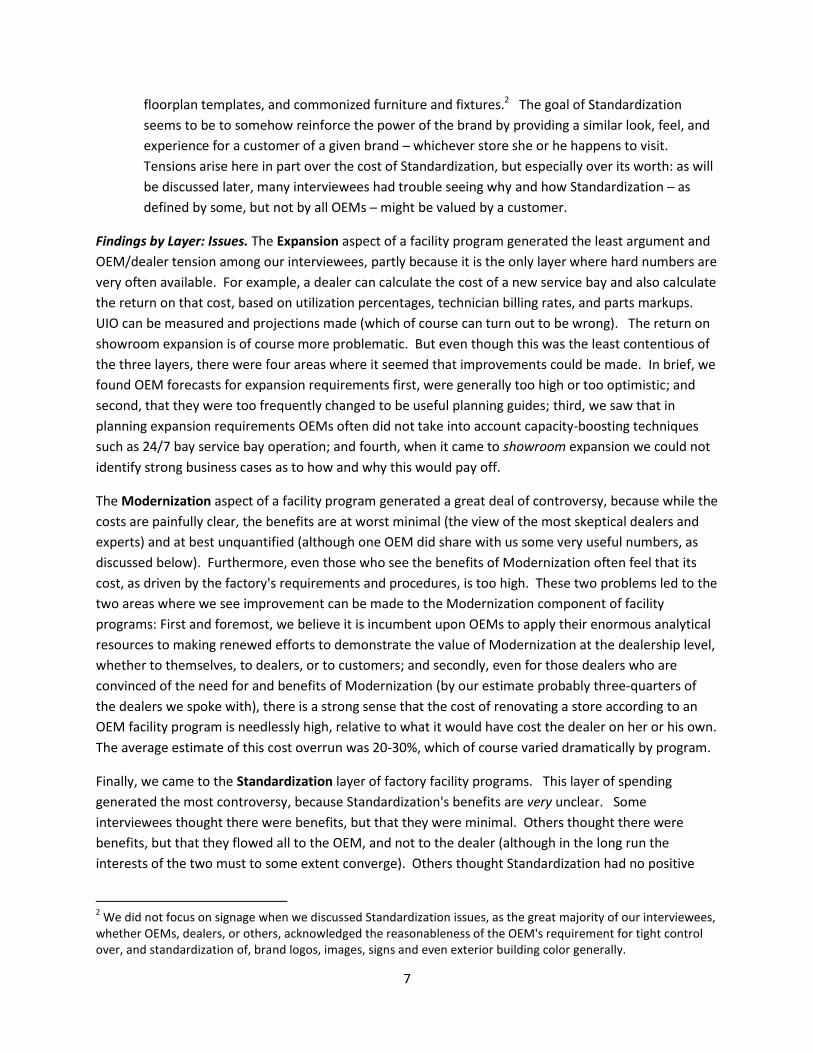
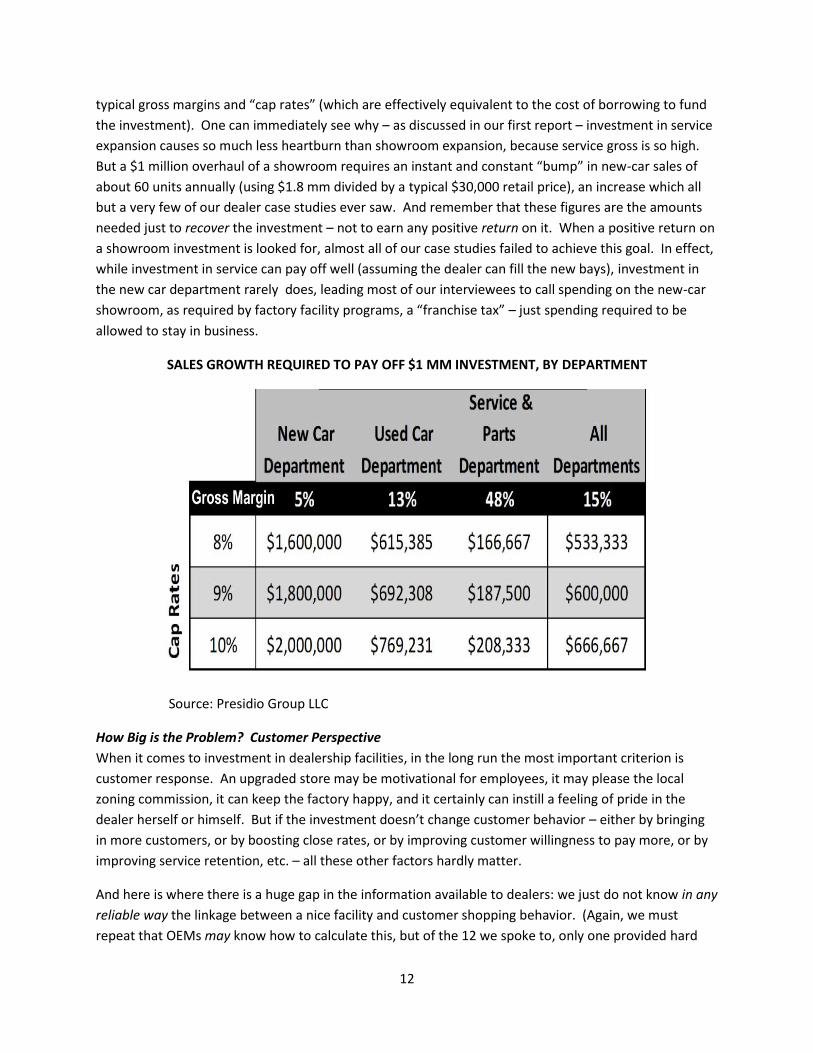
Another way to size the problem is to express the cost of facility investments in terms of the amount
sales would have to grow to cover the capital outlay. The chart below shows how much annual revenue
has to grow, by department, to just cover the cost of a $1,000,000 facility investment, assuming some
12
typical gross margins and “cap rates” (which are effectively equivalent to the cost of borrowing to fund
the investment). One can immediately see why – as discussed in our first report – investment in service
expansion causes so much less heartburn than showroom expansion, because service gross is so high.
But a $1 million overhaul of a showroom requires an instant and constant “bump” in new-car sales of
about 60 units annually (using $1.8 mm divided by a typical $30,000 retail price), an increase which all
but a very few of our dealer case studies ever saw. And remember that these figures are the amounts
needed just to recover the investment – not to earn any positive return on it. When a positive return on
a showroom investment is looked for, almost all of our case studies failed to achieve this goal. In effect,
while investment in service can pay off well (assuming the dealer can fill the new bays), investment in
the new car department rarely does, leading most of our interviewees to call spending on the new-car
showroom, as required by factory facility programs, a “franchise tax” – just spending required to be
allowed to stay in business.
SALES GROWTH REQUIRED TO PAY OFF $1 MM INVESTMENT, BY DEPARTMENT
Source: Presidio Group LLC
How Big is the Problem? Customer Perspective
When it comes to investment in dealership facilities, in the long run the most important criterion is
customer response. An upgraded store may be motivational for employees, it may please the local
zoning commission, it can keep the factory happy, and it certainly can instill a feeling of pride in the
dealer herself or himself. But if the investment doesn’t change customer behavior – either by bringing
in more customers, or by boosting close rates, or by improving customer willingness to pay more, or by
improving service retention, etc. – all these other factors hardly matter.
And here is where there is a huge gap in the information available to dealers: we just do not know in any
reliable way the linkage between a nice facility and customer shopping behavior. (Again, we must
repeat that OEMs may know how to calculate this, but of the 12 we spoke to, only one provided hard
13
data on the subject.) We cannot say, with any conviction, that a showroom that has gone 10 years
since an upgrade will draw fewer customers and sales than one that was redone 5 years ago, and if we
think it does draw more customers, we cannot say how many.
In the face of this information vacuum, where dealers are asked to spend millions of dollars without
really knowing how customers will respond, the industry turns to the only metric it has left: “customer
satisfaction.” There are several sources of satisfaction data, McGraw-Hill’s J D Power division probably
being the best known. Other sources include Foresight Research, Morpace, and more. These
companies extensively survey customers , asking them everything from whether the service waiting area
was comfortable to whether the salesperson made eye contact. And unfortunately, the conclusions
they draw often diverge, in part because so much of a customer’s response depends on how the
question is asked.3
For example, a recent Foresight Research study we have seen shows “good dealership experience” as
the 14th most important factor in selecting a car brand and model (with value, styling, brand reputation,
mpg, etc. in the leading positions). Now, when it comes to selecting a particular dealership, once the
car brand and model is chosen, then “comfortable dealership environment” rises to second place,
behind “getting a good deal” and just ahead of “location.” These findings would indicate that upgraded
dealerships do very little to influence overall brand market share, but they do make a difference as to
which dealer lands the final sale. But this means that spending on dealerships is essentially cannibalistic
rather than conquesting: same-brand dealers stealing customers from each other rather than from rival-
brand stores. And from what we have seen of this study, there is again no firm link between these
ratings and actual behavior. That is, we can’t connect “What the customer said she wanted” and “What
the customer actually did.”
As a second example, a Morpace report we have looked at, covering the same ground, shows that –
once the brand and model are selected – customers are most influenced in choice of dealership by deal
offering (a score of 40), positive prior experience with the store (20), referral by friends or family (10),
inventory available (10), personal service offered (9), convenient location (5), and only then store
environment (2). These findings are quite different from Foresight’s, but even leaving that aside, again –
as far as we have seen – there is no explicit connection between expressed customer opinion and actual
behavior.
(For an example of how one industry does link store investment to actual customer behavior, see the
section in this report on fast-food drive-through times.)
We remain deeply skeptical of customer satisfaction metrics as robust indicators of facility investment
ROI. As one executive put it to me, bluntly and clearly:
3 For example, we can all recall the raging debate about “no-haggle pricing” a few years back, in which lots of
contradictory assertions flew around, in part for this very reason. Customers who were asked if they wanted to “Buy a car with no tedious arguing and haggling, in a no-pressure and transparent environment” would generally say yes to no-haggle pricing. But if asked if they wanted to “Buy a car with no ability to be sure of getting the best price, in a take-it-or-leave-it setting,” they would generally say no. The result was mass confusion.
14
“If customer satisfaction drove customer behavior, no airplane would ever take off.”
That is, airline passengers (in the USA at least) almost as a matter of faith complain endlessly and loudly
about their dissatisfaction with the service they receive – and then continue to buy about 725 million
tickets annually.4 In this case, the link between satisfaction and behavior seems non-existent. We are
not arguing that satisfaction is not crucial for success in the world of car retailing: annoy enough people
often enough and eventually you will be out of business. But we repeat that we need a better argument
for spending $1, $5, or $10 million dollars on a facility than “customer satisfaction will go up.” We need
to understand how an increase in satisfaction drives sales and margins – and why spending the extra $1
million on the store leads to a better result than spending the same amount on salesforce training, or
website improvements, or advertising, or sales incentives, etc.
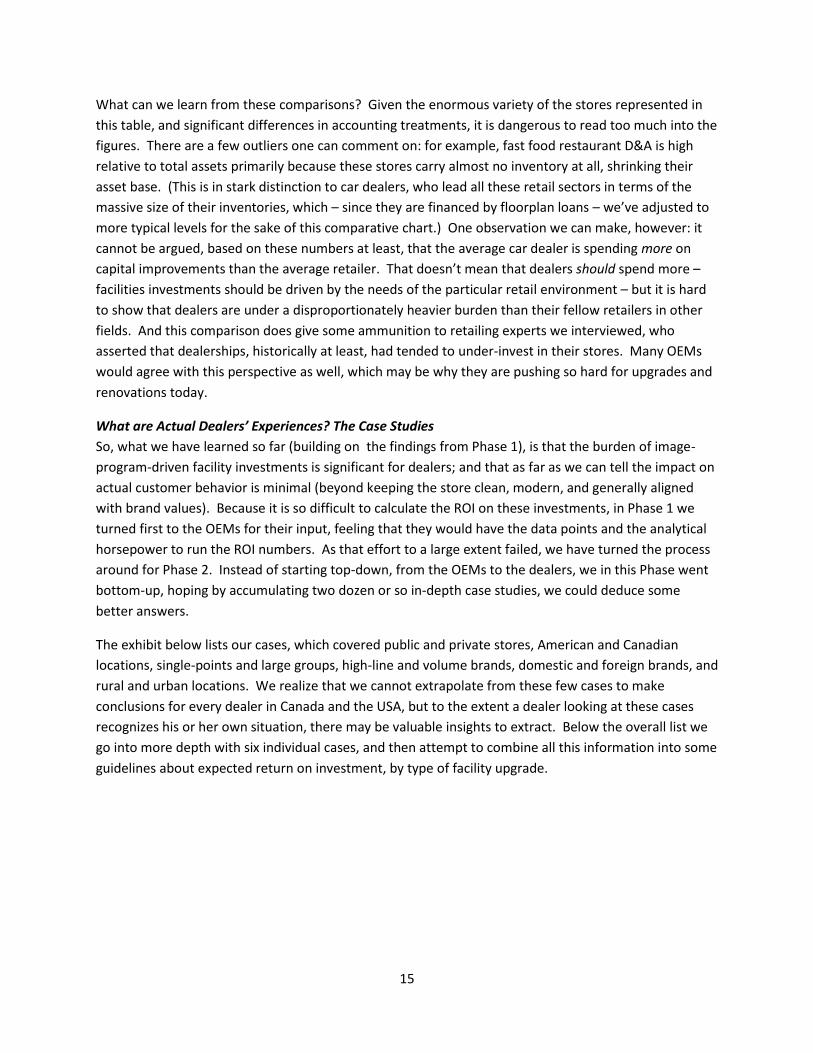
How Big is the Problem? Perspective from Other Retail Industries
Automotive retailing is not entirely like any other form of retailing, but it is similar to other retailing
sectors in some ways. Furniture stores often offer financing; computer stores sell very complex
products; supermarkets can require large facilities and extensive real estate; etc. etc. Given these
partial similarities, can we learn from these other sectors as regards their levels of capital expenditures
on facilities, furniture, fixtures, equipment, etc.? A well-known source for comparable financial data
across industry types is the Risk Management Association, whose comparative financial statement
studies compare the balance sheets and income statements of many thousands of small- and medium-
sized businesses. We’ve selected seven types of retail stores to compare to dealerships, in each case
looking at the scale of their annual depreciation and amortization (D&A) charges, in relation to their
levels of total assets, net fixed assets, and gross profits. (We’ve used the results of the average store in
each sector, averaged over the last five years.) Obviously the D&A charge doesn’t precisely equal the
amount of capital expenditures (capex) in any given year, but over time the two should approximately
track each other. And in any case, there seems to be no reliable source of comparable capex spending
amounts. Finally, the D&A line leaves out the cost of land, which is significant for dealerships (as well as
for a few other retail types), but as land is not typically depreciated, there is no option to include it.
4 Federal Aviation Administration data
15
What can we learn from these comparisons? Given the enormous variety of the stores represented in
this table, and significant differences in accounting treatments, it is dangerous to read too much into the
figures. There are a few outliers one can comment on: for example, fast food restaurant D&A is high
relative to total assets primarily because these stores carry almost no inventory at all, shrinking their
asset base. (This is in stark distinction to car dealers, who lead all these retail sectors in terms of the
massive size of their inventories, which – since they are financed by floorplan loans – we’ve adjusted to
more typical levels for the sake of this comparative chart.) One observation we can make, however: it
cannot be argued, based on these numbers at least, that the average car dealer is spending more on
capital improvements than the average retailer. That doesn’t mean that dealers should spend more –
facilities investments should be driven by the needs of the particular retail environment – but it is hard
to show that dealers are under a disproportionately heavier burden than their fellow retailers in other
fields. And this comparison does give some ammunition to retailing experts we interviewed, who
asserted that dealerships, historically at least, had tended to under-invest in their stores. Many OEMs
would agree with this perspective as well, which may be why they are pushing so hard for upgrades and
renovations today.
What are Actual Dealers’ Experiences? The Case Studies
So, what we have learned so far (building on the findings from Phase 1), is that the burden of image-
program-driven facility investments is significant for dealers; and that as far as we can tell the impact on
actual customer behavior is minimal (beyond keeping the store clean, modern, and generally aligned
with brand values). Because it is so difficult to calculate the ROI on these investments, in Phase 1 we
turned first to the OEMs for their input, feeling that they would have the data points and the analytical
horsepower to run the ROI numbers. As that effort to a large extent failed, we have turned the process
around for Phase 2. Instead of starting top-down, from the OEMs to the dealers, we in this Phase went
bottom-up, hoping by accumulating two dozen or so in-depth case studies, we could deduce some
better answers.
The exhibit below lists our cases, which covered public and private stores, American and Canadian
locations, single-points and large groups, high-line and volume brands, domestic and foreign brands, and
rural and urban locations. We realize that we cannot extrapolate from these few cases to make
conclusions for every dealer in Canada and the USA, but to the extent a dealer looking at these cases
recognizes his or her own situation, there may be valuable insights to extract. Below the overall list we
go into more depth with six individual cases, and then attempt to combine all this information into some
guidelines about expected return on investment, by type of facility upgrade.
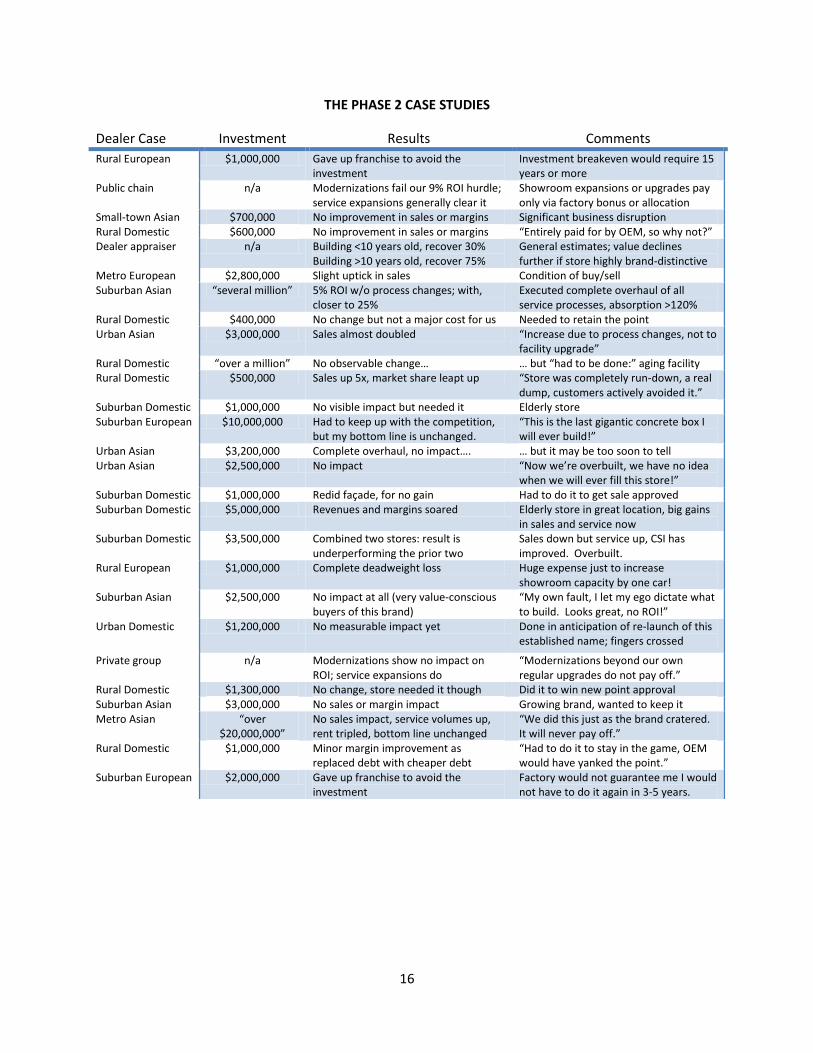
16
THE PHASE 2 CASE STUDIES
Dealer Case Investment Results Comments
Rural European $1,000,000 Gave up franchise to avoid the investment
Investment breakeven would require 15 years or more
Public chain n/a Modernizations fail our 9% ROI hurdle; service expansions generally clear it
Showroom expansions or upgrades pay only via factory bonus or allocation
Small-town Asian $700,000 No improvement in sales or margins Significant business disruption Rural Domestic $600,000 No improvement in sales or margins “Entirely paid for by OEM, so why not?” Dealer appraiser n/a Building <10 years old, recover 30%
Building >10 years old, recover 75% General estimates; value declines further if store highly brand-distinctive
Metro European $2,800,000 Slight uptick in sales Condition of buy/sell Suburban Asian “several million” 5% ROI w/o process changes; with,
closer to 25% Executed complete overhaul of all service processes, absorption >120%
Rural Domestic $400,000 No change but not a major cost for us Needed to retain the point Urban Asian $3,000,000 Sales almost doubled “Increase due to process changes, not to
facility upgrade” Rural Domestic “over a million” No observable change… … but “had to be done:” aging facility Rural Domestic $500,000 Sales up 5x, market share leapt up “Store was completely run-down, a real
dump, customers actively avoided it.” Suburban Domestic $1,000,000 No visible impact but needed it Elderly store Suburban European $10,000,000 Had to keep up with the competition,
but my bottom line is unchanged. “This is the last gigantic concrete box I will ever build!”
Urban Asian $3,200,000 Complete overhaul, no impact…. … but it may be too soon to tell Urban Asian $2,500,000 No impact “Now we’re overbuilt, we have no idea
when we will ever fill this store!” Suburban Domestic $1,000,000 Redid façade, for no gain Had to do it to get sale approved Suburban Domestic $5,000,000 Revenues and margins soared Elderly store in great location, big gains
in sales and service now Suburban Domestic $3,500,000 Combined two stores: result is
underperforming the prior two Sales down but service up, CSI has improved. Overbuilt.
Rural European $1,000,000 Complete deadweight loss Huge expense just to increase showroom capacity by one car!
Suburban Asian $2,500,000 No impact at all (very value-conscious buyers of this brand)
“My own fault, I let my ego dictate what to build. Looks great, no ROI!”
Urban Domestic $1,200,000 No measurable impact yet Done in anticipation of re-launch of this established name; fingers crossed
Private group n/a Modernizations show no impact on ROI; service expansions do
“Modernizations beyond our own regular upgrades do not pay off.”
Rural Domestic $1,300,000 No change, store needed it though Did it to win new point approval Suburban Asian $3,000,000 No sales or margin impact Growing brand, wanted to keep it Metro Asian “over
$20,000,000” No sales impact, service volumes up, rent tripled, bottom line unchanged
“We did this just as the brand cratered. It will never pay off.”
Rural Domestic $1,000,000 Minor margin improvement as replaced debt with cheaper debt
“Had to do it to stay in the game, OEM would have yanked the point.”
Suburban European $2,000,000 Gave up franchise to avoid the investment
Factory would not guarantee me I would not have to do it again in 3-5 years.
17
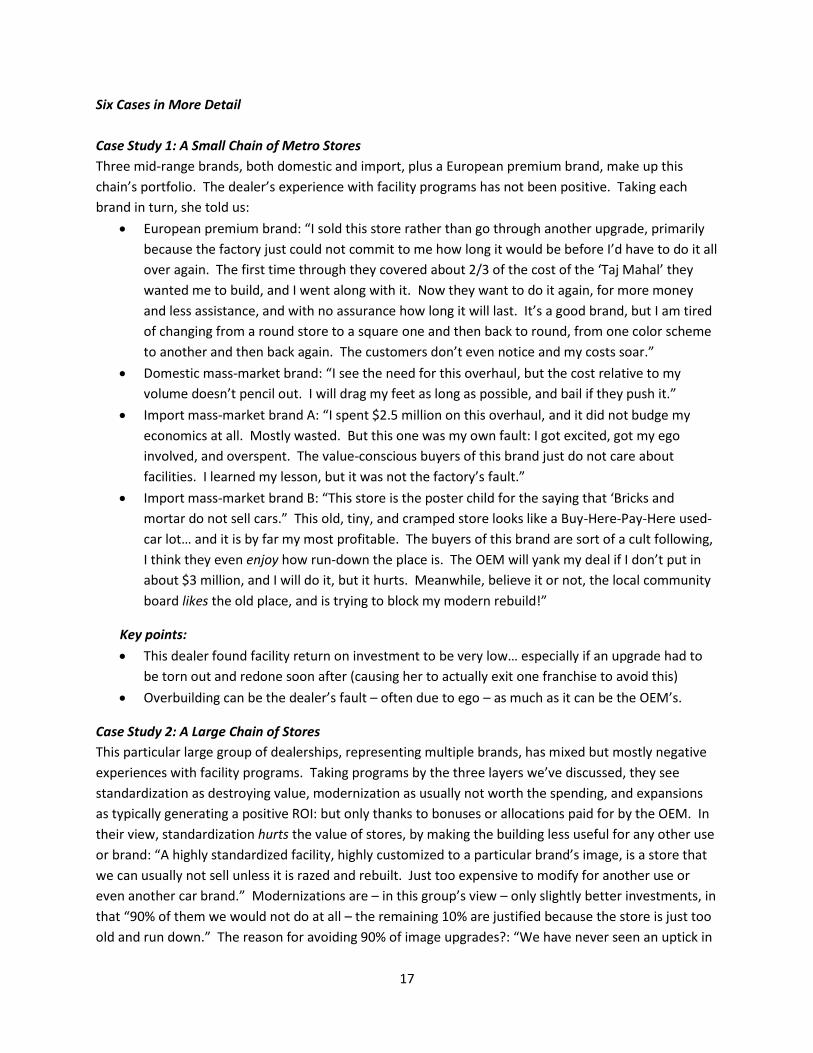
Six Cases in More Detail
Case Study 1: A Small Chain of Metro Stores
Three mid-range brands, both domestic and import, plus a European premium brand, make up this
chain’s portfolio. The dealer’s experience with facility programs has not been positive. Taking each
brand in turn, she told us:
European premium brand: “I sold this store rather than go through another upgrade, primarily
because the factory just could not commit to me how long it would be before I’d have to do it all
over again. The first time through they covered about 2/3 of the cost of the ‘Taj Mahal’ they
wanted me to build, and I went along with it. Now they want to do it again, for more money
and less assistance, and with no assurance how long it will last. It’s a good brand, but I am tired
of changing from a round store to a square one and then back to round, from one color scheme
to another and then back again. The customers don’t even notice and my costs soar.”
Domestic mass-market brand: “I see the need for this overhaul, but the cost relative to my
volume doesn’t pencil out. I will drag my feet as long as possible, and bail if they push it.”
Import mass-market brand A: “I spent $2.5 million on this overhaul, and it did not budge my
economics at all. Mostly wasted. But this one was my own fault: I got excited, got my ego
involved, and overspent. The value-conscious buyers of this brand just do not care about
facilities. I learned my lesson, but it was not the factory’s fault.”
Import mass-market brand B: “This store is the poster child for the saying that ‘Bricks and
mortar do not sell cars.” This old, tiny, and cramped store looks like a Buy-Here-Pay-Here used-
car lot… and it is by far my most profitable. The buyers of this brand are sort of a cult following,
I think they even enjoy how run-down the place is. The OEM will yank my deal if I don’t put in
about $3 million, and I will do it, but it hurts. Meanwhile, believe it or not, the local community
board likes the old place, and is trying to block my modern rebuild!”
Key points:
This dealer found facility return on investment to be very low… especially if an upgrade had to
be torn out and redone soon after (causing her to actually exit one franchise to avoid this)
Overbuilding can be the dealer’s fault – often due to ego – as much as it can be the OEM’s.
Case Study 2: A Large Chain of Stores
This particular large group of dealerships, representing multiple brands, has mixed but mostly negative
experiences with facility programs. Taking programs by the three layers we’ve discussed, they see
standardization as destroying value, modernization as usually not worth the spending, and expansions
as typically generating a positive ROI: but only thanks to bonuses or allocations paid for by the OEM. In
their view, standardization hurts the value of stores, by making the building less useful for any other use
or brand: “A highly standardized facility, highly customized to a particular brand’s image, is a store that
we can usually not sell unless it is razed and rebuilt. Just too expensive to modify for another use or
even another car brand.” Modernizations are – in this group’s view – only slightly better investments, in
that “90% of them we would not do at all – the remaining 10% are justified because the store is just too
old and run down.” The reason for avoiding 90% of image upgrades?: “We have never seen an uptick in
18
price, margin, volume, or CSI resulting from such an investment.” Again, the only payback seen here is
from the factory’s allocation or cash bonus. Expansions are the most likely to pay off, though only in the
service area (e.g. by adding bays). In fact, this group was negative about most investments in the
showroom area. “I can’t recall ever getting a negative comment from a customer about a showroom –
but they certainly speak up about the service waiting area. I think investments in showrooms,
especially as we move more and more of the sales process online, are not driven so much by economics
but by ego, either that of the dealer or of the factory: we need to spend more on the service area, and
less in the sales area.”
Key points:
Negative ROI in standardization, modernizations a wash, expansions can pay out…
…but positive results are due more to OEM payments rather than to underlying economics.
Investment in service is more attractive than investment in sales
Case Study 3: Multi-Point Rural Dealer
This dealer has broadly positive experiences with two renovations, one mostly covered by OEM bonus
payments, and one done without OEM help. In the first case, a domestic-brand store, the factory’s
bonus payments look set to cover 100% of his construction costs, so the dealer is quite pleased. As to
the debate as to whether such payments are true incremental payments, or just front-end margin
shuffled to the back end, his comment is “Look, the money is real, or at least as real as it gets. And back-
end payments are more reliable than whatever I can keep of front-end margin.” When pressed as to the
true underlying economics of the program, this dealer figured it cost twice as much as what he would
have spent on his own, but that he still would have done it (though maybe delayed it a year or two), as
he has seen his local market share climb, and his fixed operations coverage rise as well. The implication
thus is a positive underlying ROI, but probably at half the level that he might have achieved on his own.
His second store – also a domestic brand -- was renovated without factory help, and results here were
even more positive, as the previous owner had not invested in the facilities for a couple of decades, and
the building was in terrible shape. The situation was so dire that, when the overhaul was completed, a
common comment from customers was “I didn’t even realize this was a dealership before!” Sales have
since soared, as the store moved from last place among local same-brand stores, to first place. The ROI
was thus spectacularly positive. Even so, the dealer estimated that the project cost was twice what it
should have been, in order to meet factory standards. As he put it, “In a rural area, the pace of life is a
bit slower, and so I see much less return on things like quick-service lanes, waiting-area Wi-Fi, etc. But
perhaps that will change.”
Key points:
There are potentially huge returns to overhauling a completed run-down or dilapidated store.
Whether a program is needed or not, excessive OEM standards typically greatly increase costs.
Case Study 4: Single-Point Large Suburban Dealer
This large suburban import dealer does not argue with the basic thrust of image programs, in that
dealerships must be kept up to modern standards, but sees their typical focus on how the store looks
19
and feels as misguided. In his view, the basic processes underlying a dealership’s operations are rapidly
shifting, yet the building designs are not keeping up. “The ROI on image programs on their own, I have
calculated, is perhaps 5%... you might as well put your money in a savings bond. It is only when you use
the opportunity of a program or a relocation to make major improvements in your store’s processes
that you can see a real payoff. Given the changes I have made, and the added revenue and margin they
have earned me, I would say a 25% return is very achievable.” What are some of the changes this dealer
made? Years ago he moved the body shop off-site to free up space for more valuable uses (and
subcontracted its operations to a specialist firm). Then he added quite a few service bays…. but at an
off-site quick-service facility. His own research showed that his customers were most dissatisfied with
waiting for service, so he laid out his quick-service processes and systems for ultra-high throughput.
Fixed coverage is now well over 100%. The next step, he hopes, is to split all the remaining service area
away from the sales area. “With more and more of our sales process online, we can use a much smaller
showroom and move it to an expensive higher-traffic location. Maybe the original store just becomes a
fulfillment center.”
Key points:
There is no significant payoff to just modernizing and standardizing the store…
…but if a dealer takes the opportunity of the upgrade process to revise sales and services
processes (and to redesign the physical facility to match), profits can really soar.
Case Study 5: Single-point Rural Dealer
This rural domestic-brand dealer emphasized a different aspect of compliance with OEM image
programs. The actual impact of his renovations was pretty minimal but positive: “My customers already
know me well, and were pleased but did not necessarily change their shopping patterns; let’s face it, my
‘frontage’ is on the internet now… no one really needs to see my store to know what I have in stock or
how I price it. Half my sales are from outside my area anyway: people only see the store when they
come in to sign the deal. Employee morale is up, which is nice: they have stepped up and given more,
with an improvement in their surroundings.” More crucial in this dealer’s view, than the modestly
positive economics of the investment, was how he managed to fund them. The OEM kicked in perhaps
15% of the cost, but a very-low-rate 20-year SBA loan covered half of the rest, and a local bank’s
‘economic development’ loan provided most of the remainder. As an added benefit, the raised cap on
section 179 depreciation, and the special depreciation allowance acceleration on the rest of the spend
slashed his tax liabilities. While these special provisions may not always be available, when they are,
they can be major. The low current cost of debt is especially helpful to smaller dealers, who may just
not have the liquidity necessary to make upgrade investments – even if their overall balance sheet is
strong enough to support them.
Key points:
Minimal measurable impact from the upgrade program, though both employees and customers
were pleased… and the store was old enough that it needed to be done.
20
But investment economics can turn from negative to neutral or positive if a dealer and his or her
CFO can be very savvy about subsidized loans and local state and Federal tax incentives. “Don’t
just listen to your CPA: we found breaks even he didn’t know about!”
Case Study 6: A Medium-Sized Private Chain of Stores
This dealer has a dozen or so stores, covering numerous brands, in a mid-sized city that is surrounded by
a very rural market (dominated by farming). Taking into account all the various brands he deals with, his
experience with image or upgrade programs is that they are a “franchise tax:” that is, the only ROI on
these investments (above and beyond his own steady maintenance and modernization efforts) is that he
gets to stay in business. This is a positive number, but one he has never calculated. “There is no positive
payoff, but there is a negative one if I do not act: the factory comes after me.” Admittedly, his market is
characterized by consumers with strong roots in the agricultural and natural resources industries, so
that they may be less impressed by fancy showrooms than consumers in a different setting, such as the
New York metro area. He also made the point to us that overhauls and improvements come with many
hidden costs, or costs that many dealers and factories don’t take into account sufficiently before
investing. Above and beyond higher rent factors (or debt service), there is usual more tax to pay, usually
more insurance coverage to order, often more maintenance if the façade is redone with some exotic
material or with louvers, disruption of business during construction… and sometimes even more staff
required.5 “Dealers should take all this into account when deciding what to do: it is much more than
looking at construction costs and the offsetting OEM payments.”
Key points:
If a dealer steadily maintains and renovates his or her own stores – on which only a minimal or
zero short-run ROI should be expected -- factory image programs above and beyond this level
do not seem to pay out. They are “Just a franchise fee, except I pay it to contractors rather than
to the OEM.”
Any analysis of facility upgrade ROI must include hidden or secondary costs that many dealers
and OEMs overlook when running their numbers.
Another Case Study: One OEM’s Perspective
As we have mentioned, of the twelve OEMs we spoke with in Phase 1 of this project, only one provided
detailed, quantified data regarding the financial impact of its image programs on its dealers. We
excluded this data from the Phase 1 report for two reasons: first, we would – of course -- honor our
confidentiality pledge; and second, we were sure that showing data for one brand’s experience could
not be extrapolated to all dealers.
However, here in Phase 2 we are including a summary of some of the findings from the data here. This
is in part because this OEM has graciously allowed its data to be (anonymously) shared, and in part
because we have come to realize that all data are useful, even if they are not valid for every dealer in
every case (the “no one size fits all” conclusion).
5 For example, splitting a showroom between two brands of the same OEM may require adding a second
receptionist.
21
Our sincere thanks to the executives at this particular OEM, for their open and helpful attitude. We are
especially impressed by their findings because they seem realistic and objective, showing the negative as
well as the positive impacts of this particular program. Of course, this OEM believes strongly in the
overall long-term positive value of its program, but it was candid in its disclosure that not every line on
every participating dealer’s P&L would immediately move upward.
Obviously, no dealer reading this report should assume that the following results will apply to her or his
store: not only is every OEM different, but so is every dealer. However, the general findings we believe
should be of interest to everyone: we can all learn from this brand’s real-world experience.
The following highlights are just those: selected highlights from the data provided, not a complete
report. In all cases they are drawn from careful comparisons of comparable groups of dealers who have,
and have not, executed this OEM’s image programs, over a period of several years. We are fairly
confident that the comparisons are fair: that is, we do not believe the factory “cherry-picked” its best-
performing upgraded dealers to compare to its worst-performing non-upgraded dealers.
Highlight 1: CUSTOMER SATISFACTION. Pretty much across the board upgraded dealers saw their
various customer satisfaction metrics rise significantly after program completion, in regards not only to
their own prior scores, but in regards to same-brand stores that had not upgraded, and in regards to the
scores of key rival-brand stores. This finding should not be surprising, of course: it is hard to imagine a
customer not being pleased with a renovated and redone facility.
Highlight 2: GROWTH. This OEM’s program was very much designed not just to modernize stores, but
also to expand them, particularly in terms of service capacity, as the brand’s units in operation had been
strongly growing. And here the program very much hit its mark. Upgraded stores saw significant gains
(e.g. tens of units per month) in sales of new units and used units. One might comment that a lot of this
growth might be just due to increased allocations of vehicles to compliant dealers, and that may be true,
but we’ll note that used unit volumes grew even faster, proportionately, than did new units. And also,
any special allocation allotments were only temporary. On the service side, growth in repair orders
(both parts and labor) was very much stronger among the upgraded stores, which is to be expected
given that there was a dramatic expansion in bay count. Perhaps more critically, service retention rates
also rose for upgraded stores, which provides one of the missing links in our industry, between customer
stated opinion (satisfaction) and actual behavior (service loyalty). They, as it were, “walked the talk.”
Highlight 3: PROFITABILITY. So now we come to the heart of the matter. Satisfaction goes up, new and
used vehicle sales and service volumes go up: but do profits? Without increased profits there is no real
return on investment, of course: and according to this OEM multiple billions of dollars, from all parties
combined, have been spent on these upgrades. So the investment burden is significant. The answer, for
this OEM’s image program at least, is generally positive:
Absolute dollars of profit earned by participating dealers, both at the EBITDA6 and at the net
income line, surpassed the levels of profits earned by non-participating dealers, after some time
6 Earnings before interest, taxes, depreciation, and amortization
22
lag. The delay is because the costs of a program impact the income statement at once, whereas
the dealership has to grow into many of the benefits, for example by generating incremental
service volume to fill expanded service capacity. (And indeed, while the data are not perfectly
clear, one could typically see a “hit” to profits in the first year of program expenditures). The
EBITDA line tended to recover faster than the net income line, which makes sense since EBITDA
excludes the debt and depreciation burden of facilities investments. But overall, the average
image-compliant dealer saw EBITDA recover to -- and then surpass -- previous levels in about 2
years or so, and net income recover to -- and then surpass -- previous levels in about 4 years or
so (with, of course, a wide dispersion of results). Also, it should be noted that while the image-
compliant dealer profits have now surpassed their previous levels, the non-compliant dealers
have yet to surpass their previous high point for earnings, set in 2006.
Relative percentages of profit (margin percentages, ROI percentages) also recovered for
participating dealers, compared to non-participating dealers, though somewhat slowly (again,
more or less in about 4 years) and –as far as the most recent data show – to levels equal to non-
participating dealers, not necessarily to higher levels. The implication may be that participating
dealers are strongly benefiting from expansion investments (generating higher units and dollar
volumes) but not as strongly benefiting from modernization investments (generating higher
percentage margins or return). However, as the trendlines for the participating dealers are still
moving upward in the 2012 data, even relative profits may exceed those of non-participating
stores, in the near future.
Summing it all up, this one brand’s experience, in our view, boils down to this: “If you execute this
program, your customers will likely be happier and your business bigger (both in top line revenue and
bottom line profit), but it will take some time: do not expect an overnight transformation. Also, while
your total profits (dollars) will likely be higher than before, your relative profitability (percentages) may
not be… at least for some time.” The overall message is thus very positive – for this brand – at least for
dealers with the patience to persist while results improve.
Finding an Answer: the Financial Theory Perspective
The summary chart of dealer experiences with facility investments, and the selected detailed case
studies, go a long way toward telling us what the apparent ROI of these investments is, and the simple
answer so far is “not much.” In the case of most of the examples we studied, dealers were unable to
calculate any particular sales or service revenue or margin gains, with two major exceptions. The first
exception was for completely run-down or dilapidated stores. Typically, these were situations where
Dealer A purchased a store from Dealer B, who for many years had failed to invest sufficiently in the
facility to keep it clean, modern, and comfortable. In these situations new investment by Dealer A could
radically turn around results, leading to ROIs of 30% or even higher. The other exception was for service
expansion, although it was by no means always the case that adding bays or stalls would pay off. But
given the relatively low cost of adding a bay, and the very high margins on parts and labor, more often
than not service expansion could generate good returns. (Although these returns were by no means
guaranteed: dealers know “build it [ a service bay ] and they will come” does not hold true – effort has
23
to be expended to drive the incremental service traffic, unless the service area is so backed up that
appointment backlogs are enormous.)
Leaving aside these exceptions, we mostly see inadequate returns on investment in image programs7.
This brings us to a real puzzle: if dealers do not see adequate returns on factory image programs, why do
they participate? If the programs are truly voluntary, as the OEMs say they are, then a dealer can
choose not to join in; if the programs are effectively compulsory, then a dealer can sell the store and exit
the business – allowing her or him to invest the proceeds in some more attractive venture.
But dealers generally, on average, do go along with the programs, admittedly while trying to reduce
their burden, by delaying expenditures, negotiating with OEMs for reduced spending, and even in some
cases investigating legislative and judicial relief. Why would a dealer invest $500,000 or $5,000,000 for
zero return? The usual answers to this question run along these lines:
“I have to, if I want to remain a dealer.”
“It’s just a cost of doing business.”
“I have to if I want to stay in the game, get cars, get bonuses.”
“If I don’t do it the factory will come after me; I have to stay on their good side.”
“It’s a franchise tax: I have to pay or get out.”
etc.
What these all boil down to is an admission that there IS a return on investment to these programs, but
it does not come in the form of growing future revenue or profits, but only in being allowed to continue
generating today’s sales and profits. How does one calculate that return? We talked to several
accountants and finance professors about this, and the answer is pretty murky. A fictional example
might help, though we’ll make it an unrealistic case just to make the point clearly:
Supposing a dealership is worth $5,000,000, cash. Suppose the OEM comes up with an image
program that requires only a $10 investment, in a new potted plant for the showroom. If the
dealer does not comply, she will lose the franchise. The decision is obvious: to protect the
$5,000,000 investment, she will spend the $10. The return on the $10 spending is almost
infinite – a true “no brainer.” Now suppose that the program requires a $10,000,000
investment instead: a complete rebuilding of the store in the finest marble and granite. Again
we have a “no brainer:” spending $10,000,000 to protect $5,000,000 is foolish, and the ROI
massively negative.
The problem is, virtually every image program’s requirements fall between these two extremes. So
what is the ROI of an investment that may have no return in itself (e.g. by boosting sales) but is does
permit the dealer to keep earning a return on the dealership overall, by allowing him or her to stay in
the game.
7 Again, if such returns exist, we respectfully ask OEMs to show us the numerical evidence. Of the 12 we spoke
with in Phase 1, only one factory provided hard, documented evidence of actual returns to dealers of their factory image programs.
24
We talked to accountants and finance professors and professionals for their views on this puzzle, and
they confirmed that an accurate answer was virtually impossible. There is a “sweet spot” between the
$10 plant and the $10,000,000 “Taj Mahal,” but there is no easy way to find it, especially a spot that will
work for every dealer in every case.
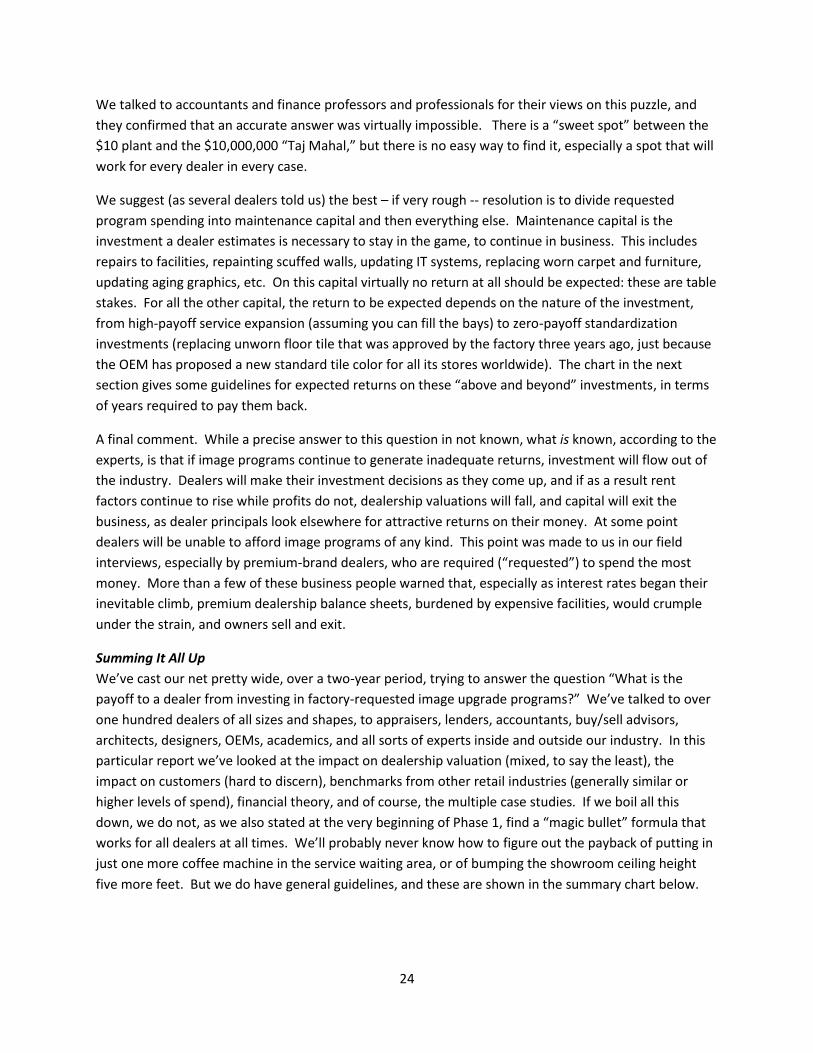
We suggest (as several dealers told us) the best – if very rough -- resolution is to divide requested
program spending into maintenance capital and then everything else. Maintenance capital is the
investment a dealer estimates is necessary to stay in the game, to continue in business. This includes
repairs to facilities, repainting scuffed walls, updating IT systems, replacing worn carpet and furniture,
updating aging graphics, etc. On this capital virtually no return at all should be expected: these are table
stakes. For all the other capital, the return to be expected depends on the nature of the investment,
from high-payoff service expansion (assuming you can fill the bays) to zero-payoff standardization
investments (replacing unworn floor tile that was approved by the factory three years ago, just because
the OEM has proposed a new standard tile color for all its stores worldwide). The chart in the next
section gives some guidelines for expected returns on these “above and beyond” investments, in terms
of years required to pay them back.
A final comment. While a precise answer to this question in not known, what is known, according to the
experts, is that if image programs continue to generate inadequate returns, investment will flow out of
the industry. Dealers will make their investment decisions as they come up, and if as a result rent
factors continue to rise while profits do not, dealership valuations will fall, and capital will exit the
business, as dealer principals look elsewhere for attractive returns on their money. At some point
dealers will be unable to afford image programs of any kind. This point was made to us in our field
interviews, especially by premium-brand dealers, who are required (“requested”) to spend the most
money. More than a few of these business people warned that, especially as interest rates began their
inevitable climb, premium dealership balance sheets, burdened by expensive facilities, would crumple
under the strain, and owners sell and exit.
Summing It All Up
We’ve cast our net pretty wide, over a two-year period, trying to answer the question “What is the
payoff to a dealer from investing in factory-requested image upgrade programs?” We’ve talked to over
one hundred dealers of all sizes and shapes, to appraisers, lenders, accountants, buy/sell advisors,
architects, designers, OEMs, academics, and all sorts of experts inside and outside our industry. In this
particular report we’ve looked at the impact on dealership valuation (mixed, to say the least), the
impact on customers (hard to discern), benchmarks from other retail industries (generally similar or
higher levels of spend), financial theory, and of course, the multiple case studies. If we boil all this
down, we do not, as we also stated at the very beginning of Phase 1, find a “magic bullet” formula that
works for all dealers at all times. We’ll probably never know how to figure out the payback of putting in
just one more coffee machine in the service waiting area, or of bumping the showroom ceiling height
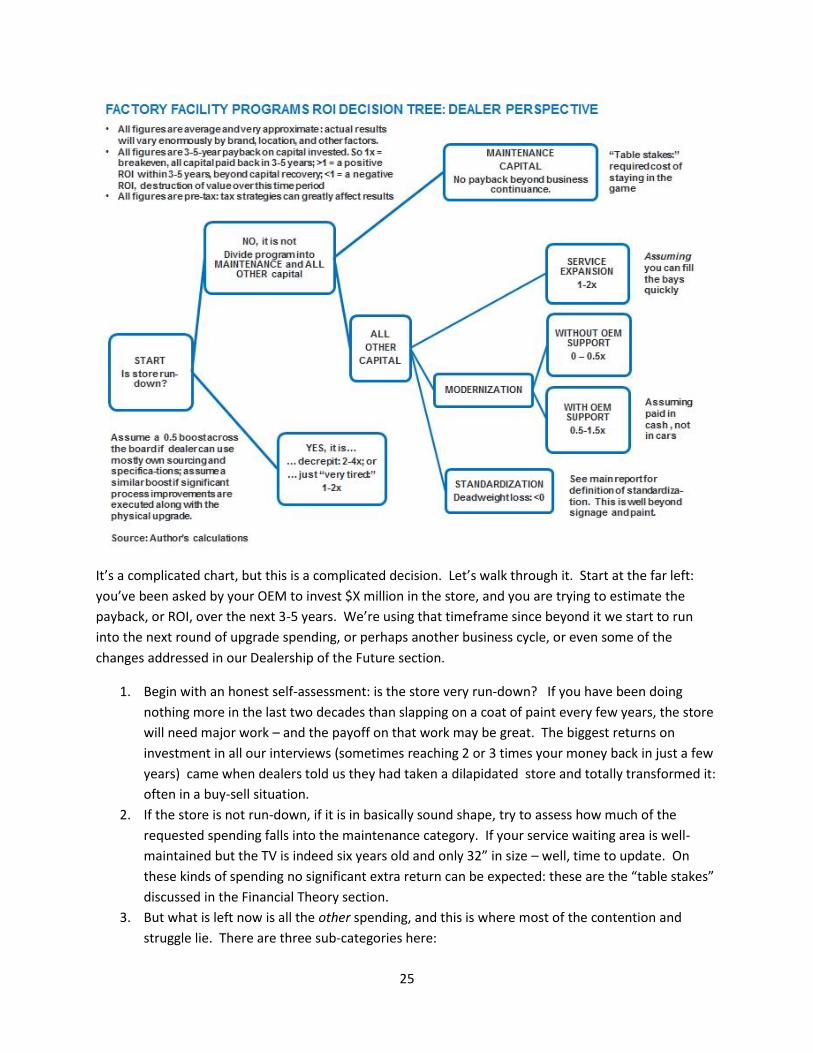
five more feet. But we do have general guidelines, and these are shown in the summary chart below.
25
It’s a complicated chart, but this is a complicated decision. Let’s walk through it. Start at the far left:
you’ve been asked by your OEM to invest $X million in the store, and you are trying to estimate the
payback, or ROI, over the next 3-5 years. We’re using that timeframe since beyond it we start to run
into the next round of upgrade spending, or perhaps another business cycle, or even some of the
changes addressed in our Dealership of the Future section.
1. Begin with an honest self-assessment: is the store very run-down? If you have been doing
nothing more in the last two decades than slapping on a coat of paint every few years, the store
will need major work – and the payoff on that work may be great. The biggest returns on
investment in all our interviews (sometimes reaching 2 or 3 times your money back in just a few
years) came when dealers told us they had taken a dilapidated store and totally transformed it:
often in a buy-sell situation.
2. If the store is not run-down, if it is in basically sound shape, try to assess how much of the
requested spending falls into the maintenance category. If your service waiting area is well-
maintained but the TV is indeed six years old and only 32” in size – well, time to update. On
these kinds of spending no significant extra return can be expected: these are the “table stakes”
discussed in the Financial Theory section.
3. But what is left now is all the other spending, and this is where most of the contention and
struggle lie. There are three sub-categories here:
26
a. Is this spending for service expansion? If so, expect to get back all your money or more,
in a few years – assuming the local market will absorb the capacity (which, more often
than not, it will), and assuming you have already persuaded the OEM to let you use
cheaper expansion techniques, such as extending operating hours.
b. Is this spending for modernization? Again, we now mean above and beyond
maintenance: this category might include – to stay with our TV example – replacing the
perfectly fine LCD TV with an equally fine but more modern LED TV: it is an upgrade, but
will customers notice it? In this category we saw the most diverse results, mostly
depending on how much assistance the OEM would offer. In some cases the cash
payments equaled the investment, which means a full payback. Generally, however,
assistance levels were lower, the payback less than full, and so the ROI negative over
the 3-5 year time period. Dealers should therefore, in these cases, ask to see clearly
quantified economics from their OEMS that explain just how a particular change will
help business. And the explanation should be as quantified as possible (see our fast-
food waiting time example), not just assertions such as “customers will love it!”
c. Is this spending standardization? To use the TV analogy one last time, are you being
asked to switch from model year 2012 LED TV Brand Acme to model year 2012 LED TV
Brand Apex, just because it is the standard for the car brand? In this case, as we
discussed in Phase 1 and again in Phase 2, we have not been able to find any solid
argument as to how this spending pays off, ever, for the dealer (above and beyond
branding basics such as logos, signage, outside color of the store, etc.). This is where
dealers should push back hardest, as if there is any benefit to this spending, it is all to
the OEM rather than to the dealer, and probably even destroys dealership value.8 The
short-term ROI is negative and the erosion in dealership value can be significant.
We note that payback can be improved in all cases, if on the one hand OEM standards can be relaxed
enough to enable cost savings (as many OEMs do in fact do) or if on the other, dealership processes can
be changed at the same time as the upgrade investment, to improve operational results (e.g. using the
expansion of a service facility as a chance to add an express lane, if the local market demands it).
Boiling it all down to one sentence: “Renovating a dilapidated store pays off, and while one should not
expect much of a return from maintenance spending, service expansion can pay off well, whereas
modernization investments tend to depend on how much assistance the OEM offers, and
8 And as we have argued before, it is not even clear what benefit there is to the OEM, to standardize stores in
Moscow to look the same as they do in Mumbai or Minneapolis. We repeatedly asked OEM executives the question: “When you propose investing $1 billion in global dealership format standardization, how do you calculate the return on this spending?” – and we rarely received a good answer. Answers ranged from “It cannot be calculated” to “We never tried to calculate it” to “We just know it is right.” Given that OEMs can keep track of spending on things like warranty reimbursement or lease subvention down to the last Euro cent, yen, or penny, we remain deeply unconvinced that there is a sound economic argument for making all dealerships look alike, but that this is rather a matter of corporate ego or a tool for eliminating dealer personal identities from the equation.
27
standardization spending is almost always a pure deadweight loss.”9 And as we have said before, if our
conclusions about these returns are incorrect, we would welcome OEMs to show dealers clear, detailed,
quantifications that show otherwise. To date, only one OEM has provided us such evidence, as we
discussed above, and their figures indeed show returns at the higher end of our estimates – in part, we
believe, because they have not insisted on high-cost low-value investments in excessive standardization.
Are the Answers Different in Canada?
Readers will notice that in this report we have not identified Canadian as opposed to American
dealership case studies (in fact, two of the six cases discussed in detail are Canadian). This is because, in
our joint work with NADA and CADA, it became clear that all the issues that dealers and factories face as
regards facility upgrades are similar on both sides of the border. However, based on discussions with
CADA personnel, we thought it was important to point out three general and one particular difference
between the two countries, as regards how the dealership systems are set up and run. The three
general differences are legal, contractual, and procedural.
1. In terms of legal differences, most Canadian provinces (as opposed to American states, with
their automotive-specific franchise laws) do not have a large body of local franchise regulation,
though the local (provincial franchise laws) do exist in five provinces. These franchise laws while
focusing primarily on the disclosure obligations between a franchisor and franchisee also
contain other obligations such as a duty of good faith and fair dealing which can be of assistance
to dealers. There are provincial-level Motor Vehicle Dealers Acts, which address matters of
licensing and consumer protection, for example. As well, most provinces also have independent
consumer protection and sales of goods legislation. Perhaps most striking to readers in the USA
is the fact that in Canada direct ownership of a dealership by an OEM is significantly easier and
more common on the north side of the border than on the south. Whereas in the USA factory
ownership tends to be very rare and in many cases temporary, in Canada, while by no means
widespread, it is not uncommon and tends to be more permanent. Another interesting
difference between Canada and the United States is that dualling is practically non-existent in
Canada compared to its prevalence in the United States.
2. As for contractual differences, these are fairly modest, in that American and Canadian
dealer/factory agreements tend to be similar – but generally, there are fewer constraints on the
OEMs in Canada.
3. Speaking of procedures, most OEMs and dealers in Canada (though not all) are signatories to the
National Automobile Dealer Arbitration Program (NADAP), a private mediation and arbitration
program, which is where most disputes between dealers and OEMs are settled. It is safe to say
that, because NADAP exists, in Canada there is less resort to traditional public court litigation –
by both dealers and factories – than in the USA, whether over facility or other matters.
9 As one respected industry advisor put it succinctly in a discussion with us: “"Expansion can add value,
modernization can maintain it, standardization impairs it."
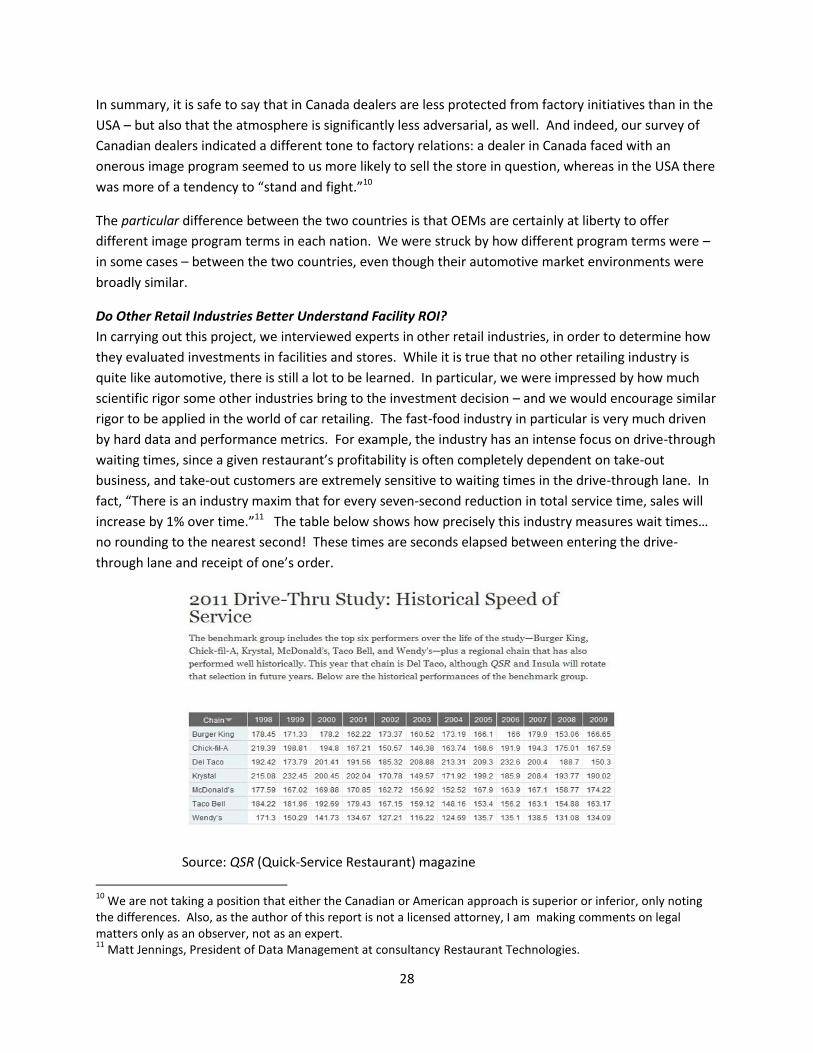
28
In summary, it is safe to say that in Canada dealers are less protected from factory initiatives than in the
USA – but also that the atmosphere is significantly less adversarial, as well. And indeed, our survey of
Canadian dealers indicated a different tone to factory relations: a dealer in Canada faced with an
onerous image program seemed to us more likely to sell the store in question, whereas in the USA there
was more of a tendency to “stand and fight.”10
The particular difference between the two countries is that OEMs are certainly at liberty to offer
different image program terms in each nation. We were struck by how different program terms were –
in some cases – between the two countries, even though their automotive market environments were
broadly similar.
Do Other Retail Industries Better Understand Facility ROI?
In carrying out this project, we interviewed experts in other retail industries, in order to determine how
they evaluated investments in facilities and stores. While it is true that no other retailing industry is
quite like automotive, there is still a lot to be learned. In particular, we were impressed by how much
scientific rigor some other industries bring to the investment decision – and we would encourage similar
rigor to be applied in the world of car retailing. The fast-food industry in particular is very much driven
by hard data and performance metrics. For example, the industry has an intense focus on drive-through
waiting times, since a given restaurant’s profitability is often completely dependent on take-out
business, and take-out customers are extremely sensitive to waiting times in the drive-through lane. In
fact, “There is an industry maxim that for every seven-second reduction in total service time, sales will
increase by 1% over time.”11 The table below shows how precisely this industry measures wait times…
no rounding to the nearest second! These times are seconds elapsed between entering the drive-
through lane and receipt of one’s order.
Source: QSR (Quick-Service Restaurant) magazine
10
We are not taking a position that either the Canadian or American approach is superior or inferior, only noting the differences. Also, as the author of this report is not a licensed attorney, I am making comments on legal matters only as an observer, not as an expert. 11
Matt Jennings, President of Data Management at consultancy Restaurant Technologies.
29
And indeed, published research12 shows that the industry maxim is spot on: taking just 7 seconds (!) out
of drive-through wait time will increase a restaurant’s local market share by anywhere from 1 to 3
percentage points. (That is absolute share points, not percentage change: taking 7 seconds off the wait
time of a McDonald’s that has a 30% local market share, will likely increase that share to 33%.) Armed
with this kind of data, it is very easy for a fast-food franchisee to see exactly what the ROI could be for
adding (e.g.) a second drive-through lane. And, crucially, the industry can calculate the sources of
changes in sales and share, whether it is from conquesting customers from one chain to another (always
a gain), cannibalizing one’s one sit-down sales by switching customers to drive-through (which can be a
net gain or loss), cannibalizing sales from a rival store of the same brand, or attracting entirely new
customers who would not have bought fast food at all. We have never seen data from any car OEM
showing this kind of detail, though it may exist somewhere: that is, even if factory X knows that
upgrading one of its dealerships generates $Y more in sales, it does not know if these sales are
conquested from brand Y, or cannibalized from other X-brand stores down the road.
Of course, every industry is different. And a person can argue that, in this case for example, when one
has millions of daily customers, it is easier to measure how facilities affect customer behavior. That
being said, we believe the auto industry has the analytical horsepower to attack the problem.
Throughout our work we were struck by the “disconnect” between assertions about facilities, and facts
about customer behavior. That is, there are more than a few industry surveys which show how a
particular facility feature (e.g. a modern and comfortable service-are waiting lounge) affects customer
satisfaction, but none we could find that then linked that satisfaction to actual behavior. When a fast-
food restaurant puts in a second drive-through window, sales go up. When a dealer puts in a nice
waiting lounge, customer satisfaction goes up – but does service retention go up? Does the average RO
increase? Does fixed coverage improve? Of course a customer will prefer a comfortable to an
uncomfortable lounge – but does a more comfortable lounge change his or her shopping behavior? The
answers to this kind of question seem to be lacking in the automotive retailing industry.
IV. The Dealership of the Future
Introduction
Various interviewees in Phase 1 raised the concern that factory facility programs were incentivizing the
building of "monuments" (or worse, "mausoleums"): dealerships that were well-suited to the shopping
and buying practices of the past, but which would be obsolete by 2025. Some of this concern is no
doubt driven by the very visible collapse of bookstore chain Borders (which many attribute to the rise of
online book sales and e-readers), but also by public announcements of store format size reductions by
Best Buy, Walmart, and others. Other interviewees were fairly convinced that the internet would strip
away the functions of the brick-and-mortar store, leading to a radically downsized format. While we
touched on some of these concerns in the Phase 1 report, NADA felt the issue should be addressed in
real depth in Phase 2, and the findings from this work follow.
12
“How Much Is a Reduction of Your Customers’ Wait Worth? An Empirical Study of the Fast-Food Drive-Thru Industry Based on Structural Estimation Methods,” by Allon, Federgruen, and Pierson, 2011.
30
What Can We Learn from Past Predictions of the Future?
Before launching into our predictions for the dealership of the future, we should step back and adjust
expectations about the accuracy of our crystal ball – because many past efforts to foretell the future
have fallen short. The list of developments that different people believed in at different times, that have
not come to pass, includes:
Multibranding: repeatedly industry insiders and outsiders alike have predicted the rise of
dealerships powerful enough to force OEMs to allow them to stock and sell brands from
different companies under one roof. No less a personage than David Power said, in Automotive
News in 1989, “We will be seeing larger car supermarket facilities, with multifranchised
operations….” Not only has this practice not come to pass, but one can argue we are heading
in the reverse direction, as more and more dealerships become exclusive to a single brand.
Build-to-Order (BTO): this topic was especially hot in the 1990s, when Dell’s computer BTO
model was seen as feasible for cars as well (at least by several leading OEMs). A survey in
Automotive News in 1993 found a majority of experts consulted, including dealers, predicting
that “instead of carrying large inventories ready for instant sale, dealers will custom-order what
customers want, to be built and delivered directly to the buyer within a week.” The barriers to
true BTO (ranging from customer impatience to factory production realities and beyond) have
turned out to be significant enough that some manufacturers have told us that in fact they have
seen a decline in the percentage of their sales that are BTO. Indeed, inventory levels at car
dealerships remain in the 30-90 day range, whereas in a true BTO environment a store in theory
would need to carry only a handful of demonstrator cars.
Public ownership: certainly in the 1990s, when many of the current public chains first came into
existence, there was near-panic among many private dealerships that these large chains would
“sweep the board” -- and pronouncements by management back then supported this fear, as
the benefits of their economies of scale and scope were widely touted. Again, a variety of
barriers emerged, from OEM resistance, to difficulties of capturing the expected scale
economies, to customer indifference to retail chain branding in cars, that have kept the
combined market share of these major public companies at well below 10% for many years now.
Internet disintermediation: another challenge to the dealership system that threatened in the
1990s to become a trend was the disintermediation, or cutting out of, the dealer in the process
that moved cars from OEMs to customers. Autobytel and other online firms seemed likely to
claim the customer for their own, reducing the dealership to just a delivery point: indeed, after
its IPO in 1999 Autobytel stock moved up from its initial pricing of $23 per share to over $70 by
2004. But the traditional system absorbed the online challenge and in fact adopted its
techniques, so that internet sites (for now at least) remain vital for shopping for cars, but have
not managed to actually cut dealers out of the loop. And as of this writing, Autobytel stock is
trading at about $4.
OEM forward integration: While various factories at various times have attempted to get into
the car sales business over the years (and indeed, if we go back to the 1920s or so, this method
was quite prevalent), in recent years only two serious attempts have been made to do so: the
Ford Retail Network experiment of 1997-2001 and the parallel GM Enterprises concept that was
31
cancelled before it could be launched. The failure of the FRN – in which the OEM would take a
controlling ownership stake in dealerships – had many causes, but suffice it to say that the
primary lesson learned was that in the US environment at least, factory ownership of
dealerships is impractical and costly. (We must note that in Canada, as mentioned before, direct
OEM ownership of stores is more feasible, though hardly widespread, and is not seen as the
entering wedge of a general OEM buyout of dealerships.)
Given that these five sweeping predictions of the last two decades or so have failed to come true (at
least to date), the lesson learned is that the North American dealership system is extremely resilient,
and thus predictions of rapid change are very risky to make. Despite the constant drumbeat of
complaint in the press about the system being “broken,” customers seem happier than ever with their
dealership experience, and no rival system has been shown to be able to better execute its tasks (which
include not just the sale of new cars, of course, but the sale of used cars, warranty service, customer-pay
service, collision repair, the provision of finance and insurance products, and the support of in-field
vehicle recalls). And as readers will see, our own forecast for the physical “dealership of the future” lays
out only relatively modest changes for the year 2025 or so.
However, just because several large past predictions have missed the mark, that does not mean we
should not attempt once again to take a shot. For one thing, to build a store which may last 25 years or
so, without some view of what those 25 years will bring in terms of customer demands, regulatory
changes, product evolution, and other factors, is just simply irresponsible. But also, some things have
come to pass in the auto industry that most observers did miss.
The prime example of missing a key automotive development, in our view, is CarMax. Founded in 1993,
this company’s imminent demise has been predicted virtually every year since then. The supposedly
fatal flaws attributed to CarMax over time included: “they can’t buy inventory as smart as real dealers
can,” “they don’t have access to the closed auctions,” “they can’t survive without a giant captive finance
arm behind them,” “a dealer can always undercut their prices,” “they’ll be caught out with the wrong
inventory when the price of gas spikes up,” “buying cars off the street will never work for them,” etc.
etc. Yet here they are in 2013, not only surviving, but thriving. In fact, CarMax’s market capitalization is
about $8 billion, generated essentially by used car sales only, at only 110 locations; whereas the market
cap of the largest full-service dealership chain, AutoNation, which has about 215 dealerships, is just
under $5 billion. The lesson learned is that we should not be complacent: some forecasts of major
change do come to pass.
Evolution of Dealerships Over the Past Half Century
One way to forecast the future evolution of dealerships is to ignore expert predictions and just look at
the actual historical facts. If we can see how dealerships have changed since 1950, we might be able to
extrapolate that change trajectory to 2050. So let’s step back from the future for now, and see how far
we have come. We’ll choose as an arbitrary start date for this journey the mid-1950s.
How can we characterize the physical dealership of the 1950s, using for now just the US case? We will
take several major categories in turn.
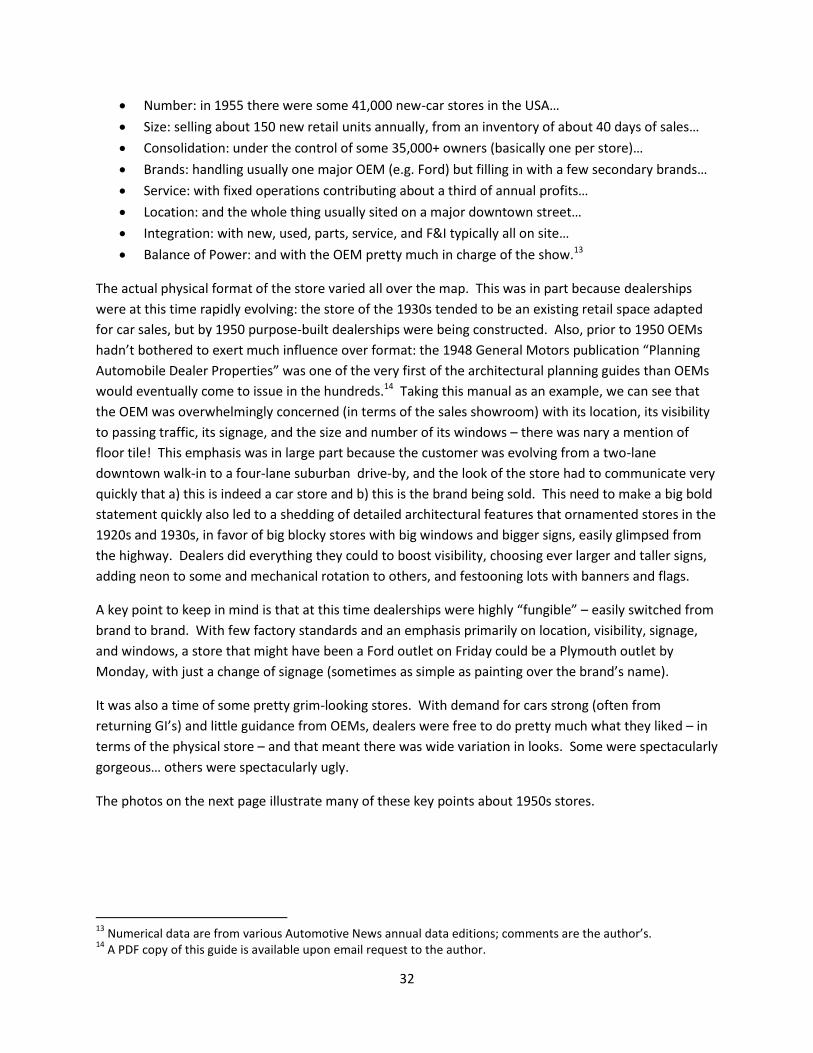
32
Number: in 1955 there were some 41,000 new-car stores in the USA…
Size: selling about 150 new retail units annually, from an inventory of about 40 days of sales…
Consolidation: under the control of some 35,000+ owners (basically one per store)…
Brands: handling usually one major OEM (e.g. Ford) but filling in with a few secondary brands…
Service: with fixed operations contributing about a third of annual profits…
Location: and the whole thing usually sited on a major downtown street…
Integration: with new, used, parts, service, and F&I typically all on site…
Balance of Power: and with the OEM pretty much in charge of the show.13
The actual physical format of the store varied all over the map. This was in part because dealerships
were at this time rapidly evolving: the store of the 1930s tended to be an existing retail space adapted
for car sales, but by 1950 purpose-built dealerships were being constructed. Also, prior to 1950 OEMs
hadn’t bothered to exert much influence over format: the 1948 General Motors publication “Planning
Automobile Dealer Properties” was one of the very first of the architectural planning guides than OEMs
would eventually come to issue in the hundreds.14 Taking this manual as an example, we can see that
the OEM was overwhelmingly concerned (in terms of the sales showroom) with its location, its visibility
to passing traffic, its signage, and the size and number of its windows – there was nary a mention of
floor tile! This emphasis was in large part because the customer was evolving from a two-lane
downtown walk-in to a four-lane suburban drive-by, and the look of the store had to communicate very
quickly that a) this is indeed a car store and b) this is the brand being sold. This need to make a big bold
statement quickly also led to a shedding of detailed architectural features that ornamented stores in the
1920s and 1930s, in favor of big blocky stores with big windows and bigger signs, easily glimpsed from
the highway. Dealers did everything they could to boost visibility, choosing ever larger and taller signs,
adding neon to some and mechanical rotation to others, and festooning lots with banners and flags.
A key point to keep in mind is that at this time dealerships were highly “fungible” – easily switched from
brand to brand. With few factory standards and an emphasis primarily on location, visibility, signage,
and windows, a store that might have been a Ford outlet on Friday could be a Plymouth outlet by
Monday, with just a change of signage (sometimes as simple as painting over the brand’s name).
It was also a time of some pretty grim-looking stores. With demand for cars strong (often from
returning GI’s) and little guidance from OEMs, dealers were free to do pretty much what they liked – in
terms of the physical store – and that meant there was wide variation in looks. Some were spectacularly
gorgeous… others were spectacularly ugly.
The photos on the next page illustrate many of these key points about 1950s stores.
13
Numerical data are from various Automotive News annual data editions; comments are the author’s. 14
A PDF copy of this guide is available upon email request to the author.
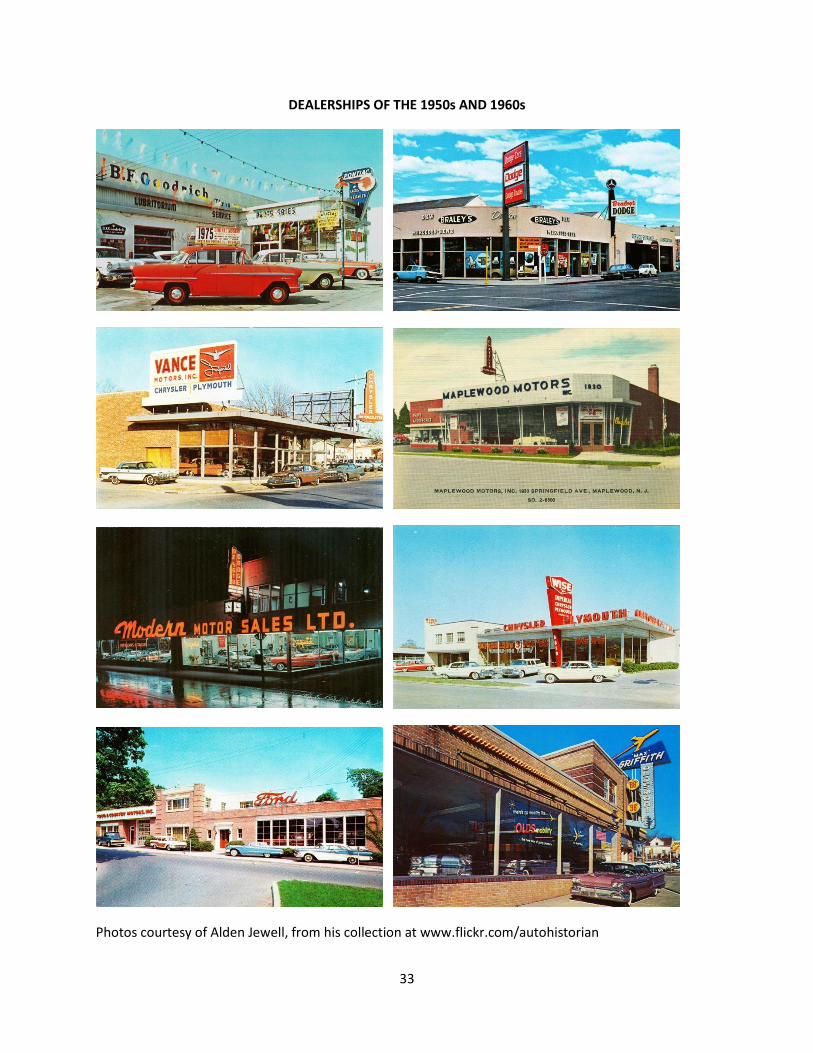
33
DEALERSHIPS OF THE 1950s AND 1960s
Photos courtesy of Alden Jewell, from his collection at www.flickr.com/autohistorian
34
Now let’s fast-forward to about 2010 or so, about half a century later. What has happened to physical
dealerships in the USA?
Number: from 41,000 we have shrunken down to about 18,000 dealerships
Size: but with growth in total sales the average store now sells some 650 new units annually; but
with the proliferation of models the average days of inventory have risen from 40 to 60…
Consolidation: and there has been significant shrinkage in the ownership base, with the typical
dealer principal owning several stores in a local region (but on the other hand the national
chains have not swept the board)…
Brands: while dualling has been dramatically reduced, as OEMs move to mostly exclusive-to-
one-factory stores…
Service: and fixed operations are contributing even more: about half of annual profits…
Location: while most stores have moved out from downtown to the suburbs….
Integration: and some dis-integration has occurred, with only 1 in 5 stores now having an on-site
bodyshop, and administrative and other functions are moving off-site as well…
Balance of Power: while, thanks to the efforts of dealers, state associations, and NADA, the
balance of power between OEMs and dealers has become much more even (while consumers,
thanks to the rise of the internet, are gaining more power relative to both dealers and factories).
As far as the physical format goes, dealerships by now are almost wholly purpose-built (as opposed to
being converted from some other retail space), and appearances are much more standardized, as OEMs
started rolling out image programs in earnest in the 1990s. Now, for better or worse, factories attempt
to specify much more than just windows and signs, and issue planning guides that go right down to the
level of furniture design, floor tile and carpet specification, and even the look of stationery, landscaping,
and bathroom fixtures. Along with this higher level of store customization comes the inevitable
reduction in fungibility. Dealerships since the 1950s have always tended to be single-purpose facilities,
useful only as dealerships, whereas general retail stores can be switched from yogurt shop to bookstore
to clothing boutique without much trouble. But the increasing customization of dealerships means
these stores are so expensive to remodel that not only would they have be torn down and rebuilt to
repurpose for another use, but even switching to a different brand would require “raze and rebuild.”
This kind of customization may improve the value of the dealership to the OEM, but reduces the value of
the dealership to the owner.
Before we extrapolate these trajectories to the dealership of the future, let’s look to a few other sources
of insight, to add to the mix. Since pundits often tell us that automotive retailing is about ten years
behind general retailing, perhaps we can learn from today’s trends in the world of food, clothing, and
other retailing sectors, about what might be about to happen to our own industry.
Looking Forward: General Retail Trends
We did not find a lot of good solid work on the topic of the future evolution of the physical dealership .
Not many experts, either architects, academics, or consultants, spend much time trying to predict the
physical dealer of the future – it seems that all their energy is wrapped up in looking at changes to the
online side of the store, from email to CRM to social media to SEO (search engine optimization) and
35
more. And dealers themselves are pretty quiet on the topic: while worried that their store may not be
the right format for the next generation to inherit, few of them have spent a lot of time thinking 5 or 10
years ahead, which is understandable given how complex a task just running today’s store is.
So, with little to draw on here, we widened our scope and sought out experts on overall retailing trends
generally: primarily academics and consultants who spend their time thinking about the retail store of
the future, since in the end dealerships are retail stores, and therefore any trend shaping retail generally
should have some impact on dealerships as well. We spoke to numerous people, but in particular
several professors attached to the Jay H. Baker Retailing Center at the Wharton School of the University
of Pennsylvania in Philadelphia. After completing our interviews, we boiled down the numerous trends
they highlighted to the following seven. Some of these may seem obvious, but just because an
observation is obvious that does not make it unhelpful. In each case we tried to link these trends to
implications for the DOF, to take into account in our own forecasts.
Seven Trends Shaping North American Retail Over the Next Decade
1. CONSTANTLY RISING CUSTOMER EXPECTATIONS: Customers benchmark all retailing against
their best experiences, from any store. If Nordstrom’s comes up with an innovation, customers
will soon expect it at the Gap. IMPLICATION: First, dealers and OEMs should not be afraid to
adapt best store format ideas from anywhere. Second, store design should be flexible enough
to be able to reconfigure the dealership quickly and at low cost, to keep up with rising
expectations.
2. PERSONALIZATION OF SHOPPING EXPERIENCE: The best merchants everywhere segment the
buying process as well as the product (for example, restaurants can deliver to your home, let you
dine in, offer take-out, and even drive-through). Car dealers have tended to segment the
product (e.g. minivan, sedan, SUV) but not the process: impatient informed younger online
buyers might have to run the same hurdles as a retired and less-informed “off line” senior
citizen. IMPLICATION: It may be time to accelerate segmentation of dealership sales processes
and facilities. Is there an automotive equivalent of the “express checkout lane?”
3. CUSTOMERS SEEKING AN EVER EASIER EXPERIENCE: “Easier” can be defined in many ways:
faster, simpler, closer to home, less confusing, etc. This trend has never changed, only how it is
implemented has evolved: thus Sears introduced the mail order catalog in 1888 and the internet
introduced online ordering a century later, but both were responses to the same “Make this
more convenient!” trend. IMPLICATION: Dealers and OEMs must stay flexible and creative to
improve convenience. Taken to its extreme, for example, 100% home delivery of cars might
mean “no” store at all.
4. TECHNOLOGY (OFTEN) DISPLACING PHYSICAL ASSETS: When we looked at past predictions for
dealerships they often included whiz-bang technologies such as holographic displays. Much of
this evolution has not yet come about, but sooner or later interactive displays, high-speed
automated dealer inventory swaps, seamless online/offline shopping integration, mobile
shopping apps, and even true BTO may become widespread. IMPLICATION: Many of these
technologies will serve to allow reduction in inventory levels: note that car dealers have
consistently for decades run inventories that are much higher than regular retail levels. (See
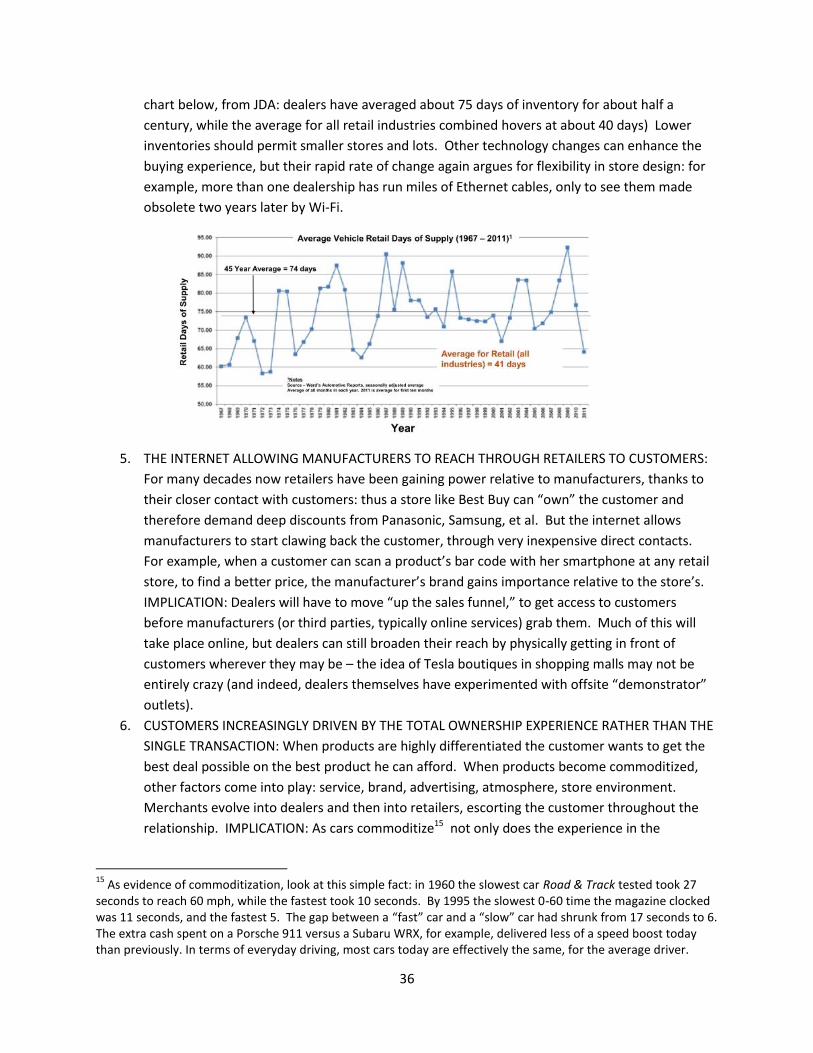
36
chart below, from JDA: dealers have averaged about 75 days of inventory for about half a
century, while the average for all retail industries combined hovers at about 40 days) Lower
inventories should permit smaller stores and lots. Other technology changes can enhance the
buying experience, but their rapid rate of change again argues for flexibility in store design: for
example, more than one dealership has run miles of Ethernet cables, only to see them made
obsolete two years later by Wi-Fi.
5. THE INTERNET ALLOWING MANUFACTURERS TO REACH THROUGH RETAILERS TO CUSTOMERS:
For many decades now retailers have been gaining power relative to manufacturers, thanks to
their closer contact with customers: thus a store like Best Buy can “own” the customer and
therefore demand deep discounts from Panasonic, Samsung, et al. But the internet allows
manufacturers to start clawing back the customer, through very inexpensive direct contacts.
For example, when a customer can scan a product’s bar code with her smartphone at any retail
store, to find a better price, the manufacturer’s brand gains importance relative to the store’s.
IMPLICATION: Dealers will have to move “up the sales funnel,” to get access to customers
before manufacturers (or third parties, typically online services) grab them. Much of this will
take place online, but dealers can still broaden their reach by physically getting in front of
customers wherever they may be – the idea of Tesla boutiques in shopping malls may not be
entirely crazy (and indeed, dealers themselves have experimented with offsite “demonstrator”
outlets).
6. CUSTOMERS INCREASINGLY DRIVEN BY THE TOTAL OWNERSHIP EXPERIENCE RATHER THAN THE
SINGLE TRANSACTION: When products are highly differentiated the customer wants to get the
best deal possible on the best product he can afford. When products become commoditized,
other factors come into play: service, brand, advertising, atmosphere, store environment.
Merchants evolve into dealers and then into retailers, escorting the customer throughout the
relationship. IMPLICATION: As cars commoditize15 not only does the experience in the
15
As evidence of commoditization, look at this simple fact: in 1960 the slowest car Road & Track tested took 27 seconds to reach 60 mph, while the fastest took 10 seconds. By 1995 the slowest 0-60 time the magazine clocked was 11 seconds, and the fastest 5. The gap between a “fast” car and a “slow” car had shrunk from 17 seconds to 6. The extra cash spent on a Porsche 911 versus a Subaru WRX, for example, delivered less of a speed boost today than previously. In terms of everyday driving, most cars today are effectively the same, for the average driver.
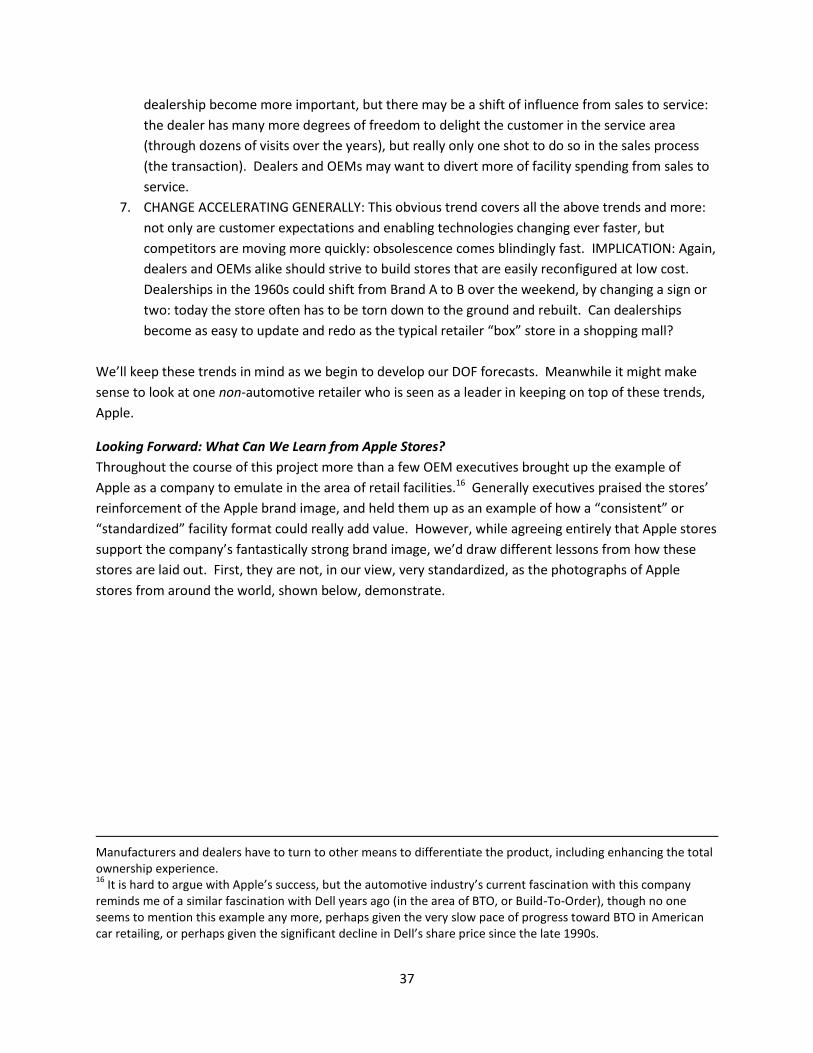
37
dealership become more important, but there may be a shift of influence from sales to service:
the dealer has many more degrees of freedom to delight the customer in the service area
(through dozens of visits over the years), but really only one shot to do so in the sales process
(the transaction). Dealers and OEMs may want to divert more of facility spending from sales to
service.
7. CHANGE ACCELERATING GENERALLY: This obvious trend covers all the above trends and more:
not only are customer expectations and enabling technologies changing ever faster, but
competitors are moving more quickly: obsolescence comes blindingly fast. IMPLICATION: Again,
dealers and OEMs alike should strive to build stores that are easily reconfigured at low cost.
Dealerships in the 1960s could shift from Brand A to B over the weekend, by changing a sign or
two: today the store often has to be torn down to the ground and rebuilt. Can dealerships
become as easy to update and redo as the typical retailer “box” store in a shopping mall?
We’ll keep these trends in mind as we begin to develop our DOF forecasts. Meanwhile it might make
sense to look at one non-automotive retailer who is seen as a leader in keeping on top of these trends,
Apple.
Looking Forward: What Can We Learn from Apple Stores?
Throughout the course of this project more than a few OEM executives brought up the example of
Apple as a company to emulate in the area of retail facilities.16 Generally executives praised the stores’
reinforcement of the Apple brand image, and held them up as an example of how a “consistent” or
“standardized” facility format could really add value. However, while agreeing entirely that Apple stores
support the company’s fantastically strong brand image, we’d draw different lessons from how these
stores are laid out. First, they are not, in our view, very standardized, as the photographs of Apple
stores from around the world, shown below, demonstrate.
Manufacturers and dealers have to turn to other means to differentiate the product, including enhancing the total ownership experience. 16
It is hard to argue with Apple’s success, but the automotive industry’s current fascination with this company reminds me of a similar fascination with Dell years ago (in the area of BTO, or Build-To-Order), though no one seems to mention this example any more, perhaps given the very slow pace of progress toward BTO in American car retailing, or perhaps given the significant decline in Dell’s share price since the late 1990s.
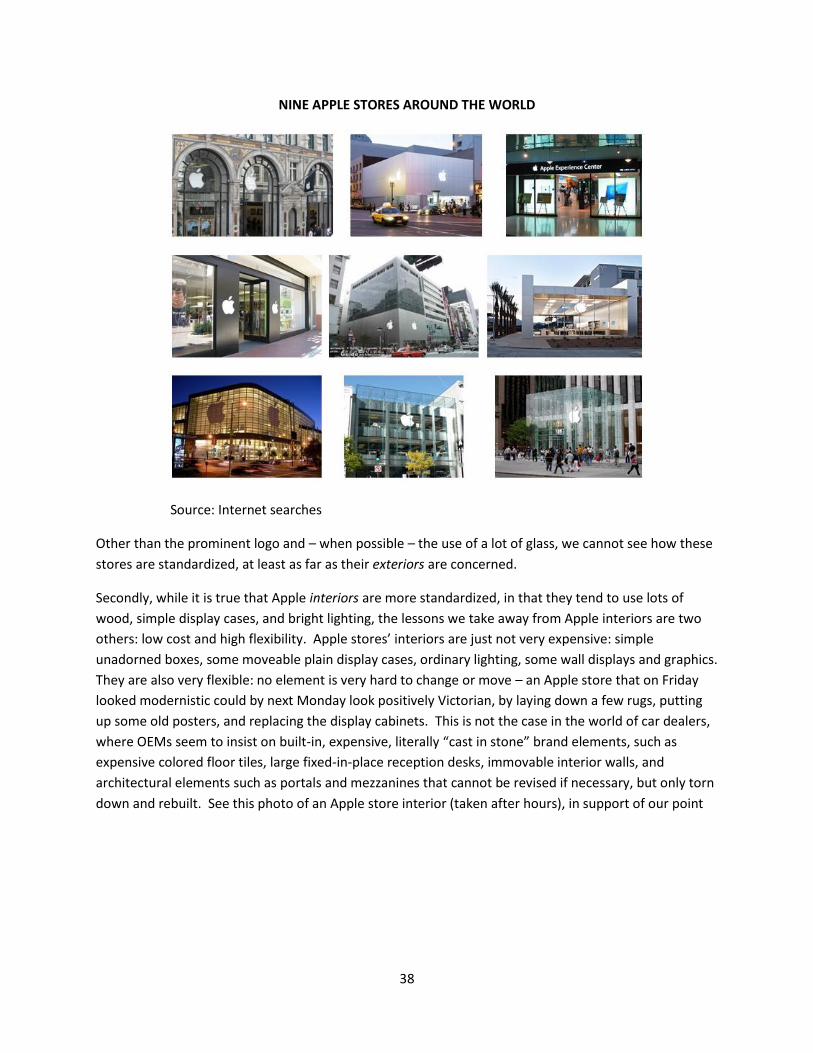
38
NINE APPLE STORES AROUND THE WORLD
Source: Internet searches
Other than the prominent logo and – when possible – the use of a lot of glass, we cannot see how these
stores are standardized, at least as far as their exteriors are concerned.
Secondly, while it is true that Apple interiors are more standardized, in that they tend to use lots of
wood, simple display cases, and bright lighting, the lessons we take away from Apple interiors are two
others: low cost and high flexibility. Apple stores’ interiors are just not very expensive: simple
unadorned boxes, some moveable plain display cases, ordinary lighting, some wall displays and graphics.
They are also very flexible: no element is very hard to change or move – an Apple store that on Friday
looked modernistic could by next Monday look positively Victorian, by laying down a few rugs, putting
up some old posters, and replacing the display cabinets. This is not the case in the world of car dealers,
where OEMs seem to insist on built-in, expensive, literally “cast in stone” brand elements, such as
expensive colored floor tiles, large fixed-in-place reception desks, immovable interior walls, and
architectural elements such as portals and mezzanines that cannot be revised if necessary, but only torn
down and rebuilt. See this photo of an Apple store interior (taken after hours), in support of our point
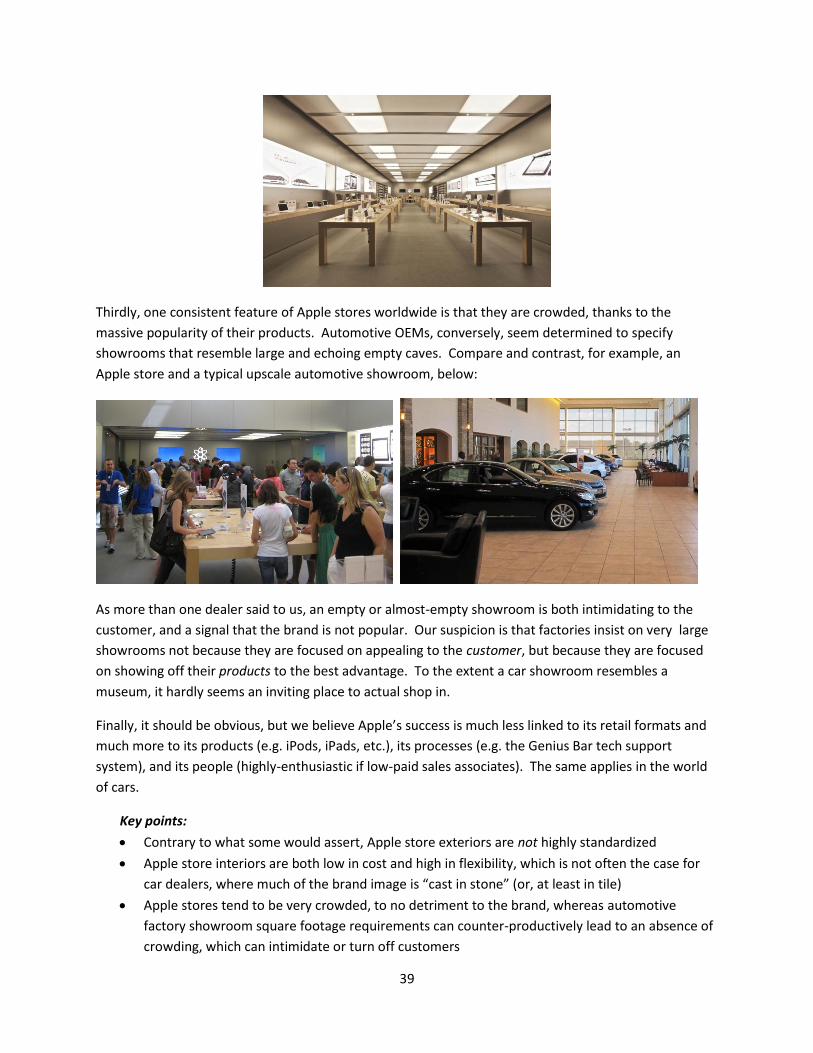
39
Thirdly, one consistent feature of Apple stores worldwide is that they are crowded, thanks to the
massive popularity of their products. Automotive OEMs, conversely, seem determined to specify
showrooms that resemble large and echoing empty caves. Compare and contrast, for example, an
Apple store and a typical upscale automotive showroom, below:
As more than one dealer said to us, an empty or almost-empty showroom is both intimidating to the
customer, and a signal that the brand is not popular. Our suspicion is that factories insist on very large
showrooms not because they are focused on appealing to the customer, but because they are focused
on showing off their products to the best advantage. To the extent a car showroom resembles a
museum, it hardly seems an inviting place to actual shop in.
Finally, it should be obvious, but we believe Apple’s success is much less linked to its retail formats and
much more to its products (e.g. iPods, iPads, etc.), its processes (e.g. the Genius Bar tech support
system), and its people (highly-enthusiastic if low-paid sales associates). The same applies in the world
of cars.
Key points:
Contrary to what some would assert, Apple store exteriors are not highly standardized
Apple store interiors are both low in cost and high in flexibility, which is not often the case for
car dealers, where much of the brand image is “cast in stone” (or, at least in tile)
Apple stores tend to be very crowded, to no detriment to the brand, whereas automotive
factory showroom square footage requirements can counter-productively lead to an absence of
crowding, which can intimidate or turn off customers
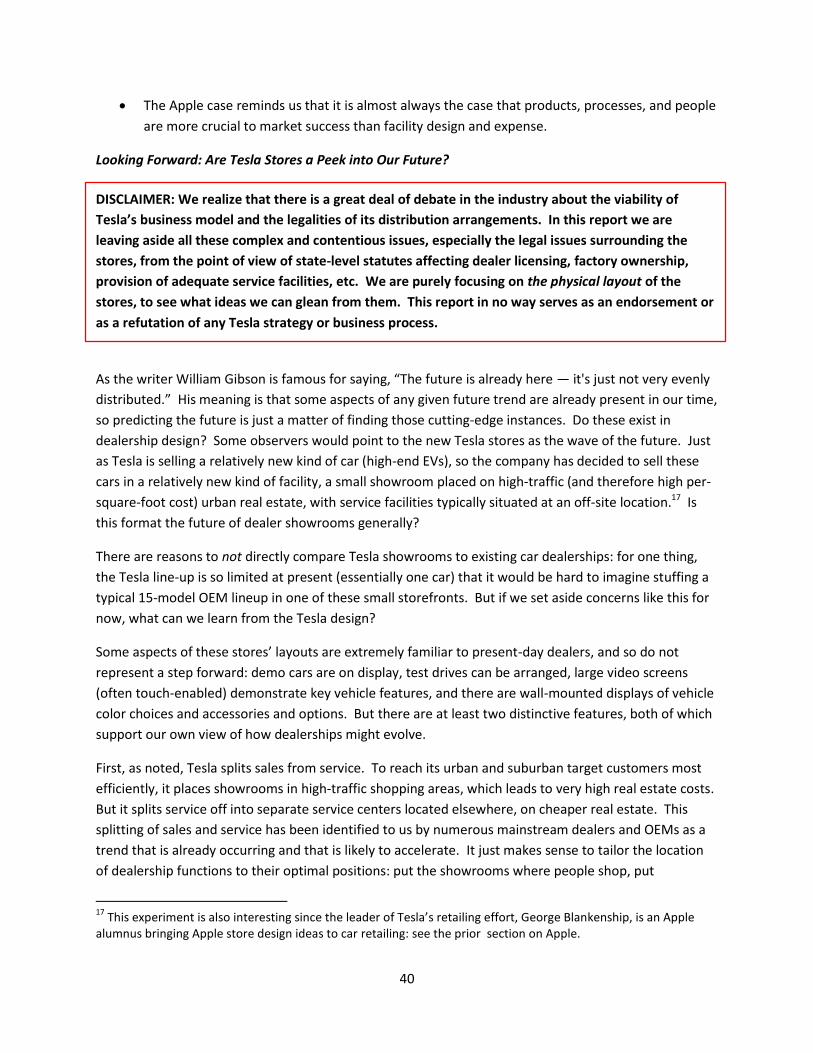
40
The Apple case reminds us that it is almost always the case that products, processes, and people
are more crucial to market success than facility design and expense.
Looking Forward: Are Tesla Stores a Peek into Our Future?
DISCLAIMER: We realize that there is a great deal of debate in the industry about the viability of
Tesla’s business model and the legalities of its distribution arrangements. In this report we are
leaving aside all these complex and contentious issues, especially the legal issues surrounding the
stores, from the point of view of state-level statutes affecting dealer licensing, factory ownership,
provision of adequate service facilities, etc. We are purely focusing on the physical layout of the
stores, to see what ideas we can glean from them. This report in no way serves as an endorsement or
as a refutation of any Tesla strategy or business process.
As the writer William Gibson is famous for saying, “The future is already here — it's just not very evenly
distributed.” His meaning is that some aspects of any given future trend are already present in our time,
so predicting the future is just a matter of finding those cutting-edge instances. Do these exist in
dealership design? Some observers would point to the new Tesla stores as the wave of the future. Just
as Tesla is selling a relatively new kind of car (high-end EVs), so the company has decided to sell these
cars in a relatively new kind of facility, a small showroom placed on high-traffic (and therefore high per-
square-foot cost) urban real estate, with service facilities typically situated at an off-site location.17 Is
this format the future of dealer showrooms generally?
There are reasons to not directly compare Tesla showrooms to existing car dealerships: for one thing,
the Tesla line-up is so limited at present (essentially one car) that it would be hard to imagine stuffing a
typical 15-model OEM lineup in one of these small storefronts. But if we set aside concerns like this for
now, what can we learn from the Tesla design?
Some aspects of these stores’ layouts are extremely familiar to present-day dealers, and so do not
represent a step forward: demo cars are on display, test drives can be arranged, large video screens
(often touch-enabled) demonstrate key vehicle features, and there are wall-mounted displays of vehicle
color choices and accessories and options. But there are at least two distinctive features, both of which
support our own view of how dealerships might evolve.
First, as noted, Tesla splits sales from service. To reach its urban and suburban target customers most
efficiently, it places showrooms in high-traffic shopping areas, which leads to very high real estate costs.
But it splits service off into separate service centers located elsewhere, on cheaper real estate. This
splitting of sales and service has been identified to us by numerous mainstream dealers and OEMs as a
trend that is already occurring and that is likely to accelerate. It just makes sense to tailor the location
of dealership functions to their optimal positions: put the showrooms where people shop, put
17
This experiment is also interesting since the leader of Tesla’s retailing effort, George Blankenship, is an Apple alumnus bringing Apple store design ideas to car retailing: see the prior section on Apple.
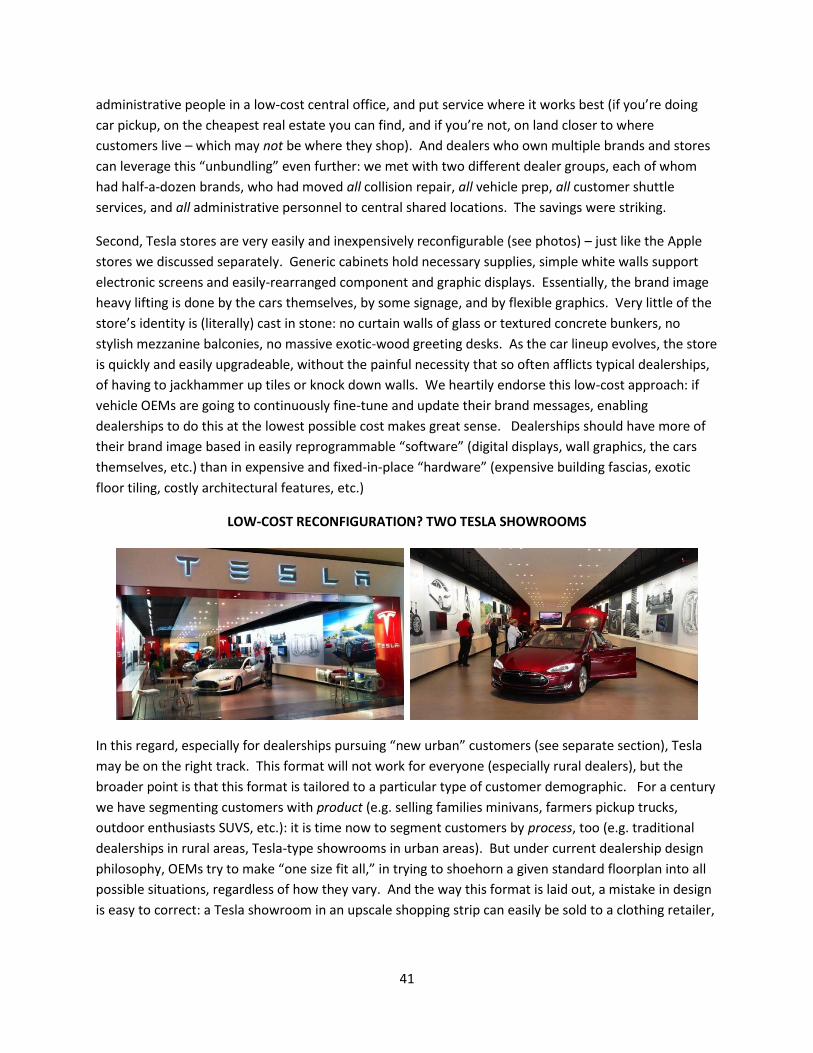
41
administrative people in a low-cost central office, and put service where it works best (if you’re doing
car pickup, on the cheapest real estate you can find, and if you’re not, on land closer to where
customers live – which may not be where they shop). And dealers who own multiple brands and stores
can leverage this “unbundling” even further: we met with two different dealer groups, each of whom
had half-a-dozen brands, who had moved all collision repair, all vehicle prep, all customer shuttle
services, and all administrative personnel to central shared locations. The savings were striking.
Second, Tesla stores are very easily and inexpensively reconfigurable (see photos) – just like the Apple
stores we discussed separately. Generic cabinets hold necessary supplies, simple white walls support
electronic screens and easily-rearranged component and graphic displays. Essentially, the brand image
heavy lifting is done by the cars themselves, by some signage, and by flexible graphics. Very little of the
store’s identity is (literally) cast in stone: no curtain walls of glass or textured concrete bunkers, no
stylish mezzanine balconies, no massive exotic-wood greeting desks. As the car lineup evolves, the store
is quickly and easily upgradeable, without the painful necessity that so often afflicts typical dealerships,
of having to jackhammer up tiles or knock down walls. We heartily endorse this low-cost approach: if
vehicle OEMs are going to continuously fine-tune and update their brand messages, enabling
dealerships to do this at the lowest possible cost makes great sense. Dealerships should have more of
their brand image based in easily reprogrammable “software” (digital displays, wall graphics, the cars
themselves, etc.) than in expensive and fixed-in-place “hardware” (expensive building fascias, exotic
floor tiling, costly architectural features, etc.)
LOW-COST RECONFIGURATION? TWO TESLA SHOWROOMS
In this regard, especially for dealerships pursuing “new urban” customers (see separate section), Tesla
may be on the right track. This format will not work for everyone (especially rural dealers), but the
broader point is that this format is tailored to a particular type of customer demographic. For a century
we have segmenting customers with product (e.g. selling families minivans, farmers pickup trucks,
outdoor enthusiasts SUVS, etc.): it is time now to segment customers by process, too (e.g. traditional
dealerships in rural areas, Tesla-type showrooms in urban areas). But under current dealership design
philosophy, OEMs try to make “one size fit all,” in trying to shoehorn a given standard floorplan into all
possible situations, regardless of how they vary. And the way this format is laid out, a mistake in design
is easy to correct: a Tesla showroom in an upscale shopping strip can easily be sold to a clothing retailer,
42
whereas an orphaned mainstream dealership has so little alternative-use value that it often must be
torn down before the land can be reused.
Tesla stores in particular may not be the wave of the future, but their unbundling of sales and service,
and their ability to be updated at low cost, are probably strategies that dealers and OEMs should closely
study.
Looking Forward: Will the “New Urbanism” Require the Revival of Downtown Stores?
It is beyond the scope of this report to discuss optimal locations for dealerships, either today or in the
future: there are too many variables involved, and numerous much more expert firms and people who
can crunch demographic and traffic numbers and then find the right site. But future dealership design is
within our scope, and as location affects design, we should comment on any trends we see in store
location overall. The trend most often brought up to us during this project was what is sometimes called
“new urbanism:” the movement of the American population back into city centers, after decades of
migration outward, into the suburbs. As the suburban exodus went on, dealers followed, moving from
urban Main Streets to suburban Auto Miles. With this migration came a change in facility layout, as
inexpensive suburban real estate and high-traffic suburban roads encouraged the building of very large
stores with very extensive frontages. Floor traffic was no longer walk-in, but drive-by.
Now, however, we are starting to see some movement of Americans back into cities, or at least a
dramatic slowing in the suburban outbound migration. Various factors drive this movement, from high
gas prices inducing people to shorten commutes, to ultra-low urban real estate prices making
downtown living more of a bargain.18 Whatever the reason, if this trend persists (see charts showing the
shift in migration for four major metro areas), the implication is that we may need to design a “new
urban” dealership.
18
See, for example, a July 20, 2012 article in the Huffington Post, identifying ten cities (not only in the Midwest but also in foreclosure-wracked Florida), where the price of an average house was less than the price of a typical new car sold in that city! “10 Cities Where Homes Cost Less Than A Car,” by Rusty Weston.
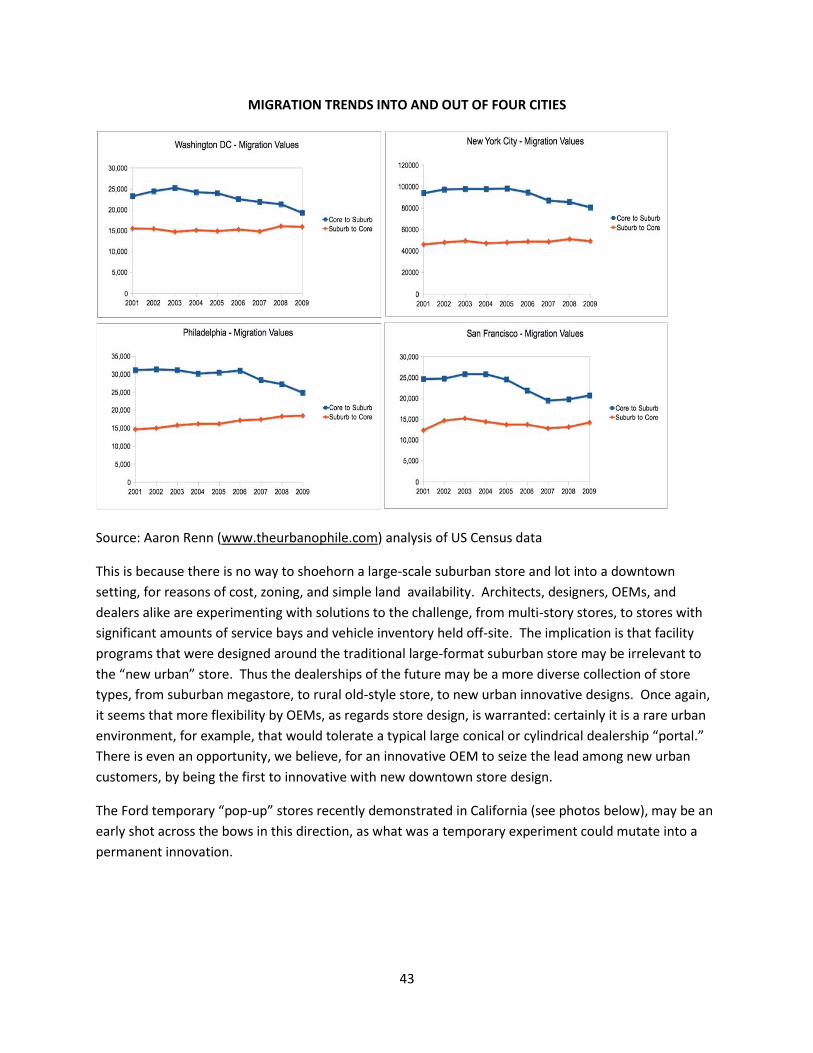
43
MIGRATION TRENDS INTO AND OUT OF FOUR CITIES
Source: Aaron Renn (www.theurbanophile.com) analysis of US Census data
This is because there is no way to shoehorn a large-scale suburban store and lot into a downtown
setting, for reasons of cost, zoning, and simple land availability. Architects, designers, OEMs, and
dealers alike are experimenting with solutions to the challenge, from multi-story stores, to stores with
significant amounts of service bays and vehicle inventory held off-site. The implication is that facility
programs that were designed around the traditional large-format suburban store may be irrelevant to
the “new urban” store. Thus the dealerships of the future may be a more diverse collection of store
types, from suburban megastore, to rural old-style store, to new urban innovative designs. Once again,
it seems that more flexibility by OEMs, as regards store design, is warranted: certainly it is a rare urban
environment, for example, that would tolerate a typical large conical or cylindrical dealership “portal.”
There is even an opportunity, we believe, for an innovative OEM to seize the lead among new urban
customers, by being the first to innovative with new downtown store design.
The Ford temporary “pop-up” stores recently demonstrated in California (see photos below), may be an
early shot across the bows in this direction, as what was a temporary experiment could mutate into a
permanent innovation.
44
FORD CALIFORNIA “POP UP” SHOWROOMS: ADVERTISEMENT AND INTERIOR VIEW
Factors that Will Slow Change
Now that we’ve looked at forces and trends and examples that indicate that the DOF will be significantly
different from today’s store, it’s time to step back and look at the forces and factors that will tend to
slow or inhibit change. The problem with many forecasts about the future is that they might end up
being right, but late. For example, antilock brakes first appeared on American cars in 1969 (as an option
on the Ford Thunderbird), but it took a quarter of a century before they were installed on more than
50% of new cars. Issues of cost, engineering, consumer acceptance, and OEM marketing all combined to
retard their progress. Change happens, but getting the timing right is everything. So what forces are
out there that would serve to slow the rate of change of the physical dealership in the USA? We would
nominate three: regulation, complexity, and risk aversion.
REGULATION: Not only is purchasing a car massively important to customers (who rarely spend as much
money on anything else), but also to governments, at the local, state, and federal level. Whether this is
because dealerships…
employ so many people (who then must be protected via agencies such as OSHA),
or because they take up so much land in a community (and as such are of great interest to
zoning boards),
or because their owners are politically influential (as business people who are major campaign
contributors and whose city-, state-, province- and federal-level dealer associations are
energetic advocates for dealers),
or because they generate so much tax revenue (typically at least 25% of a given community’s
sales tax inflow, for example),
or all the above and more,
… this industry is very highly regulated. Much of this regulation focuses on topics which directly or
indirectly influence the physical layout of the store, even if that was not the original intent. For
example, regulations that intend to protect consumers by requiring service facilities to be bundled with
45
sales locations can make it hard to set up satellite service locations – even if both dealers and customers
might prefer this. Or, as some interviewees told us, community restrictions on tall, large, or illuminated
signs can actually drive OEMs to demand more expensive store facades, since now the store has to carry
the brand image in the way that the sign used to.
Further, many of these regulations vary from state to state, and even from community to community,
making it difficult for someone who has come up with a new idea to roll it out quickly and broadly across
the country.
And finally, for many of these regulations there is no organized constituency interested in change. For
one thing, customers buy cars at such long intervals that they tend to accept regulatory impositions, as
they might not see them for another five or six years. Thus, for example, consumers may be VERY aware
that Amazon (to date at least) does not generally charge sales tax, since they are reminded of this fact
every time they click on a book or DVD to purchase. But the intricacies of inter-state regulations on
sales of cars come to their attention so infrequently that it is hard to build up a groundswell of
complaint about them. The situation is similar to that of the electoral college: no one really likes it, but
since the topic comes up only every 4 years or so, there is little momentum for change.
Thus we can imagine that regulatory barriers – for better or worse – will continue to have a dampening
effect on the rate of change in the auto retailing industry.
COMPLEXITY: As a dealership is several businesses integrated into one location (new, used, parts,
service, finance...), the complexity of its operations make it harder to experiment with change. A
dealership is a system, not just a single function. And customers have come to expect this, as they
should: there is great convenience in being able to buy, sell, maintain, finance, repair, and sometimes
even rent a new or used car all at a single “one-stop shop.” Dealers also see benefits to the integrated
system: a full-service dealership can sell you a used car if no new one on the lot seems right, and can
offer you a trade-in price on your car while it is in the service lane. In summary, a lot of the current
dealership physical layout is driven by this need to bundle all these different offerings in one place. This
kind of complexity is seen in no other business, as far as we know: a furniture store, for example, might
sell you a new sofa and also finance it, but it typically won’t repair a worn couch or take it in trade!
(It is interesting to note that some of the most successful innovations in automotive-related retail
formats have realized this and avoided trying to challenge the whole system, instead focusing on peeling
off one profitable bit at a time. Thus the founders of CarMax scarcely considered going all-in with new
car dealerships, instead perfecting the used-cars-only superstore model.19 Thus the creators of quick-
lube chains avoided handling the full range of repair services dealerships offered, focusing instead on
light maintenance work such as oil changes and filter and fluid replacements – none of which required
highly-skilled techs or time-consuming diagnostic work.)
19
Although the company does retain a few new-car stores, new vehicle sales for CarMax in fiscal 2012 represented only about 2% of total revenues.
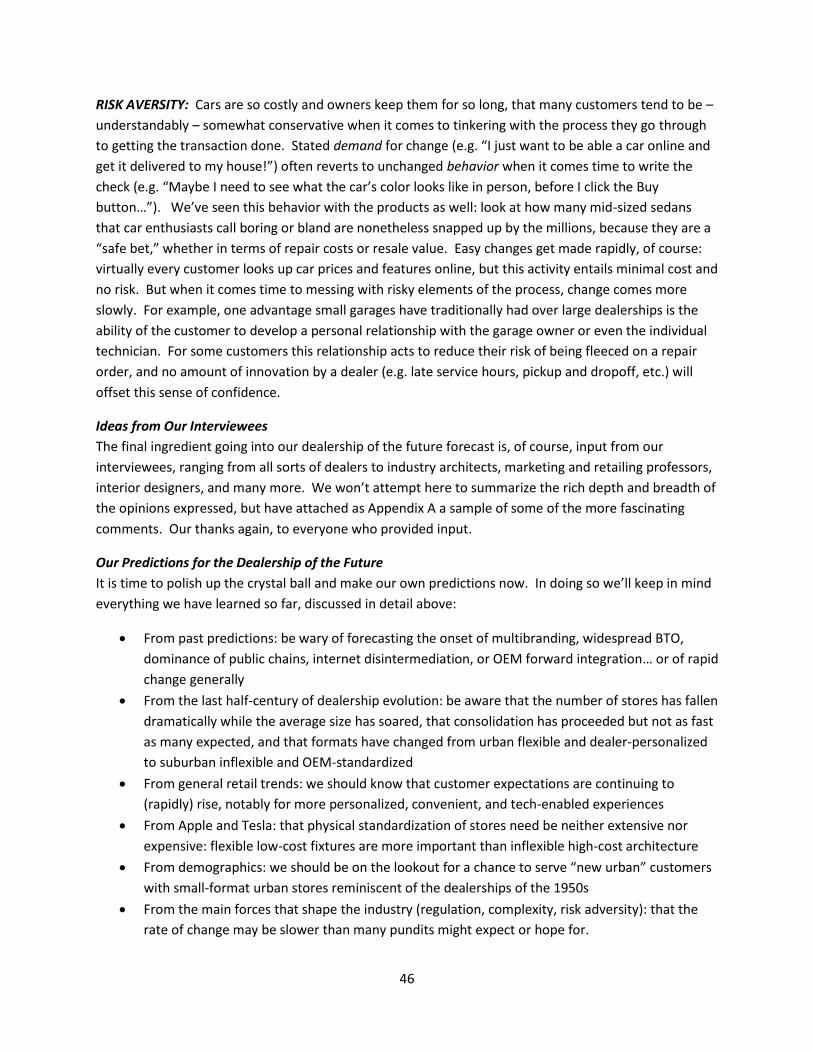
46
RISK AVERSITY: Cars are so costly and owners keep them for so long, that many customers tend to be –
understandably – somewhat conservative when it comes to tinkering with the process they go through
to getting the transaction done. Stated demand for change (e.g. “I just want to be able a car online and
get it delivered to my house!”) often reverts to unchanged behavior when it comes time to write the
check (e.g. “Maybe I need to see what the car’s color looks like in person, before I click the Buy
button…”). We’ve seen this behavior with the products as well: look at how many mid-sized sedans
that car enthusiasts call boring or bland are nonetheless snapped up by the millions, because they are a
“safe bet,” whether in terms of repair costs or resale value. Easy changes get made rapidly, of course:
virtually every customer looks up car prices and features online, but this activity entails minimal cost and
no risk. But when it comes time to messing with risky elements of the process, change comes more
slowly. For example, one advantage small garages have traditionally had over large dealerships is the
ability of the customer to develop a personal relationship with the garage owner or even the individual
technician. For some customers this relationship acts to reduce their risk of being fleeced on a repair
order, and no amount of innovation by a dealer (e.g. late service hours, pickup and dropoff, etc.) will
offset this sense of confidence.
Ideas from Our Interviewees
The final ingredient going into our dealership of the future forecast is, of course, input from our
interviewees, ranging from all sorts of dealers to industry architects, marketing and retailing professors,
interior designers, and many more. We won’t attempt here to summarize the rich depth and breadth of
the opinions expressed, but have attached as Appendix A a sample of some of the more fascinating
comments. Our thanks again, to everyone who provided input.
Our Predictions for the Dealership of the Future
It is time to polish up the crystal ball and make our own predictions now. In doing so we’ll keep in mind
everything we have learned so far, discussed in detail above:
From past predictions: be wary of forecasting the onset of multibranding, widespread BTO,
dominance of public chains, internet disintermediation, or OEM forward integration… or of rapid
change generally
From the last half-century of dealership evolution: be aware that the number of stores has fallen
dramatically while the average size has soared, that consolidation has proceeded but not as fast
as many expected, and that formats have changed from urban flexible and dealer-personalized
to suburban inflexible and OEM-standardized
From general retail trends: we should know that customer expectations are continuing to
(rapidly) rise, notably for more personalized, convenient, and tech-enabled experiences
From Apple and Tesla: that physical standardization of stores need be neither extensive nor
expensive: flexible low-cost fixtures are more important than inflexible high-cost architecture
From demographics: we should be on the lookout for a chance to serve “new urban” customers
with small-format urban stores reminiscent of the dealerships of the 1950s
From the main forces that shape the industry (regulation, complexity, risk adversity): that the
rate of change may be slower than many pundits might expect or hope for.
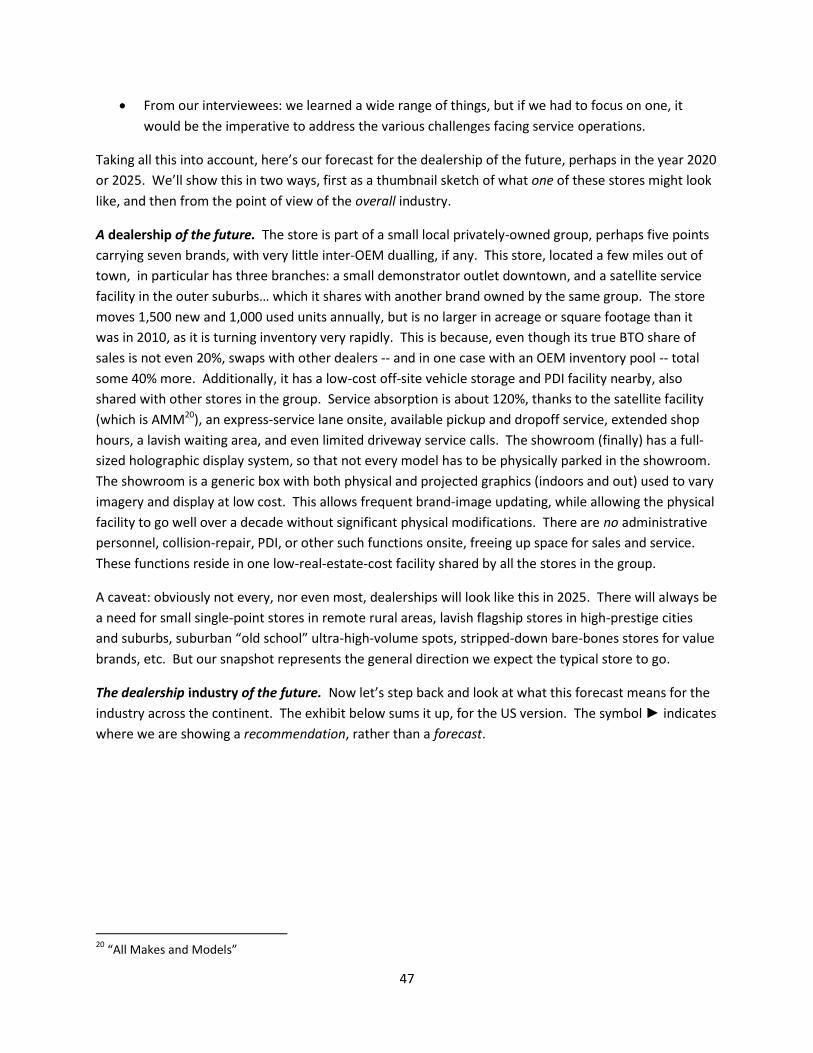
47
From our interviewees: we learned a wide range of things, but if we had to focus on one, it
would be the imperative to address the various challenges facing service operations.
Taking all this into account, here’s our forecast for the dealership of the future, perhaps in the year 2020
or 2025. We’ll show this in two ways, first as a thumbnail sketch of what one of these stores might look
like, and then from the point of view of the overall industry.
A dealership of the future. The store is part of a small local privately-owned group, perhaps five points
carrying seven brands, with very little inter-OEM dualling, if any. This store, located a few miles out of
town, in particular has three branches: a small demonstrator outlet downtown, and a satellite service
facility in the outer suburbs… which it shares with another brand owned by the same group. The store
moves 1,500 new and 1,000 used units annually, but is no larger in acreage or square footage than it
was in 2010, as it is turning inventory very rapidly. This is because, even though its true BTO share of
sales is not even 20%, swaps with other dealers -- and in one case with an OEM inventory pool -- total
some 40% more. Additionally, it has a low-cost off-site vehicle storage and PDI facility nearby, also
shared with other stores in the group. Service absorption is about 120%, thanks to the satellite facility
(which is AMM20), an express-service lane onsite, available pickup and dropoff service, extended shop
hours, a lavish waiting area, and even limited driveway service calls. The showroom (finally) has a full-
sized holographic display system, so that not every model has to be physically parked in the showroom.
The showroom is a generic box with both physical and projected graphics (indoors and out) used to vary
imagery and display at low cost. This allows frequent brand-image updating, while allowing the physical
facility to go well over a decade without significant physical modifications. There are no administrative
personnel, collision-repair, PDI, or other such functions onsite, freeing up space for sales and service.
These functions reside in one low-real-estate-cost facility shared by all the stores in the group.
A caveat: obviously not every, nor even most, dealerships will look like this in 2025. There will always be
a need for small single-point stores in remote rural areas, lavish flagship stores in high-prestige cities
and suburbs, suburban “old school” ultra-high-volume spots, stripped-down bare-bones stores for value
brands, etc. But our snapshot represents the general direction we expect the typical store to go.
The dealership industry of the future. Now let’s step back and look at what this forecast means for the
industry across the continent. The exhibit below sums it up, for the US version. The symbol ► indicates
where we are showing a recommendation, rather than a forecast.
20
“All Makes and Models”
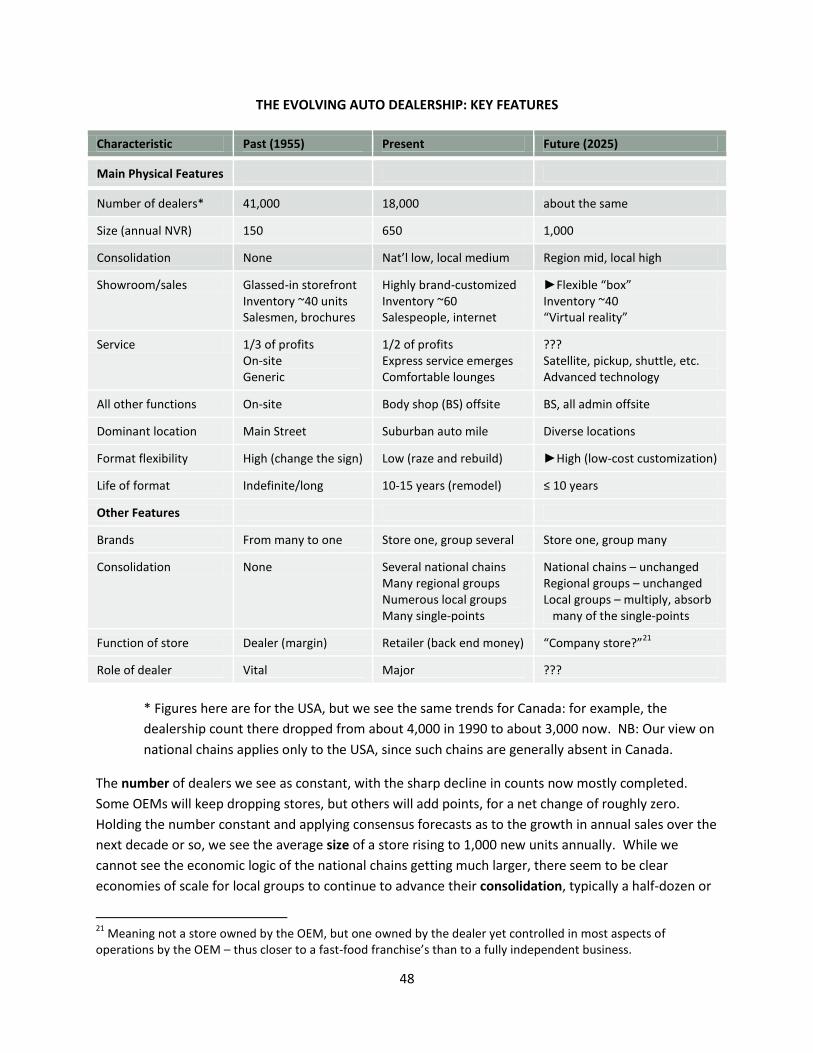
48
THE EVOLVING AUTO DEALERSHIP: KEY FEATURES
Characteristic Past (1955) Present Future (2025)
Main Physical Features
Number of dealers* 41,000 18,000 about the same
Size (annual NVR) 150 650 1,000
Consolidation None Nat’l low, local medium Region mid, local high
Showroom/sales Glassed-in storefront Inventory ~40 units Salesmen, brochures
Highly brand-customized Inventory ~60 Salespeople, internet
►Flexible “box” Inventory ~40 “Virtual reality”
Service 1/3 of profits On-site Generic
1/2 of profits Express service emerges Comfortable lounges
??? Satellite, pickup, shuttle, etc. Advanced technology
All other functions On-site Body shop (BS) offsite BS, all admin offsite
Dominant location Main Street Suburban auto mile Diverse locations
Format flexibility High (change the sign) Low (raze and rebuild) ►High (low-cost customization)
Life of format Indefinite/long 10-15 years (remodel) ≤ 10 years
Other Features
Brands From many to one Store one, group several Store one, group many
Consolidation None Several national chains Many regional groups Numerous local groups Many single-points
National chains – unchanged Regional groups – unchanged Local groups – multiply, absorb many of the single-points
Function of store Dealer (margin) Retailer (back end money) “Company store?”21
Role of dealer Vital Major ???
* Figures here are for the USA, but we see the same trends for Canada: for example, the
dealership count there dropped from about 4,000 in 1990 to about 3,000 now. NB: Our view on
national chains applies only to the USA, since such chains are generally absent in Canada.
The number of dealers we see as constant, with the sharp decline in counts now mostly completed.
Some OEMs will keep dropping stores, but others will add points, for a net change of roughly zero.
Holding the number constant and applying consensus forecasts as to the growth in annual sales over the
next decade or so, we see the average size of a store rising to 1,000 new units annually. While we
cannot see the economic logic of the national chains getting much larger, there seem to be clear
economies of scale for local groups to continue to advance their consolidation, typically a half-dozen or
21
Meaning not a store owned by the OEM, but one owned by the dealer yet controlled in most aspects of operations by the OEM – thus closer to a fast-food franchise’s than to a fully independent business.
49
so stores in a minor metro area: concentrated enough to be manageable, and big enough to be able to
share facilities and staff to bring down costs. While volumes per store will grow, we see advanced
inventory management techniques (e.g. dealer swaps, inventory-management software) as enabling
turns to accelerate, so that acreage need not increase. The showroom itself should (finally) be enabled
by very-high-resolution virtual reality displays, allowing dealers to not have to have every model
physically inside at all times, thus shrinking footage. And we strongly recommend that OEMs follow our
suggestion to allow brand customization in the sales area through static (graphics and photos) and
dynamic (imaging, projections, lighting) displays, which can be changed frequently and at low cost,
rather than continuing on the current path of ripping up and redoing tiles, carpets, fixtures, furniture,
and architecture (walls, balconies, facades, entries, portals) to update brand support, which is both
extremely disruptive to business and needlessly expensive. As for the service area, we have no one
specific forecast, but rather a range of options that dealers can tailor to their local clientele, in order to
capture or recapture service volume that otherwise will be lost. We see these options including satellite
service (customer-facing or not), pickup and dropoff services, increased hours up to 24/7, centralized
shuttle runs, on-lot touchscreen displays for unattended service dropoff, service facilities shared with
other brands, driveway service (both own-brand and AMM), etc., etc.22 The point is we need much
greater flexibility in meeting the needs of the service market, beyond building ever-larger onsite service
facilities on very expensive land. If the average dealer cannot in this way claw back service volume,
there is no way to financially support the investments in the brand that OEMs are seeking from dealers,
as we cannot expect any help from (ever-shrinking) new-car sales margins. All other functions move
offsite, as the typical body shop already has: it is a matter of matching a function’s economic value to
the appropriate real estate cost, and modern technology allows the unbundling of these functions. In
terms of location, changing consumer needs and wants, and the revival of city centers, as well as retail
innovations generally, imply a greater diversity of dealer locations than the past default template of
“follow ‘em to the suburbs.” All of this adds up to a forecast of greater creativity in physical format
design and layout, offering greater flexibility to meet customer and commercial needs. And in turn we
22
Perhaps proving the saying that there is nothing truly new under the sun, see this photo of the Harley-Davidson Servi-Car, sold in the 1930s to enable garages and dealers to provide service in, or even retrieve cars from, their customers’ driveways. (Photo source: The American Car Dealership, by Robert Genat, Motorbooks Classic, 2004).
50
strongly recommend that OEMs move off the path of ever-greater standardization to one of their own
greater flexibility in encouraging these new ideas. Otherwise we are afraid that OEMs will impose
needlessly costly uniformity just as markets are moving in the other direction, to low-cost creativity and
diversity.
Beyond our forecast for the physical aspects of the dealership industry of the future, the exhibit shows a
few other predictions. We do not see multi-branding (i.e. cars from different OEMs) taking hold in the
USA in this timeframe. Nor do we see the national chains gaining much more market share – but we do
see that local groups’ share of the market may very well soar.
More fundamentally, however, we are worried about the role of the dealer him- or herself in this future.
In the 1950s the dealer was truly a “dealer:” making money by buying low at wholesale and selling high
at retail, living and dying by the margin on the car. Fifty years later the dealer is now really a “retailer:”
living and dying not on margin, but on the numerous bonuses, allocations, spiffs, incentives, holdbacks,
subventions, and supplementary payments awarded by the factory, for compliance with dozens of
metrics, from CSI scores to sales targets to image compliance to tech training and IT implementation.
The degrees of freedom open to the dealer – who may not even be allowed now to have the family
name on the store – have been and are shrinking. If dealers cannot demonstrate to OEMs their value in
customizing people, processes, and store formats to local market needs, by 2025 the dealer may be a
company store in all but name: funded by the family’s capital, but operated entirely according to an
OEM’s rulebook, much in the same way that a fast-food franchisee can hardly take a step without
consulting the corporate three-ring binder. Dealers will still exist in this future, protected by years of
tradition, customer loyalty, and regulatory and legislative defenses – but they may not like this future
very much, as they become less like entrepreneurs and more like corporate managers.
Dealership of the Future: Conclusions and Recommendations
This concludes our forecast as to the evolution of the North American car dealership. It contains input
from a wide variety of informed sources, but we’d always like to have more input, so we ask our readers
to chip in with their own views. If we were to summarize briefly everything we’ve said so far, and then
draw some recommendations for action from them, we could lay it out in three categories: what might
not change, what might change, and what should change.
What Might Not Change. As we’ve pointed out, past predictions about the dealership of the future
have not been very accurate, which should make us cautious about forecasting massive future changes
ourselves. We all recall past years when, in turn, people projected that publicly-traded chains of
dealerships would sweep away privately-held stores; or that internet services would cut out the dealer;
or that the car companies would forward-integrate into owning much of the retail network themselves.
None of those things came to pass in any significant way in North America. Therefore we realized we
had to be cautious about predicting radical changes for the dealership of the future, despite endless
chatter in the press and the blogosphere about how the current system was “broken” or “dysfunctional.
Most importantly, we found NO evidence that the basic dealership system, as it is currently set up,
would be going away any time soon. It is here to stay.
51
In trying to determine What Might Change, we looked at the history of actual change in our own
industry, as well as at trends in the broader world of retailing generally. We concluded that the
dealership of 2025 is likely to be – relative to today’s store – larger in sales volume, but not in size, due
to greater efficiency in turning inventory; more often part of a local or regional chain of stores; more
creative in addressing the challenge of growing service volume and profits; and more disaggregated in
that more and more support functions will be moved offsite to cheaper real estate.
And that takes us to What Should Change. The various developments we have discussed can come
about in a costly and painful way, or we can all, dealers and factories, work together to make the
transition cost-effective and low-stress. Two things are necessary for this: Creativity and Flexibility.
By Creativity we mean that the auto retailing industry is full of ideas as to how to best meet the
challenges of the future, but often dealers are overly cautious in proposing them, and then OEMs
excessively conservative in blocking them. Let’s just take one example, what can be called the service
challenge. We have about 19,000 dealers out there in North America, serving a fleet of over one quarter
of a billion vehicles. Well, the independent aftermarket outnumbers us by ten to one or better, with
another 250,000 locations, or more. And yet customers tell us repeatedly that the single biggest barrier
to their doing more service business with us is that our locations are not convenient – that it is too far to
drive. And it’s only going to get worse, as by 2025 there may be 300,000,000 vehicles on the road… and
still just 19,000 of us. We think dealers and OEMs need to work together to solve this challenge. There
are lots of great experiments out there, from satellite service (both customer-facing and not), shared
service facilities, pick-up and drop-off shuttles, driveway retrieval, and more. But too often we find
these creative solutions blocked by any number of fears, including those involving territory
encroachment, management challenges, worries about liability in driving customer cars around, etc.,
etc. We encourage both dealers and OEMs to be more creative in both coming up with solutions here,
and in approving their implementation.
If Creativity relates to what we do, Flexibility relates to how we do it, or put another way, how much it
costs. We understand the OEM’s preference for rigid facility standards: for one thing, they are easier to
apply than case-by-case judgment calls. But costs have gone out of control, and a big part of the
problem is that we seem to be designing facilities as if we wanted them to be ridiculously inflexible.
Look at a regular retail store, handling clothing or computers. Typically it is generic box filled with some
low-cost fixtures. On Friday it might close as a “nature theme” shop, and by changing some display
cases, lighting, and a few wall graphics, open on Monday as “industrial chic.” But for us, for the typical
dealership, such a change usually means tearing down a wall, ripping out a massive reception desk, and
jackhammering out the floor tile. If OEMs want to keep up with changing customer tastes by regularly
updating the brand’s look, we have to find less expensive ways to do this. Fifty years ago a dealership
could change its identity by swapping out a sign and putting on some paint: now it is “raze and rebuild,”
tearing the store down and starting again. This practice generates enormous cost for no clear customer
benefit that we’ve been able to detect. Other retailers are embracing flexibility: your local Starbuck’s
manager probably picked out the furniture herself, and Apple store facades vary enormously from place
52
to place. We think it is time for automotive OEMs to catch up with the times, and work with us to build
stores that are modern, attractive, and supportive of brand image – without breaking the bank. 23
In summary, dealers and OEMs together can come up with the creative facility solutions needed to both
keep up with changing customer needs and evolving OEM strategies; and OEMs can demonstrate
greater flexibility in helping dealers implement those strategies efficiently and at low cost. Otherwise
we may find the North American auto retailing industry landscape littered with more and more empty,
overbuilt, and unsustainable buildings, reminiscent of the half-empty shopping malls that now litter our
landscape. This will be to the benefit of no one: neither the OEMs, the dealers, or the customers.
V. Conclusion We’ve covered a lot of ground in this report. We learned that the issue of facility investment is still a
painful one for most North American car dealers, though the level of contention has probably eased
somewhat over the past year. We tried a second time to estimate the return on investment in facilities
(as encouraged by factory image programs), and both reconfirmed our Phase 1 findings (e.g. that
expansion tended to pay off, that modernization only sometimes did, and that standardization never
did), and built on them with more detail and insight. And finally, we tried to project what the physical
dealership facility of 2025 might look like, so that we built today stores that would still be valuable
tomorrow – and urged dealers to be creative in coming up with new facility concepts, and OEMs to be
flexible in allowing such concepts to be tried, so that we could avoid building costly and short-lived
“white elephants,” to no one’s benefit.
It has been a fascinating set of topics to cover, and while investigating them we were thrilled to meet
and speak with so many industry participants, from architects to appraisers and of course to the dealers
themselves, who are what makes the whole North American car distribution system actually work. We
didn’t find a magic formula or a silver bullet, but we hope we did shed some light on the complex
problems these entrepreneurial men and women face, in order to help them spend their hard-earned
investment dollars on their stores in the most efficient and effective way possible.
23
And indeed automotive firms are starting to experiment with flexible but compelling and innovative brand communications: see Appendix B for photos of what can be done with exterior video projections, just as one example.
53
Appendix A: Dealership of the Future Interview Extracts Organized by forecast category; note that some comments could fit under more than one heading.
Number of Stores
“We see a decline in dealer numbers, in the thousands, overwhelmingly small rural dealers. This is
because these stores won't or can't afford to add the technologies that will be needed. Who will
provide service in remote rural areas? Dealer groups that specialize in rural areas will take are of this:
some exist already. E.g. a dealer in Fargo buys out dealers in small surrounding towns and converts
them to service-only points.”
Size of Stores
“With less flexibility to vary margin, one cannot survive on selling a few cars, a few of which will
generate high profits: we have to make a small amount on every one of a high volume. This trend is
further enhanced by pressure (e.g. from state AGs24) on F&I profits. As a result, dealers will be fewer
and larger, within limits. But larger in terms of pushing more volume through the same size of store, not
in terms of building larger facilities. Technology helps by offloading a lot of the sale to online.”
“A very key challenge is what to do with small rural stores. These carry less brand weight, tend to have
captive markets, tend to have little competition, tend to be solid Detroit 3 markets, and tend to have
customers who do not demand major-market bells and whistles (e.g. Wi-Fi). Forcing them out of
business via demands to meet higher metro standards may represent OEMs’ shooting their feet off.
There needs to be a workable small rural format solution.”
Consolidation
“As for the projected trend of smaller stores with minimal inventory, this is difficult. Best if one owner
owns all the small stores in an area, for fluid access to all of their inventory (instead of having to swap
for or buy inventory from other principals). And customers still on balance prefer more choices at their
fingertips. CarMax seems to make it work.”
"The future is for branded local groups like ours. A national chain of dealerships doesn’t do much for
the consumer, since the consumer shops for cars locally. But in a local geographic region I can get both
demand efficiencies (by marketing, e.g. my group overall) and supply efficiencies (e.g. shared service
bays, back office, shuttle service… we have one used-car manager for the whole group)."
“As cars get better they commoditize and that means brand loyalty ebbs and that means customers will
want multi-branded dealers or dealer groups.”
Location25
“It is ‘The Revenge of Geography’ in the Internet age! Originally people would not travel far for a car
because they could not see prices or inventories at dealers far afield. Then the Internet arrived and they
24
Attorneys General 25
Note that location strategy was not a major focus of our work: we looked mostly at changing store formats, not on changing locations. But location has a big impact on format (expensive real estate = smaller store, everything else being equal), and so some location comments are included.
54
COULD see prices and inventories. So you would think they would travel further, but what happened
instead is the Internet narrowed all the price bands. So now there is no gain to travelling, and we revert
to local shopping again. Thus groups like ours differentiate now on something other than price. People
just like they used to buy where they live and work."
The Front End: Sales (both showroom and inventory)
“The store NEVER goes away (in favor of online purchase): too much regulation, customer desire (the
furniture store analogy), deal complexity… and with electronic gizmos we do more training than ever
before….”
“OEMs may need to develop regional inventory depots to quickly ship cars to small stores, giving them
virtual inventories as deep as the bigger urban and suburban stores.”
“We’ll see more open plan generally: showroom waiting room and service area all blend together. And
no one really wants to spend time here, so make the waiting area comfortable and efficient but no more
than that. Will we just become delivery centers in the future? Maybe. I sure hope so, I could get rid of
large numbers of staff!"
“I see dispersed sales points, lower inventory levels, service off in low-rent locations, etc. It may take a
Chinese or Indian new entrant to start the ball really rolling. Body shops have already moved out, we
can do it again (they have to be big to turn a good profit, so you can have good division of labor, but you
can't afford to give them the square feet they need on an expensive lot positioned for car sales). The
same will happen with service bays.”
“Think through showroom expansions: I LIKE a crowded showroom, it gets people’s pulses going, and
makes them more eager to buy. A big empty showroom can be intimidating, and also suggest that the
brand is not popular.”
"The big trend in showroom design is for more media, video, interactive displays. At some point
allowing customer to visualize the desired car thoroughly, and then order it. This should allow reduced
on-lot inventory. Eventually. It has been predicted for years, has not come about. Yet.”
“I think all dealers must get ready for a more BTO environment, even if they cannot force the pace. This
means touch screens and media devices allowing for exploring configurations, etc.”
“Sure, I hear about this interactive display stuff, but I’ve got several touchscreen kiosks in my store, and I
don’t think even a CSI forensics team could find a single fingerprint on any of them!”
“We can’t move 100% online due to liability issues, regulations, the need for a properly instructional
delivery process, etc. All back office operations can move offsite or to some other spot on the campus.”
“As for the projected trend of smaller stores with minimal inventory, this is difficult. Best if one owner
owns all the small stores in an area, for fluid access to all of their inventory (instead of having to swap
for or buy inventory from other principals). And customers still on balance prefer more choices at their
fingertips. CarMax seems to make it work.”
55
“Showroom size should be more driven by local weather than anything else.”
"Ten percent of our customers (and we have older people who are not necessarily adept with
technology) essentially close the deal before they come in. But they still test drive, play with the knobs,
show us their trade, etc. PURE online purchasing is many years away, but if everything goes smoothly,
we can do it all in 45 minutes."
“Large expensive stores will become stranded assets as internet shopping reduces dealerships to
"fulfillment centers." This is a misallocation of capital. Only service and used cars really need physical
facilities; new cars and much back office do not.”
The Back End: Service
“If we can't split service from sales, can we split sales from service? As customers see and like more
"pop up" or flexible shopping experiences… food trucks… pop-up shops… online… store-in-store… can
dealers have more of these remote little selling (or marketing) spots?”
“The showroom becomes less important as activity shifts online. Might even have home delivery of new
car. Yet service offers more customer contact points and more room for differentiation. Service
becomes more important. Prepaid/free maintenance may be necessary for all. Split sales and service,
and allow small sales outposts. Satellite service for light work and central service facility (shared) for
heavy stuff. Pickup/dropoff you may have to do, but the liability is huge!”
“Quick Lane or any satellite service facility will only work when all processes are reoriented to support it,
otherwise there will be management issues, rivalry between main store and satellite, etc.”
"Skip the putting greens and the dog play area, which make the wait more pleasant: reduce the wait!"
“There is a shift of focus also from the front/sales end of the store to the back/service end, which
makes sense because we are at diminishing returns in the showroom -- but not yet in service. Also there
are more degrees of freedom in the service area, as well as more money. “
“There is lots of buzz and interest as regards satellite service; the big challenge so far is managing them:
dealers are already stretched to manage the one store.”
“You say it is hard to manage satellite service? Try getting cars in and out of a 70-bay single operation!”
"We'll need more satellite service sooner or later: customers just won't drive that far, and if we don't go
to them they will go to the independents."
“Service and sales will split apart, whenever real estate prices force it.”
"With quality improving warranty plummets and so we must get customer pay. We'll throw in more
free service, just to build loyalty: tires, oil. People and processes will keep them, once we snag 'em."
“We’re in a 3-stage evolution as far as service areas go: we went from unpleasant to wait in (before
1990 or so), to very pleasant to wait in (by 2000 or so), to no waiting at all (pickup and dropoff, loaners,
56
etc.), today. To increase service volumes we don’t need satellite service: we can do it with
pickup/dropoff, loaners, shuttle vans. Note that there is a difference between customer-facing service
facilities and non-customer-facing ones: if we can’t do one we can do the other.”
"How about an EZ-Pass for service? Customer drives in and *bingo* she and her car are logged in."
“Our area is mature and growth is in other parts of town: we’d love to do a satellite service point there,
but OEMs don’t like mixed-brand ones (even if their customers ask for it), and I can’t afford a single-
brand place. Also, OEMs like sales and service bundled because they always want the chance to sell a
new car, even to a service customer. And other dealers could or would object.”
The Back End: Other Functions
"I've already centralized all back office in one location. Minimal staff elsewhere. The future is giving a
whole town to one operator, a la Saturn, who can get scale economies by sharing back office, ditto by
sharing inventory, and because he is the only game in town no one will protest his satellites. In the past
OEMs did not like this because they worried the dealer would trade volume for margin: but nowadays
no one gets margin anyway!”
“In service computers replace manual libraries and record file cabinets. Parts department shrinks with
frequent deliveries. And high-density parts storage. Go vertical in dealers to save real estate costs;
rooftop parking. Offsite service and more, such as collision repair, administration.”
“If pickup and delivery of customers (new/used cars, service calls) climbs, we can have smaller waiting
areas, etc.”
“We’re ultra-centralized: there is a head office which has ALL the accountants and general office staff,
freeing up space in the stores and reducing their footprint. F&I remains in each store. We have a
central used-car recon center for all the stores. We run a centralized shuttle service. As service work
declines, we pulled back subbed-out detailing and undercoating, etc., and do it in the freed-up stalls.”
“Move more off-site, only sell cars on the costly (and limited) real estate we can get. My body shop is
centralized, my prep shop also, my car storage area ditto. All these areas serve all my stores, letting
each of them be smaller. We WILL need a showroom: pure online unlikely, with such an expensive
purchase, at least for some majority of customers (a minority may go this way): books could be 100%
online since they do not vary in features, color, size… but cars are more like clothes, where not 100% of
people are happy with online – and of course returning an item is easier if it is clothes… All
administration is offsite. Easiest to do this with a group you own, but why could not several dealers
cooperate to do this? Most OEMs support this kind of offsite move. Satellite service they are less happy
with: harder to maintain quality control, objections from other dealers, no chance to see a new car.”
Flexibility
"There is no consensus as to the future best design, which tells me we need flexible formats that can
handle anything. This includes sizing better: build small with easy expansion options, rather than build
too large and not fill the store."
57
“There are more and more electronics in a store, more wiring, more IT, more iPads, more screens and
displays, more high-tech wiring: dealers should make sure this stuff is all flexible so they can reconfigure
easily, up the wattage, etc. Also note that the panels we use for walls now are infinitely easier to
reconfigure and move, versus traditional cinder block.”
"We have built our last gigantic concrete box . We cannot afford to tie so much money up in fixed
assets. We have to make this capital more flexible: reconfigurable at low cost, more productive (in
service at least) via added shifts, etc."
“Always build a generic simple box, that supports process flows, then add the OEM’s bells and whistles.
Avoid building the OEM’s desires into inflexible and expensive-to-change concrete, etc. (It is also easier
to plumb and re-plumb and wire and re-wire a box.)”
"My view is the best blend is a standardized exterior and a locally-variable interior."
"I am afraid we will see more raze-and-rebuild, as OEMs more rapidly update images. We need some
way to flexibly update the store, instead of tearing it down all the time."
“The variable side is a tollbooth; the fixed side is a destination… architecture must flex to meet both
needs. In variable ops, the showroom, we are not sure what the customer wants; in fixed ops we know
what he wants, but we are not sure we can afford it. Lavish waiting areas, pickup and dropoff, etc.”
"We've moved from generic stores that are totally unresponsive to local needs and preferences, and to
OEM brand image as well… to stores that are highly responsive to OEM brand needs but are still
unresponsive to local requirements…. now it is time to respond to local requirements, or the
municipalities will do it for us!"
“If in the future the dealership image will have to be updated more frequently, as retailers of other
goods do, why not make it cheap and easy to do by using easily-updated digital displays and static
graphics and reprogrammable lighting, etc.? "The building can become the ad," especially if one can
project a large advertisement right on the side wall. With new technology this will work in daylight as
well as at night. Build a simpler box and dress it up with displays.”
Miscellaneous
"It will take a long time, but sooner or later, the paper moves 100% to a pad or a screen."
"Part of the reason for the upgrading is that customers have higher expectations now, too. Enough
exposure to HGTV and Architectural Digest and innovative retail store design, and customers come to
expect that from dealers, too."
“Many people think mobile will have a huge impact – but no one knows what it will be!”
“Big schism: DEALERS want facilities to support PROCESSES; OEMs want facilities to support BRANDS.”
“As to social media and all communication channels: mostly now this is all about reputation
management. The underlying sales process does not change, the matching of people to cars, the

58
searching of inventory, the negotiation of price, etc. But the way the customer hears about me shifts
constantly, from newspapers and billboards and radio and TV to internet and Yelp and Twitter and
Facebook. Dealers have to manage all these things but I am not sure they are "game changers." People
have a herd mentality where they all go the same way at once (e.g. "Gotta be on Facebook"): dealers
need to keep pace, but you do not need to reformulate your business model in pursuit of this stuff. “
“Facilities will become more important and thus more expensive. Upgrades occurring more frequently.
But I also see new margins shrinking and service volume falling, so something has to give. But what?”
“The future is indeed a store that is run as a company store and funded as a local franchise. We will all
become Wendy’s.”
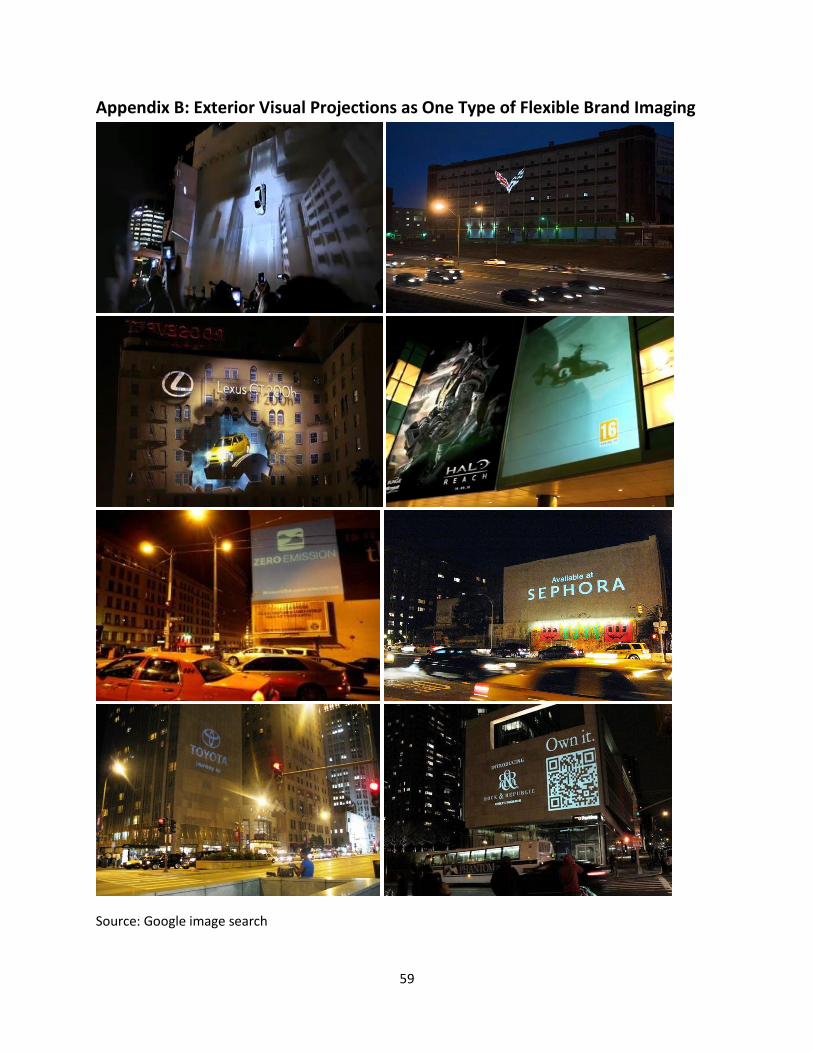
59
Appendix B: Exterior Visual Projections as One Type of Flexible Brand Imaging
Source: Google image search