facts & figures - edf.fr · 11 edf group’s major challenges a state-owned listed company...
TRANSCRIPT

FACTS
& FIGURES
FACTS
& FIGURES

2
Disclaimer This presentation does not constitute an offer to sell securities in the United States or any other jurisdiction.
No reliance should be placed on the accuracy, completeness or correctness of the information or opinions contained in this presentation, and none of EDF representatives shall bear any liability for any loss arising from any use of this presentation or its contents.
The present document may contain forward-looking statements and targets concerning the Group’s strategy, financial position or results. EDF considers that these forward-looking statements and targets are based on reasonable assumptions as of the present document publication, which can be however inaccurate and are subject to numerous risks and uncertainties. There is no assurance that expected events will occur and that expected results will actually be achieved. Important factors that could cause actual results, performance or achievements of the Group to differ materially from those contemplated in this document include in particular the successful implementation of EDF strategic, financial and operational initiatives based on its current business model as an integrated operator, changes in the competitive and regulatory framework of the energy markets, as well as risk and uncertainties relating to the Group’s activities, its international scope, the climatic environment, the volatility of raw materials prices and currency exchange rates, technological changes, and changes in the economy.
Detailed information regarding these uncertainties and potential risks are available in the reference document (Document de référence) of EDF filed with the Autorité des marchés financiers on 14 April 2015, which is available on the AMF's website at www.amf-france.org and on EDF’s website at www.edf.com.
EDF does not undertake nor does it have any obligation to update forward-looking information contained in this presentation to reflect any unexpected events or circumstances arising after the date of this presentation.

3
Before starting…
Reading suggestions To help you understand the terms used, you will find a glossary at the end of the document
Moreover, you will find throughout the document some “Did you know?” take-away boxes, which enlighten a specific concept
Many other information are available in our Reference Document, which you can download under:
http://shareholders-and-investors.edf.com/news-and-publications/publications/regulatory-information/reference-documents-45430.html
Navigation suggestions To help you navigate through this document, hypertext links have been incorporated
A click on the EDF logo will bring you back to the main table of contents (page 4)
Within the document, a “title bar” indicates in which part of the document you are in.
A click on the arrow with the name of the part will bring you back to the beginning of this part
WHAT’S NEW ?
A focus on the various capacity markets in France, the UK, Italy and Poland in the “EDF group” section
A focus on the Electranova funds in the “Research & Development” section
A focus, in the “EDF main businesses” section on commercial strategies of EDF in France, EDF Energy, Edison, EDF Luminus, EDF
Polska and Dalkia
A special focus on Dalkia’s activities in the “Energy Services” part
Networks Focus on transmissionOverview Innovations
Focus on distributionEDF main businesses

4
6
Market data
The EDF group
R&D supporting Group’s businesses
EDF main businesses
Group corporate responsibility approach
Finance
Table of contents
56
70
186
201
247
Appendices 265

FACTS
& FIGURES
FACTS
& FIGURES THE EDF GROUP

6
Countries profiles
A state-owned listed company
Overview of the EDF group
The EDF group
The EDF group EDF main businesses Finance Market data Appendices Corporate responsibility
7
20
31
R&D

7
Key success factors in 2014
Overview of the EDF group A state-owned listed company Countries profiles
(1) Published data of organic growth at constant scope and exchange rates
(2) At constant method
A diversified mix making the
Group the leader in low-carbon
energy generation
Net financial debt/EBITDA ratio at 2x at the end of 2014 vs. 2.1x at the end of 2013, in the lower range of the Group’s 2-2.5x target
Roadmap to a positive Cash Flow in 2018: maximisation of the gross margin, WCR improvement plan of €1.8bn over 2015-2018, control over net investments
Ongoing efforts to strengthen
the financial structure and
roadmap to a positive Cash
Flow after dividends in 2018
Stronger ongoing efforts to control Opex at +0.9%(1) in 2014 vs. +1.1%(1)(2)
in 2013
Control over net investments, stable at €12bn in 2014
Sustaining of a high level of skills
The industrial dimension at the
core of the strategy
Record level of low-carbon energies in the electricity generation mix and reduction of carbon emissions to 102g/kWh at Group level and 17g/kWh in mainland France, reaching the lowest carbon emission level of the last 8 years
3% rise in nuclear output in France to 415.9TWh, thanks to a better management of planned outages: average duration of the extension of planned outages cut by half between 2013 and 2014
The EDF group

8
Overview of the EDF group A state-owned listed company Countries profiles
EDF group 2014 key figures
(1) Net capacity: Group’s generation capacity on the basis of the consolidation accounting rules
(2) Consolidated data in accordance with IFRS accounting rules in effect in 2014 (CENG, SLOE Centrale and
ESTAG are treated as joint ventures and therefore consolidated through the equity method from 1 January 2014)
(3) Last information on 07/05/2015
Operational figures
Sales: €72.9bn
EBITDA: €17.3bn
Net income excluding non-recurring items: €4.9bn
Net financial debt: €34.2bn
Ratings(3): A+ negative (S&P) / A1 negative (Moody’s) / A+ negative (Fitch) / AA+ stable (JCR)
Vigeo: overall score of 58/100 (vs. 55/100 in 2013)
Robeco Sam: overall score of 79/100 (vs. 66/100 in 2013)
Carbon Disclosure Project: score of 98/100 – B (vs. 95/100 – B in 2013)
Financials
Extra-financial ratings
~38.5 million customers accounts worldwide
136.2GW(1) worldwide installed capacity, of which
72.9GW nuclear
35.0GW thermoelectric
28.3GW hydro and other new renewables
623.5TWh(2) generated worldwide, of which
~77% nuclear
~7% thermal excluding gas
~6% CCGT
~10% hydro and other new renewables
~158,000 employees, o/w ~39,000 in French distribution, ~41,500 in French generation and engineering and ~14,700 in EDF Energy
The EDF group

9
EDF global footprint
A state-owned listed company Countries profiles
USA: Constellation Energy Nuclear Group(1)
Brazil: Norte Fluminense
China:
• Figlec
• SZPC
• DSPC
France:
• EDF
• RTE
• ERDF
• Island Energy Systems
United Kingdom:
EDF Energy
Belgium:
• EDF Belgium
• EDF Luminus
Netherlands:
Sloe Centrale BV
Switzerland:
• Alpiq
Spain:
Elcogas
(1) 49.99% EDF and 50.01% Exelon, the latter owning the operational licenses of the plants owned by CENG
(2) In 2014, EDF strengthened its position on the energy services market with the acquisition of Dalkia’s French activities and
of Citelum
Other activities
Key countries: contribution to the
Group EBITDA in 2014
France
United Kingdom
Italy
Other international
71%
EDF Energies Nouvelles
EDF Trading 9%
11%
5%
4%
Energy Services(2)
Other
Overview of the EDF group The EDF group
Vietnam:
MECO Laos:
NTPC
Poland (main subsidiaries):
• EDF Polska
• Kogeneracja
Hungary:
• Be ZRt
• EDF Démasz ZRt
Austria:
ESTAG
Italy:
• Edison
• Fenice

10
Presence across the whole electricity value chain
A state-owned listed company Countries profiles
(1) Consolidated data
(2) RTE is consolidated under the equity method
Electric capacity(1) Transmission Distribution Supply (# of costumers
electricty and gas)
Networks
France (excl. Island
Energy Systems) EDF SA: 96.8GW
RTE(2) (100%):
more than 100,000km ERDF (100%): ~1.3mkm EDF SA: ~27.2m
United Kingdom EDF Energy: 14.4GW EDF Energy: ~5.9m
Italy Edison: 7.3GW
Fenice: 0.4GW Edison: ~1.2m
Belgium EDF Luminus: 1.95GW
EDF Belgium: 0.5GW EDF Luminus: ~1.7m
Other Other: 5.7GW (o/w Poland,
Hungary, Brazil) Démász (100%): 32,200km Démász: ~740,000
Other activities Other activities: 7.1GW
o/w EDF EN: 5.1GW Electricité de Strasbourg: 14,000km
Supporting activities
Trading: EDF Trading
Energy services: Dalkia, Fenice
Oth
er
inte
rnati
on
al
Overview of the EDF group The EDF group

11
EDF group’s major challenges
A state-owned listed company Countries profiles
Making the new nuclear strategy successful
Preserving the Group’s financial balance
Retaining customers
Playing a major role in the energy transition
Laying out a consistent and ambitious international strategy
Overview of the EDF group The EDF group

12
Major challenges: making the new nuclear strategy successful
A state-owned listed company Countries profiles
Commissioning EPRs currently under construction: □ Flamanville
□ Taishan
Finalising negotiations on Hinkley Point C
Reinforcing the Areva-EDF partnership
Consolidating and expand our partnerships in China
Optimising the range of reactors: □ EPR
□ New models
Overview of the EDF group The EDF group

13
Major challenges: preserving the Group’s financial balance
(1) Excluding Linky
A state-owned listed company Countries profiles
France: addressing the need for a tariff trajectory covering the Group’s costs □ Tariffs
□ Coverage of nuclear full cost (ARENH)
□ CSPE
Sticking with the Group’s efforts to control costs
Making more selective investment choices
Managing cash better
Ambition: positive cash flow after dividends(1) in 2018
Overview of the EDF group The EDF group

14
Major challenges: retaining clients
A state-owned listed company Countries profiles
In France: □ End of the yellow and green tariffs: being ready to respond to business and local government
customers
In Europe: □ Commercial expansion in the Group’s key countries:
the UK, Italy, Poland, Belgium
In energy services: □ Supplying our customers with a wider range of offers, thanks to Dalkia
□ Innovating in our service offers
Overview of the EDF group The EDF group

15
Major challenges: playing a major role in the energy transition
A state-owned listed company Countries profiles
In renewables □ Raising our market share by tapping into our technical skills
Locally □ Developing decentralised production, through Dalkia’s know-how
Putting the R&D at the service of innovation in the energy transition
Overview of the EDF group The EDF group

16
Major challenges: laying out a consistent and ambitious international strategy
A state-owned listed company Countries profiles
Setting up the new international division: □ Economic and strategic consistency
□ Selectivity
Capex aligned with the Group’s strategic challenges: □ Consolidating our positions in countries where we already have a big footprint
□ Strong development potential in emerging markets
Competitive edges: our engineering skills and our service offers
Overview of the EDF group The EDF group

17
A state-owned listed company Countries profiles
EDF since 1946
Development in France
International development
Structural changes in the EDF group
Nationalisation of the electricity and gas sectors
Creation of EDF as an EPIC by the Law of 8 April 1946
On 20 November 2004, EDF becomes a French SA
IPO in 2005 and creation of RTE to guarantee non-discriminatory access to the market
Opening of the French market, first for B2B
(2000 to 2004), then for B2C from 2007
onwards
Launch of the commercial-scale nuclear program
Acquisition of British Energy
Disposal of EnBW and of the UK networks
Buy-out of EDF Energies Nouvelles
Start of the international development, first in South
America, then in Europe with the UK (from 1998
onwards), Germany (2001) and Italy (2005)
1946 1963 1990 1999 2004 2005 2009 2010 2011 2012
Edison’s takeover
March 2014: acquisition
by EDF of Dalkia’s
activities in France
April 2014: delegation to Exelon of the
operational management of the nuclear
reactors owned by CENG
2014
Development of the French industrial base, including
hydro and nuclear facilities
Overview of the EDF group The EDF group

18
Remaining a benchmark employer (1/2)
A state-owned listed company Countries profiles
Being an industrial Group with a strong technological expertise, long-term activities and missions of general interest, EDF is keen to invest in a lasting way into the competencies and the performance of its staff
Men and woman play a key role in the Group’s performance: focus on training
A landmark investment to provide to all employees of the Group professionalization programs and in order to ensure the transmission of necessary skills for the industrial Group project: 85% of employees in the Group attended at least one training session in 2014 (average of 66h of training received per employee trained)
9% of the payroll was allocated to training (€685m)
Being a benchmark employer in terms of employee commitment and social performance
A pioneer Group-level agreement “Corporate Social Responsibility” (signed in 2004)
11 Group Corporate Responsibility commitments adopted in June 2013 o/w 3 are related to the
employer’s responsibility:
− Maintaining the professional excellence and teams’ performance through training and diversity promotion, with 2 objectives: a proportion of
women of 30% by 2015 in the future executive management category, and over 75% of Group employees receiving at least one training session
every year
− Strongly reducing industrial accidents among employees and subcontractors by halving the lost-time accident frequency rate within five years
− Refusing any violation of human rights, fraud or corruption in any of its subsidiaries or among suppliers
85% of the employees attended at least one training session during the year
Overview of the EDF group The EDF group

19
Remaining a benchmark employer (2/2)
A state-owned listed company Countries profiles
EDF remains the benchmark employer on technical profiles
– 6th place at the Universum engineer rating in 2015 and 1st place at the Universum Alumni rating in 2015
– 3rd place at the Trendence engineer rating in 2014
– 1st employer of the Randstad Awards 2015 (in the “building, energy and environment” sector) for the 6th consecutive year
Development of the employer brand’s international scope
Around 6,000 work-study trainees at Group level in 2014
Managing change smoothly and accountably
Development of managerial training by the Group’s Management Univestity (UGM)
– Broadening of the access to the e-learning platform: 20,186 employees entitled (o/w the 14,000 Group’s managers) and 13,000 training hours in 2014 (+31% vs. 2013)
– Training of 1,718 managers in 2014 through 45 courses. New training sessions have been developed with the Asia Pacific Unit and Edison
– Training of 250 directors and 400 Group’s talents in 2014
Internal opinion survey “My EDF”: 73% of employees answered for the third edition of 2014 (up sharply vs. 64.3% in 2013)
– 81% of employees trust in the Group’s future
– 85% of employees claim to be proud to work for their division within EDF
46%
25%
2%
9%
9%
9% EDF SA
ERDF
Edison
EDF Energy
Dalkia + Citelum
Other
158,161
employees
(1)
Having both a local footprint and an international profile
158,161 employees in the Group of which 41,579 women (26%)
Retirements that remain at a high level (around 3% in 2014), in particular in the maintenance and operation staff of the generation, engineering and distribution divisions
An adapted recruitment rate to address those challenges: in 2014, more than 10,000 people were recruited, almost half of which at EDF SA and ERDF
(1) EDF Trading, Électricité de Strasbourg, Tiru, EDF EN,
SOCODEI, CHAM, EDF PEI and other international
subsidiaries
In France, one-third of employees are in distribution and one-third in generation and engineering
Did you know?
Overview of the EDF group The EDF group

20
Impact on EDF governance of the executive order of 20 August 2014 on companies with public shareholders
Impact on Board membership
□ No longer any requirement to have an 18-member Board
□ Ratio of one third employee-elected representatives maintained
□ A representative of the French state chosen from among the civil servants
□ The French state’s option to nominate one or more directors (not necessarily civil servants) for approval by the shareholders at the General Meeting
Continued option for the French state to appoint a government commissioner
Five-year director terms are no longer mandatory
□ The Shareholders’ Meeting held on 21 November 2014 modified the Company’s articles of association and reduced the term of office of the Directors to 4 years. As an exception, the articles of association state that the first term of office of the Directors representing the employees that came into effect after the Shareholders’ Meeting held on 21 November 2014 shall be 5 years and that the term of office of the other appointed Directors shall expire at the end of the Shareholders’ Meeting called to approve the financial statements for the fiscal year ending 31 December 2018
Overview of the EDF group A state-owned listed company Countries profiles The EDF group

21
Composition of the Board of Directors and of its committees at the end of 2014
(1) These members meet the criteria of both expertise (article L. 823-19 of the French Commercial Code) and independence (code AFEP-MEDEF)
(2) This member meets the criteria of independence (code AFEP-MEDEF)
Board of Directors Audit Committee
Nuclear Commitments Monitoring
Committee Strategy Committee
Ethics Committee
Appointments and Remunerations
Committee
• Chaired by a Director appointed by the
Shareholders’ meeting
• 3 other Directors appointed by the
Shareholders’ meeting(1)
• 4 Directors appointed by the employees
• Chaired by an independent Director
appointed by the Shareholders’ Meeting(2)
• 1 other independent Director appointed by
the Shareholders’ Meeting
• 1 Representative of the French State
• 1 Director appointed by the employees
• Chaired by the Chairman and Chief
Executive Officer of the Group
• 3 other Directors appointed by the
Shareholders’ Meeting
• 1 Representative of the French State
• 4 Directors appointed by the employees
• 11 Directors appointed by the
Shareholders’ meeting (o/w 5 on
recommendation from the French State)
• 6 Directors elected by the employees
• 1 Representative of the French State
• 1/3 of independent Directors
• Chaired by an independent Director
appointed by the Shareholders’ Meeting
• 2 other Directors appointed by the
Shareholders’ Meeting
• 3 Directors appointed by the employees
• Chaired by an independent Director
appointed by the Shareholders’ Meeting(2)
• 2 other Directors appointed by the
Shareholders’ Meeting
• 2 Directors appointed by the employees
A state-owned listed company Countries profiles
The Shareholders’ Meeting held on 21 November 2014 modified the Company’s articles of association in order to implement the new provisions
of Order no. 2014-948 of 20 August 2014 relating to governance and trading in shares of state-owned companies and appointed the
composition of the Board of Directors.
Overview of the EDF group The EDF group

22
Board of Directors members as of 31 December 2014
A state-owned listed company Countries profiles
Jean-Bernard LEVY
Philippe CROUZET
Bruno LAFONT
Colette LEWINER
Laurence PARISOT
Philippe VARIN
Directors appointed or reappointed at the General Meeting of 21 November 2014
Olivier APPERT, appointed on recommendation from the French State
Bruno LECHEVIN, appointed on recommendation from the French State
Marie-Christine LEPETIT, appointed on recommendation from the French State
Gérard MAGNIN, appointed on recommendation from the French State
Christian MASSET, appointed on recommendation from the French State
Director representing the French State
Régis TURRINI
Directors elected by employees
Christine CHABAUTY
Jacky CHORIN
Marie-Hélène MEYLING
Jean-Paul RIGNAC
Christian TAXIL
Maxime VILLOTA
Overview of the EDF group The EDF group

23
EDF group Executive Committee (1/3)
A state-owned listed company Countries profiles Overview of the EDF group The EDF group
A graduate of the “Ecole Polytechnique” engineering school and Télécom Paris Tech, Jean-Bernard Lévy has been
appointed Chairman and CEO of EDF since November 2014. He began his career in 1979 with France Telecom. In
2002 he joined Vivendi as Chief Operating Officer, where he was appointed CEO from 2005 to June 2012. Before
joining EDF, he was, from December 2012 to November 2014, Chairman and Chief Executive Officer of Thales, a
leading electronics and systems industrial group. He is also officer of the “Légion d’honneur “and of the “Ordre
National du Mérite”.
Jean-Bernard LEVY Chairman and CEO
Antoine CAHUZAC Group Senior Executive
Vice President in charge of
Renewable Energies
A graduate of the “Ecole Polytechnique” engineering school and of the “Ecole de la Météorologie Nationale”, Antoine
Cahuzac is Group Executive Director in charge of Renewable Energies and member of the EDF Executive Committee
since 2015 and CEO of EDF Energies Nouvelles since 2012. After a first experience in EDF’s Studies and Research
department in 1982, he then held various positions at French Ministry of Transport, Crédit Commercial de France
(CCF), Vinci and HSBC. He is also member of the boards of EDF Luminus and EDF Trading.
Henri LAFONTAINE Group Senior Executive
Vice President in charge of
Customers, Services and
Regional Action
A graduate from Supélec, mathematical master degree, Henri Lafontaine joined EDF in 1983 where he occupied various positions at the Distribution Division in France as well as abroad as CEO of EDENOR. Since July 2013, he has been Group Senior Executive Vice President in charge of Supply, Optimization and Trading as well as Island Energy Systems. Since 2015 he has been Group Senior Executive Vice President in charge of Customers, Services and Regional Action. He supervises Dalkia, Tiru and Citelum. He is also in charge of the operational management of the Supply Division. Chairman and CEO of Citelum, he is also part of the Board of Directors of Dalkia, EDF Energy, Fenice, EDF International and EDF Fondation.
A graduate of the “Ecole Normale Supérieure de Sèvres”, the “Ecole Nationale d’Administration” (Condorcet
Promotion) and the “Institut d’Etudes Politiques” in Paris, she also holds an advanced teaching degree in Classics and
a Masters Degree in French Literature. She joined the Council of State in 1992 and became Counselor in 2007. In
December 2010, she was appointed Group Senior Executive Vice President for Human Resources, after having been
Corporate Secretary from June 2007 to December 2009 and General Counsel from January 2005 to December 2009.
She is also officer of the “Légion d’honneur” and of the “Ordre National du Mérite”.
Marianne LAIGNEAU Group Senior Executive
Vice President in charge of
Human Resources

24
EDF group Executive Committee (2/3)
A state-owned listed company Countries profiles Overview of the EDF group The EDF group
A graduate in Engineering (“Ecole Polytechnique”), in Economics (“ENSAE”) and in Political Science (“Institut d’Etudes
Politiques”), Bruno Lescoeur started his career at EDF in 1978 as responsible for tariffs issues. Appointed in 1993 Deputy
Finance Officer, then Chairman and CEO of London Electricity (now EDF Energy) in 1998, he became in 2002 EDF
Director of Generation and Engineering, then Member of the EDF’s Executive Committee, in charge of international and
later of gas. Since 2015 ,he has been appointed Group Senior Executive Vice President, in charge of Gas and Italy. He is
CEO of Edison since 2011 and supervises also Fenice and Dunkirk LNG. He is “Chevalier de la Legion d’Honneur”.
Bruno LESCOEUR Group Senior Executive
Vice President in charge of
Gas and Italy
A graduate of the Paris “Ecole des Mines”, Dominique Minière joined EDF in 1982 as a maintenance engineer, covering
positions of responsibility in the department for both the thermal and nuclear French fleets. He took part to the
commissioning of the Golfech nuclear power plant in France from 1986 to 1989 and the Daya-Bay nuclear power plant in
China, from 1993 to 1997. In 1999, he was Station Director for the Cattenom nuclear power plant. From 2002 to 2013, he
was Deputy Director and then Director of the Nuclear Production Division. In March 2013 he was appointed Deputy
Director of the Generation Division. Since January 2015 he has been Group Senior Executive Vice President in charge of
Nuclear and Thermal Power Plants Division. He is “Chevalier de la Legion d’Honneur”.
Dominique MINIERE Group Senior Executive
Vice President in charge of
Nuclear and Thermal
Power Plants Division
A graduate of ESSEC business school, Thomas Piquemal joined the EDF group in December 2009 as Group Senior
Executive Vice President, in charge of Finance. He is part of the Group's Executive Committee. He also supervises the
following departments: Purchases, Real Estate and IT. After holding several positions at the investment bank Lazard
Frères, he became in January 2009 Senior Executive Vice President in charge of Finance of Veolia Environment and
joined the Group’s Executive Committee. In 2008, Thomas Piquemal co-founded the “Académie Christophe Tiozzo”,
whose mission is to promote the social and professional integration of young people from deprived areas.
Thomas PIQUEMAL Group Senior Executive
Vice President in charge of
Finance
A graduate of the “Ecole Nationale Supérieure d’Hydraulique de Grenoble”, Vincent de Rivaz has held various positions
within the Group, notably in International Development, Hydro Power and Finance. Chairman and CEO of EDF Energy,
he has been supervisor of EDF’s activities in the United Kingdom since 2002. He is “Chevalier de la Legion d’Honneur”
and was made an honorary Commander of the British Empire (CBE) in 2012, by Her Majesty the Queen, for services to
the electricity and gas industries.
Vincent de RIVAZ Group Senior Executive,
Vice President, Chief
Executive Officer of EDF
Energy

25
EDF group Executive Committee (3/3)
A state-owned listed company Countries profiles Overview of the EDF group The EDF group
A graduate of the “Ecole Polytechnique” engineering school and “Télécom Paris”, Xavier Ursat joined EDF in 1991. After
holding various positions in the hydraulic engineering department, he became Director of the Southwest Production Unit
in Toulouse in 2007. Since June 2010 he has been Executive Vice Director and then Director of EDF’s Hydraulic
Production and Engineering Division. In 2015 he was appointed Group Senior Executive Vice President in charge of
New Nuclear Projects and Engineering. Member of the Board of Directors of ONEMA and the National Water
Committee, he is also Member of the World Water Council and member of the Board of Directors of EDF Energies
Nouvelles and Norte Fluminense. He also supervises SOFINEL.
Xavier URSAT Group Senior Executive
Vice President in charge of
New Nuclear Projects and
Engineering
A graduate of the “Ecole Normale Supérieure” and the “Ecole Nationale d‘Administration” and holder of an advanced
teaching degree in philosophy, Pierre Todorov began his career at the Council of State in 1986 before joining the
Lagardère group in 1990, where he held various executive level positions. From 1997 to 2008, he was the Accor Group’s
General Secretary. He then became partner at Hogan Lovells. In 2011 he joined PSA Peugeot Citroën, where he was the
General Secretary until September 2014. In 2015 he has been appointed Group Senior Executive Vice President and
Group General Secretary.
Pierre TODOROV Group Senior Executive
Vice President, Group
General Secretary
A graduate in Business Administration at Bocconi University (Milan), Simone Rossi started his career in Management
Consulting with KPMG Corporate Finance then joined McKinsey & Company, where he served various financial
institutions, industrial and energy clients. In 2004 he joined Edison SpA as Head of Strategy before becoming Head of
Controlling and IT in 2007. In November 2009 he moved to Constellation Energy Nuclear Group (CENG) as Chief
Financial Officer, then became CFO of EDF Energy in 2011. In March 2015, he joined EDF as Group Senior Executive
Vice Président in charge of the International Division. He primarily supervises EDF Polska, EDF Luminus, Bert, EDF
Demasz, EDF Inc., EDF Norte Fluminense, Meco, Nam Theun Power Co, Sloe Centrale and Alpiq.
Simone ROSSI Group Senior Executive
Vice President in charge of
the International Division
A graduate of the “Ecole Polytechnique” engineering school and the “Ecole Nationale Supérieure des Mines”, Philippe Torrion joined EDF in 1977. After holding various positions he was appointed as head of Corporate Strategy Division in 1999 then, 2 years later, he became responsible for EDF regional action and regional representative in Provence Alpes Côte d’Azur. In 2005, he was appointed CEO of EDF Trading, and in 2008 as head of Optimisation & Trading. Since 2015 he has been Group Senior Executive Vice President, in charge of Innovation, Strategy and Planning. He is also Chairman of EDF Trading.
Philippe TORRION Group Senior Executive
Vice President in charge of
Innovation, Strategy and
Planning

26
EDF: a listed company with the French State as major shareholder (1/2)
A state-owned listed company Countries profiles
Institutional and retail investors
13.7%
EDF employees
1.7%
French State
84.5%
By law, the French State must hold at least 70% of EDF’s share capital
Shareholders as of 31 December 2014 Share information as of 31/12/2014
Treasury shares
0.1%
Pursuant to article L 225-123 of the French Commercial Code, as amended by the Act no.
2014-384 of 29/03/2014, the so-called “Loi Florange”, all fully paid-up shares that have been
held in registered form for at least two years in the name of the same shareholder will
automatically entitle their holder to double voting right
These provisions will take effect on 3 April 2016. Until 2 April 2016, each shareholder is granted
a number of voting rights equivalent to the number of shares that he owns, following the
principle 1 share = 1 voting right
EDF’s Board of Directors decided not to propose to the General Meeting to amend the
Company’s articles of association so as to prevent the implementation of such double voting
right in accordance with article L. 225-123 of the French Commercial Code
Shares
Number of shares 1,860,008,468
Number of shares outstanding 1,858,326,287
Number of treasure shares 1,682,181
French security identification no.
(ISIN Code) FR0010242511
Main index CAC 40, Euro Stoxx Utilities, Dow Jones Euro
Stoxx 50, Euronext 100, FTSE Eurofirst
Listing Paris (Reuters: EDF.PA, Bloomberg: EDF FP)
Overview of the EDF group The EDF group

27
EDF: a listed company with the French State as major shareholder (2/2)
A state-owned listed company Countries profiles
(1) If need be upon recommendation from the State, in accordance with article 6 of the Order
(2) Appointed by the Minister of Economy amongst State agents, in accordance with article 4 of the Order
(3) Committee Of Sponsoring Organizations of the Treadway Commission
EDF has to abide by listed companies laws and specific standards of a public sector entity
Internal rules of its Board of Directors are similar to those of other listed companies
In accordance with the law no. 2011-103 of 27 January 2011 relative to the balanced representation of women and men on Boards of Directors and Supervisory Boards and to professional equality, the Board of Directors of EDF has 5 female members, i.e. a proportion of 27.8% of women on the Board as a whole. If Board members are accounted for in accordance with the AFEP-MEDEF code, that proportion is of 25% (excluding directors that represent the employees)
EDF adheres to the consolidated AFEP- MEDEF Code (revised in June 2013) which is the corporate governance code to which the company refers, in accordance with the French commercial code, subject to the specific laws and regulations applicable to EDF:
The Ethics Committee reports annually on the functioning of the Board of Directors and proposes areas for improvement. Furthermore, every 3 years, this evaluation is conducted by a specialist external consultant under the supervision of the ethics committee
The Board has created five dedicated committees to review and prepare certain projects before their submission to the Board of Directors
EDF is compliant with internal control procedures COSO(3)
EDF publishes an annual report on sustainable development
EDF as a state-owned company: legal and contractual framework
EDF as a listed company: corporate governance
EDF’s chairman and CEO is appointed by decree of the President of France on recommendation of the Board of Directors
In accordance with article 13 of the French Constitution, the chairman and CEO is appointed based on the candidates’ interviews and the opinion of the relevant permanent committees of the French National Assembly and Senate
Since the Shareholders’ Meeting of November 2014, the Board of Directors can be composed of 3 to 18 members, including members appointed by the Shareholders’ Meeting(1), a State representative(2), and one-third of employees’ representative elected in accordance with the provision of the Act of 26 July 1983
Any decision related to financials, investments, acquisitions and disposals, or related to the compensation of corporate officers must be approved by the French State (decree of 9 August 1953)
The company faces numerous financial controls by different authorities: State Inspector, Cour des Comptes (Government Audit Body), Finance Inspection
The French State Shareholdings Agency (APE) represents the State as a shareholder
The main contractual agreements are reviewed by the specific Market Commission whose role is to ensure the regularity of award conditions; its opinions are advisory
Overview of the EDF group The EDF group

28
EDF’s interaction with the French State Shareholding Agency (APE)
A state-owned listed company Countries profiles
The French State Shareholding Agency (APE) is a national department joined controlled by the Minister for Economy, Industry, and Digital and the Minister for Finance and Public accounts. It performs the function of the State shareholder by safeguarding the State’s patrimonial interests and the management of its investments. As such, it proposes and implements the decisions and policies of the French State with the related ministries
Its main objectives consist of:
Reviewing the appropriateness and financial health of the company
Representing the French Government as a shareholder
Facilitate relationship between the company and the French Government
As a result, the APE has expressed the following requirements to public sector enterprises. They have to:
Designate points of contact for the APE
Prepare a scorecard reporting for the APE on the main financial and qualitative data
Organize regular meetings, at least once a year to present the company strategy and financial performance
Inform the APE of any investment operation, or any specific audit mission
Overview of the EDF group The EDF group

29
Other regulatory bodies with an impact on EDF’s activities
A state-owned listed company Countries profiles
The ASN (French Nuclear Safety Authority) is in charge of controlling the safety of nuclear facilities in France. As such, the ASN mainly:
Carries out on-site regulatory inspections, randomly or scheduled (approx. 400 per year)
Controls the process for the 10-year safety reviews, a necessary step in extending the life of power plants
Prescribes post-Fukushima additional safety assessments
The CRE (French Energy Regulatory Commission) ensures the proper functioning of the electricity and gas markets for the end-customers in compliance with the energy policy. The regulation fields include:
Energy networks
Access to regulated networks and their operation and development
Independence of network operators
Energy markets
Monitor deals on energy and CO2 markets
Monitor retail markets (for instance, making proposals for regulated tariffs’ evolution)
Overview of the EDF group The EDF group

30
Other control procedures involving EDF
A state-owned listed company Countries profiles
EDF can be subject to State audit procedures, in particular through economic and financial evaluation assessment and through checks by the General Finance Inspection Office (Inspection Générale des Finances)
The company’s accounts and management, and where applicable, those of its directly-held majority subsidiaries are under the control of the “Cour des Comptes(1)”
Report on working hours in the Group’s main entities
Report on remuneration at EDF
Report on the renewal of hydropower concessions
Report on electricity distribution concessions
EDF also has to undergo the audit procedures performed by the Parliament
(1) Government Audit Body
Overview of the EDF group The EDF group

31
France – country profile
A state-owned listed company Countries profiles
EDF is active on the whole electricity value chain, from generation to sales and optimisation/trading. The activities can be split into:
Unregulated activities: generation and supply, optimisation, and trading
Regulated activities, with RTE(1) (transmission) and ERDF (distribution). EDF’s activities in Corsica and the French overseas departments and municipalities are managed by the Island Energy Services (SEI) and are regulated
EDF owns the largest nuclear fleet worldwide, o/w 58 operating plants in France
RTE(1) and ERDF are 100% subsidiaries of EDF but are operationally independent (legal unbundling) as requested by the EU legislation
EDF also plays a holding role through the 100% control of EDF International (which controls the greater part of EDF stakes in international subsidiaries) as well as interests in various companies, including:
EDEV (o/w EDF EN, LNG Dunkerque, Electricité de Strasbourg, Citelum, etc.)
Dalkia (energy services provider)
EDF Trading (market operator for the Group)
(1) RTE is consolidated under the equity method
Key points CAPACITY MW %
Nuclear 63,130 65
Hydro(2) 19,947 21
Fossil-fuel fired(3) 13,695 14
Total(4) 96,772 100
OUTPUT TWh %
Nuclear 415.9 90.4
Hydro(5) 37.5 8.1
Thermal6) 6.9 1.5
Total 460.4 100
Installed capacity and output in 2014
€bn EBITDA (2014)
Unregulated 7.9
Regulated 4.3
EBITDA 2014
(2) Excl. Corsica and the French overseas departments (i.e. 440MW in 2014)
(3) Excl. Corsica and the French overseas departments (i.e. 1,013MW in 2014
and including 2,490MW for units under guaranteed multi-year outage)
(4) Excl. wind capacities of 12MW
(5) Net pumped output, excluding Corsica and the French overseas departments
(i.e. 1.3TWh in 2014)
(6) Excl. Corsica and the overseas departments (i.e. 2.4TWh in 2014)
Overview of the EDF group The EDF group

32
Market development in France
A state-owned listed company Countries profiles
Implementation of the NOME law of 7 December 2010 to foster competition on the French market
French market deregulation chronology
1946 1999 2011 2012 2016 2014
1st January 2016:
end of yellow and
green regulated
tariffs
2013
Opening of the French market, first
for B2B (2000 to 2004), then for
B2C from 2007 onwards
2015
After the issuance of the decree
setting the cost based accounting
methodology, fixing of the ARENH
price following the CRE proposal, by
Ministerial order who will only have
an opposition right
28 October 2014: publication of the decree that defines the new tariff construction method by costs stacking (ARENH price, cost of supply of the complementary purchases, on wholesale power markets, electricity networks and commercial costs, plus a normal rate of return)
1st November 2014: average rise in tariffs by costs stacking of +2.3% in 2014
Nationalisation of the electricity and gas sector pursuant to the Law of 8 April 1946
For a transitory expected period of 3 years, the ARENH price is
set up by Ministerial order, after a CRE consultation
At 1st January 2012, ARENH price has been set at €42/MWh
1 July 2011: NOME law entered
into force guarantying to EDF’s
competitors, for a 15-year transitory
period, a regulated and limited access to
EDF’s historical nuclear generation
capacity (ARENH) to supply their end
customers located in France. The
available global energy volume cannot
exceed 100TWh(1) per year
19 July 2014: The CRE, the French Competition Authority and the CSE examined the draft decree specifying the evaluation method for the ARENH formula. It is currently under examination at the European Commission
(1) Excluding supply losses
Overview of the EDF group The EDF group

33
“Energy transition for green growth” bill
A state-owned listed company Countries profiles
After the failure of the joint representative committee ("Commission Mixte Paritaire") on 10 March, the National Assembly is discussing the text again. The text will then go to the Senate. Afterwards, the National Assembly will definitively adopt it (it has the last say). The Special Committee of the National Assembly completed its review on 16 April. It returned to the text adopted on the first reading of the National Assembly. It thus:
□ Reinstated the 2025 date, and eliminated the criteria (security of supply, price competitiveness, absence of the rise in GHGs) that the senators had introduced regarding the nuclear power decrease from 75% to 50% of electricity output
□ Returned to the cap on the total nuclear output capacity to 63.2GW (instead of the 64.85GW that the Senate had adopted)
□ Returned to the initial wording regarding the decrease in final energy consumption (-50% in 2050 compared to 2012, with an intermediate target of -20% in 2030)
The following objectives remain the same throughout the various readings:
□ Reduce GHG emissions by 40% vs. the 1990 level by 2030, and by 75% by 2050
□ Reduce primary energy consumption of fossil fuels by 30% by 2030, compared to 2012
□ Upgrade the entire housing stock to "Bâtiments Basse Consommation" (energy efficient building) standards by 2050
□ Increase the percentage of renewable energy in final consumption to 32% by 2030 (one target per technology, o/w 40% for electricity generation)
Adopted by Council of Ministers
Adopted by Senate, after review in public session
(10-19 February)
Bill presented to Council of Ministers
18 June 2014 30 July 2014 3 March 2015 14 October 2014
Adopted by National Assembly on first
reading
Mid-2015
Final adoption
Overview of the EDF group The EDF group

34
Energy Saving Certificates system (CEE) (1/2)
A state-owned listed company Countries profiles
Response to new requirements of the European Directive on energy efficiency
Included in the energy transition law
Implemented in
2006, reworked on
1 January 2015
A national obligation for the third period between 2015 and 2017 is set at 700TWhc
□ Doubled vs. the second period
Contribution to the energy renovation target of 500,000 homes per year from 2017, in addition to other financial incentives
Enhanced targets,
new ambitions
An obligation to achieve energy savings for customers imposed on energy suppliers, called “obligé” (obligated ones)
□ Electricity, gas, heating, refrigeration, domestic fuel and automotive fuel
Actively promote energy efficiency among their customers
□ Households, local authorities, business and professionals
Involved parties
One channel of energy efficiency policy in France
Overview of the EDF group The EDF group

35
Energy Savings Certificates (2/2)
A state-owned listed company Countries profiles
EDF is the main “obligé” since the start of the Energy Savings Certificates, accounting for one quarter of the total volume
To meet its obligation, EDF operates in several areas:
□ Financial incentives for home energy renovations
o 165,000 in ordinary housing in 2014, and a total of 1.6 million renovations since 2006
o 168,000 in low-income housing in 2014, and a total of almost 1 million renovations since 2006
□ Help in controlling energy consumption
o For its corporate and local government customers
o 14,300 initiatives to enhance energy performance in 2014, and a total of 51,500 initiatives since 2006
□ Funding of nationwide programs
o Habiter Mieux (ANAH national housing agency)
o Professional training (FEEBAT energy savings training centre)…
Overview of the EDF group The EDF group

36
Capacity mechanism in France
A state-owned listed company Countries profiles
Sources: Energy and Climate Department (DGEC) of the Ministry of the Environment, Sustainable Development and Energy; RTE
Defining rules on RTE’s proposal and based on the CRE’s opinion
Defining the secure supply criterion
Overseen by the French state
Definition of calculation methods
and identifying peaks
Ex-post calculation of each
supplier's obligations
Certification of capacities/inspections
Operated by RTE
Market surveillance
Review of the mechanism
and proposals for improvements
Monitored by CRE
Suppliers’
obligation
Capacity (generation, demand
side response)
Demand for capacity
certificates
Offer of capacity
certificates
Calculation of the obligation
amount
Capacity certification
Availability commitment
Verification of certificates held vs. peak
consumption
Control of effective capacity
availability
Capacity matches peak demand Security of supply safeguarded
Trade of
certificates
Capacity price
3 hours Loss of load expectation
standard
Overview of the EDF group The EDF group

37
Capacity mechanism in France/ calendar
Source: RTE
A state-owned listed company Countries profiles Overview of the EDF group The EDF group
Delivery year Year +1 Year - 4 Year - 1
Certification of existing capacities
Certification of new capacities (including demand-side response)
Adjustments
Forward capacity market
Implementation of peak demand reduction measures by suppliers in
their portfolios
Estimation of suppliers’ obligation amounts
RTE controls the effective
availability of the certified
capacity
(PP2)
RTE calculates the actual
obligation amount
Financial settlement
if the capacity held
is not sufficient
Settlement for certified
capacity that was unavailable
2015 - 2016 Implementation: estimation of supplier’s capacity obligation, capacity certification, CRE reports on forecast market prices and volumes
2017 First year of delivery (the mechanism works on a calendar-year basis)

38
United Kingdom – country profile A state-owned listed company Countries profiles
Main entity: EDF Energy, one of the UK’s largest energy companies and the largest producer of low-carbon electricity. Three business units:
1. Customers: managing energy supply and customer service activities for residential and business customers
2. Generation: 15 reactors on 8 nuclear power stations, ~9GW of capacity, 20% owned by Centrica; 2 coal and 1 gas power stations; wind farms
3. Nuclear New Build: in charge of EDF Energy’s new nuclear project in the UK
The market:
Strong willingness of the Government to decarbonise the economy (80% reduction in greenhouse gas emissions by 2050 vs. 1990) and electricity supply, while ensuring security of supply and affordability
Affordability of energy and the energy markets are under political scrutiny; investigation ongoing by the Competition and Markets Authority (for 18/24 months from June 2014)
Highly competitive residential and business supply markets with numerous suppliers and unregulated prices. Suppliers obliged to deliver Government policies incl. smart meters
Gas and coal currently play the largest roles in electricity generation; cross-party support for nuclear as part of the mix; new generation capacity needed during the next decade as significant amount of aging and environmentally restricted capacity likely to be retired
Electricity Market Reform implemented to incentivise investment in low-carbon generation (carbon floor price in force from April 2013; 1st capacity auction concluded in December 2014 for delivery in 2018-21; 1st Contracts for Difference auction in February 2015)
1) Based on March 2015 data from the Department of Energy & Climate Change on total final demand at customer terminal
2) Including Centrica’s 20% stake
3) Excluding 18.6% stake in Barking gas-fired plant (total capacity 1.5GW)
4) EDF Energy ownership (50% EDF ER)
Key points
Capacity
(GW)
Output
(TWh)
Nuclear(2) 8.9 56.3
Gas 1.3(3) 4.7
Coal 4.0 19.6
Renewables 0.17(4) 0.4
Total 14.4 81.0
2014 supply market share
€bn
EBITDA 2014 1.9
2014 key figures
Gas supply: ~28TWh
Electricity supply: ~51TWh ~17%(1)
~6%(1)
Overview of the EDF group The EDF group

39
Strategy for EDF group in the UK
A state-owned listed company Countries profiles
Major nuclear operator, leading the way in nuclear new build
Almost 9GW of existing nuclear capacity with an aim of life extension (an average expectation of 8 years beyond agreed lifetimes at acquisition for advanced gas-cooled reactors (AGRs); and 20 years for the Sizewell B pressurized water reactor (PWR) station)
Aim to build 2 EPR pressurised water reactors at Hinkley Point. Agreements with the UK Government on key terms for a Contract for Difference and for a guarantee for the project’s debt approved by the European Commission in October 2014. Plan for further 2 reactors at Sizewell
A diversified generation portfolio also covering other technologies
Two coal stations (Cottam and West Burton A, 2GW + 2GW)
West Burton B CCGT power plant (~1.3GW) commissioned in 2013
Significant investments in wind projects; our joint venture EDF Energy Renewables currently operates ~500MW of onshore wind farms and a 62MW offshore wind farm in the UK; development pipeline contains further onshore and offshore projects including Navitus Bay JV with Eneco (50% of 1GW)
Fairness and profitability in supply to residential and business customers
Re-gaining customer trust by delivering fair value, better service and simplicity
Ensuring affordability to customers through efficient operations and focus on cost efficiency related to the implementation of Government
policies (energy efficiency; smart meters)
Innovation
‐ Leveraging digital technologies
‐ New products and services: strong customer interest in “Blue” products where customers are alerted of cheaper offers on the market
Overview of the EDF group The EDF group

40
GB Capacity Market
A state-owned listed company Countries profiles
Design Area Key Design Features
Auction Process Centralised annual descending-clock auctions run by the Transmission System Operator (TSO) 1st auction completed in December 2014 for delivery in the 12-month period from Oct. 2018 – Sept. 2019
Capacity Requirement
Capacity needed to meet the Reliability Standard for GB (3 hours of Loss of Load Expectation)
Capacity Agreement Lead-Time
4 years for main auctions 1 year to allow for demand-side response (DSR) participation but also open to generation
Price Setting Mechanism
The clearing price is that at which offers for capacity equal the willingness of Government to pay Auction Price Cap (currently set at £201275/kW) Net cost of new entrant (CONE): £49/kW Price taker threshold: £25/kW
Eligibility
All plants not supported by a low carbon generation scheme (Contract for Difference, Renewables Obligation, small scale Feed-In Tariff, etc.) or a LT STOR (Long-Term Short-Term Operating Reserve) Contract
DSR (transitional arrangements start from October 2016) Interconnected capacity not eligible for the 1st auction but will participate in future auctions
Capacity Agreement Obligation and Duration
Capacity de-rating factors centrally determined by TSO Existing plants 1 year; refurbishing plants up to 3 years; new plants up to 15 years
Funding Mechanism Total costs recovered through a Supplier Levy on all licensed suppliers
Overview of the EDF group The EDF group

41
GB Capacity Market: latest/next developments
A state-owned listed company Countries profiles
19 December 2014 The first Capacity Market Auction was successfully completed. 49.3GW of capacity was procured
at £201219.40/kW for delivery in 2018/2019
Jan – March 2015 The Government implemented some design changes including the confirmation of the details of
interconnectors participation in the 2015 auction
June 2015 Completion of Ofgem process to revise Capacity Market Rules for 2015 auction: these changes are
expected to be mainly administrative
June 2015 Government will publish auction parameters for the 2015 Capacity Auction reflecting National Grid’s
assessment of capacity requirements.
July 2015 Pre-qualification begins for the 2015 Capacity Auction
December 2015 2nd Capacity Auction to take place, procuring capacity for delivery in 2019/2020
January 2016 Auction for demand side response (DSR) technologies for October 2016-September 2017
(Transitional Arrangements)
Overview of the EDF group The EDF group

42
GB Capacity Market: capacity auction results for EDF Energy
A state-owned listed company Countries profiles
1-year capacity agreement at £201219.40/kW for 2018/19 secured for all of EDF Energy’s nuclear
plants
□ 7.9GW derated capacity
□ Dungeness B, Sizewell B, Hinkley Point B, Heysham 1, Heysham 2, Hartlepool, Torness, Hunterston B
□ Capacity revenue will help to support investment (£600m per year made up of £400m Capex and £200m
maintenance and outage overhaul Opex) in the nuclear fleet, delivering improved availability and life extension
Nuclear
CCGT
3-year capacity agreement at £201219.40/kW for 2018-2021 secured for 7 (out of 8) of EDF Energy’s 500MW coal units at Cottam/West Burton A
□ 3.1GW derated capacity
□ An investment of £125/kW between 2012-2018
□ Capacity revenue will support investment to keep the coal plants operating until 2021
1 year capacity agreement for OCGTs at West Burton A
Coal
1 year capacity agreement at £201219.40/kW (2012 prices) for West Burton B CCGT
□ 1.2GW derated
Overview of the EDF group The EDF group

43
Italy – country profile
A state-owned listed company Countries profiles
The Italian energy markets hold a strong strategic interest for EDF due firstly to their major significance in the European gas and electricity markets and secondly to their connection to the French markets.
Main entities(1):
Edison:
EDF owns 97.405% of the ordinary shares of Edison, a major player on the Italian gas and electricity markets. Edison’s main activities are:
• Electricity generation and supply
• Hydrocarbon generation and supply. Edison’s Italian portfolio of gas supply also relies on long-term contracts
• Gas storage through Edison Stoccaggio, 100% subsidiary of Edison
• Gas distribution (through Edison DG)
• Gas infrastructures: partnership in 2 pipeline construction projects, Galsi (20.8%) and IGI Poseidon (50%) and partnership in the company Adriatic LNG Terminal which manages Rovigo offshore regasification terminal(2)
6 November 2014: F2i, Edison and EDF EN announced the creation of the third-largest Italian operator in the renewable energy sector with an installed capacity of 600MW. The shareholders of the newly-formed company are F2i, with a 70% interest, and a holding company owned by Edison and EDF EN for the remaining 30%
Fenice:
EDF owns 100% of Fenice, a company specialised in the offer of environmental and energy services: heat or electricity generation, operation and maintenance of energy assets, treatment
of solid and liquid industrial waste and environmental engineering (main client: Fiat)
(1) EDF EN is also active in the Italian market
(2) For more information about the Group’s gas infrastructure, see the “Group’s activities in the gas sector” chapter in the “EDF main businesses” part
Installed
capacity (GW) Edison Fenice
Thermoelectric plants
5.3 0.4
Hydroelectric
plants 1.4 n.s.
Wind power
plants 0.6 -
TOTAL 7.3 0.4
EBITDA (m€) Edison Fenice
Dec. 2013 968(3) 91
Dec. 2014 801(3) 85
Edison and Fenice 2014 key figures
(3) At the EDF group level
Key points
Overview of the EDF group The EDF group

44
Edison: electricity and gas sectors figures
A state-owned listed company Countries profiles
(1) Ratio between Edison’s net electricity output and the Italian total electricity output (267.6TWh)
(2) Gas imports in Italy account for 90% of the country’s demand (13.2bcm), and Edison accounts for 17.9% of those imports, i.e. 9.9bcm
Electricity sales 96.2TWh
Generation market share(1) 6.6%
Total installed capacity 7.3GW
Net electricity output in Italy 17.6TWh
o/w thermal power 11.7TWh
o/w hydro power 5.0TWh
o/w renewable power 0.9TWh
Delivery points 788,000
Key figures in the electricity sector in 2014
Gas sales 13.2bcm
Gas import market share(2) 17.9%
Total number of concessions (o/w 60 in Italy) 127
Number of storage sites in Italy 3
Gas production in Italy 0.4bcm
Gas production abroad 1.7bcm
Oil production in Italy 2,620Mbbl
Oil production abroad 1,541Mbbl
Delivery points 557,000
Key figures in the hydrocarbon sector in 2014
Overview of the EDF group The EDF group

45
Capacity market in Italy(1)
A state-owned listed company Countries profiles
Existing Capacity Payment to remain until the introduction of the new Capacity Market
In force since 2003, it remunerates the availability of eligible thermoelectric plants operating on the Ancillary Services Market proportionally to the
installed capacity. Small plants (<10MVA) and non programmable plants are excluded
In order to adapt to the recent changes of the power market, the Italian Regulator (AEEG) and the Ministry of Economic Development (MSE) are
currently discussing some proposals to introduce a specific remuneration mechanism for flexible plants for the 2015-2017 period
Overall system remuneration in 2014 was about €140m
New Capacity Market
The future capacity remuneration mechanism, proposed by the regulator, was approved on June 30th 2014 by the MSE
It is a centralized capacity market operated by the TSO that, based on the expected demand, signs “Reliability option contracts” with producers. These
contracts are awarded by tenders held by Terna, 4 years in advance
The timing for the implementation of the new mechanism is still under discussion. However, Terna is developing the IT systems to operate the new
mechanism: all the relevant procedures are expected to enter into force in late 2016 for a first capacity supply in late 2020. The Regulator and the MSE
are currently discussing a proposal to introduce a first phase of the capacity market for the 2017-2020 period based on simplified rules
For the moment, authorised bidders are existing and authorised plants that do not benefit from incentives
Capacity willing to participate will be allowed to bid in marginal auctions for a fixed remuneration (€ per installed MW per annum), within a Floor and a
Cap. A Strike Price is introduced: revenues in the energy markets exceeding the Strike Price will have to be rebated to the TSO
Open Cycle Gas Turbine should be the reference “peak technology” (the technology with the minimum level of Capex/MW) to set the Strike Price. Floor
and Cap will be set by AEEG
Overall system remuneration is expected to be €500-600m/year
The new mechanism shall be awarded without increasing costs for the system
(1) As of 31st March 2015
Overview of the EDF group The EDF group

46
Benelux – area profile
A state-owned listed company Countries profiles
(1) Excluding 100MW of drawing rights in the Chooz B power plant, owned by the EDF group
(2) Data at 100%
(3) EDF Belgium + EDF Luminus. In 2014, in accordance with IFRS 11, Sloe Centrale is
consolidated under the equity method
(4) EDF Belgium + EDF Luminus +50% Sloe (10.6TWh including Chooz B output)
Key points
2014 key figures
Country Company Main
activities Technical data
Belgium EDF Belgium Electricity
generation
Nuclear installed capacity:
481MW
Belgium EDF Luminus
Electricity
generation
Electricity
and gas
sales
Installed capacity: 1,954MW
o/w nuclear(1): 419MW
o/w thermoelectric: 1,286MW
o/w hydro: 69MW
o/w renewables: 180MW
Delivery points: ~1.74 million
Netherlands Sloe Centrale
B.V.
Electricity
generation Installed capacity CCGT: 870MW
(2)
Total EBITDA(3) in 2014: ~14% of “other international” segment EBITDA
Total cumulated output in 2014(4): 9.9TWh
A strategic area for EDF: A region that features important interfaces with French and German power
markets and projects for new links with Germany and Great Britain are also being examined
Key area in the European gas market due to its significant import and transit infrastructures, such as the Zeebrugge hub
Main entities: EDF Belgium: 100% owned by EDF, it owns 50% of the Tihange 1 nuclear
plant (i.e. 481MW, equivalent to 2% of Belgium’s generation capacity)
EDF Luminus
EDF majority shareholder (63.5%) through EDF Belgium
951 employees as of 31 December 2014
2nd player in the Belgian market with 10% of the national generation capacity
EDF Luminus owns 10.2% (419MW) of Tihange 2 and 3 and of Doel 3 and 4
nuclear plants. EDF Luminus also has drawing rights of 100MW in the French
nuclear plant of Chooz B
Total output in 2014 of 4,272GWh (4,985GWh including Chooz B)
In 2014, the market share of sales to end customers was of approximately 20%
13 May 2015: the Board of Directors decided to launch the process for the IPO of EDF Luminus on Euronext Bruxelles
27 May 2015: EDF Luminus finalised the acquisition of a majority stake in ATS, a company specialised in energy services
Sloe Centrale B.V. (Netherlands): 2 CCGT units of 435MW, owned at 50% with Delta B.V.
Overview of the EDF group The EDF group

47
Central and Eastern Europe – area profile
A state-owned listed company Countries profiles
Two main countries: Poland and Hungary
Poland
Electricity generation, cogeneration and supply
The Group operates in Poland mainly through EDF Polska SA which includes the Rybnik generation branch, the Krakow cogeneration branch, the Wybrezeze cogeneration branch and the Warsaw branch (comprising the company headquarters and the Optimisation and Sales department) and EDF Torun, a subsidiary of EDF Polska, which holds the municipal district heating distribution network in addition to a heat generation facility
The Group also controls ZEW Kogeneracja SA, the cogeneration company of the city of Wroclaw
In addition, the EDF group is present in Poland through:
• EDF Fenice, in the energy efficiency field
• EDF Energies Nouvelles, that operates a wind farm with an installed capacity of 48MW in Linowo
Hungary
Cogeneration, distribution, supply
2 main subsidiaries: BE ZRt (heat and electricity generation) at 95.6% and EDF DEMASZ ZRt (mainly electricity supply and distribution) at 100%
Key points Assets
Country Company Site Main activities Technical data
Poland EDF Polska Gdansk, Gdynia
Electricity and heat generation
Electric capacity: 333MW Thermal capacity: 1,134MWth
Poland EDF Polska Rybnik Electricity generation
Electric capacity: 1,775MW
Poland EDF Polska Kracow Electricity and heat generation
Electric capacity: 460MW Thermal capacity: 957MWth
Poland EDF Polska Torun Heat generation
Thermal capacity: 398MWth
Poland Kogeneracja Wroclaw Electricity and heat generation
Electric capacity: 366MW Thermal capacity: 1,094MWth
Hungary BE ZRt Budapest Electricity and heat generation
Electric capacity: 406MW Thermal capacity: 1,192MWth
Hungary EDF DÉMÁSZ ZRt
Szeged Gas and electricity sales and distribution
Clients (approx.): 740,000 Sales: 3.2TWh
Distribution: 4.2TWh Delivery points: ~773,300
2014 EBITDA of Poland and Hungary: 42% of
“other international” segment EBITDA
Overview of the EDF group The EDF group

48
Poland: EDF, a major player
A state-owned listed company Countries profiles
EDF: 1st foreign investor in the energy sector, present in the
Polish market for 16 years now
10% of the electricity generation market
~3,000MWe
An electricity output in 2014 of 14TWh
15% of the municipal heating
~3,500MWth
A heat output in 2014 of 8TWh
3,000 employees in main Polish cities (Warsaw, Krakow,
Wroclaw, Gdansk, Gdynia, Toruń, Rybnik et Zielona Góra)
For the year 2014, EDF Polska won the
“Ethical Company” award of the economic
daily press “Puls Biznesu” competition
Overview of the EDF group The EDF group

49
Poland: power plants modernisation and development of B2B sales
A state-owned listed company Countries profiles
(1) According to the localisation
A power plant modernisation program for the country’s
energy future
In 2013, the Group has confirmed the launch of a major modernization program of its generation units in Poland for a total investment of €800m between 2013 and 2017
2 objectives:
Power plants operational performance improvement and operational life extension by 2035
Ensure compliance with new European requirements related to industrial emissions of sulphur oxide (SOx) and nitrogen (NOx) (IED directive)
Desulphurisation and denitrification infrastructures to divide SOx emissions by a 5 to 7 factor(1) and NOx
emissions by a 2 to 3 factor(1)
Development of the B2B client base
The EDF group wants to become a leader in electricity
sales to business and professional clients in Poland
By entering that segment, EDF becomes an integrated
energy company oriented towards its clients. This is part
of the ambition of the Group to be the most innovative and
efficient producer in Poland
EDF Polska is already present on the large companies
segment. For the past three years, EDF tripled the volume
of energy sales from 1.2TWh to 3.5TWh on that segment
Overview of the EDF group The EDF group

50
Capacity market in Poland
A state-owned listed company Countries profiles
A transitional mechanism to guarantee the security of supply in the short-term
Operational Capacity Reserve Mechanism
□ In place since 1 January 2014 to support centrally dispatched
production units
□ Designed by the TSO and approved by the Regulator,
as a transition towards a capacity market
The TSO remunerates ex-post the capacity available in peak hours
□ For 2015, the maximum amount paid by the TSO is fixed at
37.28PLN/MW per peak hour during which available capacity is
below the required TSO security level
□ When available capacity exceeds the security level, the payment
is reduced with regards to the extent in which the limit was
exceeded
Demand level
Demand
level for a
peak hour
Available units receive capacity payment
TSO Security level
Total capacity in the system
Overview of the EDF group The EDF group

51
North America – activities profile
A state-owned listed company Countries profiles
(1) bcf = billion of cubic feet
(2) Renewable Energy Certificates
Electricity
Gas transmission: EDF Trading is among the 5 main suppliers in North America’s gas market. It signed pipeline contracts in Europe, Canada and Mexico and distributes on the market 7.62bcf(1)/day on average
E&G: EDF Trading North America holds gas E&P rights in Texas and in Pennsylvania in order to develop its upstream gas activity in the USA
LNG: on 17 July 2014, EDF signed with Cheniere a LNG supply contract of 0.77 million of tones per year, with a duration of 20 years starting from the first delivery date at the Corpus Christi LNG terminal whose construction is not expected before 2019
LPG: EDF Trading joined in 2014 the GPL market through the signature of a supply contract with Enterprise Products Partners LP on the long term export capacity from the Gulf of Mexico
Hydrocarbons
In North America the Group has:
More than 4.5GW installed capacity
28.5GW installed capacity under operation and maintenance or optimisation services contracts
Activities in North America:
Nuclear generation
• Existing: EDF Inc – Around 2GW of nuclear installed capacity thanks to the 49.99% ownership of CENG
• Under development: in February 2015, UniStar Nuclear Energy (“UNE”), a wholly-owned subsidiary of EDF, asked the Nuclear Regulatory Commission (NRC) to hold its work towards having a Combined Licence Application (“COLA”) for the site of Calvert Cliffs 3 in the State of Maryland, following the request sent by AREVA to the NRC to suspend the design certification study for the American version of the EPR.
Trading: EDF Trading North America that handles 21GW of electricity generation
Renewables: EDF Renewable Energy (100% EDF EN), with 1.87GW installed capacity in the US, 463.8MW in Canada and 229.5MW in Mexico, and EDF Renewable Services (100% subsidiary of EDF Renewable Energy) that manages about 9.4GW through O&M contracts on its own or on behalf of third parties
Coal and fright business
Large industrial clients through EDF Energy Services, subsidiary of EDF Trading
Trading of RECs(2), biogas, carbon emissions and credits and weather derivatives
Other activities of EDF Trading
Overview of the EDF group The EDF group

52
Map of EDF group North American operations: EDF Inc, CENG, EDF Trading North America and EDF Renewable Energy
A state-owned listed company Countries profiles
A strong and diversified presence
in North America
Wind, solar and O&M projects in United States are under EDF Renewable Energy. Mexico and Canada are under EDF Energies Nouvelles brand.
CENG nuclear assets
EDF RE/EN Developed Wind
EDF RE O & M (eSC)
EDF RE/EN Developed solar
EDFT Retail load
EDFT gas storage
EDFT Generation asset optimization
EDFT Gas asset management
EDFT Coal terminal (through rights)
EDFT LNG re-gas capacity
EDF RE Biogas
R&D Center
Overview of the EDF group The EDF group

53
North America: market characteristics
A state-owned listed company Countries profiles
(1) Energy Information Administration, Annual Energy Outlook, April 2014
(2) Canadian Electricity Association, Key Canadian Electricity Statistics, June 2014
US market
Mexican market
Total electricity generation of 4,089TWh in 2014: the US represents one of the world’s largest electricity market
Electricity generation mix in 2014: 39.6% coal, 27% natural gas, 19.2% nuclear, 12.9% renewable generation and 1.3% other
Electricity demand growth (about +2% in 2014 vs. 2013) should slow down under energy efficiency programs and related investments. By 2040, demand should grow by 29% in order to reach 4,954TWh(1)
In 2040 (1), the generation mix will be split into 35.2% of natural gas, 32% of coal, 16.3% of renewable generation and 15.5% of nuclear
The fight against climate change is central in the current Administration's policy, both at international and federal level. In June 2014, the US Environmental Protection Agency (EPA) proposed the "Clean Power Plan" which sets emission rate targets at national level: a reduction of about 30% of CO2 emissions for the electricity sector by 2030 compared to 2005 levels
According to EIA(1), the US became the leading producer worldwide of oil in 2013 ahead of Saudi Arabia and of natural gas ahead of Russia in 2014. The US is also set to become a net exporter of liquefied natural gas in 2016 and an overall net exporter of natural gas in 2018
In 2014, electricity generation in Canada amounted to 592.3TWh (+0.4% vs. 2013)
Electricity generation mix in 2014: 57.5% of hydro (third worldwide hydro producer after China and Brazil), 16.2% of nuclear, 11.3% of coal, 8.9% of natural gas, 6.1% other(2)
The National Energy Board estimates that the nuclear share should decrease at 12% in 2035 due to the development of wind farms and gas-fired plants
The Canadian electricity market, structured by province, is extremely fragmented due in particular to the central role of local policies in terms of carbon emissions and renewable energies
In 2014 the country installed capacity reached 54.4GW for a gross generation of 258.3TWh
Electricity generation mix in 2014: 78.3% of thermoelectric plants (gas mainly imported from the US), 14.8% of hydro, 3.7% of nuclear, 3.1% other renewables
In August 2014, the President signed several laws for the implementation of a favorable context for the market opening and for the competition of the electricity sector in Mexico
The federal government aims to increase the share of renewable energies in the energy mix to 7.5% by 2017
Canadian market
Overview of the EDF group The EDF group

54
China
A state-owned listed company Countries profiles The EDF group
Company (stake)
Asset name Installed capacity(1)
SZPC (19.6%) 3 coal-fired power plants 3,060MW
DSPC (35%) Sanmenxia 2 (coal SC) 2 x 600MW
Figlec (100%) Laibin B (coal) 2 x 360MW
FPC (49%) Fuzhou (coal USC - under construction) 2 x 1,000MW
TNPJVC (30%) Taishan (nuclear EPR – under construction) 2 x 1,750MW
EDF group is one of China’s most significant foreign investor in the electricity sector, with a thermoelectric capacity of 6,980MW(1)
EDF has also built partnerships to develop nuclear power, thermal and hydro facilities, gas plants, electricity distribution and energy efficiency
First and only foreign company to invest in the construction and operation project concerning a nuclear plant in China, EDF owned, as of 31 December 2014, 30% of TNPJVC, which was set up to fund, build and commission two EPR nuclear reactors (2 x 1,750MW)
As of 31 December 2014, the EDF group holds a 49% stake of a joint-venture in charge of building and operating a “ultra-supercritical” coal-fired plant. Construction work began in 2014 and commissioning is scheduled for 2016
29 January 2015: as part of their strategic partnership, EDF and China General Nuclear Power Group (CGN) signed an agreement to share their experience of plant operation and engineering support for existing nuclear fleets, with the aim of preserving the highest safety levels and maintaining consistency between French and Chinese procedures and standards. EDF also signed an agreement with Huadian, a leading Chinese electric utility, paving the way for future cooperation on joint projects in China as well as at international level in the gas and renewable generation fields
EDF is also present in China with an R&D centre and through EDF International Networks in the electricity supply sector
Key points Operations map
Beijing
FIGLEC
LAIBIN B project
2 x 360MW coal plants
EDF: 100% +
SYNERGIE in charge of
operation and maintenance
EDF: 85%
TNPJVC
TAISHAN
EPR 2 x 1,750MW nuclear
(under construction)
EDF: 30%
SZPC
3,060MW coal plant
EDF: 19.6%
DSPC
SANMENXIA II project
2 x 600MW SC coal plants
EDF: 35%
Assets
(1) Data at 100%
Fuzhou
2 x 1,000MW USC coal
plants (under construction)
EDF: 49%
Overview of the EDF group

FACTS
& FIGURES
FACTS
& FIGURES R&D SUPPORTING
GROUP’S BUSINESSES

56
R&D supporting Group’s businesses
R&D’s key figures 57
R&D supporting Group’s business 59
Innovation at R&D 62
Electranova Capital 63
The EDF group EDF main businesses Finance Market data Appendices Corporate responsibility R&D

57
R&D at a glance
R&D’s key figures R&D supporting Group’s businesses R&D Innovation Electranova Capital
To strengthen and develop a competitive and low-carbon generation mix
To prepare tomorrow’s electrical systems
To develop and try out new energy services for customers
3 main missions
Partnerships in France and abroad
Different R&D programs for all Group businesses
Generation Energy management Customers and sales
Did you know?
2014 R&D figures:
More than 2,100 employees
15 departments (skills, partnerships and
project management)
10 international centers
3 in France and 7 abroad:
Germany, Poland, UK, China, Singapore,
Italy (Edison’s R&D), USA
14 shared research labs
A budget of €650m in 2014
Renewable energies Electrical networks Information technology & simulation
In Europe: partner with 74 European Union projects (PC7) and with 16 Joint
Technology Initiatives
In France and abroad: many research projects with leading energy players
(HYDRO-QUÉBEC, SINTEF, Total, DCNS, Schneider Electric…) and renowned
institutes and universities (MIT, EPRI in the US, ETI, Imperial College, Manchester
University in the UK, etc.)
In France
More than 320 partnerships with universities, research institutes and academic
institutions
An advanced research facility, EDF LAB Paris Saclay, operational starting from
2015 and located on an internationally sized scientific campus

58
R&D main expenses break-down in 2014
R&D’s key figures R&D supporting Group’s businesses R&D Innovation Electranova Capital
550
54
31
9 6
EDF EDF Energy ERDF EDF EN Other
The total R&D budget at Group level was
650 million Euros in 2014
In millions of Euros

59
R&D supporting centralised generation
R&D’s key figures R&D supporting Group’s businesses R&D Innovation Electranova Capital
Nuclear generation Hydro and other renewables generation
Contributing to the extension of the operating life of hydro plants and equipments
Submitting alternative methods and innovative tools for the optimisation of renewable generation (off-shore wind)
Supporting the development of new energy sources (Thermodynamic solar plants, tidal energy, etc…)
Thermoelectric generation
Testing and evaluating Carbon Capture technologies
Contributing to the flexibility of the thermal fleet in order to enhance its support to the network and to reduce coal costs
To consolidate and develop competitive, low-carbon generation mixes
in 3 main generation areas
driven by one shared priority: the environment
Optimising the operating performance of the existing nuclear fleet
Designing the nuclear technology of the future
New 3rd generation reactor designs, small modular reactors (SMRs), fast neutron reactors (GEN IV)
Management and anticipation of our activities’ impact on the environment

60
R&D supporting energy management and commercial activities
R&D’s key figures R&D supporting Group’s businesses R&D Innovation Electranova Capital
Energy Management
Developing prospective energy scenarios and assess the market value of the Group assets by:
analysing the competitive environment and developing economic models
anticipating mutations of the European power system
Preparing the evolutions of generation & supply optimisation processes by integrating renewable energies’ and Smart Grids’ development
Developing tools for supply-demand optimisation and Group market risks management
Commercial activities
Accelerating the digitalisation of customer relations and promote new uses of electricity
Developing energy efficiency services for industrial, commercial and residential customers
Enhancing understanding of customers consumption profiles in order to design new commercial solutions
Developing new business models for cities and territories

61
R&D supporting Renewables and Networks
R&D’s key figures R&D supporting Group’s businesses R&D Innovation Electranova Capital
Current electricity grids
Tomorrow’s electricity grids
Develop advanced management tools for electrical systems
Contribute to a successful rollout of smart meters and related services
Anticipate the increase in intermittent generation connected to the grid
Design local energy solutions to be integrated in the overall electrical system
Renewable energies
Develop tools and methods to optimise Group operating performances and project costs
Identify and prepare technological breakthroughs that will drive renewable costs reduction
Prepare new mass storage technologies in the context of renewable energies growth
onshore wind offshore wind
photovoltaic tidal energy geothermal
bioenergy thermodynamic solar energy
Optimise the operating life of current network infrastructures
Increase the infrastructure capacity and improve network availability
Increase automation of current distribution grids in order to optimise the quality of supply and reduce operating costs

62
Innovation
R&D’s key figures R&D supporting Group’s businesses R&D Innovation Electranova Capital
A “Corporate Venture” approach with a partner focused on France/Europe
Strategic stake acquisitions in French
and international venture capital funds
Electranova Capital Fund created in May 2012,
with Idinvest Partners
Already 6 investments made
Chrysalix (Canada)
Tsing Capital (China)
Seed fund
CEA Investissements
Financial partnerships in innovation fund
within the investment strategy of the Group Start-ups identification and monitoring network spread
across 3 continents (America/Asia/Europe):
A staff of 20 people
Over 1,000 start-ups identified since 2012
Over 35 demos in 2014
An innovative start-up surrounding Together with Electranova Capital, identify start-ups bringing additional value to Group businesses, sponsoring innovation related contests and creation of a network of innovators within the innovation environment and its actors
A better promotion of the internal innovation Strengthen the “Intellectual Property” culture, integrate it into the business strategy and accelerate the industrialisation process and the transfer of innovations to the businesses
R&D’s “Open Innovation” team
Missions and challenges of the Innovation
network
Robolution Capital (Fr)
DBL (USA)

63
Electranova Capital, a fund launched in 2012
30
10
10
40
In million of Euros
90
FCPI (Fonds Communs de Placement dans l'Innovation)
BPI
Allianz
EDF
R&D’s key figures R&D supporting Group’s businesses R&D Innovation Electranova Capital
Electranova Capital is a cleantech venture capital fund managed by
Idinvest Partners in partnership with EDF. Allianz Group and BPI France
are investors in the fund, together with EDF
The mission: supporting innovative green technology-focused companies and tackling
the key challenges of the energy transition
The fund has an investment capacity of €90 million, including €30 million
contributed by EDF
Geographical diversity: 80% of the fund’s investments are in Europe and 20% in the
rest of the world (primarily in the United States)
Portfolio: the fund aims to have a broad portfolio of 10 to 15 companies representing a
wide range of energy and cleantech industries (investing between €1m and €10m per
start-up)
A fund that follows standard market practices, with: − A separate governance from EDF
− No pre-emption rights for EDF
Strategic ownership: R&D and Finance Department

64
Electranova at the center of EDF's innovation programme
R&D’s key figures R&D supporting Group’s businesses R&D Innovation Electranova Capital
STRATEGIC AMBITIONS
Bolster innovation capacity
Anticipate and adapt strategy
Enhance entrepreneurial spirit within EDF
Identify new technologies or business models
FINANCIAL AMBITIONS
Ensure financial performance
Risk management
R&D Open
Innovation
EDF Innovation Programme
Business activities R&D
Start-up
Sourcing Investment
Group Innovation Committee

65
A partnership model with renowned investors
R&D’s key figures R&D supporting Group’s businesses R&D Innovation Electranova Capital
An investment strategy focused on the best companies worldwide
EDF's main partner is Idinvest Partners, co-founder of Electranova.
2015 saw the establishment of a US-specific partnership, with the American firm DBL Investors.

66
A broad range of investments around the EDF universe
R&D’s key figures R&D supporting Group’s businesses R&D Innovation Electranova Capital
Smart Grids Network infrastructure
Storage: batteries and hydrogen, etc.
Power generation Solar/Wind/Geothermal
Marine/Hydro power, etc.
Energy efficiency Lighting/Heating/Air-conditioning, etc.
Eco-houses/buildings, etc.
Sustainable cities Electric mobility
Smart Cities, etc.
Digital/Internet
of things
New
Services
Other
New
technologies

67
EDF's close involvement in the highly selective investment process
R&D’s key figures R&D supporting Group’s businesses R&D Innovation Electranova Capital
Qualification Business evaluation
Detailed due diligence
Investment
~1,000 ~50 ~10 7
Sourcing
for EDF
Expert opinions
(business/R&D)
Detailed technical
and economical
analysis
Partnership/project
discussions
No of. start-ups
Few weeks ~1-2 months ~3 months
Interaction with EDF
All Group business areas involved

68
Current portfolio
R&D’s key figures R&D supporting Group’s businesses R&D Innovation Electranova Capital
Start-up Sector Country Description
Offshore wind
turbines Gravity-based foundations for offshore wind turbines
Hydrogen High temperature fuel cells and electrolysers
Markets: Micro CHP, H2 Stations, storage, etc.
Energy-efficient
buildings High performance thermal wood/insulation composite
Energy storage Battery developer for mobile and stationary energy storage
markets
Internet of things -
Demand-side
response
Demand-side response
Low-speed data communications
Smart buildings Smart lighting for the tertiary and industrial sectors
Wind power LIDAR developer for the wind power industry

FACTS
& FIGURES
FACTS
& FIGURES EDF MAIN BUSINESSES

70
Optimisation - Trading and Supply
Networks - Transmission and Distribution
Generation
EDF main businesses
Group’s activities in the gas sector
71
138
149
173
Energy services 178
The EDF group EDF main businesses Finance Market data Appendices Corporate responsibility R&D

71
EDF main businesses
Generation
72
111
130
Nuclear generation
Renewable generation
Thermoelectric generation
EDF main businesses Generation Networks Optimisation - Trading and Supply Gas Energy services

72
EDF main businesses
Key points of nuclear generation
Existing nuclear in France
Existing nuclear in the UK
Nuclear New Build
Long-term provisions
Nuclear generation
Generation
73
74
89
94
100
Innovations in nuclear generation 109
Generation Renewable Nuclear Thermoelectric EDF main businesses

73
Generation Nuclear Nuclear key points
Nuclear New Build
Long-term provisions
Existing nuclear in France
Existing nuclear in the UK
Innovations
Nuclear: a unique expertise
A form of electricity generation at a competitive cost, independent from fossil fuels prices and CO2 free
EDF has a solid construction and operation experience in France, in the United Kingdom and in the USA (through Constellation Energy Nuclear Group LLC − « CENG » − and its affiliates), allowing the Group to be a major actor in the international nuclear generation
EDF new reactors under construction:
One EPR reactor in Flamanville (France)
Two EPR reactors in Taishan (China), in partnership with CGN
Other projects under study in the UK
Did you know?
EDF existing fleet
58 reactors in France
15 reactors in the UK
Did you know?
New Nuclear Development
3 EPR reactors
under construction
Did you know?
A strong experience
1,700 reactor-years
of experience operating the
French fleet

74
EDF nuclear fleet in France
Generation Nuclear Nuclear key points
Nuclear New Build
Long-term provisions
Existing nuclear in France
Existing nuclear in the UK
Innovations
Did you know?
The whole fleet in operation today has been built using the same
technology (PWR). This standardization allows for operational synergies
and greater efficiency. Moreover, more than being just a nuclear
operator, EDF is an architect-assembler, meaning that it is
responsible for the design, schedule and building of the reactors with the
benefit of running its fleet safely.
(1) Source: RTE
Gravelines
Chooz Cattenom
Fessenheim
St Alban
Cruas
Tricastin
Penly
Paluel Flamanville
St Laurent Dampierre
Belleville Chinon
Civaux
Blayais
Golfech
Nogent Seine
900MW 1,300MW 1,450MW EPR
Bugey
77%(1)
of French power generation in 2014
58 reactors in operation with a capacity of 63,130MW
19 sites
A unique technology (Pressurised Water Reactors),
3 series:
900MW 34 reactors 31GW
1,300MW 20 reactors 26GW
1,450MW 4 reactors 6GW

75
Pressurized Water Reactors (PWR) operating principles
Generation Nuclear Nuclear key points
Nuclear New Build
Long-term provisions
Existing nuclear in France
Existing nuclear in the UK
Innovations
Primary system Secondary system Cooling system

76
The French nuclear fleet: operating cycle
Generation Nuclear Nuclear key points
Nuclear New Build
Long-term provisions
Existing nuclear in France
Existing nuclear in the UK
Innovations
Cycle
Generation Generation Planned
outage Length can vary by 10 days from one cycle to the next
Planned
outage For refueling, maintenance, repairs
Duration: variable, between 35 and 110 days
900MW: 28 reactors 12 months cycle
6 reactors 18 months cycle
1,300MW: 20 reactors 18 months cycle
1,450MW: 4 reactors 18 months cycle
The refueling cycle of nuclear reactors Types of planned outages
Two types of planned outages are alternated at the end of each generation cycle:
Ordinary outage for refueling only (ASR(1)): unloading spent fuel and refueling fresh fuel Standard period ≈ 35 days
Partial inspection (PI) for refueling and maintenance: refueling and maintenance. Standard period ≈ 70 days, varying according to programs for maintenance work
10-year inspections: standard period ≈ 110 days, varying according to programs for safety upgrades and maintenance work
Regulatory obligations (safety tests and various controls), adapting safety to latest standards, maintenance work
(1) Arrêt pour simple rechargement

77
French consumption pattern is particularly seasonal and thermo-sensitive
Generation Nuclear Nuclear key points
Nuclear New Build
Long-term provisions
Existing nuclear in France
Existing nuclear in the UK
Innovations
Which creates special demand on the nuclear fleet
2014 monthly consumption in main European countries
In GWh
15 000
20 000
25 000
30 000
35 000
40 000
45 000
50 000
55 000
Germany
Spain
France
United Kingdom
Italy
Consumption pattern with high seasonal variations between summer and winter
Between 30 and 35TWh/month during the summer
Between 40 and 55TWh/month during the winter
France is highly sensitive for every 1°C of temperature variation:
In winter ≈ ± 2,400MW
In summer ≈ ± 500MW
Sources: ENTSO-E
55,000
50,000
45,000
40,000
35,000
30,000
25,000
20,000
15,000

78
A seasonal schedule of outages
Generation Nuclear Nuclear key points
Nuclear New Build
Long-term provisions
Existing nuclear in France
Existing nuclear in the UK
Innovations
A minimum number of planned outages during winter
Necessary balance between 12-month and 18-month production cycles
(1) At a specific instant t
0
2
4
6
8
10
12
14
16
18
20
1 2 3 4 5 6 7 8 9 10 11 12 13 14 15 16 17 18 19 20 21 22 23 24 25 26 27 28 29 30 31 32 33 34 35 36 37 38 39 40 41 42 43 44 45 46 47 48 49 50 51 52
Year 2014: number of reactors in planned outage per week(1)
In blue, the winter planned outages

79
Load factor and nuclear output evolutions
Generation Nuclear Nuclear key points
Nuclear New Build
Long-term provisions
Existing nuclear in France
Existing nuclear in the UK
Innovations
75.5 76.1 77.0 77.6 77.4 75.6 75.3
70.7
73.8 76.1
73.0 73.0 75.2
2002 2003 2004 2005 2006 2007 2008 2009 2010 2011 2012 2013 2014
Annual Kp (load factor) of nuclear fleet Net nuclear output (PWR fleet)
Kp (%) In TWh
417 421
427 429 428
418 418
390
408
421
405 404
416
2002 2003 2004 2005 2006 2007 2008 2009 2010 2011 2012 2013 2014

80
92.0 92.0 93.0 93.1 92.7
94.5 95.4
90.6
94.1 94.5
91.8
93.6 93.0
2002 2003 2004 2005 2006 2007 2008 2009 2010 2011 2012 2013 2014
Historical availability of French nuclear fleet
Generation Nuclear Nuclear key points
Nuclear New Build
Long-term provisions
Existing nuclear in France
Existing nuclear in the UK
Innovations
Did you know?
The Kd, or availability factor,
represents the available energy over the
maximum theoretical energy corresponding
to the maximum capacity all along the year.
The winter Kd is the availability factor
measured between the 1 of December and
the 14th of February of the next year, when
the consumption reaches its maximum
levels.
The Ku, or utilization factor, is the
produced energy over the available energy. It
reflects environmental and social constraints,
the consumption profile of customers, the
supply of system services and the
optimization
The multiplication of the Kd and
the Ku leads to the Kp, or “load
factor”, defined as the generated energy
compared to the maximum theoretical
energy.
Kp = Kd x Ku
Kd and winter Kd (%)
82.5 82.7 82.8 83.4 83.6
80.2 79.2 78.0 78.5
80.7 79.7 78.0
80.9
90.1 92.5
94.8 92.9
90.1 89.9 92.4
86.8
94.6 92.3 91.5
92.9 93.4
2002 2003 2004 2005 2006 2007 2008 2009 2010 2011 2012 2013 2014
Kd
Winter Kd (1)
Ku (%)
(1) Kd from 1 December (N) to 14 February (N+1)

81
Comparison between EDF and US PWR fleet Kd En cours de mise à jour
Generation Nuclear Nuclear key points
Nuclear New Build
Long-term provisions
Existing nuclear in France
Existing nuclear in the UK
Innovations
Kd reflects the impact of technical unavailability (planned and unplanned outages)
Kd key structural discrepancies between the French
and American PWR fleet of ≈ 8 points:
1.8pts: fleet solicitation method • the US fleet operates purely under base-load
generation
• the French fleet operates with seasonal planned
outages linked to the electricity consumption model in
France
2.6pts: fuel management method • American refuelling cycle: between 18 and 24 months
3.2pts: regulation and safety specificities
0.4pt: work regulation
Source: EDF and NRC
AVAILABILITY
USA: 65 PWR*
USA: 58 PWR
*69 PWR reactors in operation until 2013 and 65 onwards

82
Operating performance: the drivers
Generation Nuclear Nuclear key points
Nuclear New Build
Long-term provisions
Existing nuclear in France
Existing nuclear in the UK
Innovations
Managing planned outages periods
Optimisation of the volume of regular maintenance during outages
Improvement of the quality of preparation and realisation of maintenance intervention
Strengthening of the control over restart operations
Average length of planned outages cut by half in 2014 vs. 2013
Reducing unplanned outages
Pursuit of the replacement of large components (steam generators, alternator stators, main transformers)
Improving the reliability of equipment through preventive maintenance
Generating at the best time possible, mainly in winter when consumption is the highest

83
2004 2005 2006 2007 2008 2009 2010 2011 2012 2013 2014
61 58 56 53
31 41 40
30 32 34 31
Nuclear fleet operation conditions
Generation Nuclear Nuclear key points
Nuclear New Build
Long-term provisions
Existing nuclear in France
Existing nuclear in the UK
Innovations
Number of automatic reactor outages
Average annual collective dose/reactor
Accidents frequency rate(1)
Individual annual dose(3)
0
5
10
15
Contractors
EDF 3.7
2.6
0,5
0,7
0,9
1,1
Man Sv/u(2) 0,72
46
24 20
8 5
2010 2011 2012 2013 2014
2014: a good year in terms of safety for the French nuclear fleet
(1) Number of accidents with work stoppage per 1 million hours worked (2) Man Sievert per unit (3) Maximum monthly number of persons who received a dose of between 14 and 17mSv/12 months, compared with regulatory limit of 20mSv/12 months

84
EDF’s nuclear fleet investment program in France (1/2)
Generation Nuclear Nuclear key points
Nuclear New Build
Long-term provisions
Existing nuclear in France
Existing nuclear in the UK
Innovations
Existing nuclear fleet’s strengths
Technical standardisation and continuous safety improvements
A full economic cost of around €55/MWh(1), lower than any other new generation plant
A major contribution to the low-carbon generation mix
EDF, architect-assembler of its power plants, owner and operator
An industrial program to prepare for the future
The existing nuclear constitutes a sustainable and efficient response to future energy needs
Major refurbishing and modernisation work over the 2015-2025 period (during which the 900MW reactors will reach 40 years and the 1,300MW reactors 30 years) in order to extend the operating lives beyond 40 years
A program in accordance with the objectives set up by the energy transition law and by the multi-year energy plans
A total amount of investments of €201355bn(2) over the 2015-2025 period, to be validated progressively
A specific programme called “Grand Carénage” (major overhaul programme) to manage, in an integrated way, all work in progress
(1) During the 2014-2025 period for an operating life extended beyond 40 years (2) For more information see the “Investment program for the nuclear fleet in France” paragraph on page 51 of the 2014 Reference Document

85
EDF’s nuclear fleet investment program in France (2/2)
Generation Nuclear Nuclear key points
Nuclear New Build
Long-term provisions
Existing nuclear in France
Existing nuclear in the UK
Innovations
The “Grand carénage” programme integrates:
The refurbishing or replacement of all large components when they are around 30 years old
Obsolescence of some large components that have to be replaced starting around age 30: steam generators, transformers, alternators
In the perspective of an extended operating life beyond 40 years
The increase in facilities protection in extreme situations, following the Fukushima accident
Strengthening of the current protection level of facilities and of some equipments mainly against earthquakes and floods
Strengthening and diversification of contingency solutions for water and electricity
Modifications to strengthen the power plants designs after 10-year safety re-examinations Safety standards and an improvement program set up during the 10-year inspections for each reactor, after approval from the ASN (French
Nuclear Safety Authority)
Positive opinion from the ASN on the generic safety re-examination program for the 3rd 10-year inspection of the 1,300MW series starting in
2015
Operating life extension beyond 40 years
• No set limits on operating life but required safety reviews every ten years
• Consistent target with the current international trend for similar technologies (PWR). In the US, 45 of the 64 PWR received an
authorisation to operate up to 60 years
• The 4th 10-year inspection for the 900MW series scheduled starting from 2019

86
The pursuit of large components replacement program
Generation Nuclear Nuclear key points
Nuclear New Build
Long-term provisions
Existing nuclear in France
Existing nuclear in the UK
Innovations
Steam generators 3GV/reactor of 900MW
4GV/reactor of 1,300MW
1 reactor of 900MW every 2 years on average until 2030
2 reactors of 1,300MW a year on average until 2033
Alternator stators 3 reactors a year on average until 2019
Main transformers
(3 units/reactor) 4 reactors a year on average until 2024

87
Requirements evolutions in terms of nuclear safety
Generation Nuclear Nuclear key points
Nuclear New Build
Long-term provisions
Existing nuclear in France
Existing nuclear in the UK
Innovations
Recasting of general regulations related to nuclear installations
The law for Transparency and Nuclear Safety of 28 June 2006, and the following decree of 7 February 2012, integrate into the French law
some principles related to harmonisation works as led by European safety authorities, brought together in the WENRA (Western European
Nuclear Regulators Associations)
ASN’s opinion(1) on Safety Additional Examination, following the Fukushima accident: satisfactory safety level but increase in protection of installations for extreme situations Set-up of the FARN (National Rapid Action Force)
Strengthening of the protection of installations and of some equipment mainly against earthquakes and floods
Strengthening and diversification of contingency solutions for water and electricity
Implementation of ongoing or finished ASN decisions
Implementation of the decree related to nuclear equipment under pressure (ESPN)
The decree of 12 December 2005 related to ESPN (steam generators, vessels, etc.) changes mainly the method for the demonstration and
surveillance of conception, manufacture and assembly of the components that were build after January 2011 (implementation guide published
in 2012 and 2013 by the ASN)
Some implementation methods of this decree are currently under development and discussion
Operating life extension beyond 40 years To go beyond 40 years, the ASN asks the safety re-examination to be realised “with regard to the safety target fixed for 3rd generation reactors,
such as the PWR reactor”
Discussions between EDF and the ASN for this 4th safety re-examination of the 900MV series of reactor, that will start in 2019
(1) Opinion of 3 January 2012

88
10-year inspections for the nuclear fleet(1)
Generation Nuclear Nuclear key points
Nuclear New Build
Long-term provisions
Existing nuclear in France
Existing nuclear in the UK
Innovations
(1) Provisional data as of 12 February 2015
1,450MW
1,300MW
900MW
0
1
2
3
4
5
6
7
8
2015E 2016E 2017E 2018E 2019E 2020E 2021E 2022E 2023E 2024E 2025E 2026E
3rd 10-year inspections for the 900MW series
4th 10-year inspections for the 900MW series
4th 10-year inspections for the 1,300MW series 3rd 10-year inspections for the 1,300MW series
2nd 10-year inspections for the 1,450MW series
Number of 10-year inspections

89
EDF Energy nuclear fleet
Generation Nuclear Nuclear key points
Nuclear New Build
Long-term provisions
Existing nuclear in France
Existing nuclear in the UK
Innovations
Generated approximately one fifth of UK output in 2014(1)
8 nuclear power stations
15 reactors in operation
2 technologies (AGR and PWR), with a total capacity of 8.9GW
Highlights
Did you know?
An AGR differs in many respects from a PWR. Whereas the AGR design is
unique to the UK, the PWR design is the most common reactor type in the world.
An AGR has a graphite moderator helping to control the reaction. The reactor is
encased in a steel-lined pre-stressed concrete pressure vessel several meters thick
which also acts as a biological shield. The steam generator in which water is
heated is situated inside the pressure vessel. An AGR uses enriched uranium
dioxide encased in a stainless steel pin for its fuel and CO2 as its coolant.
A PWR is contained inside a steel pressure vessel filled with pressurised water
which acts as the moderator and coolant. The fuel used is enriched uranium
dioxide and is contained in zirconium alloy tubes.
(1) Source: Department of Energy & Climate Change Energy Trends, March 2015
Torness
Hartlepool
Dungeness B
Hunterston B
Heysham 1 & 2
Hinkley Point B
Sizewell B
Advanced Gas-cooled Reactor (AGR)
Pressurised Water Reactor (PWR)

90
Key figures: nuclear output in the UK
Generation Nuclear Nuclear key points
Nuclear New Build
Long-term provisions
Existing nuclear in France
Existing nuclear in the UK
Innovations
55.1
48.3
55.8
60.0 60.5
56.3
2009 2010 2011 2012 2013 2014
British Energy acquisition
Availability factor 2009 2010 2011 2012 2013 2014
Kd % 72% 63% 73% 78% 79% 72%
Extended outages at Dungeness B, Heysham 2 and Sizewell B
Steam generator central
support problems at Heysham
1 and Hartlepool
Output (TWh)

91
Key characteristics of the EDF Energy nuclear fleet
Generation Nuclear Nuclear key points
Nuclear New Build
Long-term provisions
Existing nuclear in France
Existing nuclear in the UK
Innovations
(1) World Association of Nuclear Operators
A nuclear fleet with an average age of 31 years Total power generation capacity of 8.9GW
An output of 56.3TWh in 2014
Nuclear safety is the over-riding priority Adequacy of each station confirmed at each statutory outage by the Office for Nuclear Regulation (ONR) that has to provide consent to
restart after each outage
Periodic safety review (PSR) undertaken every 10 years, also requiring ONR acceptance
Following events in Japan:
EDF Energy has completed evaluations required by WANO(1), responded to the ONR recommendations and to the EU Stress Test
EDF Energy concluded, with agreement from the ONR, that the fleet of existing stations is safe to continue operations. However
EDF Energy nuclear generation has specified and committed to deliver resilience enhancements to improve its ability to withstand
beyond design basis events. These enhancements were substantially completed by the third anniversary of the events in Japan
On track to deliver on life extensions target Life extension subject to review of safety, technical and economic factors
Target to extend the lives of the AGR by an average of 8 years, and Sizewell B by 20 years

92
EDF Energy nuclear power stations lifetimes
Generation Nuclear Nuclear key points
Nuclear New Build
Long-term provisions
Existing nuclear in France
Existing nuclear in the UK
Innovations
Note: the 8 year average described above is referenced against the plant lives at acquisition in 2009; Hartlepool/Heysham 1 have already been formally extended by 5 years in 2010, Hunterston/Hinkley by 7 years in 2012 and very recently Dungeness by 10 years.
2011
2012
2013
2014
2015
2016
2017
2018
2019
2020
2021
2022
2023
2024
2025
2026
2027
2028
2029
2030
2031
2032
2033
2034
2035
2036
2037
2055
Hinkley
Hunterston
Hartlepool
Heysham 1
Heysham 2
Torness
Dungeness
Sizewell
Period to planned closure
date (at acquisition in 2009)
Formal extensions since 2009
Expectation to achieve an average eight-years extension across the AGR fleet
(relative to planned closure dates at British Energy acquisition in 2009)

93
EDF Energy nuclear safety performance has improved significantly
Generation Nuclear Nuclear key points
Nuclear New Build
Long-term provisions
Existing nuclear in France
Existing nuclear in the UK
Innovations
0
0.2
0.4
0.6
0.8
1
1.22001/0
2
May-0
5
Nov-0
5
May-0
6
Nov-0
6
May-0
7
Nov-0
7
May-0
8
Nov-0
8
May-0
9
Nov-0
9
May-1
0
Nov-1
0
May-1
1
Nov-1
1
May-1
2
Nov-1
2
May-1
3
Nov-1
3
May-1
4
Nov-1
4
Lo
st tim
e a
ccid
en
ts p
er
20
0,0
00 h
ou
rs w
ork
ed
(man
-Sv p
er
year
and r
eacto
r)
UA
TR
(tr
ips p
er
7,0
00 h
rs c
ritical)
Lost Time Accidents
Benchmark – Q4 2014 (3yr rolling):
• WANO ISAR(1) (Paris Centre) = 0.32
• EDF Energy Nuclear Fleet ISAR Median = 0.13
EDF Energy nuclear employees
Contractors
(1) ISAR = Lost Time Incidents plus Restricted Time
Good
0.00
0.50
1.00
1.50
2.00
2.50
Jan-02 Jan-03 Jan-04 Jan-05 Jan-06 Jan-07 Jan-08 Jan-09 Jan-10 Jan-11 Jan-12 Jan-13 Jan-14 Jan-15
Good
Fleet 12-month UATR(2)
0.00
0.20
0.40
0.60
0.80
1.00
1.20
1.40
2005 2006 2007 2008 2009 2010 2011 2012 2013 2014
Good
(2) Unplanned automatic trip rate
Collective radiation exposure (3 year rolling values)

94
EPR: safe technological improvements
Generation Nuclear Nuclear key points
Nuclear New Build
Long-term provisions
Existing nuclear in France
Existing nuclear in the UK
Innovations
Safety:
Accident probability reduction (factor 10)
External hazard protection (shell able to resist an airplane crash)
Evolutionary design (core catcher)
Performance:
Annual generation boosted over 36%
Efficiency improvement (+3pts)
Increased availability (91%)
Radioprotection:
At least 40% cut in collective annual exposure
Environment:
Very important reduction in radioactive waste and gaseous and liquid discharges

95
EPR design improvements
Generation Nuclear Nuclear key points
Nuclear New Build
Long-term provisions
Existing nuclear in France
Existing nuclear in the UK
Innovations
Core catcher in case
of an accident
Shell able to resist
an airplane crash
4 independent
safeguard systems
Systems and
components
improvement

96
Update on the Flamanville 3 project
Generation Nuclear Nuclear key points
Nuclear New Build
Long-term provisions
Existing nuclear in France
Existing nuclear in the UK
Innovations
April 2015: AREVA and EDF have informed the (ASN) that a new series of tests is underway for the qualification of the Flamanville EPR reactor vessel head and bottom
□ This series of tests follows chemical and mechanical tests performed on a representative model of the reactor vessel head and bottom that showed that one of the criteria was not met in an area with greater than average carbon content. In parallel, work continues at the Flamanville EPR.
1 EPR of 1,650MW under construction
Commissioning scheduled for 2017
2014 - 2015 main steps:
□ Primary circuit: installation of the reactor vessel, of the pressuriser and of 4 steam generators; work on installation of the primary circuit
□ Completion of the first major tests facilities (command room, pumping station, etc.)
□ Intensification of electro-mechanic assemblies
□ Densification of trials on various plant systems

97
China Taishan 1 & 2 (EDF 30%)
Generation Nuclear Nuclear key points
Nuclear New Build
Long-term provisions
Existing nuclear in France
Existing nuclear in the UK
Innovations
Two 1,750MW EPRs under construction
Construction work completed as of 31 December 2014:
□ Unit 1: continuation of the safety review with the Chinese nuclear security authority to obtain commissioning authorisation
□ Unit 2: delivery of large components completed, installation of the tank in the reactor’s building and welding begun on the primary circuit
□ Installation of electro-mechanical equipment and tests of various systems on both units
□ Filling the cooling water supply pond
□ Commissioning of the control simulator on which control operators have passed their certification exam
Planned for 2015: □ Unit 1: end of works to install the first electro-mechanical equipment; first trials of the entire facility □ Unit 2: mounting of primary circuit; continuation of electro-mechanical installations and first trials

98
Nuclear New Build in the UK: Hinkley Point C
Generation Nuclear Nuclear key points
Nuclear New Build
Long-term provisions
Existing nuclear in France
Existing nuclear in the UK
Innovations
(1) In £2012
(2) Will be reduced by £3/MWh with no impact on Hinkley Point C’s IRR if a final investment decision on Sizewell C is made
State aid approval from the European Commission on 8 October 2014
□ Following examination of the deal, the European Commission approved the Hinkley Point C Contract for Difference (CfD) and the UK Government's proposed guarantee of project debt
□ Key elements of the agreements:
Contract for 35 years from commissioning date
Strike price: £92.5/MWh(1)(2) from commissioning date
Project status
□ Work has continued on the detailed engineering design for the power
□ EDF Energy has also reached agreement with contractors and unions on work conditions on site
Next steps
□ Finalisation of the full terms of the CfD and the financing arrangements for the project including the debt guarantee
□ Agreements with strategic and financial partners
□ Implementation of the waste transfer contract arrangements which must be approved by the European Commission

99
In the UK, Contracts for Difference (CfDs) can provide the certainty investors need to build new low carbon plants
Generation Nuclear Nuclear key points
Nuclear New Build
Long-term provisions
Existing nuclear in France
Existing nuclear in the UK
Innovations
Reduce market volatility and risks for investors
Offers a fair deal for consumers
Not a new mechanism
IPPs(1) in the 1990s
Used extensively during the Pool
Common in commodities trading
Can be tailored by technology’s risk profile
State aid is approved for most technologies
Implementation issues manageable
Open auctions to competition to fix prices (1) Independent Power Producer
2010 2015 2020 2025 2030 2035
Introduction Generator pays the difference
Difference paid to generator
Illustrative contract strike price
Power price (including carbon price support)
Illustrative Impact CfD on Revenues for Low Carbon Generators
(£/MWh) – starting 2018

100
What are nuclear long-term provisions?
Generation Nuclear Nuclear key points
Nuclear New Build
Long-term provisions
Existing nuclear in France
Existing nuclear in the UK
Innovations
EDF provisions as of 31 December 2014 are established in accordance with the requirements of the law of 28 June 2006, codified in articles L. 542-1 and subsequent of the French Environment Code and its implementing legislation published in 2007
Two categories of provisions can be distinguished:
Provisions for back-end nuclear cycle expenses, covering:
Provisions for spent fuel management, including the used fuel in the reactor not yet spread
Provisions for long-term management of radioactive waste (see below for more details)
Provisions for decommissioning and for last cores
Another way to look at it from a financial point of view is to separate them based on the necessity to cover the provisions with dedicated assets
Indeed, only provisions for decommissioning, for long-term radioactive waste management and a part of provisions for last cores are to be covered by dedicated assets (see financial section for more information on dedicated assets)
The rest of the provisions (mainly provisions for spent fuel management) are part of the operating cycle and are not subject to the dedicated assets constitution

101
The plant dismantling cycle: 3 key steps
Generation Nuclear Nuclear key points
Nuclear New Build
Long-term provisions
Existing nuclear in France
Existing nuclear in the UK
Innovations
Final shutdown
The first phase consists in unloading the fuel and draining all systems (after which 99.9% of the on-site radioactivity has been eliminated), followed by decommissioning (dismantling of decommissioned non-nuclear installations)
Partial dismantling
The second phase consists in dismantling all equipments and buildings (with the exception of the reactor building), the packing and shipment of all waste to storage and disposal facilities, isolation, containment and surveillance of the surrounding portion of the reactor
Full dismantling
This final phase involves the full dismantling of the reactor building and of the still radioactive materials and equipments
Phase
3
Phase
1
Phase
2
The duration and complexity of the three phases may vary according to the actual
scope of the work that needs to be done

102
EDF nuclear plants being dismantled
Generation Nuclear Nuclear key points
Nuclear New Build
Long-term provisions
Existing nuclear in France
Existing nuclear in the UK
Innovations
1 pressurized-water reactor (PWR) □ Chooz A (300MW): 1967-1991
1 heavy-water reactor (HWR) □ Brennilis (70MW): 1967-1985 (EDF/CEA)
6 natural uranium/graphite gas reactor
(NUGG) □ Chinon A1 (70MW): 1963-1973
□ Chinon A2 (200MW): 1965-1985
□ Chinon A3 (480MW): 1966-1990
□ Saint-Laurent A1 (480MW): 1969-1990
□ Saint-Laurent A2 (515MW): 1971-1992
□ Bugey 1 (540MW): 1972-1994
1 fast-neutron reactor (FNR) □ Creys-Malville (1,240MW): 1986-1997
NUGG
PWR HWR
FNR
Chooz
Bugey
Creys Malville
Brennilis St Laurent
Chinon

103
First PWR under decommissioning: Chooz A
Generation Nuclear Nuclear key points
Nuclear New Build
Long-term provisions
Existing nuclear in France
Existing nuclear in the UK
Innovations
1991-1999
1993
1999-2008
2007
2008
2012-2014
Plant shutdown, transfer of fuel to the reprocessing plant, surveillance phase
Publication of the decree for the definitive closure of the plant allowing the beginning of decommissioning works
“Non-nuclear part” (o/w turbine hall building) and nuclear annex buildings (excluding the reactor room) decommissioning
Publication of the decree for the complete dismantling of the installation
Dismantling and decontamination of the nuclear circuit (exlcuding nuclear vessel)
Pressuriser and steam generators extraction and expedition to ANDRA(1). End of the electromechanical equipment decommissioning in the caves housing the reactor and auxiliary equipment
Commissioned in 1967 and in operation until 1991, Chooz A plant is the first reactor of the PWR series to be decommissioned in France
2015 Preparatory work to the reactor vessel dismantling yard
(1) National Agency for the Management of Nuclear Waste (Agence Nationale pour la Gestion des Déchets Radioactifs)

104
Benchmarking vs. German plant operators
Generation Nuclear Nuclear key points
Nuclear New Build
Long-term provisions
Existing nuclear in France
Existing nuclear in the UK
Innovations
A direct comparison of nuclear provisions (dismantling and downstream cycle) in EDF’s accounts with German plant operators’ provisions is hindered by the important provisions aggregation reported by German plant operators
German plant operators’ higher level of dismantling provisions, when compared to their installed base, may be due to several factors:
The effect of discounting, as the French fleet is younger: a 10-year time lag lowers provisions by 25%
Differences in scope: in Germany, dismantling costs include the costs of building and operating an on-site spent fuel storage building
The series and processes standardization effect leads to a lower dismantling cost for PWR reactors than for all other types of reactors
Structural differences in organization and industrial choices: German reactors are of various types and are run in a decentralized manner, in contrast to the integrated and standardized fleet in France
EDF’s specific factors explain why its nuclear provisions are lower than
some other operators

105
Boiling Water Reactor and PWR comparison
Generation Nuclear Nuclear key points
Nuclear New Build
Long-term provisions
Existing nuclear in France
Existing nuclear in the UK
Innovations
BOILING WATER REACTOR(1) 6 reactors in Germany
A boiling water reactor (BWR) has more areas contaminated by primary circuit water and larger areas generating nuclear
waste than a pressurized-water reactor (PWR)
EDF PRESSURISED-WATER REACTOR(1)
Zone generating nuclear waste upon dismantling
Alternateur Turbine
Condenseur
(1) Basic diagram
Alternator Turbine
Condenser

106
The management of radioactive waste
Generation Nuclear Nuclear key points
Nuclear New Build
Long-term provisions
Existing nuclear in France
Existing nuclear in the UK
Innovations
(1) National Agency for Radioactive Waste Management
At the production site waiting for a special subsurface storage (from 15 to 200m) to be built. Commissioning in 2025.
VERY-LOW-LEVEL WASTE
(VLLW)
They come from the decommissioning of
nuclear installations (concrete, scrap,
piping, etc.)
On the surface at the Morvilliers storage
centre managed by ANDRA(1)
SHORT-LIVED INTERMEDIATE-
AND LOW-LEVEL WASTE
(SL-ILW and -LLW)
They come from maintenance works (tools,
clothes, dismantled parts, etc.); waste from the
processing of liquid and gaseous effluents of
operating plants; other deconstruction waste
On the surface at the Soulaines storage centre, managed by ANDRA(1)
HIGH-LEVEL WASTE
(HLW)
Metallic structures of the assemblies separated during the processing of spent fuel, other dismantling waste
LONG-LIVED INTERMEDIATE-LEVEL
WASTE
(LL-ILW)
Non-recyclable material from the processing of spent fuel
At the production site for the waste
generated from operation and storage at
the ICEDA (Installation d’Entreposage et de
de Conditionnement des Déchets Activés)
for deconstruction waste.
Storage: Cigéo (Centre Industriel de Stockage Géologique). Beginning of the pilot industrial phase in 2025
They essentially are graphite waste from the dismantling of first generation plants
LONG-LIVED, LOW-LEVEL WASTE (LL-LLW)
SHORT-LIVED WASTE Their radioactivity is halved over a
period of 31 years or below
90% of waste 0.1% of radioactivity
LONG-LIVED WASTE Their radioactivity is halved over a
period of more than 31 years
10% of waste 99.9% of the radioactivity
TYPE OF WASTE EXAMPLE POSITION/STORAGE
Temporarily stored in dedicated installations in
La Hague site of AREVA, waiting for a
decisions on the deep geological waste
storage (Cigéo). Beginning of the pilot
industrial phase in 2025

107
What does long-term management of radioactive waste cover?
Generation Nuclear Nuclear key points
Nuclear New Build
Long-term provisions
Existing nuclear in France
Existing nuclear in the UK
Innovations
Evacuation and storage of radioactive waste from the dismantling of nuclear facilities
Evacuation and storage of radioactive waste from the treatment of spent fuel in La Hague
Long-term warehousing and direct storage of the not recyclable fuel on an industrial scale in existing facilities
EDF share of evaluation costs and costs of coverage, closure and supervision of storage centers:
Existing centers for very low-level, low-level and intermediate-level radioactive waste (VLLW, LLW and ILW)
Centers need to be created for long-lived low-, intermediate- and high-level radioactive waste (HLW/ILW-LL)

108
Cigéo, a project for reversible deep-storage of French radioactive nuclear waste
Generation Nuclear Nuclear key points
Nuclear New Build
Long-term provisions
Existing nuclear in France
Existing nuclear in the UK
Innovations
Pursuant to article L.542-1 of the French Environment Code, EDF is technically and financially responsible for its radioactive waste. ANDRA (National Agency for Radioactive Waste Management) is in charge of this waste and is responsible for the design, construction and operation of storage sites. The waste type is established according to two criteria:
□ Their level of radioactivity: high level, intermediate level, low level and very low level activity
□ The time required for the radioactivity of radionuclides to be divided by two: short-lived and long-lived waste
Regarding long-lived waste, EDF works in close collaboration with ANDRA in order to implement a storage solution that is safe and cost effective. EDF anticipates the Cigéo financing by constituting secured provisions through dedicated investments in order to ensure funds to be available when needed and make ANDRA benefit from EDF experience as a nuclear operator in the project design. This cooperation is spelled out in an agreement signed between ANDRA, EDF, AREVA and the CEA.
Provisional timeframe: □ 18 December 2014: launch of the formal consultation process of nuclear operators on the project and its opinion
□ First half of 2015: formal consultation of waste producers on project figures, followed by a ministerial order from the French Ministry of the Environment, Sustainable Development and Energy for the evaluation of costs
□ 2015-2017: authorisation request to build Cigéo set-up and submitted by ANDRA
□ 2020: beginning of construction works of Cigéo facilities
□ 2025: beginning of the industrial pilot phase
□ 2030: beginning of Cigéo operation subject to the approval of the Nuclear Safety Authority

109
Innovation: nuclear generation (1/2)
Generation Nuclear Nuclear key points
Nuclear New Build
Long-term provisions
Existing nuclear in France
Existing nuclear in the UK
Innovations
The project: circuits in all nuclear power plants are tested regularly for leakages and to ensure they can withstand high pressure, both to comply
with regulation and to guarantee high safety levels. Generally, in order to isolate the area of piping to be examined, the relevant section has to be
cut out and welded back in again, making repairs lengthy and complicated. But now these difficulties have been addressed by a "multi-element
plug" tool developed and patented by EDF. Once inserted into the circuit, it temporarily "plugs" the relevant pipe without any need for
modifications. It is even possible to plug a pipe wider in diameter than the entrance through which the tool is inserted. The "self-sealing" plug
offers the same impermeability and pressure resistance as traditional leak plugging measures. The tool is particularly useful during hydraulic
tests on the impermeability and strength of the primary circuit.
Testing the impermeability of circuits without cutting them
3D model of how the tool operates
Benefits:
- Time saved estimated to be several weeks during hydraulic testing (16 hours
instead of 200 hours for the traditional method)
- Lower repair costs and simpler maintenance through the avoidance of
welding, grinding and handling
- Lower risk of exposure to ionising radiation, due to the fact that x-rays are not
needed to check the quality of new welding
Project implementation: The tool was successfully used at the Cattenom plant
and will next be introduced at Flamanville and Nogent before being rolled out to
all nuclear facilities.
Maximum allowed pressure
35bars, corresponding to 462t

110
Innovation: nuclear generation (2/2)
Generation Nuclear Nuclear key points
Nuclear New Build
Long-term provisions
Existing nuclear in France
Existing nuclear in the UK
Innovations
The project: until now loading and removing fuel into and from a nuclear reactor could only be carried out during unit
shutdowns, with correct handling equipment in a controlled area. So, to improve its existing training programme, EDF
developed a virtual tool which simulates the loading and removal of fuel. The tool is based on software which recreates the
working environment of each person at work in the fuel handling process. The training interface comprises 5 networked
touchscreen tablets, one for each participant. The programme is designed to improve coordination between the activities of
each participant. Trainers can modify the programme to change the exercises in real time, thereby ensuring that the training
covers all possible scenarios.
Benefits:
- It is possible to organise training sessions at any time, without regard to unit shutdown times
- It eliminates any exposure to ionising radiation as the training sessions are held outside the nuclear zone
- It does not affect the scheduling of unit shutdowns, thanks to more regular simulation exercises
Project implementation: because it relies on standard technology (tablets), this training programme can be implemented
in any nuclear plant. In 2015 the tool will be made available to 900 MW series and then expanded to other sites.
Virtual "Fuel Handling" Training

111
EDF main businesses
Generation
Nuclear generation
Renewable generation
Key points of renewable generation 112
Hydropower and innovations 114
Other renewables and innovations 122
Generation Renewable Nuclear Thermoelectric EDF main businesses

112
A leader in hydropower and other renewable energies
Renewable generation Hydropower and innovations
Renewable generation’s key points
Other renewables and innovations Generation
Europe’s leading hydropower producer
• 239 dams and 436 hydropower plants in mainland France
• 47 hydroelectric plants in Italy
Architect and lead contractor on international hydro projects
• EDF owns 40% of Nam Theun 2 Power Company (NTPC), owner of the hydro plants complex of Nam Theun 2 (for a total of 1,070MW)
• 12 December 2014: EDF, through its subsidiary EDF Norte Fluminense, acquires 51% stake in the SINOP Energy Company, which is responsible for the construction and future operation of the hydroelectric facility of SINOP (400MW), in the North of the Mato Grosso State in Brazil. The construction of this dam began in spring 2014 and its commercial commissioning is scheduled for the second half of 2017
A major player in the green energies market
• The EDF group is among the world’s top five companies for renewable energy, with an installed capacity of over 28GW (mainly in hydropower)
• Historically, EDF Energies Nouvelles (EDF EN) has developed its business in Europe and North America. Since 2012, the Group has been established in new countries such as South Africa, Morocco, Israel, Poland and India
Wind power and photovoltaic solar: supporting a growing industry
• Wind offshore: in France, in April 2012, three of the French government’s four wind power projects were awarded to the consortium headed by EDF EN as part of the first tenders for offshore wind power in 2011 (1,500MW)

113
EDF: major positions in renewable energies
Renewable generation Hydropower and innovations
Renewable generation’s key points
Other renewables and innovations Generation
65 MW 230MW 303MW
931MW
326MW
1,870MW 1,101MW
356MW
210MW
3MW 464MW
48MW
A diversified portfolio of renewables with approximately 28GW(1) of net installed capacity
19,947MW
1,360MW
69MW
MW Hydro MW Other renewables
49MW
60MW
Net consolidated capacity as of 31 December 2014
228MW
8MW India
(1) Excluding Corsica and French overseas departments
Note: All figures are consolidated
Sources: EDF, EDF EN

114
Hydropower in the EDF group
Renewable generation Hydropower and innovations
Renewable generation’s key points
Other renewables and innovations Generation
~20,387
~74
~1,358
~2
~69
~30
~2,545
~1,070
Nam Theun 2
Estag
Alpiq
Edison(3)
Fenice
EDF SA(1)
EDF EN(2)
EDF Luminus
Installed capacity at the end of 2014 (non consolidated data)
(1) Including French Island activities and the Rance power plant, excluding EDF EN
(2) The EDF EN figure includes the whole worldwide installed capacities, France included
(3) Including 125MW in Switzerland
Note: these figures include non-controlling interests
In MW In MW

115
EDF’s hydropower fleet in France
Renewable generation Hydropower and innovations
Renewable generation’s key points
Other renewables and innovations Generation
EDF’s hydropower fleet in France is comprised of 436 power plants with an average age of 70 years
Net output in 2014 = 37.5TWh(1) (excluding Corsica and the French overseas departments, equivalent to 1.3TWh in 2014)
Benefits of hydropower:
Speed, availability and flexibility
Renewable energy: annual savings of 3.23 million ToE (tons of
oil equivalent)
Water storage capacity (peak energy, cold source for thermal
and nuclear generation)
Ability to provide system services to the network (frequency and
voltage adjustments)
(1) Net pumping output: the consumption of electricity required for the running of the energy transfer pumping stations (STEP) is of 7.9TWh in 2014, which leads to a hydro output not
corrected for the consumption related to pumping of 45.4TWh and including the tidal power generation of the Rance (518GWh)

116
Different types of hydropower facilities
Renewable generation Hydropower and innovations
Renewable generation’s key points
Other renewables and innovations Generation
Run-of-river
No storage capacity
Energy generation depends solely on the current water condition
Pondage water
Average sized water reserve, intended for an occasional use during the week or the day
Generation is concentrated at peak hours
Reservoirs
Large storage capacity
Influence on downstream power plants, which calls for a management of valley stations (located in mountain ranges)
Pumped storage (STEP)
Water is pumped from a downstream reservoir to an upstream one to create a reserve available during off-peak hours
Water is then turbined from the upstream reservoir to the downstream one during periods of high demand
EDF disposes of numerous hydropower facilities, able to meet base-load and peak demand, designed to optimise the use of water resources

117
EDF’s hydropower fleet in France
Renewable generation Hydropower and innovations
Renewable generation’s key points
Other renewables and innovations Generation
8.8
3.6
3.1
4.2
0,24
Reservoirs STEP
Run-of-river
Pondage
Installed capacity ~20GW(1)
20% of the overall EDF generation capacity in France
15.8
17.1
8.8
1.1 0.5
Reservoirs
STEP
Run-of-river
Pondage
Average producible hydropower output(3): ~43.5TWh
10% of the average EDF output in France
In GW In TWh
(1) Excluding Corsica and the French overseas departments, equivalent to 440MW
(2) The tidal power plant of the Rance generates electricity by using the up and down movement of the tides
Tidal(2) Tidal(2)
(3) Average producible hydropower output: maximum quantity of energy that can be generated
from the water sources (rain, snow) over one year, on average on the 1960-2010 period

118
A producible hydropower output dependant on the weather
Renewable generation Hydropower and innovations
Renewable generation’s key points
Other renewables and innovations Generation
(1) Producible hydropower output: maximum quantity of energy that can be generated from water sources (rain, snow) for a given period
In TWh
1989: lowest producible hydropower output(1) in the last 25 years 1994: highest producible hydropower output(1) in the last 25 years
0
1
2
3
4
5
6
7
8
Jan. Feb. March Apr. May June July Aug. Sept. Oct. Nov. Dec.
1989 - 30.5TWh
1994 - 53.2TWh
2013 - 48.0TWh
2014 - 43.6TWh

119
Hydroelectric concessions in the framework of the energy transition law
Renewable generation Hydropower and innovations
Renewable generation’s key points
Other renewables and innovations Generation
On 22 April 2010, the Ministry for Ecology, Energy, Sustainable Development and the Sea announced the scope for the renewal of the hydroelectric concessions: ten concessions with a cumulated power of 5,300MW (equivalent to approximately 20% of the French hydropower fleet), o/w 4,300MW operated by EDF, are involved
In order to put together those concessions per valley, the French State has decided that half of EDF concessions (2,150MW and 3.5TWh approximately) have to be renewed earlier. Outgoing operators will receive compensation for the lost income stemming from the early termination of the concession, in accordance with the terms of the concession agreement
The draft bill on energy transition for green growth, adopted by the National Assembly in the first reading on 14 October 2014 has rounded out the existing competitive bid procedure, giving the French State the opportunity to:
Group concessions forming a “chain of hydraulically linked facilities” and, for grouped concessions, determine the concession end date; that date should guarantee an economic equilibrium for the existing concession owner
Set up semi-public hydroelectric companies made up of private operators and a public partner (the State, local authorities, etc.), each holding at least 34% of the share capital
Extend certain concessions in exchange for investments on the part of the operators in connection with the energy transition
EDF is preparing itself to submit its best offer for each concession, combining improved energy efficiency, attention to the environment (water resources, aquatic environments, etc.), compensation of the government and municipalities through fees and regional development, while ensuring safety and taking into account the social component

120
Innovation: hydroelectric power generation (1/2)
Renewable generation Hydropower and innovations
Renewable generation’s key points
Other renewables and innovations Generation
The project: as part of the Monistrol d'Allier concession renewal, EDF co-designed a large-scale
redevelopment of the Poutès dam, in close collaboration with local stakeholders. The aim was to
reconcile CO2-free electricity generation with the conservation of the Allier's unique biodiversity. The
project is innovative in many ways and is particularly notable for its governance model based on
strategic decision-making by consensus of the interested parties (the State, elected officials,
environmental associations, biodiversity experts, etc). On a technical level, the project boasts an
innovative mix of complementary solutions including:
- lowering the height of the dam from 17 to 4 metres to restore the Allier's appearance as a free-
flowing river
- building channels to allow fish to swim up and down the river
- measures to facilitate the movement of sediment necessary to ensure the right balance in the river
Once the redevelopment is complete, the dam’s integration in the Allier ecosystem will be subject to
close scientific monitoring.
Benefits:
- it retains 85% of the power generation capacity of the old dam
- it is a model hydroelectric plant meeting both economic and environmental challenges
Project implementation:
Working methods and the model of governance with local stakeholders are directly applicable to other
hydroelectric projects.
The new Poutès dam: built for and by the local communities
The dam following redevelopment.
The new facility will stand at 4m, down from 17m currently.
The Poutès dam currently.

121
Innovation: hydroelectric power generation (2/2)
Renewable generation Hydropower and innovations
Renewable generation’s key points
Other renewables and innovations Generation
Benefits:
- more efficient management of low water levels ensures water resources are conserved and power generation continues
- financial benefits for local authorities: thanks to more efficient water releases, local authorities can control spending on water level
management
Project implementation: E-tiage is currently being tested in the Lot river valley. In 2015, it will be offered to local authorities responsible for low
water level management in South-West France, ahead of testing in 2016.
Low water replenishment online Releases of water from a hydraulic dam
The project: hydroelectric dams play a major role in regulating water flow. When water flow
reaches exceptionally low levels (known as "étiages" in French), it can be replenished by releases
of water. To assist the relevant authorities (departmental councils, river associations, etc) in this
process, EDF developed an IT application called "E-tiage" which simulates releases of water and
their effects on the river. With continuous access to updated hydrological data, the tool is able to
make reliable forecasts and aid decision-makers in ordering low water level replenishment.
PERFLEX: Real time optimisation of hydroelectric generation in the Rhine valley
The project: EDF developed a pilot system called PERFLEX, which optimises the contributions of 10 factories in the Rhine valley in real time to
accurately track the area and safeguard the stability of the electricity network. The solution also provides 10% of the second national reserve
(which can be used to maintain a balance between power generation and consumption).
Benefits: The innovation generates a €3 million financial gain (through supply of reserves and enhanced programme monitoring).
Project implementation: PERFLEX can be applied to other facilities connected to the river and will soon be patented to be exported abroad,
as for example in the framework of tendering processes.

122
EDF Energies Nouvelles: financial and operational indicators evolution since 2010
Renewable generation Hydropower and innovations
Renewable generation’s key points
Other renewables and innovations Generation
3,423
7,517
6.1
9.8
460
690
EBITDA Total output
2010 2014
In TWh In millions of Euros
2010 2014 2010 2014
x1.6
Gross installed capacity
In MW
x1.5 x2.2

123
EDF EN net installed capacity as of 31 December 2014
Renewable generation Hydropower and innovations
Renewable generation’s key points
Other renewables and innovations Generation
Source: EDF EN
(1) O/w 50MW net in South Africa, 73MWp net under construction in Chile and 40MWp net in India
NB: MWp: Megawatt peak (a measure of power under standard temperature and sun conditions)
Wind installed (MW)
Solar installed (MWp)
Wind and solar under construction (MW)
Other sectors
Operating 208MW
Under construction 19MW
Gross Net Installed capacity: 7,517MW 5,112MW
Capacity under construction: 2,204MW 1,885MW(1)
Total: 9,721MW 6,997MW
47MWp 230MW 303MW
11MW
247MW 77MWp
314MW 12MWp 44MW
1,695MW 89MWp 1,077MW
185MW 19MW
30MW
228MW 24MW
3MW
440MW 23MWp 274MW
48MW 86MW
49MWp 60MW
666MW 211MWp 108MW
8MWp India

124
EDF EN: installed and under construction capacity by type as of 31 December 2014
Renewable generation Hydropower and innovations
Renewable generation’s key points
Other renewables and innovations Generation
(1) Gross capacity: total capacity of the fleets in which EDF Energies Nouvelles has a shareholding
(2) Net capacity: capacity equivalent to the shareholding of EDF Energies Nouvelles
In MW Gross(1) Net(2)
as of 31/12/2013 as of 31/12/2014 as of 31/12/2013 as of 31/12/2014
Wind 5,735 6,554 4,019 4,388
Solar 645 727 542 516
Hydro 80 77 77 74
Biogas 70 78 65 73
Biomass 62 62 54 54
Cogeneration 19 19 7 7
Total installed capacity 6,611 7,517 4,764 5,112
Wind under construction 1,767 1,735 1,434 1,635
Solar under construction 191 450 116 231
Other under construction 28 19 28 19
Total capacity under
construction 1,986 2,204 1,578 1,885
Total 8,597 9,721 6,342 6,997

125
EDF EN: net installed capacity evolution
Renewable generation Hydropower and innovations
Renewable generation’s key points
Other renewables and innovations Generation
Commissioning in 2014
Wind
USA 361MW net
Canada 484MW net
France 75MW net
Turkey 71MW net
Mexico 30MW net
United Kingdom 12MW net
Photovoltaic
USA 39MW net
Israel 34MW net
India 8MW net
France 5MW net
Main acquisitions in 2014
Other sectors
France 7MW net
USA 1MW net
France
Plein Vents 70MW net
Gross Net
Commissioned capacity 1,289MW 1,127MW

126
EDF EN: net capacity sold
Renewable generation Hydropower and innovations
Renewable generation’s key points
Other renewables and innovations Generation
(1) O/w sold: 798.5, including Plein Vents reintegration for (70.4)
In MW 2013 2014 France - (70)
Germany - -
United Kingdom 58 29
Italy - 108
Turkey - 38
United States 103 197
Canada 115 309
Mexico 162 -
Total wind 438 610
France + overseas departments 28 -
Italy 10 19
Canada - -
United States - 99
Total photovoltaic 38 118
France 4 -
Total hydro 4 -
Total 480 728(1)

127
Operation & Maintenance(1) as of 31 December 2014
Renewable generation Hydropower and innovations
Renewable generation’s key points
Other renewables and innovations Generation
(1) MW corresponding to the renewable energies power plants that EDF EN operates and maintains (power plant supervision, generation monitoring, pre-emptive and
corrective maintenance, etc.) for its own account and on behalf of third parties
na: not applicable
In MW 2013 2014 ∆ MW ∆%
United States 6,191 7,480 1,289 21%
Canada 1,124 1,807 683 61%
Mexico 68 68 - -
Total America 7,383 9,354 1,971 27%
France 1,390 1,441 51 4%
United Kingdom 67 164 97 143%
Greece 150 150 - -
Italy - 599 599 na
Poland 48 48 - -
Total Europe 1,656 2,402 746 45%
Total O&M 9,039 11,756 2,717 30%

128
Innovation: renewable generation (1/2)
Renewable generation Hydropower and innovations
Renewable generation’s key points
Other renewables and innovations Generation
The project: following a request from EDF EN, teams from the UK R&D centre came up with a turnkey solution for wind measurement, the floating LIDAR, which aims to improve evaluation of offshore wind farm generation capacity in France and the United Kingdom. It is a laser measurement solution, based on a floating buoy, which is cheaper, more mobile and better performer than traditional weather masts fixed to the sea floor. LIDAR is able to measure wind speeds up to a height of 200m, which is the height of the top of wind turbine blades, whereas traditional masts can only measure up to 100m in height. Further, it can take measurements at wind farms located in deep water, while traditional masts are only able to operate in areas with a depth of no more than 50m. Benefits: because it is not anchored to the ground, LIDAR can easily be moved and re-used in several areas, reducing wind measurement costs (representing €8m in savings compared with a weather mast).
Project implementation: two units have been ordered for the Fécamp and Courseulles-sur-mer sites in the English Channel. A third project hopes to use the device in the Mediterranean. The UK R&D centre team chose the right disruptive innovation, adapted it according to need and ensured it provides accurate data. A framework contract for the technology, with 5-year price guarantees, has now been signed.
(1) LIDAR is acronym borrowing from RADAR. It stands for Light Detection and Ranging. It is a laser beam which reflects off moving air particles and measures wind speed and direction
remotely, using the Doppler effect.
Offshore wind turbines: a revolution in offshore wind measurements

129
Innovation: renewable generation (2/2)
Renewable generation Hydropower and innovations
Renewable generation’s key points
Other renewables and innovations Generation
The project: the Badaling power plant near Beijing is a demonstration site aimed at maximising concentrated solar power (CSP) for electricity generation. With a 1.5MW capacity, Badaling is now the primary plant on this scale in Asia. The system addresses issues stemming from the intermittent nature of solar power. Mirrors focus the sun's energy towards a tube containing a fluid which is heated up and then releases water vapour which drives a turbine attached to a generator. An oil and water storage system extends the operating time of the plant by several hours, even after sunset.
The Badaling solar thermal power plant
Applications for EDF: a joint research programme was launched in 2012 by the Institute of Electrical Engineering from the Chinese Academy of Science (IEE-CAS) and EDF, via the Beijing R&D centre. A new agreement was signed in 2014 which extends the scope and duration of the first agreement. The partnership is an opportunity for EDF group to increase its skills in the thermodynamic solar sector, as a part of EDF group's short-term investment plans.
One challenge will be to further develop R&D modelling methods on the basis of those used in experiments at the Badaling site.

130
Thermoelectric generation
EDF main businesses
Generation
Nuclear generation
Renewable generation
Overview 131
Focus on France 133
Focus on international activities 136
Innovations in thermoelectric generation 137
Generation Renewable Nuclear Thermoelectric EDF main businesses

131
Fossil-fired generation remains the number one source of electricity generation in the world
Generation Focus on France Overview Focus on international Thermoelectric generation Innovations
Source: IEA 2014 World Energy Outlook – New Policies Scenario
In TWh
0 2000 4000 6000 8000 10000 12000 14000
Oil
Other renewable energies
Nuclear
Hydro
Gas
Coal
2040
2035
2020
2012
2,000 4,000 6,000 8,000 10,000 12,000 14,000

132
EDF is well positioned to meet new challenges of fossil-fired generation
Generation Focus on France Overview Focus on international Thermoelectric generation Innovations
EDF experience in fossil-fired generation is reflected by existing assets and current investments in France and abroad
An important part of the energy mix of the Group (26% of the installed capacity) that varies between countries (13% of the installed capacity of EDF in France and around 74% in Italy)
Plants/IPPs development in Asia (China, Vietnam), South America (Brazil) and Europe
Development of gas thermoelectric plants: construction of CCGTs (4 in France and 3 in the UK)
Thermoelectric power contributes to the low-carbon strategy of the Group
Development of more efficient combined gas plants (reduction by 30% of the carbon emissions per kWh produced, three times less nitrogen oxide and very little sulphur and dust)
Involvement in the highly-efficient coal technology with better environmental performances (partnership with Datang for the construction and operation of a supercritical power plant of 2,000MW in Fuzhou)
Modernisation of the most recent coal-fired units in France to extend their lifespan up to 2035, and increase their availability and performances
Final shutdown of the 10 oldest coal units between March 2013 and April 2015
R&D focusing on carbon capture (CCS), with a pilot unit in Le Havre (France)
The development of thermoelectric power relies on the best available technologies
In 2013 in France: beginning of the construction of the Bouchain CCGT (575MW), with commissioning scheduled for 2016. This CCGT will be the first to be equipped with the most efficient combined-cycle gas turbine developed by GE, the 9HA. This new technology allows the plant to reach maximum power in under 30 minutes, with a high yield performance (61%)
Did you know?
EDF existing fleet
~35(1)GW Installed in the world
~22GW Made up of fuel- and coal-
fired plants
~13GW Made up of gas-powered plants (incl. cogeneration)
(1) Net generation capacity as of 31 Decembre 2014

133
328
102
17
EDF group specific carbon emissions vs. Europe
Generation Focus on France Overview Focus on international Thermoelectric generation Innovations
(1) Source: PWC study - December 2014
(2) Mainland France and Island Energy Services, excluding island generation
Europe (2013)(1)
EDF group (2014)
EDF (2014)(2)
g/kWh

134
EDF thermal plant fleet in mainland France
Generation Focus on France Overview Focus on international Thermoelectric generation Innovations
Le Havre Bouchain
Vaires /Marne
Porcheville
Blénod
Aramon
Martigues
Dirinon
Brennilis
Cordemais Arrighi
Montereau
Gennevilliers
Paris
6 5
4 2 3 5
2 3 4
1 2
1 2 3 4
4
1 2 3
1 2
1 2
1 2
1
• Coal-fired plants
Three 600MW units
• Fuel-fired plants
Four 600MW units
Four 700MW units
• CCGT
Three CCGT totalling 1,360MW
575MW of CCGT under construction (Bouchain in 2016)
• Combustion turbines
Thirteen turbines totalling 1,843MW
~ 10GW(1) (excl. overseas departments and Corsica) divided as follows:
(1) Data as of 30 April 2015

135
An industrial project for a better environmental performance
Generation Focus on France Overview Focus on international Thermoelectric generation Innovations
12
0
2
4
6
8
10
1990 2000 2010 2016 2020
1,200
1,000
800
600
400
200
0
Atmospheric emissions of the French thermal plant fleet
(kg/MWh)
Dust
Nitrogen oxide (NOx)
Sulphur oxide (SOx)
CO2
(kg CO2/MWh)

136
EDF group thermal plant fleet
Generation Focus on France Overview Focus on international Thermoelectric generation Innovations
Displayed figures are of the net installed capacity
EDF Group installed capacity in 2014 (excluding Dalkia)
EDF realisations subsequently sold
VIETNAM 403MW CCGT Phu My (2005)
CHINA 1,728MW Laibin (2000) Shandong (Heze & Liaocheng) (2003-04) Sanmenxia partnership (since 2009) Fuzhou (under construction)
EGYPT 1,360MW GAZ Suez & Port Saïd (2003)
MEXICO 2,300MW
CCGT Altamira 2 CCGT Rio Bravo 2-3-4
CCGT Saltillo (2001 to 2005)
BRAZIL 810MW
CCGT Norte Fluminense (2004)
GREAT BRITAIN 5,480MW
CCGT West Burton (2012)
NETHERLANDS 435MW CCGT Sloe (2010)
ITALY 4,126MW CCGT Piombino (2000) Repowering CCGT (7 projects 2004-2012) CCGT Candela and Altomonte (2005), Torviscosa (2006), Simeri Crichi (2007) Repowering Porto Viro (2013)
POLAND 2,510MW CCGT Zielona Gora (2004)
BELGIUM 906MW TAC HAM GT3 (2008)
FRANCE 9,970MW
CCGT Blénod (2011) Repowering CCGT Martigues
5 and 6 (2011-2013) CCGT Bouchain (2016)
HUNGARY 810MW CCGT Ujpest (2002) CCGT Kelenfold (2006)
Legend:
SPAIN 94MW

137
Innovation: thermal power generation
Generation Focus on France Overview Focus on international Thermoelectric generation Innovations
The project: pumping systems are essential in a thermal power plant to ensure that the
plant's equipment works properly. Operating regulations stipulate that before any
technical procedure the pumps must be isolated from the fluid being discharged (e.g.
water at high pressure and temperature) by a double barrier. The main challenge is
ensuring the safety of those assisting in the procedure. Most pumps in more recent plants
have two valves which allow the fluid evacuation pipe to be closed off. However, older
power stations only have one isolating valve, meaning generation has to be stopped to
allow maintenance to be carried out. Teams at the Bouchain thermal power plant
designed a device which safely isolates the necessary equipment while the unit is
operating, in compliance with operating regulations. The solution involves inserting a
mechanical part designed to block the moving parts of the pump from within, therefore
preventing fluid from escaping.
Maintenance with no need to stop generation
Benefits:
‐ It avoids several days of shutdown, as the unit can operate while pump maintenance is being carried out (in some cases shutdown can be
as long as 75 days)
‐ Ease of use: the blockage system can be inserted and removed in 4 hours during a weekend shutdown
‐ It is a mechanical solution, which is cheap and easy to roll out to other sites
Project implementation:
After a first use at the Bouchain thermal power plant in 2013, this innovative solution will be implemented across all thermal power plants.
Pump maintenance in a thermal power plant

138
Generation
EDF main businesses
142
143
Focus on transmission
Focus on distribution
Networks - Transmission and Distribution
139 Overview
147 Innovations in the network field
EDF main businesses Generation Networks Optimisation - Trading and Supply Gas Energy services

139
Key expertise in networks
Networks Focus on transmission
Overview Innovations Focus on distribution
EDF main businesses
Electricity transmission France: through RTE, the French electricity transmission network operator, which owns 100,000 km of
high and very high voltage power lines and 46 cross-border lines
Electricity distribution France: through ERDF, which owns a network of ~1.3 million km of lines, Electricité de Strasbourg
(14,000 km) and EDF SEI (35,415 km)
Hungary: through Demasz ZRt which owns close to 32,200 km of high-, medium- and low-voltage lines and operates the regulated electricity distribution business in Hungary’s south-eastern region (19.6% of the territory)
Increasing use of delegated management partnerships: e.g. agreement signed with the Russian power distribution operator Rosseti to study a joint network management opportunity in one of the Russian region. In 2014, EDF International Networks and Rosseti signed an agreement to extend the scope of their cooperation
Evolving business model to take into account various new decentralized generation solutions and allow customers to manage their consumption more closely

140
Tariffs for Using the Public Electricity Transmission and Distribution Networks (TURPE)
Networks Focus on transmission
Overview Innovations Focus on distribution
EDF main businesses
The general principle of TURPE is to cover operating costs and give a return on capital invested.
TURPE Distribution
By the CRE decision of 12 December 2013, the new TURPE 4 HVA-LV distribution tariffs came into force on 1 January 2014 for a period of four years. The transmission tariffs for the distribution network rose, on average, by +3.6% on 1 January 2014, and will then be adjusted automatically on 1 August each year over the 2014-2017 period. The application of this mechanism in 2014 led to a 1.3% tariffs fall as of 1 August 2014
The CRE renewed the “CRCP” mechanism (“Compte de Régulation des Charges et des Produits” − account for regulating income and expenses), making it possible to measure and offset, for previously identified items considered difficult to forecast or control, the differences between the effective data and the forecasts on which the tariffs are based
The regulator set out to reinforce the existing framework for multi-annual regulation, which prompted ERDF to improve its cost control and the quality of supply and of services provided to users
TURPE Transmission
The current tariff for using the public transmission network (TURPE 4 HVA), set by the CRE decision of 3 April 2013, came into force on 1 August 2013. After an increase of 2.4% at the date of its entry into force, RTE’s tariff revenues thus fell by 1.3% at 1 August 2014. A change to this tariff based on the consumer price index will take place on 1 August 2015 and 2016
Financial compensation from RTE’s assets is obtained by multiplying the amount of the Regulated Assets Base (RAB), estimated at €12,143 million as of 1 January 2014, by a nominal rate before tax of 7.25% for the 2013-2016 tariff period.
As for the TURPE Distribution, the CRE renewed the “CRCP” mechanism relating to the transmission TURPE, with the same functioning and conditions

141
Regulated asset base in France
Networks Focus on transmission
Overview Innovations Focus on distribution
EDF main businesses
(1) CPI: Consumer price index covering all of France excluding tobacco of year Y-1
K: CRCP reconciliation term, in range of +/- 2% (CRCP: The CRCP mechanism (Compte de Régularisation des Charges et des Produits) corrects, across years, the differences
between forecasted and effective expenses and products)
(2) Excl. financial assets and assets under construction
Under Turpe 3, tariffs included only industrial D&A’s. Under Turpe 4, provision for renewal as well as all D&A are included
(3) Difference between regulated assets and the sum of specific accounts, provisions for renewal and investment subsidies
Transmission
NBV of fixed assets(2) =
€46.3bn
NBV of regulated equity(3) =
€3.7bn
Distribution
Regulated Asset Base as of
01/01/2015
Nominal remuneration rate
before corporate tax
Margin on assets: 2.5%
Risk-free rate: 6.1%
NBV of fixed assets(2) =
€12.8bn 7.25%
+2.4% as of 01/08/2013
-1.3% as of 01/08/2014
Indexation
CPI + K(1)
+3.6% as of 01/01/2014
-1.3% as of 01/08/2014

142
TURPE Transmission: expenses/revenues details and RAB evolution (according to the CRE decision on TURPE 4 Transmission on 3 April 2013)
Networks Focus on transmission
Overview Innovations Focus on distribution
EDF main businesses
(1) Current RAB as of 1 January of each year: the RAB represents the carried-out investments minus depreciation charges (covered by the tariffs), investment subsidies and
deferred income from Arteria, a RTE subsidiary
In current millions of Euros 2015 2016
Tariff revenue 4,397 4,495
Expenses to be recovered by the tariff 4,369 4,555
In current millions of Euros 2015 2016
Regulated asset base (RAB)(1) 12,688 13,332
O/w investments 1,711 1,769
O/w depreciation (728) (772)
Evolution of expenses to be recovered provided under TURPE Transmission for 2015 and 2016
RAB evolution provided under TURPE Transmission for 2015 and 2016
Yearly indexation TURPE 4 (CPI + K). Tariff is adjusted every year on the implementation date of TURPE 4. After an initial
increase of 2.4% on 1 August 2013, RTE’s tariff revenues thus fell by 1.3% on 1 August 2014 Yearly indexation on 1 August based on the formula: CPI + K
CPI = Consumer price index in France excluding tobacco of Year N-1
K = CRCP reconciliation term (in a range of +/-2%; the non-cleared amounts being deferred if needed to the following year)

143
TURPE Distribution: expenses/revenues details and RAB evolution (according to the CRE decision on TURPE 4 Distribution of 12 December 2013)
Networks Focus on transmission
Overview Innovations Focus on distribution
EDF main businesses
(1) RAB as of 1 January of each year: RAB increases every year by the amount of investments carried out, minus depreciation
(2) RE as of 1 January of each year: regulated equity increases by the amount of investments carried out, minus depreciation charges and provisions for renewal, as well as third
party participations received in the course of the year
Evolution of expenses to be recovered provided under TURPE Distribution for 2015-2017
Yearly indexation TURPE 4 (CPI + K). Tariff is adjusted every year on the implementation date of TURPE 4. After an initial
increase of 3.6% on 1 January 2014, ERDF tariff revenue dropped by 1.3% on 1 August 2014 Yearly indexation on 1 August based on the formula: CPI + K
CPI = Consumer price index in France excluding tobacco of Year N-1
K = CRCP reconciliation term (in a range of +/-2%; the amounts not being cleared deferred to the following year)
In current millions of Euros 2015 2016 2017
Tariff revenue 13,105 13,542 13,949
Expenses to be recovered by the tariff 13,140 13,531 13,900
In current millions of Euros 2015 2016 2017
Regulated asset base (RAB)(1) 47,289 49,063 50,825
O/w investments (excluding Linky) 3,378 3,466 3,547
O/w depreciation and provisions for renewal (2,416) (2,496) (2,578)
Regulated equity (RE)(2) 4,608 5,395 6,413
RAB and Regulated Equity (RE) evolutions provided under TURPE Distribution for 2015-2017

144
ERDF key figures
Networks Focus on transmission
Overview Innovations Focus on distribution
EDF main businesses
In millions of Euros 2013 restated 2014 ∆%
Sales 13,811 13,280 -3.8%
EBITDA 3,616 3,531 -2.4%
Net income excl. non-recurring items 810 697 -14.0%
Gross operating investments 3,177 3,208 +1.0%

145
Linky smart meters rollout
Networks Focus on transmission
Overview Innovations Focus on distribution
EDF main businesses
The project □ Deployment starting from late 2015, with a target of 35 million meters installed by 2021 (representing a 90% deployment
rate)
□ Estimated investment of €5bn for the 2014-2021 deployment period
□ Economic balance based on the gains induced by the Linky project (reduced non technical losses, fewer technical interventions and meters readings, grid optimisation, etc.)
The tariff model is described in the CRE’s ruling of 17 July 2014 relating to Linky, published in the Journal Officiel of 30 July 2014 □ Specific regulation over a 20-year period (Linky-dedicated RABs)
□ Pre-tax nominal return rate of 7.25% and a 3% additional premium depending on costs control, deadlines and system performance
□ Implementation of a deferred tariff on Linky revenues until 2022, remunerated at 4.6% and fully balanced in 2030
Latest developments: □ Six manufacturers chosen in August 2014 as winning bidders to supply 3 million meters
□ Tenders for the installation of the meters still ongoing. For the first installations, the markets have been attributed in early April 2015. A second tender is ongoing for installation periods scheduled for 2016

146
Electricity smart metering regulatory framework in France, Great Britain and Italy
Networks Focus on transmission
Overview Innovations Focus on distribution
EDF main businesses
(1) For more information on France, please see page 145 “Linky smart meters deployment”
(2) Electricity and gas meters
France(1) Great Britain Italy
Deployment
responsible entity Distributors Energy Suppliers (Retailers) Distributors
Regulatory entity CRE (deliberation of 17 July 2014)
Specific regulation over a 20-year period
Department for Energy and Climate
Change (DECC) accountable for the project
delivery with Ofgem responsible for
monitoring performance and compliance
Since 2000: business-driven process, led by Enel
Since 2006: process fully regulated by the
Authority for Electricity and Gas
Targets
35 million meters (deployment rate of
90%) to be installed by 2021. Incentive-
based regulation focusing on 3 parameters
(installation schedule, costs management
and service quality) with bonuses and
penalties
Take “all reasonable steps” to achieve 100% of residential and small business customers by end of 2020. Material fines for non-compliance with milestones and targets. 53 million meters(2) to be installed, and ‘In-Home-Displays’ must be offered to customers
Already reached: Italy has been a pioneer and
today deployment rate of smart meters exceeds
95%, consistent with the Authority’s objective
(95% by the end of 2011)
Project status
Rollout starting from late 2015 following a
first tender closed in April 2015. A second
tender is ongoing for installations in 2016
Large-scale roll-out delayed to start only in
late 2016
In 2013, new pilot projects have been launched to
test a new type of multi service smart meter that
can remotely manage the supply of gas,
electricity and water
Remuneration
Tariff model, based on OPEX coverage and
on a specific RAB remuneration, applicable
for the whole life of assets, until 2040
Government assumes net costs will be
recovered via competitive energy tariffs and
expects national benefits of c.£17b. Project
estimated discounted cost of c.£11b
Investment and installation costs of meters for
distributors are remunerated on the basis of the
tariff set by the Authority

147
Innovation: transmission
Networks Focus on transmission
Overview Innovations Focus on distribution
EDF main businesses
Porcheville electrical substation
The project: many electrical substations on generation sites will have to be renovated over the
next few years, so EDF has come up with a faster and more cost-effective way of modernising
them on the basis of the "retrofit" principle. Retrofitting means replacing old parts with
equivalent parts that use today's technology.
However, in many cases it is not possible to replace parts due to technological incompatibility.
To resolve this problem though, EDF has designed connecting parts which attach new and old
components together. Attaching new technology to old substations means that the substations
benefit from technological progress, for example through extending their usable life and
improving performance.
Benefits for EDF:
– the solution reduces the time that the substation is out of use, as it takes much less time
than traditional renovations or replacement
– savings of around 25% on the cost of a new substation and 40% on the cost of maintenance
– more environmentally-friendly generation, thanks to a marked decrease in the amount of
SF6 gas required to isolate voltage-conducting parts
Project implementation: the innovation can be applied to all gas-insulated substations at
generation sites. The thermal power plant in Le Havre was the first to use the solution.
Modernising gas-insulated substations

148
Innovation: networks and renewables
Networks Focus on transmission
Overview Innovations Focus on distribution
EDF main businesses
The project and its advantages: to maintain supply/demand equilibrium on
the network and better manage the intermittent nature of renewable energy,
R&D has developed a unique model to forecast consumption and model
the situation in different areas across different timeframes. The application is
able to forecast consumption simultaneously at tens of thousands of
locations along the major distribution network routes, within a city or within a
neighbourhood. The solution, based on an innovative statistical approach
(the General Additive Model or GAM), automatically and intelligently models
complex scenarios on the basis of large sets of constantly changing data. In
one day it is therefore able to generate thousands of forecasted models,
which up to now would have taken weeks to produce.
Implementation: in 2014 the solutions were successfully integrated into
ERDF's information systems and user numbers have been rising steadily. In
the areas of Chartres and Nantes, the tool is already providing daily
forecasts to network operating teams on the ground. By mid-2015, the 2,335
delivery point substations and additional points (25,000 medium-voltage
power lines) will be equipped with the technology. The tool will give daily
short-term (for the next day) and medium-term (the following year) simulated
forecasts for the whole of France.
Increasingly accurate forecasting for the distribution network
Actual
Forecast
TEMPERATURE YEAR POSITION TYPE_DAY

149
Optimisation and Trading in France
Optimisation principles
EDF main businesses
Supply in France and innovations
Networks - Transmission and Distribution
Generation
Optimisation - Trading and Supply
150
153
157
Focus on Group commercial strategy 166
EDF main businesses Generation Networks Optimisation - Trading and Supply Gas Energy services

150
Optimisation and Trading: leveraging the value chain
EDF main businesses Optimisation - Trading and Supply
Optimisation principles
Optimisation and Trading in France Supply in France Commercial
strategy
The main role of the optimiser is to ensure the balancing between EDF sources and uses of energy in France
The objective is to secure and maximise the gross electricity margin of the “generation-supply” entity through the optimal use of upstream or downstream asset flexibility and by constantly seeking the best purchasing or sales opportunities on wholesale markets
• Upstream resources: generation fleet, long-term electricity purchasing contracts, purchases on wholesale markets, purchase obligations from decentralised producers, contractual load shedding capacity
• Downstream commitments: long-term supply contracts, sales to end customers, sales on wholesale markets, sales to competitors in France
The supply-demand balance is forecasted over different time horizons
To manage the “volume” risk, a sufficient margin in terms of capacity must be available for all time horizons, in order to cope with main critical situations
Did you know?
EDF Trading is one of the most important energy traders in Europe and has strong positions in the US
Trading figures for 2014:
• 3,140TWh of electricity
• 332MBTU of gas
• 662Mt of coal
• 675Mt of carbon
The goal of the optimiser is to optimise costs and inventories, resorting to the wholesale market (through EDF Trading)

151
Daily optimisation: preliminary optimisation by each producer
EDF main businesses Optimisation - Trading and Supply
Optimisation principles
Optimisation and Trading in France Supply in France Commercial
strategy
The optimiser schedules the operation of generation facilities, ranked according to their merit order until the estimated demand is met
Before using the market, each producer determines the resources required to meet a given level of demand
It classifies its available generation facilities from the least expensive to the most expensive
It then determines the marginal cost to meet the supply/demand balance of its own portfolio
Spot power price (day ahead) is based on the variable generation cost of the last called plant (marginal plant) to meet the demand of the next day
variable generation cost (€/MWh)
capacity (GW)
nuclear
coal
peak (thermal,
disruptions)
CCGT
“reservoir”
hydro
“must-run”
(hydro, wind,
solar)
demand
Market price

152
Cost optimisation – scheduling of generation facilities based on variable costs
EDF main businesses Optimisation - Trading and Supply
Optimisation principles
Optimisation and Trading in France Supply in France Commercial
strategy
Stack chart of generation facilities
Example of one high consumption day in winter
Did you know?
The merit order is a way of ranking available
sources of energy, especially electrical
generation, in ascending order of their short-
run marginal costs of generation, so that
those with the lowest marginal costs are the
first ones to be brought online to meet
demand, and the plants with the highest
marginal costs are the last to be brought on
line
Moyens de base
Production
obligatoire
Rising variable
costs
€/MWh
“Must-run”
generation
Base load
facilities
Semi-base load
facilities
Peak facilities
“Must-run” generation Nuclear CCGT Coal “Reservoir” hydro Thermal
midnight

153
Maximising the consolidated gross margin
EDF main businesses Optimisation - Trading and Supply
Optimisation principles
Optimisation and Trading in France Supply in France Commercial
strategy
Structural diagram:
the objective is to make the Producer, the Optimiser and the Supplier responsible for their own activities within an explicit mandate
There is a shared objective, to maximise the gross margin, driven primarily by the Optimiser
Producer Optimiser Supplier
Responsibilities
Ensuring the availability of generation facilities
Controlling maintenance operating costs
Responsibilities
Optimising the upstream/downstream
balance
Maximising the consolidated gross
margin
Managing risks
Responsibilities
Maximising supply margins
Guaranteeing market shares
Gross Electricity Margin Supply/Generation

154
Optimiser's interactions with the supplier and the producer
EDF main businesses Optimisation - Trading and Supply
Optimisation principles
Optimisation and Trading in France Supply in France Commercial
strategy
The producer undertakes to provide the optimiser with:
Its best estimate of the availability of generation facilities
Complete transparency on its constraints and costs
The supplier undertakes to provide the optimiser with:
Its best estimate of the development of its customer portfolio and volumes consumed by its customers
Full transparency on products sold to its clients, including embedded flexibility with the associated risks
The optimiser undertakes to provide the producer and the supplier with:
Economic signals so that each entity will manage their portfolios in order to maximise gross margin

155
The upstream/downstream balance is fairly volatile over different time horizons
EDF main businesses Optimisation - Trading and Supply
Optimisation principles
Optimisation and Trading in France Supply in France Commercial
strategy
Thermo-sensitivity of consumption: temperature has a strong influence on demand in winter, one degree less equals to 2,400MW of higher consumption in France
Variations in water levels: major variation in generation potential year on year (some 20TWh between a dry year and a rainy year)
Unplanned unavailability of generation facilities (nuclear power, fossil-fired power, etc.)
Mandatory purchases from decentralised smaller producers: strong fluctuation in contribution from renewable energies (up to ~4,500MW from one day to another on the French wind power generation)
Sales on wholesale markets: optionalities at the hand of EDF counterparties

156
Use of the wholesale market
EDF main businesses Optimisation - Trading and Supply
Optimisation principles
Optimisation and Trading in France Supply in France Commercial
strategy
When there is a difference between the sum of upstream and downstream positions, the optimiser balances this difference through purchases/sales on the wholesale market
It is possible to transact different products over different time periods
Medium-term: purchases or sales of annual products for the years Y+1/Y+2/Y+3
Short-term: same principle with purchases/sales today for the next day (spot) or over the next few hours of the day
Intermediate products (monthly and quarterly products over two to three coming quarters and weekly products over two to three coming weeks) also exist
The optimiser can directly contact its potential counterparties or go through the organised markets
OTC (over the counter) bilateral agreements: direct trade with counterparty
Regulated exchanges: pooling of supply and demand by a market organiser and settlement of trades (Epexspot in France, Belpex in Belgium, etc.)
The optimiser for France (DOAAT) has access to the market exclusively via EDF Trading

157
416
38
7 5
35
France: upstream/downstream electricity balance in 2014
EDF main businesses Optimisation - Trading and Supply
Optimisation principles
Optimisation and Trading in France Supply in France Commercial
strategy
Note: EDF excluding French electrical islands activities
In TWh
354
46
3
71
Nuclear
Hydropower
Fossil-fired LT & structured purchases
Purchase obligations Net market sales
Output/Purchases 501
+12
-9 -1
-5
+1
-2
∆ 2014 vs. 2013
Sales
Auctions (VPP)
Structured sales
End-customers
NOME supply
-2
∆ 2014 vs. 2013
-27
+7
-2
-5
501
+25 27

158
EDF’s electricity business in France
EDF main businesses Optimisation - Trading and Supply
Optimisation principles
Optimisation and Trading in France Supply in France Commercial
strategy
128.4
169.8
55.6
End-customer sales as of end-December 2014(1) In TWh
(1) Rounded to the nearest tenth
(2) Including EDF self-consumption
(3) Local distribution companies (LDCs)
LDC(3) transfer price
Green tariff
Yellow tariff
Blue tariff
Residential customers
Business and professionals (out of historic tariff)
Business and professionals(2)
(under historic tariff)
162.4
38.4
81.1
16.3

159
Regulated tariff in France in 2014
EDF main businesses Optimisation - Trading and Supply
Optimisation principles
Optimisation and Trading in France Supply in France Commercial
strategy
Tariffs are different depending the type of consumers: blue for residential and small professionals, yellow and green for
companies
1 January 2014 - 31 October 2014: the tariff is called “integrated”
From 1 November 2014: the decree of 28 October 2014 introduces the new “cost stacking”(1) tariff method
Source: DETP – (Tariff and Price Savings Department, 31 December 2014) (1) For more information, see page 161 “Components of the cost stacking method established by the 28 October 2014 decree”
54
37
19,5
6
Average bill breakdown including VAT
Yellow tariff (1 Nov. 2014)
50
18
18
2
Average bill breakdown including VAT
Green tariff (1 Nov. 2014)
59
45
19.5
36
Average bill breakdown including VAT
Blue residential tariff (1 Nov. 2014)
Taxes
CSPE
TURPE
116.5 €/MWh 88 €/MWh 159.5€/MWh
Generation and supply costs
Taxes
CSPE
TURPE
Generation and supply costs
Taxes
CSPE
TURPE
Generation and supply costs

160
Increase in regulated tariffs in France in 2014
EDF main businesses Optimisation - Trading and Supply
Optimisation principles
Optimisation and Trading in France Supply in France Commercial
strategy
Source: CRE (1) For more information, see page 162 “CRE report of 15 October 2014 on electricity regulated tariffs”
Tariff increases are made once a year: in 2014, the following increases went into effect on 1 November:
+2.5% for households (including 0.9% of tariff catch-up for 2012-2013) and -0.7% for small businesses (blue tariff), +2.5% for companies under yellow tariff and +3.7% for companies under green tariff
These hikes include grid tariff increases (TURPE) effective 1 January 2014: +3.6% for distribution only, and then on 1 August 2014: -1.3% for distribution and for transmission
2013 2014 Blue tariff
2013 2014 2013 2014
TURPE
Energy and
supply
component +
catch-up Yellow tariff
Green tariff
+1.8% +€1.8/MWh
+2.5% +€2.2/MWh
+3.7% +€2.4/MWh
€101.7/MWh €103.5/MWh €88.4/MWh €90.6/MWh €65.0/MWh €67.4/MWh
+€1.0/MWh
+€0.8/MWh
+€1.5/MWh
+€0.7/MWh
-€0.2/MWh
+€2.6/MWh
Higher share of energy and supply component on residential customers and small businesses

161
Components of the cost stacking method established by the 28 October 2014 decree
EDF main businesses Optimisation - Trading and Supply
Optimisation principles
Optimisation and Trading in France Supply in France Commercial
strategy
Source: Decree no. 2014-1250 of 28 October 2014 modifying the decree no. 2009-975 of 12 August 2009 on regulated tariffs
Cost calculated according to average consumption characteristics
and observed forward market prices
Market complement - Energy
ARENH
TURPE
Supply costs
Normal margin on supply activity
Market complement - Capacity
Commercial costs of a supplier at least as efficient as EDF in the
business of supplying electricity to those customers having
subscribed contracts under regulated tariffs
Margin earned on electricity supply activity:
□ Remuneration of risks associated with supply which are not covered by
other cost items
□ WCR coverage
□ Return on capital employed in electricity sales
The decree also states that the regulated tariffs are determined by the addition of these different components “subject to the costs supported by EDF and LDCs for supplying electricity under regulated tariffs being taken into account”
Capacity obligation mechanism requiring suppliers to have capacity
guarantees as from 2017 covering their customers’ peak
consumption

162
CRE report of 15 October 2014 on electricity regulated tariffs
EDF main businesses Optimisation - Trading and Supply
Optimisation principles
Optimisation and Trading in France Supply in France Commercial
strategy
For more information on CRE report and underlying assumptions regarding analysis and recommendations, please visit the CRE website or download the file on the link below (available only in French)
http://www.cre.fr/documents/publications/rapports-thematiques/rapport-sur-les-tarifs-reglementes-de-vente-d-electricite
(1) Tariff increase of 1 November 2014 includes around €160m which will be caught-up over a one-year period, according the deliberation of the CRE of 30 October 2014, giving opinion on the draft decree relating to regulated tariffs (for more information, see page 163 “Tariff decisions and revisions announcements”)
Historic costs not covered, to be included in subsequent tariff hikes(1)
□ 2012: €509m (in addition to the adjustment decided on 28 July 2014 for revenue estimated to €921m)
□ 2013: €627m
Based on projected costs, regulated tariffs should have increased by 4.9% on average in 2014
□ Among which 6.7% for residential tariffs
Impact on regulated tariffs according to CRE assumptions
2014 2015 2016
Blue residential tariff +1.6% +1.5% +2.0%
Blue professional tariff -0.7% +0.9% +1.8%
Yellow tariff -0.1% +1.1% n/a
Green tariff +2.0% +1.6% n/a
Source and detailed data: CRE report
Historic method:
Based on actual and projected costs
New method:
Based on cost stacking method

163
Tariff decisions and revisions announcements
EDF main businesses Optimisation - Trading and Supply
Optimisation principles
Optimisation and Trading in France Supply in France Commercial
strategy
Reference to tariff revision related to the regularisation of regulated tariffs for the period of 23 July 2012 to 31 July 2013, following a decision by the French State Council of11 April 2014
Reference to a tariff revision related to the underestimation of EDF’s commercial costs, which the CRE took note of afterward in 2012 regularised tariffs and 2013 tariffs
2013 costs underestimated by €627m 2012 costs underestimated by
€509m on top of the €921m
June 2013 report shows that the revised 2012 tariffs, following the State
Council’s decision, and 2013 tariffs were insufficient. EDF’s costs were
underestimated by a total of €1,136m (blue: €930m; yellow: €70m;
green: €130m)
August 2012: 2% increase in all regulated
tariffs
August 2013: 5% hike for blue, 2.7% for
yellow and 0% for green
July 2014:
planned 5%
rate hike
cancelled
November 2014: “stacking”
tariffs, +2.3% on average (blue
residential: +2.5%; professional
blue: -0.7%; yellow: +2.5%;
green: +3.7%)
Recommendations:
+5.7% for blue,
+2.6% for yellow,
+1.5% for green
Impact on EDF
Request for
cancellation in
January 2013
Decision of 11
April 2014
cancelling the
July 2012
ministerial order
€921m in revenues
in 2014
According to CRE discussions of 30 October
2014, tariff hikes include a partial catch-up of
2012 and 2013.. For example, for blue
residential, 0.9% catch-up on top of a +1.6%
increase
Appeal to cancel the
ministerial order that
cancelled the 5%
rate hike
Appeal to cancel the tariff
ministerial order
(contesting the level and
not the “stacking”
method)
Appeal struck down on
12 September 2014, as
there was no urgency.
“In-depth” decision
within 12 to 18 months
Appeal struck down on
7 January 2015, as
there was no urgency.
“In-depth” decision
within 12 to 18 months
Catch-up included in the tariff decision of November 2014
Blue: 15% of the amount to be caught up; yellow: 50% of the amount
7 January 2015 decision on the rate hike of 1 November 2014:
-blue and yellow: include a catch-up but only a partial one; the
Government will have to further carry tariffs catch-up on in its next tariff
decisions
-green: no catch-up, tariffs set at a clearly insufficient level
Government
French Energy
Regulation
Commission (CRE)
ANODE
French State
Council
2012 tariffs 2013 tariffs 2014 tariffs

164
ARENH volumes allocated to competitors under NOME law
EDF main businesses Optimisation - Trading and Supply
Optimisation principles
Optimisation and Trading in France Supply in France Commercial
strategy
(1) A revaluation of the ARENH is expected, based on the publication of the ARENH formula decree –the ARENH price was €42/MWh as of 1 January 2015
(2) Data published by the CRE in March 2015
(3) Defined by law
Maximum total volume of EDF’s sales to competing suppliers (excluding grid losses): 100TWh(3) p.a Volumes allocated in 2014 by EDF to competitors: 71.3TWh
Since early 2014, competing suppliers include grid sourcing losses in their ARENH demands (produit plat C1). Annual amounts dedicated to losses, set by the CRE, take into account 80% of projected consumption of the public grid operator for 2014 and 100% for 2015 and beyond
Volumes allocated for the first half of 2015: 12.4TWh (o/w 5.3TWh for losses) due to: A context characterised by a lack of visibility on evolution to come on ARENH price and decrease in wholesale
electricity market prices
Termination by four suppliers of the framework agreement that allowed them to benefit from ARENH
Did you know?
31.4
36.8 34.5
12.4
ARENH 2014 (€42/MWh)
In TWh ARENH 2013 (€42/MWh)
ARENH 2014 (€42/MWh)
ARENH 2015 (€42/MWh(1))
H2 2014 volumes supplied
H1 2014 volumes supplied
H2 2013 volumes supplied
Volumes forecast H1 2015(2)
By 2015, there will be an
evaluation of the ARENH
mechanism by the DGEC
Evaluation required by the
NOME law every five years,
with the first to come before
the end of 2015
Analysis of ARENH’s impact
on competition, wholesale
markets, supply of alternative
suppliers, and investments
necessary to secure supply
Wording of mechanism-
adjustment proposals

165
Innovation: supply
EDF main businesses Optimisation - Trading and Supply
Optimisation principles
Optimisation and Trading in France Supply in France Commercial
strategy
The new digital e.quilibre service allows customers to
analyse their energy consumption and usage. It is a new,
completely digital tool, accessed via the online
dashboard of the customer site for residential customers.
It allows customers to monitor and manage their
consumption and electricity expenses, through a
personalised service. The more precise the metering
data provided, the more accurate and personalised the
e.quilibre service will be. With this in mind, it has been
designed to receive data from a smart meter.
Connected homes: e.quilibre
E.quilibre allows customers to:
track their consumption and energy expenses at all times
compare consumption with similar households
identify the appliances that use most electricity
benefit from practical and personalised advice to lower bills

166
EDF commercial strategy in France (1/2)
EDF main businesses Optimisation - Trading and Supply
Optimisation principles
Optimisation and Trading in France Supply in France Commercial
strategy
Residential customers
Implementation of 9 “EDF & Me commitments” involving proximity, personalisation and proactivity
Services for residential customers
Services dedicated to energy savings: advice concerning different heating systems or insulation solutions, personalised support on
renovation work projects, applications for a quote from EDF’s Partenaires Bleu Ciel, and access to financing solutions from EDF’s
financial partner (Domofinance)
Other services: paperless management methods for accounts, access to insurance services and assistance with electrical and
plumbing troubleshooting, and monitoring of consumption
On the electricity market,
353.8TWh sold in 2014,representing
a market share of 78.8%
27.2 million customer
accounts, or more than 33
million sites(1)
Key figures in 2014 Electricity: 27.5 million delivery points and 128.4TWh sold
Gas: more than 1 million delivery points and 9.3TWh sold
Customer satisfaction rate in 2014 of 90%(2)
(1) Excluding overseas and Corsica
(2) Source: BSC satisfaction barometer
On the gas market, 19.6TWh sold
in 2014, representing a market
share of 4.7%

167
EDF commercial strategy in France (2/2)
EDF main businesses Optimisation - Trading and Supply
Optimisation principles
Optimisation and Trading in France Supply in France Commercial
strategy
(1) Source: BSC satisfaction barometer
Corporate and business customers
“EDF Entreprises”, new brand of EDF launched in 2013, supports professionals in order to help them reduce their energy bill.
EDF has put in place offers dedicated to large customers with:
• offers for tailor-made electricity and gas supply
• „„offers valuing the demand-side response capacity: depending on certain conditions, customers with the ability to reduce their demand
load according to specified capacity levels can receive financial compensation
• „„assistance on a European scale through the entities of the Group: EDF has a “Large Companies and Major Accounts” commercial
network dedicated to the management of large companies and with a centralised purchasing structure
• support in the control of their energy consumption and CO2 emissions through the implementation of energy productivity plans (PPE)
• trading of CO2 for businesses subject to the EU emission trading system (EU ETS)
Local authorities, low-income housing agencies, Local Distribution Companies (LDCs) and public service providers
Key figures in 2014 1.7 million corporate and business customers with 179.5TWh of electricity sold and 9.5TWh of gas
Customer satisfaction rate in 2014 of 77%(1)
Key figures in 2014 Electricity: 1.2 million sites for an annual consumption of 29.6TWh
Gas: close to 6,000 sites for an annual consumption of 0.9TWh
Additionally, 16.3TWh of electricity were sold to LDCs in 2014
Customer satisfaction rate in 2014 of 91%(1)
5 areas: the supply of electricity and gas at market price; the
signing of concession contracts for the “supply” portion; the
supply of electricity at regulated sales tariff; accompaniment
in different projects (local climate plans, eco-districts,
sustainable cities, etc.); development of sustainable mobility
offers for local authorities

168
EDF Energy commercial strategy
EDF main businesses Optimisation - Trading and Supply
Optimisation principles
Optimisation and Trading in France Supply in France Commercial
strategy
Highly competitive market with ~25 suppliers; small-to-medium
suppliers grown strongly over last 2-3 years (c10% market share).
New entry & establishment helped by cost exemptions policies
A wide range of tariffs (fixed and variable) available to all customers;
competition most intense on fixed-term tariffs. Dual-fuel (electricity, gas)
offers prevail with cheapest prices for online accounts management
Comparatively high customer switching rate; increasing level of
switching through price comparison websites
Suppliers used to deliver Government policies, including energy
efficiency and smart metering
Market remains highly competitive with >30 suppliers
Very diverse customers: from small to large/multi-site
customers requiring a wide range of energy products and
services
Intermediaries helping customers to choose their energy
supplier retain a strong presence in the market,
representing ~80% of volume to industrial & commercial
customers. Lower penetration for small business customers
Suppliers increasingly looking to deliver energy-related
services in addition to electricity/gas sales
Standard variable prices at the lower end of competitors, recognising
typically lower engagement of customers on such tariffs and so building
reputation for acting fairly
Market share holding up (4th largest supplier) due to strong interest in
fixed-term Blue + Price Promise products, where a customer is alerted of
cheaper offers (saving £1/week or more), even if by a competitor
Costs reduction to serve customers and narrow the differential to
competitors
Increasing number of customers using digital interface
Serve all customer segments (0.1-10TWh p.a. demand)
Remain the largest supplier to UK businesses; supplies
4 of the 5 largest UK users (Network Rail, Scottish
Procurement, Crown Commercial Service, Tesco)
Promote low carbon emissions through innovative
offerings to the B2B supply base
Drive the growth in key areas with a focus on smaller
businesses and emerging energy services & export markets
Residential electricity and gas supply market (B2C) Business electricity supply market (B2B)
3 pillars: fairness and convenience for customers, efficient operations and innovation (digital technology & smart metering)
CO
NT
EX
T
ST
RA
TE
GY

169
Edison’s commercial strategy
EDF main businesses Optimisation - Trading and Supply
Optimisation principles
Optimisation and Trading in France Supply in France Commercial
strategy
Business market (B2B) Edison is a leader in the B2B market both in power and gas Very fragmented and competitive market Market share of 10% for power and 20% for gas
Retail market (B2C) Late 2008: Edison entered the retail free market in power and gas, positioning
itself as the new real alternative to incumbents (Enel, Eni, ex-Municipalities) Strong growth in the retail market: 1 million contracts signed in less than 2 years,
up to 1.3 million contracts at the end of 2014
POWER SALES IN 2014 GAS SALES IN 2014
17TWh 5.3bcm o/w
2bcm resellers
3.3bcm business
3.8TWh 554mcm
NEW OFFERS – “EDISON BEST”: in October, Edison launched an innovative offer for the power residential market,
which introduces a new service to guarantee its best value for money. Edison advises its customers about the existence
of another fixed price offer which guarantees at least 1€ per week saving. This is a true innovation which has never
been proposed by any other national operator for energy and gas services or in other sectors
NEW SERVICES – “ENERGY CONTROL”: in the residential sector, Edison has introduced Energy Control, a device
which enables families to supervise, through a data reader and a digital platform, their energy spending in real time. It
helps customers reach a greater awareness of their energy use, encouraging them to reduce their final consumption
LOYALTY PROGRAM – “NOI EDISON”: the “Noi Edison” loyalty program enables customers to earn points easily,
which can be spent in high-tech goods and other items linked to energy saving and sustainable lifestyle
Edison, through its 100% controlled company Edison Energia is involved in the electricity and gas supply to Italian customers
The Italian retail market is not completely liberalised but the removal of the regulated market starting in 2018 is under discussion at government level. In the first months of 2015, an acceleration towards the complete opening of the retail market has already started
NE
W IN
NO
VA
TIV
E
OF
FE
RS
AN
D
SE
RV
ICE
S
(1) Delivery points
788,000 customers(1) 557,000 customers(1)

170
EDF Polska commercial strategy
EDF main businesses Optimisation - Trading and Supply
Optimisation principles
Optimisation and Trading in France Supply in France Commercial
strategy
1.2 1.8
3.5
2013 2014 2015
The Group is currently developing its strategy in the B2B segment, with the possibility to expand into the B2C market
depending on the regulatory evolution
Large B2B clients (High and Medium Voltage):
Increase of contracted electricity volume (TWh)
Small B2B clients:
The project started in June 2014, with sales starting in February 2015
The strategy aims to bring EDF’s expertise to an attractive market segment, increase the level of vertical integration and develop the
EDF brand in Poland
Offers:
Fixed price electricity supply, with innovative Service Packages
Additional products, including Solar PV Feasibility Study
The EDF group also aims to rapidly develop a significant position in energy services in Poland, leveraging on competencies and
expertise of Group entities: Dalkia, Fenice, Tiru, EDF Polska.
New commercial strategy implemented in 2013 with focus
on medium-size customers (>5GWh/yr) and large-size
industrial customers (>100GWh/yr)
Successful and promising results following the launch of
the strategy

171
EDF Luminus commercial strategy
EDF main businesses Optimisation - Trading and Supply
Optimisation principles
Optimisation and Trading in France Supply in France Commercial
strategy
Key factors of success in 2014
Complete restructuration of generation activities and reduction of O&M costs by 20%
between 2013 and 2014
Development of profitable renewable energies in the energy mix: increase in installed wind
capacity by more than 50% in 2014 and implementation of a broad life extension programme of
hydroelectric power stations
Strong development of innovative energy solutions with the launch of new products
completing the “Home Solutions” range in B2C which includes:
“Comfort” service: 24/7 assistance to residential customers for all emergency repair
New “Maintenance and repair of boilers” and “smart thermostat” services
Portfolio of more than 100,000 services
Acquisition of RAMI, a network of more than 250 domestic installers enabling the deployment
of B2C services
Positioning across the entire value chain of heat, ventilation and air conditioning thanks to the
recent increase in shareholding of Dauvister, a multi-energy solutions installer
Market share of 20% and growing
despite strong competition
An excellent and growing level of
customer satisfaction and drop in
cost of customer service. Supplier with
the smallest level of complaint for every
5,000 customers: rate of 1.03 in 2014 vs.
2.42 in 2013
Being a leading integrated energy company,
offering innovative and sustainable solutions and
ensuring best service to customers
Enhancing local anchorage
while benefiting from the
integration within the EDF group
The future strategy
EDF Luminus launched with success a deep transformation with the plan “Better for our
customers” with the following targets
18% professionals
and industrials
82% residential
100,000 services
contracts
1.74 million customers(1)
60% Flandres
35% Wallonia
5% Brussels
+50,000 customers in 2014:
supplier with strongest growth
(1) Delivery points
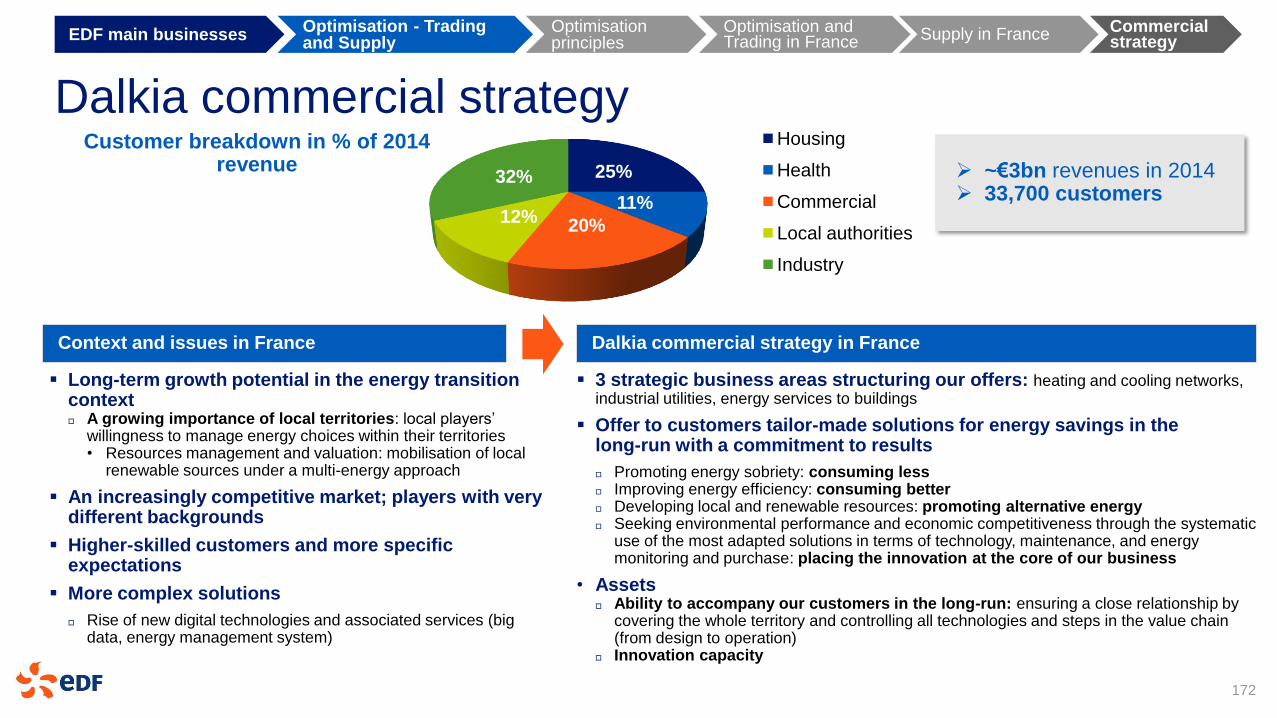
172
Dalkia commercial strategy
EDF main businesses Optimisation - Trading and Supply
Optimisation principles
Optimisation and Trading in France Supply in France Commercial
strategy
25%
11%
20% 12%
32%
Housing
Health
Commercial
Local authorities
Industry
Long-term growth potential in the energy transition context A growing importance of local territories: local players’
willingness to manage energy choices within their territories • Resources management and valuation: mobilisation of local
renewable sources under a multi-energy approach
An increasingly competitive market; players with very different backgrounds
Higher-skilled customers and more specific expectations
More complex solutions
Rise of new digital technologies and associated services (big data, energy management system)
Context and issues in France Dalkia commercial strategy in France
3 strategic business areas structuring our offers: heating and cooling networks, industrial utilities, energy services to buildings
Offer to customers tailor-made solutions for energy savings in the long-run with a commitment to results
Promoting energy sobriety: consuming less Improving energy efficiency: consuming better Developing local and renewable resources: promoting alternative energy Seeking environmental performance and economic competitiveness through the systematic
use of the most adapted solutions in terms of technology, maintenance, and energy monitoring and purchase: placing the innovation at the core of our business
• Assets Ability to accompany our customers in the long-run: ensuring a close relationship by
covering the whole territory and controlling all technologies and steps in the value chain (from design to operation)
Innovation capacity
Customer breakdown in % of 2014 revenue
~€3bn revenues in 2014 33,700 customers

173
EDF main businesses
Networks - Transmission and Distribution
Generation
Optimisation - Trading and Supply
Group’s activities in the gas sector
EDF main businesses Generation Networks Optimisation - Trading and Supply Gas Energy services

174
EDF is well positioned all along the gas value chain
Group’s activities in the gas sector EDF main businesses
Exploration/
Production Storage Infrastructures Trading Supply 1 3 2 4 5
Signing partnerships with oil and gas companies, using Edison’s expertise
Controlling the cost of flexibility
Examples:
Hill Top Farm (UK) storage expansion
Palazzo Moroni (Italy) storage expansion
Etzel (Germany) storage
Developing import infrastructures to have a direct access to gas sources while avoiding dependency and anticipating future needs Examples:
Dunkirk LNG Terminal
IGI/IGB Pipelines
Seeking arbitrages and optimising supply strategies
Offering dual-fuel offers (electricity and gas) to clients
Present in gas markets for
over 10 years, EDF uses in
Europe more than 20bcm of
gas
Securing competitive long-term gas supplies for the Group
Gas and electricity dual-fuel offers to end costumers
Supply of EDF’s gas-fired power plants
Benefitting from arbitrage opportunities

175
Gas end-market for EDF
Group’s activities in the gas sector EDF main businesses
Gas sales for the Group in 2014(1):
France: more than 1.1 million customers (residential customers and key accounts) and 19.6TWh sold, equivalent to a
market share of 4.7%
Italy: 553,200 customer accounts and 5.7bcm of gas (~60TWh) sold, equivalent to a market share of 13.6%
United Kingdom(2): about 2.1 million customer accounts and 28TWh sold, equivalent to an approximate market share
of 5%
Belgium: some 581,000 customer accounts and 13.2TWh sold, equivalent to an approximate market share of 18%
(1) Sales of companies at 100%, i.e. not corrected for interest percentage (including non-controlling interests). The gas business of EDF Trading is not taken into account in these
figures
(2) Excluding Northern Ireland

176
EDF’s main gas infrastructures
Group’s activities in the gas sector EDF main businesses
LNG terminal in Dunkirk Capacity of 13bcm/year (o/w 8bcm/year owned by EDF)
Dunkirk LNG shareholders: 65% EDF, 25% Fluxys, 10% Total
Project status: under construction
As of end of December 2014, the construction project is 74.8% complete. The terminal commissioning is scheduled for end 2015
In 2014, cryogenic tanks were built inside concrete reservoirs and then sealed. This was followed by a series of tests
Rovigo LNG terminal in Italy Capacity of 8bcm/year (o/w 6.4bcm/year owned by Edison)
Adriatic LNG shareholders: 7.3% Edison, 70.7% ExxonMobil Italiana Gas, 22% Qatar Terminal Company Limited
Gas Storage in Europe Italy: three existing storages (Cellino, Collalto, San Potito-Cotignola) and one project under development (Palazzo Moroni)
United Kingdom: one existing storages (Hole House) and one project under development on the adjacent site (Hill top Farm)
Germany: one existing storage in Etzel. Surface installations will be operated in a 50-50 joint-venture with EnBW
Other import structures Edison takes part in infrastructures projects for gas import:
„„Galsi, a gas pipeline aimed at connecting Algeria to Italy through Sardinia, in which Edison has a 20.8% shareholding
„„IGI Poseidon, a company owned at 50% by Edison and involved in the development of several projects aiming to connect Greece and
Italy (IGI), Greece and Bulgaria (IGB, in 50-50 partnership with Bulgaria) as well as Greece and Cyprus (EastMed)
N.B.: on 29 December 2014, EDF and Gazprom signed an agreement for the acquisition by Gazprom of EDF’s 15% stake, via its subsidiary EDF International, in the South
Stream gas pipeline project (South Stream Transport BV). Following the transaction, EDF will recover the capital invested to date, calculated coherently with existing
agreements

177
Long-term gas contracts
Group’s activities in the gas sector EDF main businesses
Edison gas contracts (Qatar, Libya, Russia et Algeria) and their price review □ The total volume of Edison long-term gas contracts is of 14.4bcm/year
□ A new round of price review started in late 2012 for the 2012-2015 period, in order to restore the profitability of those contracts, affected by the lower gas selling prices
Renegotiations and arbitrations status:
17 July 2014: EDF signed a supply contract with the US Cheniere Group for a approximate 1bcm/year, for a period of 20 years from the commercial commissioning of the LNG terminal of Corpus Christi in Texas
Contract
Nominal
volume
(bcm/year)
Expiration
Renegotiations/arbitrations status
1st phase
(2010 - 2012)
2nd phase
(2012 - 2015)
Qatar 6.4 2034 Arbitration
August 2012
Renegotiation
July 2013
Algeria 2.0 2019 Arbitration
April 2013
Renegotiation
July 2013
Russia 2.0 2019 Renegotiation
July 2011
Arbitration
August 2014
Libya 4.0 2028 Arbitration
September 2012
Arbitration
started in April 2013(1)
(1) It is now expected that the second round of negotiations for the Libyan gas contract will be concluded in the second half of 2015

178
EDF main businesses
Networks - Transmission and Distribution
Generation
Optimisation - Trading and Supply
Group’s activities in the gas sector
179
182
183
EDF’s strategy
Subsidiaries
Focus on Dalkia
Energy services
EDF main businesses Generation Networks Optimisation - Trading and Supply Gas Energy services

179
Energy services activities at EDF
Energy services EDF’s strategy Subsidiaries Focus on Dalkia EDF main businesses
EDF aims to be active across the whole value chain of energy services i.e. advisory and engineering, installations, operation and maintenance, energy management, and financing
EDF’s ambition in energy services is to increase energy efficiency of plants and equipment in order to reduce or to control energy consumptions and associated costs, as well as to reduce greenhouse gas emissions, particularly in the industry and buildings
Advisory &
Engineering Installation
Operation &
Maintenance
Energy
Management Financing

180
Service offering for customers in the business and public sectors
Energy services EDF’s strategy Subsidiaries Focus on Dalkia EDF main businesses
The EDF group developed its offering in energy services for business customers as well as local authorities, around 5 primary service lines
Large projects for industrial sites
Energy efficiency for public sector buildings, industrial and commercial businesses
Local energy production and district heating networks
Public lighting
Electric mobility
En
erg
y m
an
ag
em
en
t
Fin
an
cin
g s
olu
tio
ns

181
An ambitious development project
Energy services EDF’s strategy Subsidiaries Focus on Dalkia EDF main businesses
With Dalkia France and Citelum integration within the Group since July 2014, EDF reinforced its position as a major
player in energy services in France and internationally and expanded its service offering to business customers and local
authorities on the following activities: industrial utilities, energy services in buildings, heating and cooling networks
and public lighting
Dalkia is planning to strengthen its position in France throughout its current activity in heating networks and services to
buildings, and by developing its activities for industrial customers. In that context, Dalkia is working on the following
development projects:
Full integration of EDF Optimal Solutions within Dalkia from 17 February 2015. EDF Optimal Solutions designs and implements
comprehensive and tailored energy eco-efficiency solutions in order to help businesses and local authorities reduce their energy
costs and CO2 emissions, in four areas: district heating networks, energy generation and recovery, building energy efficiency,
and complete multi-technical energy efficiency solutions. EDF Optimal Solutions and Dalkia decided to join forces to share their
know-how and benefit from the strong complementarities between their energy efficiency proposed solutions
Integration of Verdesis on 11 February 2015, following its acquisition from EDF Energies Nouvelles, aimed at optimise strategy
due to Verdesis’ close business proximity with Dalkia’s activities. Verdesis is specialised in biogas generation, treatment and
sales
The acquisition of Cesbron on 18 March 2015, a company specialised in industrial and commercial refrigeration systems as well
as in air-conditioning engineering. This transaction enables Dalkia to enhance its strategic positioning in refrigeration activities

182
Overview of EDF’s energy services subsidiaries
Energy services EDF’s strategy Subsidiaries Focus on Dalkia EDF main businesses
The EDF group delivers energy services solutions to its customers through four main subsidiaries:
~€3bn(1) in sales
Active in France
11,200 employees
Dalkia France, a leader in energy services, offers local solutions to reduce
energy consumptions and improve facilities’ performance through three business
activities: heating and cooling networks, energy services for buildings and
industrial utilities
~€400m in sales
Active in Italy, Spain,
Poland and Russia
~2,000 employees
EDF Fenice offers comprehensive technical and financial solutions to ensure
quality and efficient technical operation of industrial facilities, under mid- to long-
term Energy Performance Contracts
~€230m in sales
Active in France, the UK
and Canada
~1,100 employees
The Tiru group, an expert in renewable energy generation from waste, designs,
builds and operates energy-from-waste plants and biomass facilities in France,
the UK and Canada (incinerators, anaerobic digestion, etc.)
~€250m(2) de CA
Active in18 countries
~3 000 employees o/w 500 in France
Citelum assists cities and industries, in France and internationally, towards
smarter, more efficient and safer lighting systems under urban lighting
management contracts (lighting, illuminations), public transport management
(signaling, traffic management) and management of security and communication
equipment connected to the lighting network
(1) Dalkia’s sales for the entire FY2014. Its contribution to the 2014 Group sales since its full integration in the Group’s consolidation scope on 25 July 2014 is €1,323m
(2) Citelum’s sales for the entire FY2014. Its contribution to the 2014 Group sales since its full integration in the Group’s consolidation scope on 25 July 2014 is €133m
In 2014

183
Dalkia, a major player of the energy transition supporting its customer base
Energy services EDF’s strategy Subsidiaries Focus on Dalkia EDF main businesses
Through its “green” heating networks fuelled with renewable energy sources and energy recovery
Through its energy performance contracts (EPC) and its remote facility management centers for full optimisation of energy facilities’ efficiency
CONTINUED REDUCTION
IN CO2 EMISSIONS
Over 6 years, the share of gas used by Dalkia in its
facilities dropped by a third and the share of renewable
energy sources was multiplied by 4
2.4 million tonnes of CO2 saved in 2014

184
Dalkia’s business activities
Energy services EDF’s strategy Subsidiaries Focus on Dalkia EDF main businesses
HEATING AND COOLING NETWORKS
328 district heating and cooling networks
2.4 million homes serviced through collective heating systems
ENERGY SERVICES TO BUILDINGS
2,300 sites in the healthcare sector
16,500 schools, sports and leisure facilities
ENERGY SERVICES TO THE INDUSTRY
2,000 industrial plants

FACTS
& FIGURES
FACTS
& FIGURES GROUP CORPORATE
RESPONSIBILITY
APPROACH

186
Group corporate responsibility approach
187
189
197
198
199
A strong undertaking for the Group
Extra-financial rating: a constant source of improvement for the Group
Monitoring and certifications
Innovations in corporate responsibility
Commitments associated with a strong monitoring
The EDF group EDF main businesses Finance Market data Appendices Corporate responsibility R&D

187
A strong undertaking
Extra-financial rating
Materiality matrix: prioritising commitments in sustainable development
Corporate responsibility Commitments Monitoring and certifications
Innovations
In 2014, EDF carried out its first materiality analysis(1)
guaranteeing that the Group is taking into account and reporting on all the most significant economic, social, societal and environmental issues
keeping the Group’s sustainable development approach up to date with regard to the expectation of its key stakeholders
(1) In accordance with the definition of the principle of materiality, as it appears in article 225 of the Grenelle 2 law, the AA 1000 assurance standard, the GRI G4 guidelines, ISO 26000 standard and the IIRC framework on integrated reporting
Business ethics and human rights
Governance
Nuclear waste
Responsible subcontracting and
procurement
Prices and fuel poverty
Safety of facilities
Carbon-free nuclear & hydropower
mix
Development of new renewable
energies
Demand Side Management
Health & safety
Air pollution
Biodiversity
Efficient power generation and
distribution
Management of water resources
Skills development and career
management
Dialogue with stakeholders and
transparency
Innovation
Socio-economic development of
local territories and communities
Costumer relationship
Quality of service and continuity of
supply
Other waste
Diversity and battle
against discriminations
Compensation and social
benefits
Access to electricity
Sponsoring and
philanthropy
Social dialogue & relations
Energy performance of
EDF’s real estate portfolio
Soil pollution
Well-being at work
Noise and olfactory
nuisances
Protection of personal
data/privacy Visual pollution
Significant Importance for EDF High priority
Legend:
environmental issues societal issues
social issues cross-interests issues
S
ignific
ant
I
mport
ance for
sta
kehold
ers
Hig
h
Pri
ori
ty

188
A strong undertaking for the Group
A strong undertaking
Extra-financial rating Corporate responsibility Commitments Monitoring and
certifications Innovations
Commitments that cover the main issues
Commitments devised with all businesses and subsidiaries of the Group
Results validated every year by the EDF’s Executive Committee and presented during the Shareholders’ Meeting
11 shared objectives covering 3 areas
Responsible
Employer
Responsible
Partner
Responsible
Industrial Firm

189
A responsible industrial firm
A strong undertaking
Extra-financial rating Corporate responsibility Commitments Monitoring and
certifications Innovations
123 102
2013 2014
Maintaining the highest levels of security in Group installations
International FTSE4Good(1) criteria for nuclear safety met
2014 Results
Maintained in the FTSE4Good index
Investing in renewable energies to increase their competitiveness
Installed renewable generation capacity of the Group (in MWe)
Remaining the best among major energy providers in the development of low-carbon energy
Direct CO2 emissions (g/kWh) of the Group kept within the 150g/kWh limit(3)
Significantly contributing to the improvement in energy efficiency within households Number of households supported by Group companies in terms of energy efficiency(5)
(2) Group consolidated data restated for the impact of the IFRS norms 10 & 11; Dalkia France
100% consolidated for the full year
(1) The FTSE4Good Index Series was created by FTSE and aims to promote investments in
companies that respect ambitious sustainable development objectives
(5) Subsidiaries included in the consolidated scope of the Group and selling energy to residential customers
(6) Group consolidated data in accordance with the IFRS norms in application in 2014 (CENG, Sloe Centrale
et Estag are considered as joint-ventures and consolidated under the equity method starting 1 January 2014);
Dalkia France 100% consolidated for the full year
(3) Group consolidated data restated for the impact of the IFRS norms 10 & 11; Dalkia France 100%
consolidated for the full year
(4) Group consolidated data in accordance with the IFRS norms in application in 2014; Dalkia France 100%
consolidated for the full year
(3) (4)
4,782
562
21,902
456
5,340
536
21,889
500
Wind Solar Hydro Other renewables
2013 2014 (2)
328,800
53,400 1,960
394,300
51,200 2,780
EDF EDF Energy Electricité de Strasbourg
2013 2014
(6)

190
A responsible employer
A strong undertaking
Extra-financial rating Corporate responsibility Commitments Monitoring and
certifications Innovations
Resolutely reducing workplace accidents among our employees and subcontractors
Lost-time accident for Group employees frequency rate divided by two within 5 years
Preserving performance and professional excellence of the employees through training and promotion of diversity
Over 75% of Group employees receive, every year, at least one training session
2013: 25% 2014: 24%
85% 85%
2013 2014
No tolerance for breach of human rights, fraud and corruption, in any of the Group’s companies and among their suppliers
(3) Except energy contracts on the spot market
13 companies will meet the requirements of the United Nations “Global Compact Advanced” level by 2017
13 companies will include an Ethics/SD clause in their long-term purchasing contracts(3) by 2015
In 2014: 2 companies have reached the Advanced level
EDF (since 2012) and Edison (since 2013)
At end-2014: the 13 companies will have signed the Global
Compact 6 new in 2014
2014 result: 13 companies (vs. 8 companies in 2013)
EDF
ERDF
EDF Energy
Edison
EDF Luminus
EDF Polska
EDF Démasz
EDF Norte Fluminense
(1) Group consolidated data restated in accordance with the IFRS framework in application in 2014;
Dalkia France and Citelum 100% consolidated over the last 6 months of the year
(2) The previous 2017 objective of 1.9 was adjusted in 2014 after Dalkia’s and Citelum’s integration
to take into account the specificities of their businesses
TIRU
Électricité de Strasbourg
SOCODEI
EDF Énergies Nouvelles
EDF Trading
3.1 3.1
2.2
2013 2014 2017 (1)
Objective (2)
By 2015, women should represent 30% of the pool of potential future top executives

191
A responsible partner
A strong undertaking
Extra-financial rating Corporate responsibility Commitments Monitoring and
certifications Innovations
Promote transparency and dialogue on sensitive issues
8 companies will set up a formal space for dialogue with stakeholders by 2015
Proactively fighting energy poverty and promoting access to electricity
Number of actions(1) to support our customers in need carried out by Group companies that supply energy
Contributing to the development of territories through employment
Number of direct jobs (Group employees) and indirect jobs (resulting from purchasing orders with suppliers and service providers) generated by EDF business activities
Preserve water resources in all our activities
Publication, starting in 2015, of the water footprint at Group level
Since 2013, EDF coordinates the development of a water impact assessment
tool applicable to all energy-related activities, all over the world, through a
collaboration with the scientific community and international bodies representing
the coal, nuclear, hydrocarbons and renewable sectors.
In 2014, the methodology was tested on 12 sites: 8 EDF sites (four nuclear
power plants in France, two thermoelectric ones o/w one in Poland, and two
hydropower plants), 2 Engie’s thermal sites and two Hydro-Québec hydropower
plants. The methodology was presented at the World Water Forum of Daegu, in
South Korea, in April 2015. It will be applied to the Group’s priority sites in the
course of 2015.
2014 result: 3 companies
EDF: Sustainable Development Committee France
EDF Energy: Stakeholder Advisory Panel
Edison: Social Committee
Since 2005, EDF has set up the Sustainable Development
Panel of stakeholders at Group level.
158,161
475,545
Direct jobs Indirect jobs
2014
(2) Consolidated scope
(3) Application of the same auditable method as in 2013. In 2014, calculation of the indicator, excluding
nuclear fuel cycle and uranium purchases, includes EDF, ERDF, EDF Energy, EDF Polska, Edison, EDF
Luminus, EDF Énergies Nouvelles, Électricité de Strasbourg and TIRU. Full-time equivalent data shown.
n. c. not collected. Consolidation of Edison for the first year in 2014
(1) Energy management advisory, negotiated payment plan, provision of financial support , etc.
625,000
190,000 36,557 2,000
804,300
233,000 39,207
1,870
1,031,000
389,600
31,240 2,600
26,600
EDF EDF Energy EDF Luminus Démász Edison
2012 2013 2014
n.c. n.c.
(2)
(3)

192
CO2 emissions undergo a structural decrease
A strong undertaking
Extra-financial rating Corporate responsibility Commitments Monitoring and
certifications Innovations
84,3
94,1 91,6
72,5 80,0
70,5 79,8 79,3
64,3
136,0 138,6 133,1
111,1 113,1
99,6
117,0 123,0
102,0
20
40
60
80
100
120
140
20
40
60
80
100
120
2006 2007 2008 2009 2010 2011 2012 2013 2014
This performance results from a long-term low-
carbon industrial policy…
Fuel switching
Coal-fired plants shutdown
Improvement in plant efficiency
… and from favourable weather conditions in 2014
(Mtons) (g/kWh)
Group CO2 emissions
0
10
20
30
40
EDF CO2 emissions in mainland France
(Mtons)
The EDF group makes a significant contribution to
holding the average European carbon factor at a
relatively low level (328g/kWh in 2013(1)), i.e.
428kgCO2/MWh excluding EDF
(1) Source: PWC study of December 2014
(2) Group consolidated data restated for the impact of the 10 & 11 IFRS norms; Dalkia France 100% consolidated for the whole year
(3) Group consolidated data in accordance with the IFRS framework in application in 2014; Dalkia France 100% consolidated for the whole year
(2) (3)

193
Water: a resource under control, an international commitment
A strong undertaking
Extra-financial rating Corporate responsibility Commitments Monitoring and
certifications Innovations
A low Group exposure to water stress
Asia
South America
Europe
sea water
brackish water
fresh water
98% of cooling water withdrawn by the Group is located in Europe
Seawater represents 65% of the withdrawn water
99% of the withdrawn water is returned to the natural environment
25,255 (52%) 5,836 (12%) 17,725 (36%)
6 (100%)
570 (58%)
416 (42%)
Commitments made at the 6th World Water Forum in 2012 Invest in all necessary resources to develop methods and tools to evaluate the water footprint of electricity generation activities Manage the water footprint of electricity generation activities Create local value and taking into account the objective of the water footprint minimisation from the design phase of power plants
Results EDF is developing an evaluation tool (Water for Energy Framework programme), in partnership with the scientific community and the
international bodies of the energy sectors Validation of the first version in 2014, 12 sites being tested, o/w 8 EDF ones
Geographical breakdown of cooling water withdrawals – 2014 (in miilion of cubic meters)

194
Health and safety of employees: an absolute priority
A strong undertaking
Extra-financial rating Corporate responsibility Commitments Monitoring and
certifications Innovations
(1) Number of occupational accidents that led to an absence from work of more than one day, recorded over the current year and per million hours worked
A health and safety policy at Group level
Results in line with the ambition
Issued in January 2014, this policy is applicable
to all companies controlled by the EDF Group, in all countries in which EDF operates
to both EDF’s employees and its subcontractors’ employees working on its facilities and premises
It is based around four guiding principles:
responsibility
stakeholder commitment
continuous improvement
sharing of good practices and feedback
For Group employees: stable results vs. 2013 Objective: halving occupational accidents between 2012 and 2017
For subcontractors: publication started in 2014
2014 result: 4.2
Target
No accident
No health impact
Health/security training
EDF profit-sharing criteria on the proportion of employees
who have followed some form of training in health, security
and risk prevention. Objective between 30% and 45%
2014 result: 44.9%
Frequency rate(1)
3.1 3.1 2.2
Employee frequency rate
2013
2014
2017 target

195
Energy poverty: commitment of the Group beyond regulatory obligations
A strong undertaking
Extra-financial rating Corporate responsibility Commitments Monitoring and
certifications Innovations
In France, EDF’s action is based on three types of measures:
help in bills payment: financial contribution to part of the energy bills, as part of the housing solidarity funds (FSL)
assistance to costumers in difficult situations: alert programme for vulnerable costumers
„„preventive actions: improvement of energy efficiency for the homes of people that are in energy poverty situation (“Habiter Mieux” programme)
In other Group companies
„„EDF Energy
regulatory obligations: ECO (Energy Companies Obligation) government initiative to help households
voluntary programs: energy management advisory, help for debt payments of vulnerable households (EDF Energy Trust Fund)
FSL « Habiter Mieux »
Energy Companies Obligation EDF Energy Trust Fund
23.3 23
financial contribution (€m)
2013
2014
29
32
financial contribution (€m)
2001-2013
2014
2015-2017: €29m/year
200,000 households
helped
194,000 households
helped
29,000 home
renovations
50,000 home
renovations
2013 - 2015 period:
Target reached by end-2014 with €610m
2014
4,036 treated demands for €3.4m

196
EDF: responsible buyer
A strong undertaking
Extra-financial rating Corporate responsibility Commitments Monitoring and
certifications Innovations
A corporate responsibility approach incorporated in the purchasing process
Revision in 2014 of its main stakes:
sustainable development quality purchasing policy
Sustainable Development Charter for contracting suppliers
CSR risk mapping in purchasing segmentation
Shared stakes within the Group
Development of an evaluation platform of contractors’ CSR practices made available to departments and subsidiaries
A performance under control
• In 2014, the EDF Group’s Purchasing Department conducted 129 “Sustainable development/CSR” assessments for an announced target of 90 assessments
Allocation of the 129 evaluations
56% 44%
audit
questionnaires

197
A rigorous monitoring supported by an external verification
A strong undertaking
Extra-financial rating Corporate responsibility Commitments Monitoring and
certifications Innovations
Certification: 98% of Group sales covered by the ISO 14001 certification
EDF and the Global Compact
Member since 2001
Level: Global Compact Advanced since 2012
Third party verification: since 2005, the Group undergoes a voluntary process whereby the quality of its social and environmental indicators is verified by Statutory Auditors
2005 & 2006
“Agreed-upon
procedures” level of
verification
2007 to 2010
“Limited assurance” verification on
a selection of indicators
2011 & 2012
“Mixed assurance” verification
• reasonable on carbon and
workforce
• limited on other indicators
2013 & 2014
Attestation of that the CSR information is presented
in the Reference Document and the management
report
Formed opinion on the fair presentation of CSR
Information with:
• a reasonable assurance on carbon and workforce
• a limited assurance on other indicators
Voluntary progressive approach until the obtaining of a Mixed Assurance Compliance with the Grenelle II law
Continuation of the voluntary procedure

198
Non-financial ratings: major achievements for the Group in 2014
A strong undertaking
Extra-financial rating Corporate responsibility Commitments Monitoring and
certifications Innovations
Significant progress in EDF’s non-financial rating by leading agencies
Inclusion in a growing number of sustainability indices
Latest achievement: EDF’s inclusion in the 2015 Global 100 Index, only company in the Electric Utilities sector
EDF member of the FTSE4Good Index
Group admission confirmed in 2014 with a high level of performance
EDF rated at 58/100 in 2014 (vs. 55/100 previously)
2013 2014
Transparency score 95 98
Performance score B B
EDF member of the CDLI France 2014
(Climate Disclosure Leadership Index)
2013 2014
EDF score 66% 79%
Average Electricity sector score 54% 56%
EDF member of all applicable Euronext
Vigeo indices: World 120, Europe 120,
Eurozone 120, and France 20
EDF member of the STOXX ESG Leaders Index
EDF rated at 76/100 in 2014 (vs. 71/100 in 2013)
The EDF Group is now one of the five global nuclear
operators meeting the stringent criteria developed and
overseen by the FTSE4Good Policy Committee. In 2014, the
rating is 4.3/5 (3.7/5 in 2013)
EDF 2014 Industry Mover and
Bronze Class in RobecoSam
Sustainability Yearbook

199
Innovation: environment
A strong undertaking
Extra-financial rating Corporate responsibility Commitments Monitoring and
certifications Innovations
The project: the Cordemais plant continuously withdraws water from the Loire
estuary, an area of abundant aquatic wildlife, to cool its systems. During the
extractions of water, through powerful 14 meter-deep pumps, fish are
sometimes sucked up. To limit this, the site has fitted its filter drums (used to
separate water from solids) with screw-shaped pumps to gently return any fish
sucked up during the extraction to their natural habitat. The new system does
not affect the performance of the pumping and does not generate additional
maintenance costs. Cordemais is the first French thermal plant to implement
this solution. The initiative is part of continuing efforts by the plant to conserve
wildlife in the Loire over the last 5 years. The project, carried out with support
from the Loire-Bretagne Water Agency, is an illustration of EDF's biodiversity
policy.
Benefits: protects aquatic wildlife.
Implementation: the system has currently been fitted at two units of the
Cordemais plant and will be expanded to the remaining two units. It can be
copied at any generation plant which extracts river water.
Cordemais fish pump
Cordemais thermal power station
Removal of fish recovered by the pump

FACTS
& FIGURES
FACTS
& FIGURES FINANCE

201
CSPE
Historical financials
Finance
202
236
2014 results, 2015 targets and 2018 ambition 207
Focus on the Group’s credit profile 222
The EDF group EDF main businesses Finance Market data Appendices Corporate responsibility R&D

202
Historical financials (1/5)
Finance 2014 results, 2015 targets and 2018 ambition Historical financials Focus on credit profile CSPE
Net income excluding non-recurring items evolution from 2010
(1) CAGR
Note: presented figures are pro forma data from one year to another, but are not restated consistently throughout all years
2010 2011 2012 2013 2014
61% 62% 62% 67% 71%
39% 38%
38% 33% 29%
15,998
14,156
International &
Other activities
France
EBITDA evolution from 2010
In millions of Euros In millions of Euros
14,939
16,099 17,279
2010 2011 2012 2013 2014
3,105
3,607
4,175 4,117
4,852
EBITDA increased by 5.1%(1) from 2010 Net income excluding non-recurring items increased by
11.8%(1) from 2010

203
Historical financials (2/5)
Finance 2014 results, 2015 targets and 2018 ambition Historical financials Focus on credit profile CSPE
Net income – Group share growth
(1) At constant scope and exchange rates
(2) +3.2% excluding tariff catch-up
(3) 2011 Net income Group share: 3x vs. 2010 Net income Group share
EBITDA growth(1) vs. Guidance
6.6%
4.6%
5.5%
6.5%
4% 4%
3% 3%
2011 2012 2013 2014
EBITDA growth Min guidance (1)
(2)
N/A(3)
For 4 years, results above targets For 4 years, Net income – Group share in
continuous improvement
0%
5.3%
7.4%
5.2%
2011 2012 2013 2014
Net Income Groupe Share growth

204
Historical financials (3/5)
Finance 2014 results, 2015 targets and 2018 ambition Historical financials Focus on credit profile CSPE
2011 2012 2013 2014
2.5%
3.1%
1.1% 0.9%
OPEX growth(4) from 2011
(1) Gross operational investments including Linky
(2) Data restated for the impact of IFRS 10 & 11
(3) CAGR
(4) Published data of organic growth at constant scope and exchange rates
(5) At constant method
2010 2011 2012 2013 2014
65% 66% 62% 69% 65%
35% 34%
38% 31% 35% 10,274
International &
Other activities
France
CAPEX(1) evolution from 2010
In millions of Euros
11,134
13,386 13,042
13,721
(2) (5)
Ongoing efforts to control Opex CAPEX increased by 7.5%(3) from 2010

205
Historical financials (4/5)
Finance 2014 results, 2015 targets and 2018 ambition Historical financials Focus on credit profile CSPE
2010 2011 2012 2013 2014
8.6 9.2 8.5 9.0
13.2
2010 2011 2012 2013 2014
34,389 33,285
39,175
33,433 34,208
2.2 2.2
2.4
2.1 2.0
Net debt and net debt / EBITDA evolution from 2010
(1) Data restated for the impact of IFRS 10 & 11
(2) Pro forma after allocation of the CSPE deficit to dedicated assets on 13 February 2013 and substraction of €2.4bn from the dedicated assets portfolio, enabling
100% coverage of nuclear liabilities that are eligible for dedicated assets
In millions of Euros
Debt maturity and coupon evolution from 2010
Lowest debt ratio over the last 5 years
(1)
Net debt Net debt/EBITDA Average maturity of gross debt (in years)
Average coupon
Longer maturity and lower cost of debt over the
last 5 years
(2)
4.40% 4.30%
3.70% 3.80% 3.29%

206
Historical financials (5/5)
Finance 2014 results, 2015 targets and 2018 ambition Historical financials Focus on credit profile CSPE
(1) Excluding tariff catch-up or 52% including the 2012-2013 tariff catch-up
(2) In 2013, part of the 2012 final dividend paid in stocks resulted in a share capital increase of 6 millions of Euros, corresponding to the issuance of 11,141,806 shares
(3) Shareholders holding their shares continuously for at least two years at the end of the year and still holding them at the payment date will benefit of a loyalty dividend of 10%. The
final dividend distributed for 2013 stood at €0.805 per share for the shares benefiting from the loyalty dividend
53.6%
60.4%
55.0% 56.5%
58.0%
0.57 0.57 0.57 0.57 0.57
0.58 0.58 0.58
0.68 0.68(3)
0.10
In € per share
Final dividend
Interim dividend
2010 2011 2012 2013
Dividend payout ratio from 2010 Dividend per share from 2010
2010 2011 2012 2013
1.25 1.25 1.15 1.15
Dividend full payment
in shares(2)
2014
1.25
2014 (1)

207
2014 results: financial targets delivered or exceeded
Finance 2014 results, 2015 targets and 2018 ambition Historical financials Focus on credit profile CSPE
(1) At constant scope and exchange rates, excluding the impact of the regulated tariffs catch-up for the period from 23 July 2012 to 31 July 2013 following the French
State Council’s decision of 11 April 2014
(2) EBITDA Edison 2014 including the impact of the Russian gas contract renegotiation of +€80m
(3) Adjusted for interest payments on hybrid bonds booked in equity
Targets
EBITDA growth(1) excluding Edison: at least 3%
Net finanial debt/EBITDA: 2.0x-2.5x
Payout of Net income excluding non-recurring items(3): 55% to 65%
Edison EBITDA before effect of gas contract renegotiations: more than €600m
Actual
+3.2% excluding tariff catch-up
2.0x
Proposed dividend of €1.25/share
52%/58% excluding tariff catch-up
€801m(2)

208
2014 results: simplified income statements
Finance 2014 results, 2015 targets and 2018 ambition Historical financials Focus on credit profile CSPE
(1) Earnings per share = (Net income Group share – Payments on hybrid bonds) / average number of outstanding shares, in compliance with IAS 33 including effects
of interest payments on hybrid bonds for €103m in 2013 and €388m in 2014
(2) Excluding non-recurring items & IAS 39 volatility
In millions of Euros 2013 restated 2014
Sales 71,916 72,874
Fuel and energy purchases (38,116) (36,704)
Other external expenses (8,287) (9,181)
Personnel expenses (11,291) (11,785)
Taxes other than income taxes (3,481) (3,593)
Other operating income and expenses 5,358 5,668
EBITDA 16,099 17,279
IAS 39 volatility 14 203
Net depreciation ans amortisation & increases in provisions for renewal (7,381) (8,097)
(Impairment) / reversals (398) (1,401)
EBIT 8,334 7,984
Financial income (2,942) (2,551)
Income before taxes of consolidated companies 5,392 5,433
Group net income 3,517 3,701
Earnings per share(1) 1.84 1.78
Net income excl. Non-recurring items(2) 4,117 4,852

209
2014 results: EBITDA growth driven mainly by France
Finance 2014 results, 2015 targets and 2018 ambition Historical financials Focus on credit profile CSPE
(1) Data restated for the impact of IFRS 10 & 11
(2) Organic growth at constant scope and exchange rates, including +4.6% from the 2012-2013 tariff catch-up
(3) Group impact of the tariff catch-up: +€744m, including +€731m in France and +€13m at Electricité de Strasbourg
16,099 17,279
+131 +1,357
(170) (183) +45
Organic growth: +6.5%(2)
Italy
Scope and forex
France
UK Other
Lower impact in 2014 from renegotiations of gas contracts
O/w UK forex: +€116m
2013(1) 2014
Decrease of nuclear output
Tariff catch-up: +€731m(3)
In millions of Euros

210
2014 results: sales and EBITDA by reporting segment
Finance 2014 results, 2015 targets and 2018 ambition Historical financials Focus on credit profile CSPE
55%
14%
17%
8% 6%
71%
11%
5%
4%
9%
2014 Sales 2014 EBITDA
France
United Kingdom
Italy
Other International
Other Activities

211
2014 results: Group recurring net income driven by operating and financial performance
Finance 2014 results, 2015 targets and 2018 ambition Historical financials Focus on credit profile CSPE
(2,942)
(2,551)
(17)
+161
+180 +67
(1) Data restated for the impact of IFRS 10 & 11
In millions of Euros
Impact of fixed to floating operations
Net gains on dedicated
assets disposals
Other
2013(1) 2014
O/w:
Foreign exchange result +€122m
Discounting effect -€43m
Scope & forex
In millions of Euros 2013(1) 2014 ∆%
EBIT 8,334 7,984 -4.2%
Financial income (2,942) (2,551) -13.3%
Income tax (1,896) (1,839) -3.0
Share of net income from associates 262 179 -31.7%
Net income from minority interests 241 72 -70.1%
Net income, Group share 3,517 3,701 5.2%
Excluding non-recurring items 600 1,151
Net income excl. Non-recurring items 4,117 4,852 17.9%
Decrease in net financial expense

212
2014 results: EDF group simplified balance sheets
Finance 2014 results, 2015 targets and 2018 ambition Historical financials Focus on credit profile CSPE
(1) Including companies held for sale and loan to RTE
(2) Including hedging instruments and financial liabilities related to companies held for sale
In millions of Euros 31/12/2013
restated 31/12/2014
Fixed assets 137,748 146,078
O/w Goodwill 9,081 9,694
Inventories and trade
receivables 36,096 37,923
Other assets 57,589 65,609
Cash and equivalents and
other liquid assets (1) 18,332 18,361
Assets held for sale (excluding cash and liquid
assets)
1,154 18
Total Assets 250,919 267,989
31/12/2013 restated 31/12/2014
Shareholders’ equity (Group share) 34,207 35,191
Net income attributable to non-controlling interests
4,998 5,419
Specific concession liabilities 43,454 44,346
Provisions 66,304 73,850
Financial liabilities(2) 51,765 52,569
Other liabilities 50,191 56,614
Liabilities linked to assets held for sale (excluding financial liabilities)
- -
Total Liabilities 250,919 267,989

213
2014 results: financial data
Finance 2014 results, 2015 targets and 2018 ambition Historical financials Focus on credit profile CSPE
(1) Pro-forma after allocation of the CSPE deficit to dedicated assets on 13 February 2013 and subtraction of €2.4bn from the dedicated assets portfolio, enabling
100% coverage of EDF nuclear liabilities that are eligible for dedicated assets
In millions of Euros 2012
restated 2013
restated 2014
EBITDA 15,998 16,099 17,279
Net financial charges (1,634) (1,719) (1,752)
Funds From Operations 12,314 12,577 11,691
Net debt 39,175(1) 33,433 34,208
Shareholders’ equity including
non-controlling interests 31,111 39,205 40,610

214
2014 results: change in cash flow (1/2)
Finance 2014 results, 2015 targets and 2018 ambition Historical financials Focus on credit profile CSPE
(1) Data restated for the impact of IFRS 10 & 11
(2) O/w exceptional dividend in 2014 of €290m received from CENG
(3) Excluding Linky
In millions of Euros 2013(1) 2014 ∆%
EBITDA 16,099 17,279 7.3%
Non-cash items and change in accrued trading income (224) (1,901)
Net financial expenses disbursed (1,719) (1,752)
Income tax paid (1,936) (2,614)
Other items o/w dividends received from joint-ventures and associates(2) 357 679
Operating Cash Flow 12,577 11,691 -7.0%
∆ WCR (1,711) (1,041)
O/w CSPE receivable (360) (699)
O/w impact from tariff catch-up, VAT included - (979)
Net investments excluding strategic operations(3) (11,830) (12,045)
Cash Flow after investments (964) (1,395) -44.7%

215
2014 results: change in cash flow (2/2)
Finance 2014 results, 2015 targets and 2018 ambition Historical financials Focus on credit profile CSPE
(1) Data restated for the impact of IFRS 10 & 11
(2) Including Linky
In millions of Euros 2013(1) 2014
Cash flow after net investments (964) (1,395)
Net investments allocated to strategic operations(2) 755 158
Dedicated assets 2,443 174
Cash flow before dividends 2,234 (1,063)
Dividends paid in cash (2,445) (2,556)
Interest payments on hybrid issued (103) (388)
Cash flow after dividends (314) (4,007)

216
2014 results: stability of net investments(1)
Finance 2014 results, 2015 targets and 2018 ambition Historical financials Focus on credit profile CSPE
(48) +91 +172
(1) Net investments excluding Linky and excluding strategic operations
(2) Data restated for the impact of IFRS 10 & 11
Group - Regulated
Group - Maintenance
Group - Development
11,830 12,045 12,045
International & Other activities
Generation-Supply (Unregulated
France)
ERDF, IES (Regulated
France)
2014 2013(2) 2014
France Other
28%
46%
26% 27%
48%
25%
26%
48%
26%
In millions of Euros
International
O/w Dalkia: +€147m

217
2014 results: change in net financial debt
Finance 2014 results, 2015 targets and 2018 ambition Historical financials Focus on credit profile CSPE
(33.4) (34.2)
+11.7
(1.0)
(12.0)
(2.9) +4.0 (0.6)
(1) Data restated for the impact of IFRS 10 & 11
(2) Net investments excluding Linky and excluding strategic operations
Dividends
Net investments(2)
Operating Cash Flow
∆ WCR
Other
December 2014 December 2013(1)
Hybrid issuance
In billions of Euros
O/w forex: (1.0)
O/w:
Tariff catch-up: (1.0)
CSPE receivable: (0.7)
Weather: +0.8

218
2015 guidance
Finance 2014 results, 2015 targets and 2018 ambition Historical financials Focus on credit profile CSPE
(1) At constant scope and exchange rates, and excluding the impacts on 2014 EBITDA of the adjustment in 2012 regulated tariffs
(2) Adjusted for the interest payments on hybrid bonds booked in equity
EBITDA growth(1)
Net Financial Debt/EBITDA
Payout ratio of Net income
excluding non-recurring items(2)
0 to 3%
Between 2x and 2.5x
55% to 65%

219
2018 ambition: action plan on generating cash flow levers
Finance 2014 results, 2015 targets and 2018 ambition Historical financials Focus on credit profile CSPE
(1) Excluding Linky
-4.0
-3.0
+0.7
+0.3
WCR improvement plan
€3bn uplift targeted by 2018, equivalent to the end-2013 estimate
2014 2014 - 2018
Balance in the CSPE mechanism
EBITDA growth □ Taking into account of the regulatory and
market environment
□ Maximisation of the gross margin
□ Ongoing efforts to control OPEX
Control over net investments
Headline Cash flow
Adjusted Cash flow
Cash flow after
dividends(1)
2018
Cash flow
after
dividends(1)
positive in
2018
Normalisation
of non-cash items
CSPE
receivable
In billions of Euros

220
2018 ambition: WCR improvement plan
Finance 2014 results, 2015 targets and 2018 ambition Historical financials Focus on credit profile CSPE
(1) At constant weather and prices
Setting the 2018 target in assuming a like-for-like environment(1)
Implementing of agressive management actions
Examples of action plans implemented A contribution from all Group
business lines
France
International
~52%
~48%
Receivables
□ Optimisation of the billing and collection process
Inventories
□ Centralised management, particularly of spare
parts inventories
□ Group optimisation of purchases and inventories
of nuclear fuel
Objective: €1.8bn in cash flow optimisation over 2015-2018

221
2018 ambition: control over net investments(1)
Finance 2014 results, 2015 targets and 2018 ambition Historical financials Focus on credit profile CSPE
(1) Net operating investments excluding Linky and excluding strategic operations
Identifying non-strategic assets and maximisation of their value
New developments exclusively financed through divestments, in accordance with Cap 2030 project
Roll-out of the EDF-Amundi fund (renewables, energy services, etc.)
Existing projects: net maintenance and development investments
12 13
max. 11
2015 target 2018 outlook 2014
In billions of Euros
Developments: main capital allocation principles

222
Net financial debt: change over 2009-2014
Finance 2014 results, 2015 targets and 2018 ambition Historical financials Focus on credit profile CSPE
(1) Data published in 2009
(2) Of which UK network, RTE, EnBW, EDF EN, Edison and Dalkia
(42.5) (34.2)
+11.1 (17.0)
(12.6) +16.8
+10.1 (0.1)
2009(1)
Cash Flow excluding
investments for development
Investments for development
Hybrid bonds
Divestments & strategic
transactions(2)
Dividends paid out
Other
2014
Increase in debt of €18.5bn
In billions of Euros

223
A strong liquidity position
Finance 2014 results, 2015 targets and 2018 ambition Historical financials Focus on credit profile CSPE
Breakdown of the liquidity position as of 31/12/2014 excluding credit lines
Gross liquidity position of €28.4bn
composed by:
€4.7bn of cash and cash equivalents
~€13.0bn of liquid assets
€10.7bn of syndicated and bilateral credit lines
Net liquidity position of €19.3bn
27%
73%
Liquid assets
Cash and cash equivalents

224
Group financial debt after swaps as of 31 December 2014
Finance 2014 results, 2015 targets and 2018 ambition Historical financials Focus on credit profile CSPE
(1) Mainly HUF, CHF, PLN, BRL, CAD and JPY
Net financial debt: €34.2bn Average coupon: 3.29% Average maturity of gross debt: 13.2 years
Breakdown by type of rate
Floating rate 40%
Fixed rate 60%
Breakdown by currency
EUR 68%
GBP 23%
Others(1) 4%
USD 5%
Decrease of USD exposure and growing floating rate
76%
24%
2013 25%
61%
4% 10%
2013
2014 2014

225
Breakdown of Group debt by currency
Finance 2014 results, 2015 targets and 2018 ambition Historical financials Focus on credit profile CSPE
(1) Following the buy back of part of the original debt in late 2010, the amount that the group is actually due to disburse at the due date is €1,382bn
-
500
1 000
1 500
2 000
2 500
3 000
3 500
EUR GBP USD JPY CHF Autres
(1)
In millions of Euros, before swaps Of which
(in eq. €m) 2015 2016 2017
EUR 1,912 1,091 599
USD - - 1,435
JPY 69 303 -
CHF 25 - 579
3,500
3,000
2,500
2,000
1,500
1,000

226
Comparative debt ratings
Finance 2014 results, 2015 targets and 2018 ambition Historical financials Focus on credit profile CSPE
Sources: rating agencies as of 2 July 2015
(1) Update of the rating and outlook of EDF Group by S&P on 7 May 2015
(2) Update of the rating and outlook of EDF Group by Moody’s on 16 April 2015
BBB+ A- A A+
A3
A2
A1
Aa3
EDF Engie
E.ON Iberdrola
Vattenfall
RWE
SSE
Mo
ody’s
ratings
S&P ratings
Enel
Baa1
S&P Ratings
Moody’s Ratings
Fitch Ratings
EDF A+ negative(1) A1 negative(2) A+ negative
Engie A stable A1 negative n/a
E.ON BBB+ stable Baa1 stable A- watch
negative
Enel BBB positive Baa2 stable BBB+ stable
Iberdrola BBB positive Baa1 stable BBB+ stable
SSE A- stable A3 negative A- negative
RWE BBB+ negative Baa1 negative BBB+ negative
Endesa BBB positif n/a BBB+ stable
Vattenfall A- stable A3 stable A- negative Baa2
BBB
Endesa
n/a: not available

227
Group provisions for employee benefits: €24.1bn
Finance 2014 results, 2015 targets and 2018 ambition Historical financials Focus on credit profile CSPE
+1,639
+4,611
(667) (940) +144
19,331
-1 423
Actuarial losses
42 697
2014 net
expense
Employer’s contribution to
funds
31/12/2014 31/12/2013
restated
Benefits paid
In millions of Euros
Scope and Other
24,118
Mainly impact of the decrease in French discount rate from 3.5% to 2.2%

228
Group nuclear provisions: €44.3bn
Finance 2014 results, 2015 targets and 2018 ambition Historical financials Focus on credit profile CSPE
+955 (1,423)
42,139
-1 423 Reductions
Allowances Discounting
31/12/2014
+2,004
-468
31/12/2013
restated
Foreign exchange
adjustments
+657
In millions of Euros
Other changes
(12)
44,320

229
In millions of Euros 31/12/2013
restated Net
allowances Discounting
Other changes 31/12/2014
Total provisions for back-end nuclear
cycle 17,321 (402) 808 54 17,781
Provisions for management of spent fuel 9,779 (191) 462 55 10,105
Provisions for long-term management of
radioactive waste(1) 7,542 (211) 346 (1) 7,676
Total provisions for nuclear dismantling
and last cores 15,337 259 736 (53) 16,279
Provisions for dismantling power stations 13,024 259 625 (42) 13,866
Provisons for last cores 2,313 - 111 (11) 2,413
TOTAL NUCLEAR 32,658 (143) 1,544 1 34,060
EDF’s France nuclear provision: €34.1bn
Finance 2014 results, 2015 targets and 2018 ambition Historical financials Focus on credit profile CSPE
(1) The measurement of Cigéo provision is sensitive to the gross cost of storage, but also to key assumptions. A €1billion rise in the gross contractors’ quotes under 2011 economic conditions would
have an estimated impact of approximately €200million (present value) on the provision at 31 December 2014. For more details, see the 2014 consolidated accounts, section 29.1.2
(http://shareholders-and-investors.edf.com/fichiers/fckeditor/Commun/Finance/Publications/Annee/2015/resultats_annuels/va/EDF-2014-consolidated-statements.pdf)

230
Discount rate for nuclear provisions in France
Finance 2014 results, 2015 targets and 2018 ambition Historical financials Focus on credit profile CSPE
(1) Calculation under current scheme
For more details, see the 2014 consolidated accounts, section 29.1.5, “Discounting of provisions related to nuclear generation and sensitivity analyses”
The discount rate determined under the Company’s usual method is 4.6% as at 31 December 2014, assuming inflation of 1.7%
Ongoing discussions since 2013 between nuclear operators and the French administration regarding the mechanism for the discount rate have been completed and they are expected to be translated into regulations in the first quarter of 2015
Under the new mechanism, the ceiling on the discount rate would be about 4.8% as of 31 December 2014
December 2013 June 2014 December 2014
Nominal discount rate 4.8% 4.8% 4.6%
Regulatory ceiling rate 4.58% 4.46% 4.31%(1)
Inflation rate 1.9% 1.9% 1.7%

231
Analysis of sensitivity to the discount rate
Finance 2014 results, 2015 targets and 2018 ambition Historical financials Focus on credit profile CSPE
Sensitivity to the discount rate
Provisions
(discounted value)
On balance sheet provisions
On pre-tax earnings
In millions of Euros +0.20% -0.20% -0.30% +0.20% -0.20% -0.30%
Front-end nuclear
Management of nuclear fuel 10,105 (171) 180 274 141 (149) (227)
Long-term management of
radioactive waste 7,676 (381) 425 657 327 (368) (568)
Dismantling and last cores
Dismantling of nuclear plants 13,866 (431) 449 681 52 (54) (82)
Last cores 2,413 (64) 68 103 - - -
Total 34,060 (1,047) 1,122 1,715 520 (571) (877)
(1) Calculation under current scheme
For more details, see the 2014 consolidated accounts, section 29.1.5, “Discounting of provisions related to nuclear generation and sensitivity analyses”

232
Dedicated assets
Finance 2014 results, 2015 targets and 2018 ambition Historical financials Focus on credit profile CSPE
(1) Share pertaining to future costs of the long-term management of radioactive waste
(2) Including RTE and TIGF’s shares
(3) Including RTE, TIGF et Porterbrook shares
7.6
14.6
13.9 3.3
5.1 0.5
In billions of Euros
Dedicated assets Provisions
CSPE
receivable
EDF Invest(3)
Financial portfolio and liquid assets
Provisions for LT management of
radioactive waste
Provisions for last cores(1)
Provisions for dismantling of nuclear plants
7.5
13.9
13.0 2.8
5.0
0.5
Dedicated assets Provisions
21.7 21.0
CSPE
receivable
EDF Invest(2)
Financial portfolio and liquid assets
Provisions for LT management of
radioactive waste
Provisions for last cores(1)
Provisions for dismantling of nuclear plants
23.0 22.0
31/12/2013
31/12/2014
The coverage ration of EDF nuclear liabilities eligible for dedicated assets is 105% as of 31 December 2014

233
Revised coverage of nuclear provisions by Dedicated Assets
Finance 2014 results, 2015 targets and 2018 ambition Historical financials Focus on credit profile CSPE
Decree no. 2015-331 of 24 March 2015 modifying the decree no. 2007-243 of 23 February 2007 to secure
financing of long term nuclear expenses, and published at the Journal Officiel on 26 March 2015:
□ Introduces an additional requirement regarding the coverage of nuclear provisions by Dedicated Assets
□ Whilst making the possibility to withdraw assets more explicit
If provisions do not change, except for discounting effects and expenses covered by the liability
Any potential margin between 100% and 110% is meant to cover future risks on asset return and cannot be reduced
through asset withdrawals
If provisions increase because of higher future expenses or new assumptions
An absolute increase in assets must match the absolute increase in liability, up to 110% of the new liability
If provisions decrease because of lower future expenses or new assumptions
Assets can be withdrawn by the same absolute amount, while still maintaining 100% minimum

234
EDF dedicated assets performance in 2014
Finance 2014 results, 2015 targets and 2018 ambition Historical financials Focus on credit profile CSPE
(1) Full-year performance before tax. The portfolio performance (bonds and shares) is 10.7%, compared with a benchmark of 12.6%
(2) Including RTE, TIGF and Porterbrook shares
(3) CSPE receivable after hedging
Financial portfolio performance above 10% for the third year in a row:
□ Conservative allocation decisions: bond under sensitivity and underweight in Pacific and emerging markets shares at the beginning of the year
□ Implementation of a more diversified strategic sovereigns and corporate benchmark bond index
EDF Invest, which manages the unlisted investments posted a performance of 8.4% and continues to build its portfolio
The CSPE receivable is remunerated at a rate of 1.72% p.a. with a redemption timeframe by 2018
Shares and bond funds
EDF Invest(2)
Shares and equity funds
CSPE receivable(3)
3,264
6,419
7,574
5,136
Portfolio breakdown as of 31 December 2014
23,033
In millions of Euros
Performance(1) 2014: +7.9%
Average annual performance over 10 years: +6.0%
Cash
640

235
EDF Invest is continuing to build its portfolio
Finance 2014 results, 2015 targets and 2018 ambition Historical financials Focus on credit profile CSPE
Infrastructures
RTE (France): 50% stake in RTE(1) allocated to Dedicated Assets since 31 December 2010
TIGF (France) : stake of 18%(2) in TIGF, the transport and gas storage operator of the Southwest of France, acquired in July 2013 from Total in consortium with SNAM and GIC
Porterbrook (United Kingdom): minority stake in a consortium with Allianz Capital Partners, the Canadian pension fund AIMCO and the Australian fund Hastings. Porterbrook is one of the three main railway material leasing companies in the UK
Madrileña Red de Gas (Spain): minority stake in a consortium with the Chinese investor Gingko Tree and the Dutch pension fund PGGM. Madrileña Red de Gas is the operator of the main gas distribution network in the region of Madrid (investment carried out in May 2015)
Real estate
Campus Thalès (France): minority stake, alongside AG Real Estate and Predica, in a property complex of about 85,000m² in Gennevilliers hosting Thalès Communications and Security company
Zalando Headquarters and Steigenberger Hotel (Germany): minority stake alongside Amundi in a property complex made up of offices and a hotel in Berlin(3)
Cottbus (Germany): minority stake alongside Amundi in a shopping center in Cottbus(3)
Gerland (France): minority stake alongside Gecina, in a tertiary property complex under construction in Lyon, subject to a lease agreement with EDF
Intermediate Housing Fund (France): stake in the fund set up by Société Nationale Immobilière
Private Equity Ten participations as of today, complying a diversification objective by fund type and geography
(3) Interests called to be held via a real estate fund created with Amundi complementing, not
exhaustively, EDF Invest real estate investment strategy (1) RTE is a subsidiary fully owned by EDF group
(2) 18% as of March 2015 following disposal of 2%

236
Scope of CSPE (Contribution to Electricity Public Service costs in France)
Finance 2014 results, 2015 targets and 2018 ambition Historical financials Focus on credit profile CSPE
The CSPE covers 3 different public service mandates:
Lost revenues and additional costs associated with EDF’s participation in the TPN (basic necessity tariff) for low-income households
People concerned:
2.33 million households (mainland France, Corsica and overseas departments) benefited from TPN at end-2013
200,000 households in 2014 for the FSL(1)
Additional generation costs in non-interconnected regions (Corsica and overseas departments), not covered by the energy share of regulated tariffs
Electricity is sold in non-interconnected regions at the same price as mainland France despite significantly higher generation costs
Purchase obligations
Originally designed for cogeneration units, they have now been extended to output volumes of electricity generated using renewable energy sources (mainly wind and solar power)
(1) Housing Solidarity Fund

237
CSPE principles and announced increases
Finance 2014 results, 2015 targets and 2018 ambition Historical financials Focus on credit profile CSPE
The Electricity Public Service Contribution (CSPE) □ is levied on consumers via a “Other services” line in their electricity bill
□ is collected by grid operators and electricity providers
□ is periodically raised: “Barring a decree setting the amount of the contribution due for a given year prior to 31 December of the previous year, the amount proposed by the French Energy Regulation Commission (CRE), in accordance with the preceding paragraph, enters into force on 1 January, with the increase capped at €0.003/KWh with respect to the amount applied before this date.”
10.5 13.5
€/MWh
1 July 1 January
2012
16.5
1 January
Carrying costs prior to 2013 and those of 2013 were taken into account by the CRE
19.5(1)
2013 2014 2015
1 January
(1) CRE decision of 15 October 2014

238
Main CSPE components for EDF
Finance 2014 results, 2015 targets and 2018 ambition Historical financials Focus on credit profile CSPE
(1) Purchases obligations include electricity generated from: hydropower (less than 12MW), biomass, wind power, PV power, cogeneration, recovery of household
waste and energy recovery, with the exception of Corsica and the French overseas departments
(2) Additional generation costs and purchase obligations in Corsica and overseas departments, the TPN (First Necessity Tariff) and the FSL (Housing Solidarity Fund)
Set up of the CSPE pursuant to the Law of 10 February 2000 to allow EDF to offset certain expenses related to certain public service obligations:
The rise in the CSPE is linked to purchase obligations, which reflects
the rapid expansion of wind and PV power and the decline in wholesale electricity prices
In millions of Euros 2012 2013 2014
Purchase obligations(1) 3,155 67% 3,330 65% 3,905 66%
Other(2) 1,532 33% 1,773 35% 1,983 34%
Total CSPE EDF 4,687 5,103 5,888
In French overseas departments and Corsica, the CSPE depends on energy and fuel purchases, the cost of
replacing old power plants and the volumes of purchase obligations

239
Change in purchase obligations in mainland France and CSPE for EDF
Finance 2014 results, 2015 targets and 2018 ambition Historical financials Focus on credit profile CSPE
€1,784m €2,044m €1,802m €1,519m
€2,244m
€3,155m €3,330m €3,905m
(1) CSPE also offsets generation costs and purchase obligations in Corsica and French overseas departments and the TPN (first necessity tariff)
(2) EDF SA excluding Island Electric Systems
(3) Change in purchase obligations: decrease by 1.7TWh of cogeneration, increase by 1.0TWh of wind and by 1.2TWh of PV
€48.9/MWh €46.9/MWh €43.2/MWh
€34.6/MWh
Principle: The CSPE(1) offsets the difference between the cost of purchase obligations and market prices
€5,132m
€4,028m
€5,199m
Additional cost of purchase obligations cost to be covered by CSPE(2)
Cost of purchase obligations valued at market prices
Purchase obligations amount
2011 2012 2013
Market price
2014
€5,424m(3)

240
CSPE in EDF’s 2014 financial statements
Finance 2014 results, 2015 targets and 2018 ambition Historical financials Focus on credit profile CSPE
Income statement
□ Offsetting the additional cost of certain public services booked under “Other Operating Income and Expenses” for €5,888m
□ Offsetting financing costs for the past cumulated deficit within CRE’s meaning booked under “Financial result” for €93m
Balance sheet
□ Included in Working Capital Requirement under “Other receivables” for €2,056m
□ CSPE receivable recognised by the State booked under “Financial receivables” for €5,144m
□ CSPE on metering cut-offs (collected after electricity is delivered) in liabilities for €1,122m
Cash Flow statement
□ Cash in: €5,195m
□ Increase in Working Capital Requirement – Debtors and Creditors: €560m

241
CSPE impact on EDF’s accounts
Finance 2014 results, 2015 targets and 2018 ambition Historical financials Focus on credit profile CSPE
(1) CSPE excluding hedging
In millions of Euros 2012 2013 2014
Income statement
Extra-costs/losses
Impact on “Other Operating Income and Expenses”
EBITDA
Pre-tax result impact
(4,687)
4,687
Neutral
629
(5,103)
5,103
Neutral
83
(5,888)
5,888
Neutral
93
Balance sheet
Working Capital Requirements (Other receivables)
Debt (CSPE on supply energy but not billed;
Other current liabilities)
Financial debt
997
(747)
4,879
1,357
(984)
5,051
2,056
(1,122)
5,144(1)
Cash Flow
Cash in energy billed
Increase in WCR – CSPE receivable
Increase in WCR – Debtors and Creditors
3,261
1,426
1,258
4,652
360
123
5,195
699
560

242
CSPE: impact of lower markets prices and a narrower collection base
Finance 2014 results, 2015 targets and 2018 ambition Historical financials Focus on credit profile CSPE
(1) €360m in EDF’s accounts after €91m transferred to financial receivables
(2) Excluding financing costs of €6m for 2013 and 2014
(3) EDF’s January 2015 estimate based on 2014 accounting, which will be confirmed in the CRE deliberation of end-2015
(4) Source: CRE 15 October 2014 deliberation - 2015 estimate of charges and income
In millions of Euros 2013 2014 2015e
Charges to be offset by CSPE in EDF’s accounts -5,103 -5,888
Accounting cash income 4,652 5,195
Accounting increase in CSPE operating receivables +451(1) +693(2)
CRE-recognised charges to be offset at EDF -5,056 -5,888(3) -5,960(4)
CRE-recognised CSPE collection 4,896 5,361(3) 6,633
Increase in CRE-recognised deficit assumed by EDF +159 +527(3) -673
Average market price (in €/MWh) 43.2 34.6 42.6
Purchase obligation volumes (in TWh) A part of which is exposed to the year’s market prices
37 38 42
EDF’s CSPE tax base, based on actual weather conditions in 2013 and 2014 (in TWh)
363 325 340

243
Monitoring the agreement with the French government
Finance 2014 results, 2015 targets and 2018 ambition Historical financials Focus on credit profile CSPE
French government has committed to a maximum timeframe for paying back the receivable recognised at end-2012, i.e. €4,968m, composed of the compensation deficit (€4,341m) and past financing costs (€627m), the receivable bearing interest of 1.72%
The deficit will be paid back before end-2018
The €627m of past financing costs were taken into account by the CRE by an exceptional charge increase in 2013
2013 financing costs were calculated by the CRE in 2014, integrated within 2015 forecast costs expected to be fully compensated by the CSPE amounting to €19.5/MWh
According to the decision of the CRE of October 2014, 2015 collection should be greater than the costs of the year

244
Changes planned in managing energy under the purchasing obligation
Finance 2014 results, 2015 targets and 2018 ambition Historical financials Focus on credit profile CSPE
(1) Decision of the French Energy Regulatory Commission (CRE) on 16 December 2014
As part of the future market sale of energy bought by EDF under the Purchasing Obligation (PO)(1):
Setting up of a PO-dedicated balance perimeter (PE-OA)
□ This will include all PO-eligible installations in Continental France
□ It will manage the PE-OA and make output projections for all PE-OA installations supplied by EDF
To widen the compensation for purchase obligations
□ Compensation of the gap’s cost between power generation forecasts and actual output (about €30m/year) as soon as the dedicated equilibrium perimeter has been set up
□ Objective compensation of the extra cost of PO energy assumed by EDF (additional compensation of about €20m/year expected)

245
Estimated increase in the CSPE receivable in 2014
Finance 2014 results, 2015 targets and 2018 ambition Historical financials Focus on credit profile CSPE
(1) Balance forecasted by the CRE in October 2013
(2) Accounting difference between energy volumes delivered and energy volumes invoiced by EDF
(3) Purchase Obligations
149
699
160
165
75
150
In millions of Euros
Forecasted balance
for 2014(1)
Shortfall estimated
by EDF in late 2013
for 2014(2)
Increase in PO(3)
costs due to lower
market prices
Weather effect
Impact of structural
decline in
consumption
Impact of the increase
in exemptions to
industrial companies
Shortfall observed
by EDF for 2014

FACTS
& FIGURES
FACTS
& FIGURES MARKET DATA

247
Historical prices
Cross-border and foreign markets
European regulatory context
Market data
248
251
257
The EDF group EDF main businesses Finance Market data Appendices Corporate responsibility R&D

248
Network unbundling & market opening in Europe
Market data European regulatory context Cross-border and foreign markets Historical prices
1996 Directive 2003 Directive 3rd package
Member States’
markets opening up
Big then middle-sized industries
All customers
Third party accesses
3 types of models Regulated third
party access
TSO unbundling
Management unbundling
Legal unbundling 3 types of models
DSO unbundling
Accountancy unbundling
Legal unbundling
Regulation
Authority in charge of conflicts
settlement
Regulator independent
from the industry
Starting European regulation (ACER)
Completed
Completed
Debate on hold
Reform envisaged
Debate on implementation
• Debate about supply-networks
boundaries
• DSO unbundling question not much
alive
• Which regulation for data?
• Relative roles of ACER and
ENTSOs
Main goal: transforming electricity utilities into
usual market players

249
Market data European regulatory context Cross-border and foreign markets Historical prices
Key objective: the European internal electricity market
2013 Infrastructures
package
2007 TEN
Financial regulation
2006 Decision (shared
interests, coordinators)
2003 Inter-
connection rules
1995 «Trans-European Networks » (TEN)
Infrastructures reinforcement
2014 Advanced coupling
2010 CWE
coupling
2009 3rd package
(Network codes, ACER, etc.)
2006 Trilateral coupling
2004 Creation of mini-fora
1998 Creation of Florence Forum
Market coupling & integration
TARGET
MODEL
The European Commission presents this process as a major success A 20-year long process which dealt with both market integration and network development
Significant improvements despite limited budgets and local opposition
2015
Codes in progress
2015
Application of the interconnection objective of 10%
then 15%

250
Current trends on generation adequacy and market organisation
Market data European regulatory context Cross-border and foreign markets Historical prices
MECHANISMS ARE NEEDED
• Member States have to guarantee security of supply
• RES growth makes them even more necessary
THEY SHOULD BE “SMART”
• Market-oriented
• Non discriminatory (generation and demand)
• No windfall profit
THEY MAY MOBILIZE CROSS BORDER CAPACITY
• By reducing national margins
• Or involving interconnections
• At a later stage coupling them – if inter-state agreement
Investment is ensured through well functioning energy and capacity markets

251
Markets: electricity consumption (data not adjusted for weather and calendar)
Market data European regulatory context Cross-border and foreign markets Historical prices
In TWh
143
137
144
146 145 146
147
2008 2009 2010 2011 2012 2013 2014
Poland
495
487
513
479
490 495
465
2008 2009 2010 2011 2012 2013 2014
France
342
322
329
318 318 317
304
2008 2009 2010 2011 2012 2013 2014
United Kingdom
340
320
331 335
328
318
309
2008 2009 2010 2011 2012 2013 2014
Italy
Source: RTE Source: DECC – forecasted data for 2014
Source: Terna Source: ENTSO-E

252
European energy market remains split into “electricity plates” - Average spot prices in 2014
Market data European regulatory context Cross-border and foreign markets Historical prices
Interconnected but distinct
markets
□ Price: average spot price in 2014
for France (Epex), Germany
(Epex), the United Kingdom
(EDFT), Spain (OMEL), the
Netherlands (APX), Belgium
(Belpex) and Italy (Ipex) 1,300(2)
1,300(2) 1,600(2)
900(2)
1,700(2)
3,100(2)
2,300(2)
3,100(2)
1,900(2) 1,900(2)
1,200(2) 2,800(2)
1,400(3) 1,400(3)
€51.9/MWh
€52.1/MWh
€34.6/MWh
€32.8/MWh
€41.2/MWh -€10.8/MWh(1)
-€7.2/MWh(1)
-€5.0/MWh(1)
-€8.6/MWh(1)
-€10.9/MWh(1)
€47.4/MWh -€0.1/MWh(1)
-€2.2/MWh(1)
€42.1/MWh
Available commercial capacity
(1) Rounded the nearest tenth compared to 2013 average price
(2) Average annual net transfer capacities calculated by RTE in December 2013 for 2014 (in MW)
(3) Source: ENTSOE, in MW

253
Maximum interconnected capacity in 2014 and forecast increase
Market data European regulatory context Cross-border and foreign markets Historical prices
Source: RTE
1,270
1,070 3,100
1,160
2,000
1,600
New interconnections
France-Spain □ Baixas-Sta Llogaia (RTE - REE Project
INELFE) mid-2015: Export: +1,000MW
Import: +1,200MW
France-United Kingdom □ Eleclink (Eurotunnel-Star Capital) 2018:
Export: +1,000MW
Import: +1,000MW
Reinforcements
France-Italy
□ 2020: +500MW
In MW
2,000 3,200 3,000
1,800
3,200
1,300 2014 maximum
interconnected
capacity

254
France/Germany spread (1/3)
Market data European regulatory context Cross-border and foreign markets Historical prices
Note: over the observation period, spot price reached a minimum of -€37.66/MWh on 16 June 2013 and a maximum of €40.60/MWh on 5 December 2013
In 2014, France had a positive export balance with Germany from May to August due to good nuclear availability and an easing of supply/demand balance in France
-40
-20
0
20
40
60
Spot spread
Forward spread In €/MWh

255
France/Germany spread (2/3)
Market data European regulatory context Cross-border and foreign markets Historical prices
In 2014, the average annual spread can be explained by…
A saturation of interconnections between Germany and France
A diverging situation where the market price in France is driven by gas-fired plants while the German market price is determined by lignite and
coal plants
An economic environment where the generation cost of gas plants is higher than the one of coal plants
…but also by uncommon extreme situations:
Exceptionally strong negative spreads that have limited impact on the annual spread formation (August 2014)
Positive price peaks linked to tension situations on the French electric system. Because of the very mild weather in 2014, these price peaks were
much less frequent than in previous years
The French and German markets were coupled 51% of the hours in 2014, with an annual spread
between both countries much lower than last year (€1.9/MWh vs. €5.5/MWh)
An average spread of €1.9/MWh in 2014
Prices in both countries are coupled 51% of the time
The French price is above the German price 31% of the time
The German price is above the French price 17% of the time

256
France/Germany spread (3/3)
Market data European regulatory context Cross-border and foreign markets Historical prices
The seasonality of France/Germany spread reflects the high sensitivity of French demand to temperatures
• During winter, a preponderance of positive spreads. In addition, situations of pressure on the French supply/demand balance may
contribute to the formation of a very large spread
• During summer, a preponderance of negative spreads, French prices being generally lower than in Germany
Due to the thermal sensitivity of French consumption, the spread between France and Germany
follows a particularly strong seasonal cycle
± 1°C during winter:
= ± 2,400MW in France(1)
= ± 450MW in Germany
(1) Source: RTE
France/Germany spread in €/MWh 14.0
12.0
10.0
8.0
6.0
4.0
2.0
0.0
-2.0
-4.0

257
France: historical spot prices in base load power
Market data European regulatory context Cross-border and foreign markets Historical prices
Spot price fixation is linked to several factors
Level of demand
Availability of the generation fleet and demand management
Fossil fuels prices
Country’s energy mix
Source: EPEX
In 2014: decline of €9.2/MWh in average spot prices vs. 2013 following low demand due to mild weather and good nuclear availability
In Q1 2015: increase in the average base load spot price to €44.9/MWh (+€7.1/MWh compared to Q1 2014) due to colder temperatures that increased demand and the use of thermal plants, in particular gas-fired plants
2013 Min base = -€40.99/MWh Q1 2015 Min base = €17.80/MWh
Q1 2015 Max base = €62.12/MWh
2013 Max base = €82.86/MWh
In €/MWh
April 2013 – March 2014
April 2014 – March 2015
0
10
20
30
40
50
60
70
80
90
100

258
Forward electricity prices in France, the UK, Italy and Germany (Y+1) from 01/04/13 to 31/03/15
Market data European regulatory context Cross-border and foreign markets Historical prices
25
30
35
40
45
50
55
60
65
70
Electricity - Annual base contract France (Powernext) Electricity - Annual base contract UK (ICE)
Electricity - Annual base contract Germany (EEX) Electricity - Annual base contract Italy (IPEX)
In €/MWh

259
Forward electricity prices in France, the UK, Italy and Germany (Y+2) from 01/04/13 to 31/03/15
Market data European regulatory context Cross-border and foreign markets Historical prices
In €/MWh
25
30
35
40
45
50
55
60
65
70
Electricity - Annual base contract France (Powernext) Electricity - Annual base contract UK (ICE)
Electricity - Annual base contract Germany (EEX) Electricity - Annual base contract Italy (IPEX)

260
Coal prices (Y+1) in 2014
Market data European regulatory context Cross-border and foreign markets Historical prices
In $/t
At $69.9/t at end-December, forward coal prices decreased by $10.6/t on average over the whole year, as a result of a global easing of the supply/demand balance
60
65
70
75
80
85
90
Jan-14 Feb-14 Mar-14 Apr-14 May-14 Jun-14 Jul-14 Aug-14 Sep-14 Oct-14 Nov-14 Dec-14

261
Brent prices (Y+1) in 2014
Market data European regulatory context Cross-border and foreign markets Historical prices
In $/bbl
Brent stood at $57.3/bbl at end-2014, down by $53.5/bbl vs. end-2013. Prices remained stable until end-June, at around $110/bbl, and have fallen steadily since July
40
50
60
70
80
90
100
110
Jan-14 Feb-14 Mar-14 Apr-14 May-14 Jun-14 Jul-14 Aug-14 Sep-14 Oct-14 Nov-14 Dec-14

262
NBP gas prices (Y+1) in 2014
Market data European regulatory context Cross-border and foreign markets Historical prices
In p/therm
Annual gas contract prices closed at 50.0p/therm in 2014, down by 16.9p/therm vs. end-2013 Lower gas prices and the short-term easing of the supply/demand balance lowered the forward prices by a storage effect
45
50
55
60
65
70
Jan-14 Feb-14 Mar-14 Apr-14 May-14 Jun-14 Jul-14 Aug-14 Sep-14 Oct-14 Nov-14 Dec-14

263
CO2 prices (Y+1) in 2014
Market data European regulatory context Cross-border and foreign markets Historical prices
In €/t
3,5
4,5
5,5
6,5
7,5
Jan-14 Feb-14 Mar-14 Apr-14 May-14 Jun-14 Jul-14 Aug-14 Sep-14 Oct-14 Nov-14 Dec-14
CO2 prices rose in 2014, ending the year at €6.9/t, up €1.9/t vs. 2013. 2014 featured reactions by market players to announcements relating to back-loading and the Market Stability Reserve (MSR)

FACTS
& FIGURES
FACTS
& FIGURES APPENDICES

265
A team dedicated to Analysts and Investors
Financial calendar
Appendices
267
268
Glossary 269
IFRIC 21 interpretation 266
The EDF group EDF main businesses Finance Market data Appendices Corporate responsibility R&D

266
IFRIC 21 interpretation: application to the EDF group
Appendices Financial calendar Glossary A dedicated team IFRIC 21 interpretation
Application principles:
□ Affects the current accounting method for calculating the annual duties and taxes, other than income
taxes
□ Application by the EDF group since 1 January 2015, with retrospective application on 2014 published
statements
Impacts for the Group:
□ Some taxes will no longer be spread out throughout the year in the accounts, but will be booked
in most cases on 1 January of the year
□ Main taxes affected by this accounting change: taxes pertaining to EDF group’s activities in France
(especially the tax on nuclear facilities, the lump-sum tax on network companies (IFER),
property tax, etc.)
(1) The final data shall be provided in July 2015, when the half-year results will be published
No significant impact on the annual consolidated statements
Impact on the restated statements as of June 2014: approximately(1) €(0,8)bn on
EBITDA and €(0,6)bn on Group net income

267
Financial calendar
Appendices Financial calendar Glossary A dedicated team IFRIC 21 interpretation
30 July 2015
Dividend payment
2015 half-year results
Q3 2015 sales 5 November 2015
5 June 2015

268
To understand better the EDF group, you can also visit our web page dedicated to investors and analysts: http://shareholders-and-investors.edf.com/shareholders-and-investors-42678.html
…on which you can download:
The Analyst Pack, with all the main financial and extra-financial data in an Excel format
http://shareholders-and-investors.edf.com/investors-and-analysts/essential-283415.html
The Reference Document of year 2014
http://shareholders-and-investors.edf.com/news-and-publications/publications/regulatory-information/reference-documents-45430.html
All the data relative to our quarterly results
http://shareholders-and-investors.edf.com/news-and-publications/publications/financial-results/annual-results-283451.html
A team dedicated to Analysts and Investors
Appendices Financial calendar Glossary A dedicated team IFRIC 21 interpretation
For more information, our team is available to you at this address: [email protected]

269
Glossary (1/6)
Appendices Financial calendar Glossary A dedicated team IFRIC 21 interpretation
ANDRA: the French law of 30 December 1991 established a public industrial and commercial body, the National Agency for the Management of Nuclear Waste (Agence Nationale pour la gestion des Déchets Radioactifs – “ANDRA”), responsible for the long-term management of radioactive waste. The Agency, which reports to the Ministers of Industry, Research and Environment, established the storage centers based in the Aube region of France for the long-term management of short-life waste
APE: the French State Shareholding Agency is a national department joined controlled by the Minister for Economy, Industry and Digital, and the Minister for Finance and Public Accounts. Its mission is to act as a shareholder for the French Government in order to develop its assets to maximise the value of its stakes
Architect-Assembler: for EDF, the architect-assembler has control over the design and operation of its power plants; the organization of development projects; the schedule for completion and costs of construction; relations with the Nuclear Safety Authority; and the integration of feedback from operational experience. EDF’s role as architect-assembler ensures control over its industrial policy with respect to the design, construction and operation of its fleet of power plants
ARENH: Regulated Access to Historical Nuclear Energy
ASN (Autorité de Sûreté Nucléaire): the French Nuclear Safety Authority controls nuclear safety and radioprotection in France, on behalf of the French government, to protect workers, patients, the public and the environmental risks associated with the use of nuclear energy. It is notably in charge of the external control of nuclear facilities in France. The ASN is an independent administrative authority with a staff of more than 300. It is represented at the national level by the General Agency for Nuclear Safety and Radioprotection (or “DGSNR”)
Clean Dark Spread: difference between power price and variable generation cost (mainly coal cost and CO2 cost)

270
Glossary (2/6)
Appendices Financial calendar Glossary A dedicated team IFRIC 21 interpretation
Combined-Cycle Gas Turbine (CCGT): most recent technology for generating electricity in a natural gas-fired plant. A combined cycle is made up of one or more combustion turbines and a steam turbine allowing for an improved yield. The syngas is routed to the combustion turbine, which generates electricity and very hot exhaust gases (effluents). The heat from the exhaust gases is recovered by a boiler, thus producing steam. Part of the steam is then recovered by the steam turbine to generate electricity
Cogeneration: generation technique for combined electricity and heat generation. The advantage of cogeneration is the ability to capture the heat produced by the fuel, whereas in traditional electricity generation this heat is lost. This process also allows the same facility to meet the heating (hot water or steam) and electricity needs of both industrial and local authority customers. This system improves the energy efficiency of the generation process and reduces fuel use by an average of 20%
CRE (Commission de Régulation de l’Energie): created on 30 March 2000. The CRE, an independent body, regulates the process of the energy market opening. It ensures that all of the generators and eligible customers have non-discriminatory access to the network. Within its jurisdiction, this body supervises and authorizes, settles any disputes and, if required, imposes sanctions
Distribution networks: downstream of the transmission network, medium- and low-tension distribution networks that serve end-users (individuals, Groups, SMEs, SMIs, etc.)
Electricity supply: can be broken down into four types of consumption: “basic” (or “ribbon”) supply of electricity generated and consumed throughout the year; “semi-basic” electricity supply, which is generated and consumed over the winter period; “peak” electricity supply, which corresponds to periods of the year when electricity generation or consumption is significant; and “lace” supply which is a complement to the “ribbon” supply
EPIC: Industrial and Commercial state-owned Company

271
Glossary (3/6)
Appendices Financial calendar Glossary A dedicated team IFRIC 21 interpretation
EPR (European Pressurized Reactor): latest generation of reactors currently under construction (known as generation 3), it is the result of Franco-German cooperation, and offers advanced safety, environmental and technical performance
ETS: Emission Trading System
Fuel cycle: the nuclear fuel cycle encompasses all industrial operations in France and abroad which enable the supply of the fuel to generate energy in a reactor, then to unload and process it. The cycle can be broken down into three stages: 1) upstream: the processing of concentrates from uranium ore, the conversion, enrichment and production of fuel (which takes more than two years); 2) the core of the cycle corresponding to the use of fuel in the reactor: receipt, loading, operation and discharging (which takes three to five years); 3) downstream: pool storage, reprocessing of spent fuel in reactors of recoverable material, vitrification of highly radioactive waste, then temporary storage of the waste before storage
Hydropower generation: maximum power energy that can be produced from hydraulic sources in normal conditions
Interconnection: electricity transmission infrastructure that allows for exchanges of energy between different countries, by connecting the transmission network of one country to that of a neighboring country
LDC: Local Distribution Companies that provide for distribution of gas and electricity to the end-customers on a delimited geographical area
LNG (Liquefied Natural Gas): natural gas turned into liquid form by reducing its temperature to –162°C allowing for a reduction by 600 in its volume
MEDEF: French companies association (“Mouvement des entreprises de France”)

272
Glossary (4/6)
Appendices Financial calendar Glossary A dedicated team IFRIC 21 interpretation
Metering: a system allowing for the recording, at a given network connection point, of the volumes of electricity transmitted or distributed (power, frequency, active and reactive energy)
Midstream: all assets of the gas business, allowing for its availability, transportation and management. These might be infrastructures (gas pipelines, storage facilities, LNG terminals, etc.) or contractual (rights relating to predetermined capacity, procurement contracts, etc.). The midstream segment includes the trading and negotiating activities
National Allowances Allocation Plan: this plan defines the total quantity of greenhouse gas emission allowances that the French state plans to grant for the allowances exchange system for each multi-year period (NAP1 2005-2007, NAP2 2008-2012) and the allocation method used to allocate allowances to the industrial facilities in question
NOx: nitrogen oxide
Nuclear safety: nuclear safety includes all of the technical, organizational and human measures which are intended to prevent accident risks and to limit the effects of an accident, and which are taken at every stage of the life of a nuclear power plant (from design to operation and finally to decommissioning)
Nuclear tranche: electrical generation unit consisting of a nuclear boiler and a turbo-alternator generator. A nuclear tranche essentially consists of its reactor type and the power of its turbo-alternator generator. EDF nuclear plants include two or four tranches, and occasionally six
Ofgem: Ofgem is the Office of the Gas and Electricity Markets in the UK. Its main missions consist of protecting consumers, regulating gas and electricity monopoly companies, helping to secure Britain’s energy supplies by promoting and regulating competitive gas and electricity markets. It also contributes to the drive to curb climate change and promote sustainable development

273
Glossary (5/6)
Appendices Financial calendar Glossary A dedicated team IFRIC 21 interpretation
Plant availability: fraction of power available, out of theoretical maximum energy, counting only technical non-availability. The availability coefficient (Kd) is defined as the ratio between annual actual generation capacity (or amount producible annually) and maximum theoretical generation capacity, where maximum theoretical generation capacity = installed capacity x 8,760h. The Kd, which includes only technical non-availability, i.e. scheduled shutdowns, unplanned outages and testing periods, characterizes a plant’s industrial performance. For EDF’s nuclear fleet in France, the maximum theoretical generation capacity is of 553TWh (63.1GW X 8,760h)
PPA: Price Purchase Agreement
PWR: in a Pressurized Water Reactor, the primary coolant (water) is pumped under high pressure to the reactor core where it is heated by the energy generated by the fission of atoms. The heated water then flows to a steam generator where it transfers its thermal energy to a secondary system where steam is generated and flows to turbines which, in turn, spin an electric generator. In contrast to a boiling water reactor (BWR), pressure in the primary coolant loop prevents the water from boiling within the reactor
Renewable energies: energies for which generation does not require extinction of the initial resource. They largely derive from geothermal, water, air, fire and solar sources. They include hydro, wind, solar (the energy produced by marine waves and currents), geothermal (energy derived from the heat of the earth’s magma) energies, and bio-mass (energy derived from living matter, particularly wood and organic waste). They often include energy from the incineration of household or industrial waste
RTE: RTE is the operator of the French electricity transmission system. RTE, a public service company, operates, maintains and develops the high and very high voltage network
SOx: sulfur oxide
Storage: storage consists in placing packages of radioactive waste in a facility, ensuring their long-term management, i.e. under safe conditions allowing for long-term risks control

274
Glossary (6/6)
Appendices Financial calendar Glossary A dedicated team IFRIC 21 interpretation
Storage center: low or medium-level short-life radioactive waste from nuclear plants, the Hague or CENTRACO facilities are sent to ANDRA’s Soulaines storage center in the Aube region, which has been operational since 1992. This center has a capacity of 1,000,000cm, and an acceptance capacity of approximately 60 years. Very low-level short-life radioactive waste is sent to ANDRA’s Morvilliers storage center (also in the Aube region). This center was commissioned in October 2003 and has an operating life of about 30 years
Transmission networks: networks providing for the transmission of electrical power at high and very high voltages from the generating sites to the distribution networks or industrial sites directly connected to it; this includes the major interconnection transmission network (400,000 volts and 225,000 volts) and the regional distribution networks (225,000 volts, 150,000 volts, 90,000 volts and 63,000 volts)
Waste: nowadays, the nuclear generation of 1MWh of electricity (equivalent to the monthly consumption of two households) produces around 11g of total waste across all categories. Short-life waste represents more than 90% of the total waste, but contains only 0.1% of the total radioactivity of those 11g

FACTS
& FIGURES
FACTS
& FIGURES