facts&figures - randgold resources facts... · oz/share$/oz lost time injury frequency rate...
TRANSCRIPT

LSE : RRS • NASDAQ : GOLDwww.randgoldresources.com
Facts & FiguresNovember 2017
Key strengths■ Proven ability to discover multi-
million ounce gold deposits and convert them into profitable mines
■ Substantial pipeline of future prospects – group production continues to grow
■ Cost profile to benefit from improving grade and additional production
■ Solid balance sheet to support funding of new developments
■ Expanding footprint in major West and Central African gold fields
■ Pure gold focus gives undiluted exposure to gold price upsideRandgold Resources Limited (‘Randgold’) shares in issue at 30 September 2017: 94.1 million.
SuStainablyprofitable
2016 highlightS
TOTAL SHAREHOLDER RETURN
oVer 3 yearS
29%
CASH ON HAND
to $516.3 million142%
DiviDEND pER SHARE
52%to $1.00
In respect of the year under review but declared and paid in the following year.
LTiFR22%
gROUp CONSOLiDATED pRODUCTiON
3%to 1.25 mozpROFiT
38%to $294.2 million
EARNiNgS pER SHARE
30%to $2.64
TOTAL CASH COST OF pRODUCTiON
6%to $639/oz
to 0.46

Randgold Resources is an Africa focused gold mining and exploration company with listings on the London Stock Exchange (RRS) and NASDAQ (GOLD). Major discoveries to date include the 7.5Moz Morila deposit, the 7.2Moz Yalea deposit and the 5.8Moz Gounkoto deposit, in Mali, the 4.9Moz Tongon deposit in Côte d’Ivoire and the 3.3Moz Massawa deposit in eastern Senegal. Randgold Resources Limited (Randgold) financed and built the Morila mine which, since October 2000, has produced more than 6Moz of gold and distributed more than $2 billion to stakeholders. Morila is now a tailings retreatment operation, scheduled for closure in 2019. Randgold also financed and built the Loulo operation which started as two open pit mines in November 2005. Since then, two underground mines have been developed at the Yalea and Gara deposits.
The company’s Tongon mine in Côte d’Ivoire poured its first gold in November 2010.
Production from the Gounkoto open pit operation, south of Loulo, began in 2011. Following completion of a feasibility study, it has been decided to proceed with the Gounkoto super pit which is more economically attractive than a smaller pit and underground operation.
In 2009, Randgold acquired a 45% interest in the Kibali project in the Democratic Republic of Congo (DRC). The mine was developed and is being operated by Randgold. First gold was poured in the third quarter of 2013 from open pit operations and commissioning of the full underground operation is scheduled for Q4 2017.
Randgold also has a major project at Massawa in Senegal where the discovery of the Sofia deposit in 2016 has led to the completion of an updated economic assessment of the viability of the combined project and a feasibility study is currently underway. The company has an extensive portfolio of organic growth prospects, supported by intensive exploration programmes in Côte d’Ivoire, DRC, Mali and Senegal.
1.0$$
0
1
2
3
4
5
2012
1.00
2.00
3.00
4.00
5.00
02013 2014 2015 2016
$ million
0
100
200
300
400
500
600
20162015201420132012
$ million
0
100
200
300
400
500
600
700
20162015201420132012
$ million$/oz Lost Time Injury Frequency Rate (LTIFR)oz/share
0.05
0.1
0.15
0.2
0
Moz
0.0
0.1
0.2
0.3
0.4
0.5
0.6
0.7
0.8
0.9
20162015201420132012
Reserves (Moz)Resources (Moz)Reserve ounce per share
0
100
200
300
400
500
600
201620152014201320120
200
400
600
800
201620152014201320120
5
10
15
20
25
30
201620152014201320120.0
0.5
1.0
1.5
2.0
20162015201420132012
Total cash cost/ozGradeMorila (40%)
Loulo-Gounkoto (100%) Tongon (100%)Kibali (45%)Kibali (45%)
Capital
ForecastActual ForecastActual
Production 000oz | Total cash cost/oz | Capex $ million g/t
0
200
400
600
800
1 000
1 200
1 400
1 600
20212020201920182017201620152014201320120
1
2
3
4
5
ForecastActual
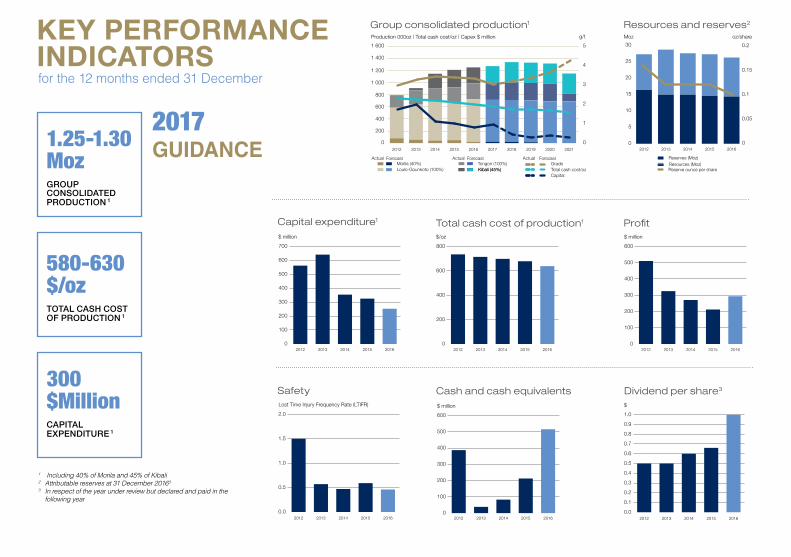
Profit
Dividend per share3
Capital expenditure1
Group consolidated production1
Total cash cost of production1
Cash and cash equivalents
2017 GuiDANcE
for the 12 months ended 31 December
1 Including 40% of Morila and 45% of Kibali2 Attributable reserves at 31 December 20163
3 In respect of the year under review but declared and paid in the following year
Resources and reserves2
1.25-1.30 MozgROUp CONSOLiDATED pRODUCTiON 1
580-630 $/oz TOTAL CASH COST OF pRODUCTiON 1
300 $MillionCApiTAL ExpENDiTURE 1
key performance indicatorS
1.0$$
0
1
2
3
4
5
2012
1.00
2.00
3.00
4.00
5.00
02013 2014 2015 2016
$ million
0
100
200
300
400
500
600
20162015201420132012
$ million
0
100
200
300
400
500
600
700
20162015201420132012
$ million$/oz Lost Time Injury Frequency Rate (LTIFR)oz/share
0.05
0.1
0.15
0.2
0
Moz
0.0
0.1
0.2
0.3
0.4
0.5
0.6
0.7
0.8
0.9
20162015201420132012
Reserves (Moz)Resources (Moz)Reserve ounce per share
0
100
200
300
400
500
600
201620152014201320120
200
400
600
800
201620152014201320120
5
10
15
20
25
30
201620152014201320120.0
0.5
1.0
1.5
2.0
20162015201420132012
Total cash cost/ozGradeMorila (40%)
Loulo-Gounkoto (100%) Tongon (100%)Kibali (45%)Kibali (45%)
Capital
ForecastActual ForecastActual
Production 000oz | Total cash cost/oz | Capex $ million g/t
0
200
400
600
800
1 000
1 200
1 400
1 600
20212020201920182017201620152014201320120
1
2
3
4
5
ForecastActual
Safety
1.0$$
0
1
2
3
4
5
2012
1.00
2.00
3.00
4.00
5.00
02013 2014 2015 2016
$ million
0
100
200
300
400
500
600
20162015201420132012
$ million
0
100
200
300
400
500
600
700
20162015201420132012
$ million$/oz Lost Time Injury Frequency Rate (LTIFR)oz/share
0.05
0.1
0.15
0.2
0
Moz
0.0
0.1
0.2
0.3
0.4
0.5
0.6
0.7
0.8
0.9
20162015201420132012
Reserves (Moz)Resources (Moz)Reserve ounce per share
0
100
200
300
400
500
600
201620152014201320120
200
400
600
800
201620152014201320120
5
10
15
20
25
30
201620152014201320120.0
0.5
1.0
1.5
2.0
20162015201420132012
Total cash cost/ozGradeMorila (40%)
Loulo-Gounkoto (100%) Tongon (100%)Kibali (45%)Kibali (45%)
Capital
ForecastActual ForecastActual
Production 000oz | Total cash cost/oz | Capex $ million g/t
0
200
400
600
800
1 000
1 200
1 400
1 600
20212020201920182017201620152014201320120
1
2
3
4
5
ForecastActual

loulo-gounkoto mining complex
the loulo-gounkoto complex is located in the west of mali near the border with Senegal. both the loulo and gounkoto mines are owned by randgold (80%) and the State of mali (20%).
Key 2016 numbersfor the 12 months ended 31 December
randgold’s flagship operation currently comprises the loulo underground mines, yalea and gara, and the gounkoto open pit mine.
Based on current reserves, the complex has a scheduled Life of Mine to 2028.
The Loulo-Gounkoto complex is now firmly established as a long life, high production operation, estimated to produce +600 000oz for 10 years.
for the 12 months ended 31 December
Equity ownership 80% 2016 production (100%) 707 116ozTotal cash costs ($/oz) 563Profit from mining activity1 (100%) $481.6m
Safety certification OHSAS 18001
Environmental certification ISO 14001
Production and forecast (000oz)
0
100
200
300
400
500
600
700
800
20172016
N
Randgold permits
MALi
Algeria
MauritaniaSenegal
Guinea
Liberia
BurkinaFaso
Bamako
Loulo gold mine
Gounkoto gold mine
Côte d’Ivoire
300km

loulo gold mine Key 2016 numbersfor the 12 months ended 31 December
Loulo gold mine production from open pit operations started at Loulo in 2005. This was followed by the development of the underground mines at Gara and Yalea. An owner mining team now successfully operates these mines.
Loulo mineTotal reserves2 (100%) 5.3MozTotal resources measured and indicated1 (100%) 7.9MozTotal resources inferred2 (100%) 1.9MozLost Time Injury Frequency Rate 0.67gounkoto mineTotal reserves2 (100%) 3.1MozTotal resources measured and indicated2 (100%) 3.9MozTotal resources inferred2 (100%) 0.4MozLost Time Injury Frequency Rate 0.45
1 Profit from mining activity is calculated by subtracting total cash costs from gold sales, and is measured prior to depreciation, interest and corporate tax charges.
2 At 31 December 2016.
Gounkoto gold mine, a greenfields discovery in 2009, poured its first gold in June 2011. The ore from Gounkoto is processed by the Loulo plant under a tolling agreement.
The open pit operation at Gounkoto will be extended by a super pit, the development of which was given the go ahead in January 2017.
gounkoto gold mine

tongon gold mine
The Tongon mine comprises two open pit operations, the Southern (SZ) and Northern Zones (NZ), both of which have potential for more reserves.
Both Tongon SZ and NZ resource models and open pit designs have been updated using new data from advanced grade control and resource drilling, resulting in changes to mineral resources in the NZ open pit. Drilling continues to test orebodies below current pit designs and to define resources and reserves on several satellite targets.
Tongon currently has a five year Life of Mine.
The Tongon mine is located within the Nielle exploration permit in the north of Côte d’lvoire, 55km south of the border with Mali. Randgold owns 89.7% of the company, the State of Côte d’lvoire 10% and 0.3% is held by a local company.
Key 2016 numbers
Equity ownership 89.7% 2016 production (100%) 260 556Total cash costs ($/oz) 771Profit from mining activity1 (100%) $121.8mTotal reserves2 (100%) 1.5MozTotal resources measured and indicated2 (100%) 1.9MozTotal resources inferred2 (100%) 1.1Moz
Safety certificationOHSAS
18001Lost Time Injury Frequency Rate 0.44Environmental certification ISO 14001
1 Profit from mining activity is calculated by subtracting total cash costs from gold sales, and is measured prior to depreciation, interest and corporate tax charges.
2 At 31 December 2016.
for the 12 months ended 31 December
mining at tongon began in april 2010 and gold production from the open pit operation started in december 2010.
Production and forecast (000oz)
0
50
100
150
200
250
300
20172016
N
300km Randgold permits
CÔTE D’ivOiRE
Liberia
Guinea
MaliBurkina Faso
Ghana
Abidjan
Tongon gold mine

Equity ownership 45%2016 production (100%) 585 946ozTotal cash costs ($/oz) 736Profit from mining activity1 (100%) $291.1mTotal reserves2 (100%) 9.2MozTotal resources measured and indicated2 (100%) 14MozTotal resources inferred2 (100%) 3.4MozLost Time Injury Frequency Rate 0.44
1 Profit from mining activity is calculated by subtracting total cash costs from gold sales, and is measured prior to depreciation, interest and corporate tax charges.
2 At 31 December 2016.
kibali gold minethe kibali mine development in the drc is the biggest project undertaken to date by randgold and ranks as one of the largest gold mines in africa. Key 2016 numbers
for the 12 months ended 31 December
The mine is operated by Randgold and represents an investment of more than $2.5 billion by the partners. Kibali comprises an integrated open pit and underground operation as well as a 7.2Mtpa processing plant.
Based on current reserves, the mine has a scheduled Life of Mine to 2029.
Kibali comprises 10 permits covering an area of about 1 836km² in the Moto goldfields of the north east DRC, some 560km north east of the city of Kisangani and 150km west of the Ugandan border town of Arua. Kibali is a joint venture between Randgold (45%), Anglogold Ashanti (45%) and the Congolese parastatal SOKiMO (10%).
Production and forecast (000oz)
The mine poured its first gold in Q3 2013 from open pit mining and is currently developing the underground mine via twin declines and a vertical shaft, scheduled for commissioning in Q4 2017. The project will ultimately be supplied by four hydropower stations supported by a thermal power station for low rainfall periods and as back-up.
0
100
200
300
400
500
600
700
20172016
N
Uganda
Rwanda
Burundi
Tanzania
Zambia
Angola
Congo
Central African Republic
DEMOCRATiC REpUBLiC OF
CONgO
1 000km
Kinshasa
Randgold permits
Kibali gold mine

morila gold mine
Morila is situated 280km south east of Bamako, the capital of Mali and is a joint venture between Randgold (40%), Anglogold Ashanti (40%) and the State of Mali (20%). Randgold has operated Morila since February 2008.
In 2009, Morila was converted to a stockpile treatment operation. Closure of the operation was originally scheduled for 2013 but a pit pushback, now complete, and a tailings treatment project, should extend the Life of Mine to 2019.
Key 2016 numbers
Equity ownership (operated by Randgold Resources) 40%2016 production (100%) 54 022ozTotal cash costs ($/oz) 1 113Profit from mining activity1 (100%) $6.8mTotal reserves2 (100%) 0.3MozTotal resources measured and indicated2 (100%) 0.4MozTotal resources inferred2 (100%) 0.01MozSafety certification OHSAS 18001Lost Time Injury Frequency Rate 0.56Environmental certification ISO 14001
1 Profit from mining activity is calculated by subtracting total cash costs from gold sales, and is measured prior to depreciation, interest and corporate tax charges.
2 At 31 December 2016.
for the 12 months ended 31 December
Work continues on the development of a commercial agribusiness to utilise the mine’s infrastructure and provide sustainable economic activity in the area after Morila’s eventual closure.
morila was discovered, developed and financed by randgold. the mine was commissioned in october 2000 and since inception has produced more than 6moz of gold and paid more than $2 billion to stakeholders
Production and forecast (000oz)
0
10
20
30
40
50
60
70
20172016N
Randgold permits
MALi
Morila gold mine
Algeria
Mauritania
Senegal
Guinea
Liberia
BurkinaFaso
Bamako
Côte d’Ivoire
300km

maSSawa feaSibility projectmassawa is one of the largest undeveloped orebodies in africa. a grassroots exploration project in eastern Senegal, it was discovered in 2008. following the discovery of the Sofia deposit on the same permit in 2016, a feasibility study is being conducted on the combined project.
Key 2016 numbers
Equity ownership 83.25%Total reserves1 (100%) 2.6MozTotal resources measured and indicated1 (100%) 2.6MozTotal resources inferred1 (100%) 1.8Moz
1 At 31 December 2016.
Massawa lies 700km south east of the capital city of Dakar and 90km to the west of Randgold’s Loulo and gounkoto mines across the border in Mali. Randgold owns 83.25% of the project with a local company holding 6.75%. The State of Senegal will have a non-contributory 10% share of any mine developed on the property.
for the 12 months ended 31 December
GOLD PROJECT
Dakar SENEgAL
N
Guinea
Mali
Mauritania
Massawa project
600km
Randgold permits

17 Reserve definition
9 indicated and measured resources
19 inferred resources
8 Advanced targets
22 Follow-up targets
59 identified targets
134 total
West African craton
congo craton
East Sahara craton
Kalahari craton
Malagasy craton
exploration
Randgold continues to maintain its focus on organic growth through discovery and development of world class orebodies and has a pipeline of high quality projects and exploration targets.
* including joint ventures.
Orogenic terrains
Gold deposit
Craton margin
pRODUCiNgMines
FEASiBiLiTYReserve/Resourcedefinition
ExpLORATiONTARgETS
iDENTiFiED gEOLOgiCALANOMALiES
Côte
d’ivoire
DRC
Mali
Senegal
Operating
mines
Reserve
definition
Indicated and
measured resources
Inferred resources
Advanced targets
Follow-up targets
Identified targets
Exploration programmes are currently underway in four countries: Mali, Senegal, Côte d’ivoire, and the Democratic Republic of Congo, where Randgold has groundholdings of 14 072km²* hosting 134 targets.
Exploration and infill drilling continues to upgrade the geological confidence of the deposits near our mines, concentrating on resource definition and the discovery of mineable satellite ounces.
MiNES Morila – Mali
Loulo – Mali
Tongon – Côte d’ivoire
gounkoto – Mali
Kibali – DRC
pROjECTS Massawa – Senegal
FEASiBiLiTY pROjECTS gorumbwa – DRC
RESOuRcE TRiANGLE as at 31 Dec 2016
AFRICA’S GOLDEN ENDOWMENT

For a glossary of terms visit our website at www.randgoldresources.com. Please refer to the disclaimer on page F-2 of this annual report.
our african footprint
1 2016 gold production per mine measured in oz. Total reserves and resources at 31 December 2016. Resources include reserves.
260 556oz1
tongon gold mineReserves 1.5MozResources 3.0Moz
EQUITY INTEREST
89.7%
585 946oz1
Kibali gold mine Reserves 9.2MozResources 17.4Moz
EQUITY INTEREST
45%
massawa feasibility ProjectReserves 2.6MozResources 4.4Moz
EQUITY INTEREST
83.3%
707 116oz1
loulo-gounKoto mine comPlex
Gounkoto Reserves 3.1Moz Resources 4.3Moz
Loulo Reserves 5.3Moz Resources 9.8Moz
EQUITY INTEREST
80%
EQUITY INTEREST
40%
by finding, developing and operating profitable gold mines for the benefit of all our stakeholders.
we create value
DEMOcRATic REpubLic Of
cONGO
côTE D’ivOiRE
MALi
SENEGAL54 022oz1 morila gold mine
Reserves 0.3MozResources 0.4Moz
Key numbers
$000 2016 2015
Gold sales1 1 546 030 1 394 889Total cash costs1 794 432 822 673Profit from mining activity1 751 598 572 216Exploration and corporate expenditure 41 202 45 067Profit for the period 294 221 212 775Profit attributable to equity shareholders 247 474 188 677Net cash generated from operations 521 227 396 982Cash and cash equivalents2 516 301 213 372Gold on hand at period end3 27 772 13 715Group production (oz) 1 252 957 1 211 288Group sales (oz) 1 242 366 1 210 844Group total cash cost per ounce1 ($) 639 679Group cash operating cost per ounce1 ($) 576 624Basic earnings per share ($) 2.64 2.03 1 Randgold consolidates 100% of Loulo, Gounkoto and Tongon, 40% of
Morila and 45% of Kibali in the consolidated non-GAAP measures.2 Cash and cash equivalents excludes $11.5 million at 31 December 2016
($16.9 million at 31 December 2015 and $11.3 million at 30 September 2016) relating to the group’s attributable cash held in Morila, Kibali and the group’s asset leasing companies which are equity accounted.
3 Gold on hand represents gold in doré at the mines (attributable share) multiplied by the prevailing spot gold price at the end of the period.
for the 12 months ended 31 December

annual reSource and reSerVe declarationat 31 December 2016 (abridged)
COMPETENT PERSONS:Yalea, Gara and Baboto mineral resources were calculated by Timothee Sogoba, an officer of the company, under the supervision of Simon Bottoms, an officer of the company and competent person. Mineral resources for Loulo 3 and Gara West were generated by Mamadou Ly, an officer of the company, under the supervision of Simon Bottoms, an officer of the company and competent person. Gounkoto mineral resources were calculated by Sekou Diarra, an officer of the company, under the supervision of Simon Bottoms, an officer of the company and competent person. Faraba mineral resources were calculated by Mamadou Ly, an officer of the company, under the supervision of Simon Bottoms, an officer of the company and competent person. Tongon and Sekala mineral resources were calculated by Mamadou Ly, an officer of the company, under the supervision of Simon Bottoms, an officer of the company and competent person. Morila resources were calculated by Jonathan Kleynhans, a competent person while an officer of the company, now an external consultant. Kibali underground mineral resources were generated by Ernest Doh and Simon Bottoms, both officers of the company and competent persons. Mineral resources for Kombokolo were generated by Abdoulaye Ngom, an officer of the company, under the supervision of Ernest Doh and Simon Bottoms, both officers of the company and competent persons. All other Kibali mineral resources were generated by Ernest Doh, an officer of the company and competent person. Massawa resources were calculated by Simon Bottoms and Rodney Quick, both officers of the company and competent persons. Rodney Quick reviewed all mineral resources as lead competent person. Rodney Quick is a Professional Natural Scientist and member of the South African Institute of Mining and Metallurgy (SACNASP). Simon Bottoms is a chartered geologist of the Geological Society of London and Ernest Doh is a qualified geologist and member of the Australasian Institute of Mining and Metallurgy (AusIMM). All have sufficient experience in the style of mineralisation and types of deposits under consideration and the activity which they are undertaking as competent persons as defined in the 2012 edition in the ‘Australasian Code for Reporting Exploration Results, Mineral Resources and Ore Reserves’. The Loulo, Tongon, Massawa, Sofia and Gounkoto open pit and Morila TSF mineral reserves were calculated by Shaun Gillespie, an officer of the company and competent person. Kibali open pit mineral reserves were generated by Nicholas Coomson, an officer of the company and competent person. Loulo underground reserves were calculated by Andrew Fox, an external consultant and competent person. The Kibali and Gounkoto underground mineral reserves were calculated by Tim Peters, an external consultant and competent person. Tim Peters, Andrew Fox and Nicholas Coomson are members of AusIMM. Shaun Gillespie is a member of SACNASP. All have sufficient experience relevant to the style of mineralisation and type of deposit under consideration and to the activity which he is undertaking to qualify as a competent person as defined in the 2012 edition of the “Australasian Code for Reporting of exploration Results, Mineral Resources and Ore Reserves”.
Mine/project Category
Tonnes Grade GoldAttributable
gold1
Mt g/t Moz MozMineral resources
kibali 45%Measured and indicated 135 3.2 14 6.2
Inferred 46 2.3 3.4 1.5loulo 80%
Measured and indicated 53 4.6 7.9 6.3Inferred 15 3.8 1.9 1.5
gounkoto 80%Measured and indicated 29 4.2 3.9 3.1
Inferred 4.2 3.1 0.4 0.3morila 40%
Measured and indicated 22 0.6 0.4 0.2Inferred 0.9 0.4 0.01 0.01
tongon 89.7%Measured and indicated 23 2.5 1.9 1.7
Inferred 13 2.8 1.1 1.0massawa 83.25%
Indicated 20 4.0 2.6 2.1Inferred 21 2.7 1.8 1.5
total resources
Measured and indicated 282 3.4 30 20Inferred 100 2.7 8.6 5.9
Ore reserveskibali 45%
Proven and probable 71 4.0 9.2 4.1loulo 80%
Proven and probable 37 4.5 5.3 4.2gounkoto 80%
Proven and probable 21 4.6 3.1 2.5morila 40%
Proven and probable 15 0.5 0.3 0.1tongon 89.7%
Proven and probable 19 2.4 1.5 1.3massawa 83.25%
Probable 19 4.3 2.6 2.2total ore reserves Proven and probable 182 3.7 22 141 Attributable gold (Moz) refers to the quantity attributable to Randgold based on its interest (holding) in each specific operation/project.
Randgold reports its mineral resources and mineral reserves in accordance with the JORC 2012 code and as such are reported to the second significant digit. Reporting standards are equivalent to National Instrument 43-101. The reporting of mineral resources is based on a gold price of $1 500/oz. The reporting of ore reserves is also in accordance with Industry Guide 7. All mineral resource tabulations are reported inclusive of that material which is then modified to form ore reserves. Reserve pit optimisations are carried out at a gold price of $1 000/oz for all pits. Underground ore reserves are also based on a gold price of $1 000/oz. Dilution and ore loss are incorporated into the calculation of reserves. Cautionary note to US investors: The United States Securities and Exchange Commission (the ‘SEC’) permits mining companies, in their filings with the SEC, to disclose only proved and probable ore reserves. Randgold uses certain terms in this annual report such as ‘resources’, that the SEC does not recognise and strictly prohibits the company from including in its filings with the SEC. Investors are cautioned not to assume that all or any parts of the company’s resources will ever be converted into reserves which qualify as ‘proved and probable reserves’ for the purposes of the SEC’s Industry Guide number 7.See glossary of terms on website at www.randgoldresources.com.
www.randgoldresources.com
chief executive officer Mark Bristow T +44 788 071 1386group corporate communications managerLois Wark T +44 20 7557 7745 [email protected] and media relations Kathy du plessis T +44 20 7557 7738 [email protected]
randgold resources limited 3rd Floor, Unity Chambers, 28 Halkett Street St Helier, jersey, jE2 4Wj, Channel islands T +44 1534 735 333, F +44 1534 735 444
dP
A61
08