faculdade de economia da universidade do porto master dissertation … 09... · faculdade de...
TRANSCRIPT

Faculdade de Economia da Universidade do Porto
Master Dissertation in Economics
Willingness to pay for violent crime reduction: a contingent
valuation study for higher education students
Mafalda Marques Moreira Soeiro
Supervisor: Aurora A.C. Teixeira
September 2009

i
Acknowledgements
I would like to express my deepest gratitude to Professor Aurora Teixeira who generously
accepted to supervise this dissertation. I could not have succeeded without her guidance,
expertise and creative way of solving problems. It was seeing her commitment to her work
that set the example and encouraged me to work harder.
A special thanks to my dearest friends Elsa and Judite. I could not have finished this
dissertation without Elsa’s friendship and companionship in the long hours of work. I am
also indebted to Judite for providing me with the most valuable advices that helped me
overcome every difficulty I encountered.
I thank my aunts Lena and Fatinha for all the support and love only family can provide. To
Lena, a special thanks for taking the time to review this work!
I would also like to thank Emilia, the first one of us to finish a dissertation, for proving me
that it was possible. I am also thankful to all the students that took the time to answer the
questionnaire.
A special note to Professor Maria Antónia Carravilla who first taught me the meaning of
the word resilience.
Finally I would like to thank my parents for believing in me. It was their patience, love and
support that kept me going!

ii
Abstract
Criminal literature has often addressed the issue of estimating the costs of crime given its
importance in cost benefit analysis. The calculation of the tangible costs of crime (e.g.
medical costs and costs with the justice system) has been considered feasible but the
estimation of the costs of pain, suffering or fear of crime has been seen as an unreasonable
task by some and a challenging task by others given the intangible nature of these costs.
However these costs cannot be ignored as they are an important component of the total
costs of crime. Through the elicitation of public’s willingness to pay (WTP) for reduction
in crime risks, the contingent valuation method is one of the methodologies that have been
used to estimate the intangible costs of crime.
A sparse number of studies exist resorting to contingent valuation methods being applied
in high crime rate contexts (US and UK). In the present dissertation, we aimed at
estimating the willingness to pay in a low crime rate context. Furthermore, our study
involves a novel application of the contingent valuation method by being applied to a
specific segment of the population – higher education students. Due to the higher level of
education one might expect that these individuals have a better understanding of risk
changes and are thus more capable of making informed decisions about the trade-offs
between safety and its costs.
Based on the responses of 1122 higher education students from a wide set of courses
(ranging from Economics to Psychology and Humanities), we found that our results are
mainly in line with the existing literature except for the fact that we found that females
were willing to pay more than male individuals for reducing violent crime rate and that
having an avertive behaviour is positively associated with WTP. We additionally
concluded that students enrolled in distinct courses present significant differences in the
willingness to pay for crime reduction. In concrete, Economics and Management students
appear as the ones willing to pay more whereas Arts, Sports and Law students emerge as
those who were willing to pay less when compared to Health students. These precursor
findings are likely to represent critical impact on crime and insurance policies.
Key words: Contingent Valuation Method; Intangible costs; Crime costs

iii
Resumo
A literatura criminal tem abordado frequentemente a questão da estimação dos custos do
crime dada a sua importância na análise custo - benefício. O cálculo dos custos tangíveis
do crime (por ex: despesas médicas e custos com o sistema judicial) tem sido considerado
passível de elaboração mas a estimação dos custos associados à dor, sofrimento ou medo
do crime tem sido vista como uma tarefa insensata por uns e um desafio por outros dada a
natureza intangível destes custos. No entanto, estes custos não podem ser ignorados visto
serem uma parte importante dos custos totais do crime. O método da avaliação contingente
tem sido usado para estimar os custos intangíveis do crime questionando para isso os
indivíduos quanto à sua disposição a pagar pela redução dos riscos de serem vítimas de
crime.
Existe um número escasso de estudos que aplicam o método de avaliação contingente
sendo estes aplicados a países com altas taxas de criminalidade (Estados Unidos da
América e Reino Unido). Esta dissertação tem como objectivo estimar a disposição a pagar
num contexto de baixas taxas de criminalidade. Além disso, este estudo envolve uma nova
aplicação do método de avaliação contingente ao ser aplicado a um segmento específico da
população – estudantes do ensino superior. Dado o seu nível de habilitações, pressupõe-se
que estes estudantes compreendam melhor variações no risco, sendo capazes de tomar
decisões mais informadas sobre o trade-off entre custos e segurança.
Com base na análise de dados de 1122 estudantes de ensino superior que frequentam uma
variedade de cursos (desde Economia à Psicologia passando pelas Humanidades),
concluímos que os nossos resultados estão de acordo com os que são encontrados na
literatura, excepto o facto de termos concluído que as mulheres estão dispostas a pagar
mais para reduzir a criminalidade violenta do que os homens e o facto de se ter um
comportamento preventivo face ao crime estar positivamente associado à disposição a
pagar. Concluímos ainda que estudantes inscritos em cursos diferentes apresentam
diferenças significativas na disposição a pagar pela redução de crime. Os alunos de
Economia e Gestão são os que estão dispostos a pagar mais e os de Artes, Desporto e
Direito são os que estão dispostos a pagar menos comparados com os estudantes da área da
Saúde. Estes resultados inovadores poderão ter um impacto crítico nas políticas
relacionadas com o crime e com os seguros.
Palavras-chave: Método de Avaliação Contingente; Custos Intangíveis; Custos do Crime

iv
Index of contents
Acknowledgements............................................................................................................................ i
Abstract ........................................................................................................................................ ii
Index of contents ............................................................................................................................. iv
Index of Tables ................................................................................................................................ vi
Index of Figures.............................................................................................................................. vii
Abbreviations................................................................................................................................. viii
Introduction...................................................................................................................................... 1
Chapter 1. Categorization of the costs of crime and techniques used for the valuation of
intangible costs of crime: a literature review............................................................. 5
1.1. Initial considerations................................................................................................................ 5
1.2. Categorization of the costs of crime ........................................................................................ 5
1.3. Methods of estimating intangible costs of crime ..................................................................... 8
1.3.1. A summary of the main methods ...................................................................................... 8
1.3.2. The Hedonic Price Methodology ...................................................................................... 8
1.3.3. Transferring values from other contexts ......................................................................... 10
1.3.4. Crime jury awards........................................................................................................... 10
1.3.5. Quality Adjusted Life Year (QALY) approach .............................................................. 11
1.3.6. Shadow Pricing ............................................................................................................... 13
1.3.7. The Contingent Valuation Method (CV) ........................................................................ 14
Chapter 2. Willingness to pay for violent crime reduction: methodological considerations... 20
2.1. Initial considerations.............................................................................................................. 20
2.2. The Contingent Valuation Method ........................................................................................ 20
2.3. The Contingent Valuation Method in the crime context ....................................................... 22
Chapter 3. Willingness to pay for violent crime reduction: results for Portuguese Higher
Education students ..................................................................................................... 29
3.1. Initial considerations.............................................................................................................. 29
3.2. Model specification and variable description: ....................................................................... 29

v
3.3. Some descriptive results ........................................................................................................ 32
3.4. Determinants of higher education students’ willingness to pay for violent crime reduction:
results from the estimation of the econometric models......................................................... 40
References ...................................................................................................................................... 48
Appendix ...................................................................................................................................... 54

vi
Index of Tables
Table 1: Categorization of the costs of crime..................................................................................... 5
Table 2: Cost of different types of crime in the US, 1988 ............................................................... 11
Table 3: Discounted QALY losses and money values for these losses (UK, 2005) ........................ 12
Table 4: Total realized intangible victim costs of crime by crime category .................................... 13
Table 5: Individuals’ willingness to pay to avoid each type of crime (US, 2000) ........................... 15
Table 6: Injury Descriptions............................................................................................................. 16
Table 7: Determinants of WTP and their statistical significance..................................................... 18
Table 8: Summary statistics of WTP and cost of statistical crime ................................................... 18
Table 9: Advantages and disadvantages of CV method´s elicitation techniques............................. 25
Table 10: Advantages and disadvantages of CV method´s survey modes....................................... 27
Table 11: Variables Description....................................................................................................... 30
Table 12: Descriptive statistics ........................................................................................................ 33
Table 13: Percentage of responses per total number of Faculty students at the University of Porto
(UP) ................................................................................................................................... 35
Table 14: Differences in the mean of WTP for the different categories (in euros).......................... 37
Table 15: Correlation matrix ............................................................................................................ 39
Table 16: results of model estimation .............................................................................................. 41
Table 17: Comparison of the present study with some existing available studies in the literature.. 44

vii
Index of Figures
Figure 1: Risk of being victim of a violent crime, 2008/2009 BCS................................................... 2
Figure 2: Evolution of the relative weight of violent crime in total crime, 1998-2008...................... 4
Figure 3: Tangible vs Intangible costs ............................................................................................... 6

viii
Abbreviations
BSC British Crime Survey
CV Contingent Valuation
FBI Federal Bureau of Investigation
FoC Fear of Crime
EU European Union
INE Instituto Nacional de Estatística
MAI Ministério da Administração Interna
MIETE Mestrado em Inovação e Empreendedorismo Tecnológico
NBER National Bureau of Economic Research
NICE National Institute for Clinical Excellence
NOOA National Oceanic and Atmospheric Administration
OLS Ordinary Least Squares
QALY Quality Adjusted Life Year
UCR Uniform Crime Report
U.K. United Kingdom
U.S. United Sates of America
WTA Willingness to Accept
WTP Willingness to Pay

1
Introduction
Benefit cost analysis is considered an important tool to analyze the benefits and costs of
criminal justice policies (Cohen, 2000). In a society of scarce resources that can be
allocated to different alternatives, estimating the costs of crime can help policy makers
make more informed decisions (Cohen, 2000; Streff et al., 1992). According to Cohen
(2000), costs can be classified in general as tangible or intangible costs. Tangible costs are
associated with monetary payments like medical costs, costs with the justice system, losses
in property values and working days (Cohen, 2000). Intangible costs are not valued in the
market (Cohen, 2000) and include the costs of pain, suffering, the loss of quality of life
inflicted on crime victims (Atkinson et al., 2005), and the costs of fear of crime (Moore et
al., 2006). It is more complicated to measure intangible costs of crime (Dolan et al., 2005)
but the costs of the emotional and physical impact of crime may be greater than financial
costs, particularly for violent and sexual offenses (Brand and Price, 2000). In the case of
drug abuse programs, Rajkumar and French (1997) argue that the inclusion of intangible
losses of victims in crime costs might considerably raise the benefits of avoiding criminal
activity.
The available literature distinguishes several methodologies to estimate the intangible costs
of crime (Cohen, 2000; Rajkumar and French, 1997). One of the methods that attempt to
incorporate these intangible impacts of crime is the Contingent Valuation Method
(Atkinson et al., 2005). This method uses surveys to ask respondents how much they
would be willing to pay for a small reduction in a particular risk or how much they would
be willing to accept as a compensation for a small increase in a particular type of risk
(Carthy et al., 1999). The surveys are characterized by the fact that they present a
hypothetical situation with which respondents are confronted with allowing to tailor the
scenario to the needs of the researcher. The Contingent Valuation (CV) approach allows
eliciting willingness to pay - a measure provided by the welfare theory (Mitchell and
Carson, 1988) – and when applied to the criminal context allows the researcher to
determine the value individuals place on the reductions in crime (Atkinson et al., 2005).
Although this technique has been widely used in other contexts1 it has not been generally
applied to criminal research (Cohen et al., 2004; Atkinson et al., 2005).
1 See for example Tyrvainen and Vaananen (1998) for an application to an environmental context, Alberini and Chiabi (2007) for a health context or Gerking et al. (1988) for a study in a workplace safety context.

2
Among the few studies that exist in this field the one by Ludwig and Cook (1999),
presented in a NBER working paper, was the first study on eliciting willingness to pay in a
crime context. In their study they determine individual’s willingness to pay for a program
aimed at reducing gun violence by 30%. Later, Cohen et al. (2004) use the contingent
valuation method to estimate people’s willingness to pay for crime control programs and
Atkinson et al. (2005) use this stated preference approach to value the costs of violent
crime. These studies use representative samples (Ludwig and Cook, 1999; Cohen et al.,
2004) or sampling points (Atkinson et al., 2005) drawn from the whole population of two
countries where criminality rate is relatively high, the US and the UK.
The study presented in this dissertation is, to our best knowledge, the first attempt to apply
the contingent valuation method to estimate the amount that a specific group of the society,
which is relatively prone to being victim of (violent) crime - students - is willing to pay to
reduce the probability of being victims of a violent crime. In contrast to existing literature,
our study focus on an underexplored context, Portugal, where criminality and violent crime
incidence is relatively low by international standards, although observing an increasing
trend.
University students are a pertinent population sample as one might assume that due to the
higher level of education they would be more capable of making more informed decisions
in estimating the trade-off between costs and safety. It is also considered a population with
a high risk of becoming a victim of a violent crime (Walker et al., 2009).
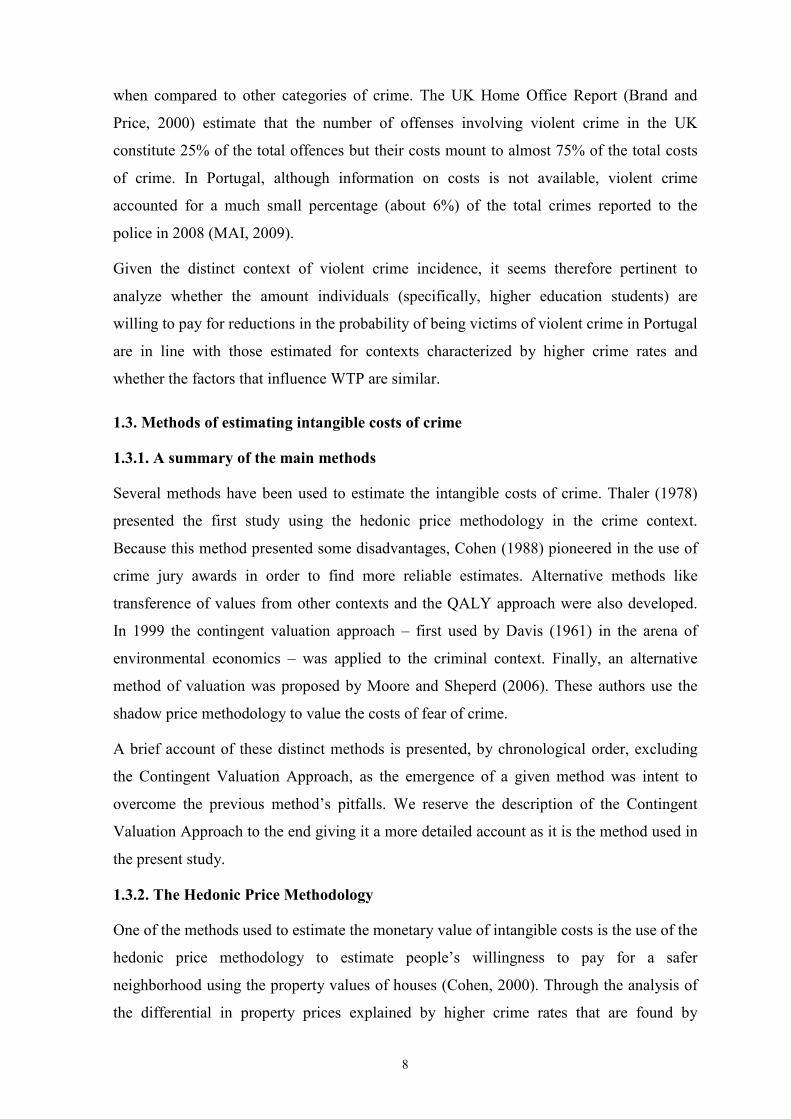
3,2
7,5
7,6
7,6
8,6
12,4
13,2
0 2 4 6 8 10 12 14
All adults
Mixed ethicity
Single people
Unemployed
Full-t ime student
Visited nightclubs one a
weak/more in last month
Men aged 16-24
%victims once or more
Figure 1: Risk of being victim of a violent crime, 2008/2009 BCS
Source: Walker et al. (2009)

3
According to Walker et al., (2009) in the Home Office Statistical Bulletin – Crime in
England and Wales 2008/2009, full time students, single people and mixed ethnicity have a
higher risk than the average of being victims of violent crime. Risk is also higher for men
aged 16 to 24 (cf. Figure 1).
The current study is also, to our best knowledge, the first Contingent Valuation study
conducted in a relatively low crime incidence context, Portugal, thus adding an empirical
contribution to the few studies in the field.2 As referred earlier, the available literature
focuses on studies conducted in the U.S (Ludwig and Cook, 1999; Cohen et al., 2004) or
the UK (Atkinson et al., 2005), where the rate of violent crime is substantially higher than
in Portugal. According to a study of a European Consortium financed under the 6th
Framework Programme (2007: 2), the “[r]isks of being assaulted were found to be highest
in the UK, Ireland, The Netherlands, Belgium, Sweden and Denmark. Risks were lowest in
Italy, Portugal, Hungary, Spain and France. Experiences with sexual violence were
reported most often by women in Ireland, Sweden, Germany and Austria and least often in
Hungary, Spain, France and Portugal.”
FBI Uniform Crime Report (UCR)3 reported the existence of 466.9 and 473.5 violent
crimes in the US per 100,000 habitants in 2007 and in 2006, respectively.4 Own
calculations based on absolute values of violent crime (including homicide) and population
reported in EUROSTAT, present evidence that the UK has a higher rate of violent crime
than the US whereas Portugal has one of the lowest rates of violent crime in Europe. The
weight of violent crime in total crime recorded is also lower in Portugal. According to the
“Relatório Annual de Segurança Interna – Ano de 2008”, the weight of violent crime in
Portugal in total crime was 5.8%, representing an increase of 10.8% compared to 2007 (cf.
Figure 2). Despite such raise this figure is significantly lower than the UK figure, which is
over 20%.
The countries, where criminal intensity is high (US and UK) have been used to estimate
the amount people are willing to pay to reduce the risk of victimization. It is important
therefore to analyze whether such results are consistent with the ones found for a country
where both the crime rates and the proportion of violent crime are lower.
2“In 2004 levels of crime were most elevated in Ireland, the United Kingdom, Estonia, The Netherlands and Denmark and lowest in Spain, Hungary, Portugal and Finland”, The burden of Crime in the EU, Research Report: a comparative analysis of the European Crime and Safety Survey (EU ICS) 2005. 3 http://www.fbi.gov/ucr/cius2006/offenses/violent_crime/index.html - accessed 19-08-2009 4 The FBI considers that violent crime includes 4 offenses: murder and non-negligent manslaughter, forcible rape, robbery and aggravated assault.

4
4,6
5,45,6
6 6
5,7
66,2
6,3
5,65,8
0,0
1,0
2,0
3,0
4,0
5,0
6,0
7,0
1998 1999 2000 2001 2002 2003 2004 2005 2006 2007 2008
weight (%
) of vio
lent cr
ime in
total cr
ime
Figure 2: Evolution of the relative weight of violent crime in total crime, 1998-2008
Source: MAI (2009), Relatório Anual de Segurança Interna, 2008
Our respondent sample includes 1122 students of the largest Portuguese University
(University of Porto), embracing individuals from a large scope of (32) courses and (14)
faculties/schools, permitting to evaluate the extent to which students enrolled in distinct
courses (e.g., economics vs. engineering vs arts or medicine), proxy for individual’s
distinct inclinations or psychological traits (Roeser, 2006), present different willingness to
pay for violent crime reductions. We device an econometric model aimed at empirically
assessing which are the most important determinants of students’ willingness to pay for
violent crime reduction.
This study is structured as follows. In Chapter 1 we present a review of the available
literature on the methods of valuation of the costs of crime that incorporate the valuation of
intangible costs. The following chapter (Chapter 2) focuses on the methodology used to
design the questionnaire. Chapter 3 elaborates on the model specification and variables that
are used for the estimation and provides an outline of the main results of the survey. A
comparison of these results with the available literature is also addressed in this chapter.
Concluding remarks are reserved for the end of the dissertation where some key findings of
this work are summarized, their implications to criminal policy are discussed, and
limitations and paths for future research are put forward.

5
Chapter 1. Categorization of the costs of crime and techniques used for the valuation
of intangible costs of crime: a literature review
1.1. Initial considerations
Our research aim is to estimate the Willingness to Pay (WTP) of higher education students
to reduce the risk of being victims of a violent crime using the contingent valuation
approach. The existing literature in the field is confined to a few studies in two countries
with high crime rates: UK and US. The samples used for the studies aimed at being
representative of the population without attempting to verify whether different areas of
knowledge (e.g., arts, economics, medicine, and engineering) affect the amount people are
willing to pay. In the present chapter we present, in a first section (Section 1.2), a possible
categorization in which the costs of crime might be divided and a brief explanation for the
need to monetize the costs of crime and the ethical issues associated with using monetary
metrics to value intangible costs like pain and suffering. The reasons for the choice to
measure the monetary impacts of violent crime are also addressed in this section. In
Section 1.3 we review the available literature on the techniques used for the valuation of
intangible costs of crime and describe the contribution of our study to the literature.
1.2. Categorization of the costs of crime
There are several ways in which the cost of crime might be categorized. Following the
typology presented by Czabánski (2008), the cost of crime is divided (cf. Table 1) in three
categories: cost in anticipation of crime, costs of crime itself, and costs of society’s
response to crime.
Table 1: Categorization of the costs of crime
Source: Own systematization

6
Moreover it is also possible to find in literature the classification of crime costs according
to who bears them (Brand and Price, 2000; Cohen, 2000).5 Victims partially bear the costs
of lost property and the emotional and physical impact of crime. Potential victims partially
sustain the costs of fear of crime and the costs of precautionary behaviour and
expenditures. Society is faced with costs related to running the institutions associated with
the criminal justice system. Even offenders bear costs such as the value of lost freedom and
lost wages.
For the development of the present study the distinction between tangible and intangible
costs of crime (cf. Figure 3) is particularly relevant given that the method (Contingent
Value) used to estimate the WTP has the advantage of incorporating intangible costs of
crime. Out of pocket expenses, lost wages, property losses or administrative costs with the
justice system are tangible costs that constitute only part of the total costs of crime. The
reduced quality of life, the anguish, pain and trauma that accompany criminal events also
imply costs that are not just easily measured and monetized.
Figure 3: Tangible vs Intangible costs
Source: Own systematization
Multiple categorizations of crimes are possible but a unique metric to value these costs is
needed (Miller et al., 1996).6 Several reasons explain the use of monetary metrics to
measure the costs of crime. One of them is comparability in the context of policy making
and analysis between the harms caused by different types of crime (Cohen, 2000).
5 For a comprehensive list of the bearers of the different costs of crime see Cohen (2000). 6 The categories of costs mentioned are not listed exhaustively. See Cohen (2000) or Rajkumar and French (1997) for other classification of crime costs.

7
Quantifying the seriousness of a certain category of crime will allow policy makers to rank
public action in the reduction of crime (Czabanski, 2008) allowing for guidance in
allocation of resources between crimes (Miller et al., 1996). The comparison of the costs
and benefits of a specific program or policy whose goal is to control a certain type of crime
is also considered a reason for the use of monetization of costs (Cohen, 2000). By choosing
to implement a specific program of prevention or crime control the policy maker is
implicitly making an analysis of the costs and benefits of adopting that particular program
and not an alternative policy. By doing so, a monetary value on crime is being attributed,
even if it is done implicitly (Cohen, 2000; Atkinson et al., 2005). Furthermore, it is
necessary to estimate the aggregate cost of crime to society in order to compare it to other
social problems and better allocate resources (Cohen, 2000; Czabanski, 2008).
Public opinion might consider that the costs of crime are the ones expressed in the
accounts of public spending and make judgments on the amounts spent. However only if
the costs of crime are estimated will it be possible to know the benefits of crime avoidance
and compare the costs and benefits of criminal policy. In this vein, and according to
Czabanski (2008: 18), estimating the costs of crime will avoid the “bias toward an
accountant perspective”.
In spite of the need to monetize the costs of crime, this is not a consensual approach
(Czabanski, 2008). Indeed, it is often defended that life is priceless (Jongejan et al., 2005;
Viscusi, 2008) and putting a value on people’s suffering is taken as “cold” and
“impersonal” (Miller et al., 1996: 1). Measuring correctly the emotional and psychological
impacts of violent crime is also considered “impossible” and “artificial” (Brand and Price,
2000).
However, it should be noted that the results presented in literature do not intend to value
the pain and suffering of a particular individual in the sense that putting a value on the
suffering of a crime victim in particular would be considered by most inadmissible. Rather,
the studies are an attempt to measure ex-ante the value society places on preventing that
suffering (Brand and Price, 2000). It is also worth mentioning that what is being analyzed
is not the value of a single crime but the value of crime reduction (Czabanski, 2008). It is
the monetary valuation of crime costs that allow policy appraisal and evaluation (Brand
and Price, 2000).
The study presented in this dissertation focuses on the reduction of a particular kind of
crime: the violent crime. This is explained by the relative importance of violent crime
8
when compared to other categories of crime. The UK Home Office Report (Brand and
Price, 2000) estimate that the number of offenses involving violent crime in the UK
constitute 25% of the total offences but their costs mount to almost 75% of the total costs
of crime. In Portugal, although information on costs is not available, violent crime
accounted for a much small percentage (about 6%) of the total crimes reported to the
police in 2008 (MAI, 2009).
Given the distinct context of violent crime incidence, it seems therefore pertinent to
analyze whether the amount individuals (specifically, higher education students) are
willing to pay for reductions in the probability of being victims of violent crime in Portugal
are in line with those estimated for contexts characterized by higher crime rates and
whether the factors that influence WTP are similar.
1.3. Methods of estimating intangible costs of crime
1.3.1. A summary of the main methods
Several methods have been used to estimate the intangible costs of crime. Thaler (1978)
presented the first study using the hedonic price methodology in the crime context.
Because this method presented some disadvantages, Cohen (1988) pioneered in the use of
crime jury awards in order to find more reliable estimates. Alternative methods like
transference of values from other contexts and the QALY approach were also developed.
In 1999 the contingent valuation approach – first used by Davis (1961) in the arena of
environmental economics – was applied to the criminal context. Finally, an alternative
method of valuation was proposed by Moore and Sheperd (2006). These authors use the
shadow price methodology to value the costs of fear of crime.
A brief account of these distinct methods is presented, by chronological order, excluding
the Contingent Valuation Approach, as the emergence of a given method was intent to
overcome the previous method’s pitfalls. We reserve the description of the Contingent
Valuation Approach to the end giving it a more detailed account as it is the method used in
the present study.
1.3.2. The Hedonic Price Methodology
One of the methods used to estimate the monetary value of intangible costs is the use of the
hedonic price methodology to estimate people’s willingness to pay for a safer
neighborhood using the property values of houses (Cohen, 2000). Through the analysis of
the differential in property prices explained by higher crime rates that are found by

9
controlling other variables that influence prices (e.g. proximity of a school), researchers are
able to estimate the amount residents are willing to pay for lower crime rates in their
neighborhood. The cost residents place on crime is inferred from these amounts (Rajkumar
and French, 1997).
We find several studies that resort to this approach. Thaler (1978) was the first researcher
to publish a study aimed at estimating the effect crimes have on property prices. The author
concludes that crime does have a negative impact in housing prices. Using data from
Rochester, New York, Thaler (1978) found that an average property crime lowers house
prices by approximately $1930 (1995 prices) as stated by Lynch and Rasmussen (2001).
Tita et al. (2006) found that housing prices are lower in neighborhoods that show higher
violent crime rates. The authors also note that the negative impact of crime in housing
prices depends on the type of crime and neighborhood characteristics. This effect is more
significant in low income neighborhoods when compared to high income neighborhoods.
The importance of violent crime costs is also brought out as it is stated that it has the
highest cost. Tita et al. (2006) estimated that the increase in housing prices due to the
reduction in violent crime is approximately 39%.
Different results emerge from different studies and not all of them report an influence of
crime rates on property houses. Lynch and Rasmussen (2001), for instance, report that in
Jacksonville (Florida, U.S.) violent crime has a small impact on housing prices. A 10%
increase in violent crime would only decrease the predicted sales price by $145. The
annual WTP was estimated at only $15 for a violent crime. Gibbons (2004) also estimates
the effect crime rates have on property prices considering this the measure of household’s
willingness to pay to avoid crime. The author finds that even though crimes like vandalism
or arson have a considerable negative effect in housing prices it is not the case of burglary.
One explanation presented in the study refers to the possibility that people perceive
vandalism, graffiti and other forms of property damage as a signal of neighborhood
deterioration and a possible evidence of higher crime rates.
Although these studies have the advantage of working with actual market transactions,
they rely on assumptions on the competitiveness of the housing market and on the public’s
knowledge of the neighborhood crime rates (Cohen, 2000). Additionally Cohen (2007)
argues that not all types of crimes have an impact on housing prices as some crimes are
committed when people are away from home (for instance, when they are travelling) or
when people are inside their homes (e.g. domestic violence).

10
1.3.3. Transferring values from other contexts
Transferring values from other contexts is an alternative approach (Dolan et al., 2005). It is
possible to transfer the values of a statistical life calculated in other areas, such as
transport, to the criminal context or adapt these amounts so that they can be used to
estimate crime costs (Dolan et al., 2005). Phillips and Votey (1981) (in Cohen, 2000),
included valuation of a statistical life from a non crime context to infer monetary values of
crime specific nature. Brand and Price (2000) made a direct transfer of figures estimated
using contingent valuation questions on road traffic accidents on their report on “The
Economic and Social Costs of Crime”. Even though these values are used in the report, the
authors acknowledge that the direct transfer of these values to the criminal context is not
ideal as the circumstances of the injuries sustained by violent crime victims are different
from the ones sustained as a consequence of a road accident (Brand and Price, 2000).
Furthermore, both the type of injuries suffered and the psychological consequences of a
crime offense are different (Brand and Price, 2000; Dolan et al., 2005). This justifies the
interest in estimating the costs of crime in a crime specific context (Atkinson et al., 2005).
1.3.4. Crime jury awards
Due to the pitfalls of hedonic price methodology to estimate the intangible costs of crime,
Cohen (1988) used the verdicts emanated from the juries in civil cases (Czabanski, 2008).
The amount of compensation the jurors awarded for similar injuries was used as a proxy
for the costs of pain and suffering inflicted on victims. This methodology assumes that the
jurors will award the injured citizens an amount that is higher than their financial losses.
The difference would represent the costs of pain and suffering (Rajkumar and French,
1997). The total costs of crime involved the estimation of three key components: direct
losses (out of pocket expenses taken from the national crime survey); pain and suffering
(estimates based on jury awards) and risk of death (taken from previous studies on the
value of human life). The estimates found by Cohen (1988), summarized by Czabanski
(2008), are presented in Table 2.
Pain and suffering represent the highest costs accounting for more than 90% of all costs in
the case of personal crimes (Czabanski, 2008).
The use of jury awards is not without limitations. Nagin (2001) (in Czabanski, 2008) notes
that the jury awards are not representative as only the most complicated crimes actually
reach court. Furthermore, this is a mechanism particularly used in the United States legal

11
system. In other countries it is the judge that awards the compensation to victims. As a
consequence, the amounts may not be representative of society’s view of pain and
suffering. Czabanski (2008) also mentions the fact that not all categories of intangible costs
are being valued (e.g. fear of crime) because the jury awards do not compensate potential
victims. Costs with certain behaviour meant to avoid crime for e.g. locking windows,
walking longer distances to get home (Dolan et al., 2007) or taking a taxi to avoid walking
(Cohen, 2000) are not considered. Additionally, Rajkumar and French (1997) note that the
injury suffered as a consequence of a criminal offense may not be the same type of injury
sustained in a civil case. Miller et al. (1996) used data from jury awards on victims of
physical and sexual assault to overcome this limitation. However, this method still does not
account for non-victim losses.
Table 2: Cost of different types of crime in the US, 1988
Cost of crime to victims (US dollars)
Crime Direct losses
Pain and suffering
Risk of death Total
Aggregate cost
(thousand million dollars)
Against person
Rape 4 617 43 561 2 880 51 058 9.1
Robbery 1 114 7 459 4 021 12 594 14.0
Assault 422 4 921 6 685 12 208 56.0
Larceny 179 - 2 181 2.5
Against household
Motor vehicle theft 3 069 58 3 127 4.2
Burglary 939 - - 939 5.3
Larceny 173 - - 173 1.5
Total aggregate cost
(thousand million dollars) 17.5 39.0 36.1 92.6
Source: Cohen (1988) in Czabanski (2008)
1.3.5. Quality Adjusted Life Year (QALY) approach
Dolan et al. (2005) and Dubourg et al. (2005) use the approach known as Quality Adjusted
Life Year (QALY) to estimate the costs of crime (including the intangible component).
The QALY approach, which was developed in the health context, assumes that any profile
of health can be stated in terms of years of life weighted by an index of health-related
quality of life (Dolan, 2000 in Dolan et al., 2005). To full health is assigned a score of 1
and to death a score of 0. The measure of quality of life is thus comprised in the interval
[0,1]. Dolan et al. (2005) and Dubourg et al. (2005) use data from several sources
including the British Crime Survey (BCS) to calculate QALY losses for each type of

12
offence. Dolan et al. (2005) conclude that in terms of QALY’s loss, rape has the worst
consequences after murder involving a loss of quality of life 80 times higher than a
common assault. For transforming the QALYs into monetary amounts Dolan et al. (2005)
used two different methods. One possible measure of the monetary amount of a QALY is
£30 000 based on the figure used by the National Institute for Clinical Excellence (NICE)
to evaluate health care technologies. This is not a rigorous method as acknowledge by the
authors as it is not based on the preferences of individuals but rather on the opinion of a
small group of experts. Another approach refers to the use of an amount based on weighted
averages of WTP and WTA (Willingness to Accept) for a base injury (W) elicited from the
population. Based on Carthy´s et al. (1999) findings the amount used was £ 3 000 per
QALY.
Dolan et al. (2005) use these two methods to estimate the monetary values of QALY losses
for different types of crimes (cf. Table 3).
Table 3: Discounted QALY losses and money values for these losses (UK, 2005)
Offence Discounted QALY
losses NICE threshold (£)
Carthy et al.’s weighted average W (£)
Murder 17 791 533 721 -
Serious Wounding 0.191 5 723 15 378
Other Wounding 0.031 945 2 539
Common assault 0.007 218 587
Rape 0.561 16 840 45 256
Sexual assault 0.160 4 790 12 872
Robbery 0.028 845 2 271
Source: Dolan et al. (2005)
Making use of available estimates on the annual incidence of each type of offence, Dolan
et al. (2005) infer the total intangible costs of crime by crime category, which are presented
in Table 4. Despite the absolute differences in the amounts found using distinct monetary
measures to value a QALY, the relative cost of one crime compared to the other is not
changed because the difference is in the multiplier used (Dolan et al., 2005).
Even though Dolan et al. (2005) consider that the methods for estimating the intangible
costs of crime are not robust and that the revealed preference approach is not a practical
way of valuing these costs, the QALY approach has some limitations. First of all, the
QALY approach only values the costs of crime to victims. It does not incorporate any
value of crime of costs to society (Cohen, 2007). Furthermore, Cohen (2007) also argues

13
that this approach only values a specific injury and does not contemplate avertive
behaviour costs. Krupnick (2004) in Cohen (2007) defends that QALY is an approach that
is suitable for measuring health changes but not for non related health outcomes. The
estimates also depend on the assumption on the measure that is used to express a QALY in
monetary terms.
Table 4: Total realized intangible victim costs of crime by crime category
Annual incidence Total cost using NICE
value (£m) Total cost using injury
W value (£m)
Murder 1 100 587 1 100*
Serious Wounding 110 000 629 1 6 92
Other Wounding 780 000 737 1 980
Common assault 3 200 000 700 1 879
Rape 61 000 1 027 2 760
Sexual assault 69 900 341 916
Robbery 420 000 355 954
Total 4 375 11 280 *The authors assumed the amount of £1 m corresponding to the “pain, grief and suffering” part of the value of preventing a road accident fatality as the value of preventing a murder. Source: Adapted from Dolan et al. (2005)
1.3.6. Shadow Pricing
Another method recently used to measure the intangible costs of crime, particularly the
costs of Fear of Crime (FoC), is shadow pricing (Moore and Shepherd, 2006). Individual’s
daily routines are affected by the decrease in socialization, e.g. going out at night or
travelling as well as by the reduction of the feeling of pleasure in work and recreation
activities (Brand and Price, 2000). The costs associated with the fear of crime are thus an
important factor in economic behaviour (Moore and Shepherd, 2006). Not including these
costs underestimates the correct costs of crime (Dolan et al., 2007).
Moore and Shepherd (2006) stated to have developed the first study of shadow costing to
value fear of crime. Their study is based on the assumption that income is positively
related to happiness extrapolating this thought to the fear of crime. Thus, lower income is
associated with higher levels of fear of crime. The shadow pricing methodology is
consistent with happiness studies that estimate a price for negative life events. This
methodology, that involves the estimation of a regression, was applied to British Crime
Survey (2000) data to infer the amount of income people would require to be compensated

14
for the consequences of increased fear. Using as proxy measures of fear namely the fear of
walking in the dark and the fear of being home alone, the authors found that people require
an increase in their annual household income of 496% to offset the change from no threat
to one threat of violence for walking in the dark. If the measure of fear involved is the fear
of being home alone then people require an increase of 115% of their income.
Through the application of this method using data from the European Social Survey,
Moore (2006) also found that an average European would require an increase of 13 358€ to
be compensated from a transition from the state of “no fear” to “fear”. This method was
only developed in 2006 and still needs to be critically evaluated but some pitfalls can be
identified. The authors argue that only the threat of violence and not the victimization itself
is related to the fear of crime. Empirical evidence states otherwise (Czabanski, 2008).
1.3.7. The Contingent Valuation Method (CV)
A popular technique to measure the intangible costs of crime is the Contingent Valuation
method (Moore and Shepherd, 2006). Ludwig and Cook (1999) presented the first study
with the goal of estimating the benefits of reducing crime using the Contingent Valuation
Method. In the survey, respondents were asked if they were willing to vote for a program
aimed at reducing gun injuries by 30% that requested the payment of a certain amount of
money, through the increase in annual taxes. The authors assume that the respondent’s
Willingness to Pay (WTP) does not value the risk reduction for the individual but for his
entire household. On the impact of income on WTP, the results of the survey suggest that
there is a positive relationship between these two variables. The amount of WTP is also
positively influenced by the number of children that constitute the household.
The authors’ estimates imply that the value of a gunshot injury is USD 750 000 (1998
USD) and societal WTP to reduce gun violence is approximately USD 23.8 thousand
million dollars (1998 USD). As a limitation of this survey the authors acknowledge that the
baseline risks of being a victim of a gunshot injury is not mentioned nor is which part of
the population will benefit from the gun reducing program.
Cohen et al. (2004) use the Contingent Valuation Method to determine people’s WTP for
programs designed for crime control and provide new estimates of the cost of crime. The
authors developed a survey, administered by telephone, in which 2228 respondents were
asked if they were willing to vote for a proposal that demanded the payment of a certain
amount of money to avoid one in ten crimes in their community. Each of the 1300

15
respondents that actually completed the interview was then asked if she was willing to pay
a certain amount of money to continue a successful program in crime control for three
types of crime randomly chosen out of five possible ones: burglary, serious assault, armed
robbery, rape or sexual assault and murder. In this study respondents were not given any
information regarding crime rates, risk of victimization, average losses or severity of
injuries usually related to each type of crime. These details were omitted intentionally so
that respondents could answer based on their own perception of these crimes. The authors
found that respondents were willing to pay different amounts to avoid each type of crime
(Table 5).
Table 5: Individuals’ willingness to pay to avoid each type of crime (US, 2000)
Type of Crime Nº of crimes associated
with a 10% crime reduction
WTP for a 10% reduction (USD)
Implicit value of a statistical crime (USD)
Burglary 426 113 104 25 000
Armed Robbery 48 681 110 232 000
Serious Assault 177 836 121 70 000
Rape and Sexual Assault
54 747 126 237 000
Murder 1 553 146 9 700 000
Source: Adapted from Cohen et al. (2004)
A representative household would be willing to pay an average of between USD 104 (for
burglary) and USD 146 (for murder) per year for crime reduction programs that diminished
specific crimes by 10%.
Using an estimate of the number of crimes avoided with a 10% reduction in crime rates
and considering the existence of 103 million households in the United States of America
the authors were able to estimate the cost per type of crime (cf. Table 5).
Using the WTP amount of USD 146 in the case of murder, globally the American people
would be willing to spend around 15 thousand million USD in the programe (USD146 x
103 million). Dividing this amount by the number of murders averted with a reduction of
10% in its number it is possible to estimate an implicit value of a statistical crime of USD 9
700 000 in the case of murder (Cohen et al., 2004).
Through the analysis of the data the authors were also able to conclude that WTP varies
with the income level of the respondents. Low income respondents are usually willing to
pay less to reduce crime victimization than higher income respondents even though they

16
have higher victimization rates. It is thus suggested that the ability to pay plays a role in
explaining the amount of WTP. Cohen et al. (2004) further argue that WTP is negatively
related to age. The amounts of WTP that result from this study using the Contingent
Valuation Method are higher than figures estimated using other methods. A possible
explanation suggested by the authors refers to the fact that respondents might overestimate
the risks and the injuries sustained by violent crime, thus eliciting higher values of WTP.
However, it is also possible that these figures are higher because they reflect aspects like
the fear of crime and the willingness to live in safer communities making them a relevant
contribution to evaluating the cost of crime.
Atkinson et al. (2005) developed a survey using CV method in the UK aimed at valuing
the benefits of reducing violent crime, especially its intangible impacts. Their study
focused on three different categories of offense: “common assault”, “serious wounding”
and “other wounding” and included a very detailed description of the probable health
effects (physical and psychological) that a victim of each of these offenses might sustain.
This comprehensive description of symptoms was given to respondents as they might have
not been completely aware of the consequences of being a victim of a violent crime. Table
6 includes the description of the injury profiles used by the authors.
Table 6: Injury Descriptions
Common Assault Other wounding Serious wounding
No injury profile Moderate injury profile Serious injury profile
None Cuts and grazes Concussion
Extensive bruising to body and face
Cuts (needing stitches)
No medical attention required
Two broken ribs
Bruising to body Immediate medical attention required and two nights in hospital
Physical injury
Minor physical discomfort for 3 weeks followed by complete recovery
Pain and discomfort for a month followed by complete recovery
Short-term Medium-term Long-term
Distress profile Distress profile Distress profile
Repeated recollections of assault
Repeated recollections of assault
Repeated recollections of assault
Feel shaken after a few hours after assault
Difficulty falling asleep or staying asleep (1 or 2 nights each week)
Difficulty falling asleep or staying asleep (1 or 2 nights a week)
Symptoms last for 1-2 days Difficulty concentrating on daily tasks
Difficulty concentrating on daily tasks
Symptoms last for 2 weeks Feelings of nervousness
Psychological distress
Symptoms last for 6 months
Source: Atkinson et al. (2005)

17
In the scenario used for the elicitation, the respondents were also informed of the
probability of being a victim of each type of incident previous to the risk control policy:
1% for other wounding and serious wounding and 4% for common assault.
Corso et al. (2001) argue that one of the limitations of the CV method is the lack of
accurate communication of the magnitude of the risk to the respondents taking the survey.
If the respondents do not understand the proportion of the risk being reduced they will not
evaluate their preferences correctly. They thus suggest the use of visual aids, like tables,
pie charts or “risk ladders” as a possible method of overcoming this difficulty. Following
Corso et al. (2001), Atkinson et al. (2005) opted to inform respondents of the risk change
by using visual aids through the inclusion of two grids with shaded and non-shaded squares
describing the likelihood of being a victim of the offense before and after the
implementation of the risk reduction policy. In the survey, respondents were asked to elicit
their WTP to reduce in 50% the probability of becoming victims of one of the three types
of incidents over the following year. The payment vehicle would be an increase in local
taxes for law enforcement (Atkinson et al., 2005). From a sample of 807 interviews, only
523 were used for the estimates - the authors excluded 279 responses classified as
“protests” (respondents who were not willing to pay any amount at all to reduce the risk of
being crime victims) and 5 responses considered extreme outlying values (responses in
which the WTP is more that 10% of the respondent’s income and the WTP is higher than
£2500). Even though the proportion of protests was 30%, the authors determined that the
sample had not been biased as the differences in the demographic characteristics of the
protesters and the respondents that did not protest were not statistically significant.
The study of Atkinson et al. (2005) also includes variables reflecting the fear of crime,
perception of neighborhood safety, effectiveness of police in reducing crime rates and the
respondent’s behaviour in avoiding crime. The analysis of the data of the survey allowed
reaching the conclusion that willingness to pay (WTP) is very different across respondents
and is higher for the crimes that cause the most serious consequences in the respondent’s
physical and psychological health. This means that WTP varies positively with the severity
of the injuries caused by each type of offense. Aiming at examining the factors that
determine the variations of WTP across respondents the data was modeled parametrically.
Table 7 synthesizes the determinants that influenced individuals’ WTP and their statistical
significance.

18
Table 7: Determinants of WTP and their statistical significance
Variable Influence on WTP Statistically significant
(level of significance)
Other wounding + 5%
Serious wounding + 10%
Sex Not significant
Age Not significant
Low education - 5%
Income (log) + 5%
Victim five years Not significant
Fear of crime + 10%
Neighborhood safety Not significant
Policing + 10%
Lock door at home - 5%
Source: Own formulation using information from Table 8 in Atkinson et al. (2005)
One of the most important results is that the severity of the offense influences WTP
positively, every other factor remaining constant. Moreover, higher levels of income,
education and the lack of an avertive behaviour towards crime also have a positive impact
on WTP, ceteris paribus. One characteristic of the respondents that was controlled for
referred to the respondents having been victims of a crime in the past. Data analysis
suggested that although this had a positive impact in the WTP, it did not have a significant
influence in the amounts elicited. This could be explained by the small proportion of
respondents in the sample that had been victims of a crime in the past. Table 8 summarizes
the values of WTP and the implied cost of statistical crime per type of offence that resulted
from the use of parametric estimates.7 Based on the WTP amounts Atkinson et al. (2005)
were able to estimate the cost of a statistical crime (cf. Table 8).
Table 8: Summary statistics of WTP and cost of statistical crime
Willingness to Pay (in £)8 Cost of statistical crime (in £)
Mean Median Mean Median
Common assault 105.63 18.00 5 282 913
Other wounding 154.54 27.00 30 908 5 342
Serious wounding 178.33 31.00 35 844 6 196
Source: In Atkinson et al. (2005), Tables 6 and 8 combined and shortened
7 Parametric estimates were used in the table as Atkinson et al. (2005: 578) consider these a “better approximation of true WTP” than non parametric estimates. 8 The mean and the median results are quite different as the results show that the mean estimates are skewed and driven by a small number of respondents willing to pay a high amount. Another possible explanation is the difficulty people have in measuring crime impacts.

19
According to Atkinson et al. (2005) the cost of a statistical crime, in the case of common
assault, is £5,282. To reach this figure, the authors used the mean of the WTP, £105.63,
assuming that the marginal rate of substitution for a 2% reduction is £52.82.
In the line of Atkinson et al.’s (2005) study, the present dissertation resorts to the
contingent valuation method (CV) for estimating the willingness to pay (WTP) for violent
crime reduction in the case of Portuguese university students enrolled in a wide diversity of
courses and schools. Our contribution for the literature is twofold: firstly, to assess whether
different areas of knowledge in which higher education students are enrolled, proxied for
their distinct psychological traits, are a determinant factor of the corresponding willingness
to pay to reduce the risk of being victims of violent crime. Secondly, to provide some
insight as for the consistency of previous studies’ estimates, obtained in contexts (US and
the UK) where relatively high crime rates occur, in a context (Portugal) characterized by
relatively low crime rates.
The next chapter describes the methodology used in the implementation of the
questionnaire and the variables used in the econometric estimation.

20
Chapter 2. Willingness to pay for violent crime reduction: methodological
considerations
2.1. Initial considerations
Our study was designed to assess the amount that higher education students are willing to
pay for reductions in the risk of becoming victims of a violent crime. In this regard we
have adopted the Contingent Valuation Method so that respondents could directly express
the amount they would be willing to pay through answering a survey.
The present chapter details the methodology used to implement the survey and the
variables used in the estimation of the regressions. Section 2.2 presents a brief
characterization of the method, its merits and pitfalls. Then Section 2.3 addresses the
methodology used to implement the questionnaire and explains the reasoning behind the
questions included in the survey.
2.2. The Contingent Valuation Method
All decision-making involves choices and all choices involve a sacrifice. (Bateman et al.,
2002: 2).
In order to make choices it is necessary to use a common metrics to compare its costs and
benefits. However certain goods and services are not marketed (e.g. pain and suffering or
biodiversity in the environmental context) making economic valuation techniques needed
to assign them monetary values (Bateman et al., 2002). Generally, two approaches are used
to monetize these goods: the revealed preference approach and the sated preference
approach. In the revealed preference approach economic agents preferences are inferred by
economists by observing their behaviour when making decisions where risk is an important
element: when individuals accept riskier jobs in exchange for higher wages (Viscusi, 1993)
or decide the location of the house where they are going to live (Viscusi, 2000). The
hedonic price methodology and averting behaviour analysis are examples of techniques
used as revealed preference approach.
In the stated preference approach individuals are directly faced with a hypothetical
situation and asked directly to indicate their preferences. A methodology used in stated
preference approach is the Contingent Valuation method (CV). The CV method was first
applied by Davis (1961) in the context of environmental policy (Marta-Pedroso et al.,
2007). It is used to study trade-offs between money and small reductions in risk using
surveys to elicit how much individuals would be willing to pay for an improved state of a

21
provision of a public good or how much they would be willing to accept to be compensated
for its reduction (Pearce and Turner, 1990).9 For instance, Alberni et al. (2007) surveyed
the willingness to pay to reduce the risk of dying of cardiovascular and respiratory causes,
whereas Persson et al. (2001) survey WTP to reduce the risk of dying in a road traffic
accident.
The CV method has substantial advantages compared to the techniques of the revealed
preference approach (Mitchell and Carson, 1988). One important advantage is the fact that
it allows for the direct elicitation of the welfare measure of WTP. Another noticeable
advantage refers to the use of hypothetical scenarios that allow researchers to analyze
respondents WTP for goods that may not have been provided yet. These tailored scenarios
also enable the study of the transaction of the good in specific contingencies defined by the
researcher (Mitchell and Carson, 1988). Respondents may thereafter be informed of the
baseline risks and the risk reductions they are requested to value (Alberini and Chiabi,
2007), as well as the payment method or any other information the researcher finds
valuable to construct the scenario.
In 1993 a panel of distinguished social scientists chaired by two Nobel Laureates (Kenneth
Arrow and Robert Solow) was appointed by the National Oceanic and Atmospheric
Administration (NOAA) to assess if the CV method could provide reliable information.
This panel concluded that this technique could produce useful information and suggested a
number of guidelines to ensure the reliability of CV surveys (Carson, 2000; Arrow et al.,
1993; Marta-Pedroso et al., 2007). CV has since then been used as a popular method to
evaluate welfare changes in public policies or programs (Atkinson et al., 2005).
The CV method is not without limitations.10 One of the criticisms associated with this
method is that, because the scenario is hypothetical, individuals do not take into
consideration their budget constraints resulting in overestimates of the true WTP (Arrow et
al., 1993). Some studies have attempted to overcome this disadvantage reminding
respondents of their budget constraint (Alberini and Chiabi, 2007). However, this is not a
consensual matter as empirical studies have concluded that the budget constraint bias is not
relevant and reminding individuals about their available income might even lead to errors
9 The WTA approach has not been commonly used in criminal literature except for the case of jury awards, which incorporates this concept as people are compensated in an ex-post situation. For policy analysis it is considered more appropriate to elicit respondents about crime reductions and not infer the amount people would ask for a crime rate increase (Cohen, 2007). 10 For a more comprehensive debate on the controversies of CV method, particularly applied to environmental economics, see Carson et al. (2001) and Arrow et al. (1993).

22
(Ahlheim, 1998). It is also argued that the hypothetical nature of the transaction leads to
possible hypothetical bias – differences between the amount people claim to be willing to
pay in a constructed scenario and the amounts people actually pay for the good. Efforts
have been made by researchers to deal with this problem, e.g. Learning Design proposed
by Bjornstad et al. (1997) or cheap talk (Cummings and Taylor, 1999).
The validity of the method has also been tested on the sensitivity of scope (Pouta, 2005).
This refers to the fact that economic theory predicts that if individuals are willing to pay a
certain amount for a good they desire, then they should be willing to pay more if the
quantity of the good offered is increased (as long as the individual does not reach the point
of satiation). Empirical evidence has shown in some cases insensitivity and in others
sensitivity to scope (Pouta et al., 2005). Carson et al. (2001) consider that the main
explanation for CV estimates not to vary systematically with the different characteristics of
the good is the poor design and administration of the survey. They argue that the CV
studies that demonstrate insensitivity to scope were not designed according to the
guidelines of the state of the art surveys. Related to this problem are the possible
difficulties respondents might have on understanding very small risks changes. Corso et
al., (2000) try to overcome this limitation, once again, by changing the design of the survey
adding visual aids. Furthermore, WTP estimates vary depending on the elicitation formats
used in the surveys. However Carson et al., (2001) defend that these differences are not as
significant as theoretical models predict.
Notwithstanding its limitations the CV method has been considered by government
agencies an acceptable procedure in the context of environmental economics (Mitchell and
Carson, 1988). Many of the problems encountered with CV studies “can be resolved by
careful study design and implementation” (Carson et al., 2001:173) and the NOAA panel
(Arrow et al., 1993) has endorsed this method considering it capable of providing reliable
estimates.
2.3. The Contingent Valuation Method in the crime context
In order to directly elicit the WTP of high education students to reduce the risks of being
victims of violent crime we resort to the CV method. We followed Atkinson et al. (2005)
in applying this methodology to the criminal context. As this approach involves the direct
elicitation of values using a questionnaire, the design of the survey and its wording are of
utmost importance (Mitchell and Carson, 1988). Our survey started with socio-economic

23
questions that make it possible to characterize students according to their age, gender and
family income. The monthly family income categories mentioned in the survey were
calculated using the minimum wage as the range amount. It was also included a question
where respondents were asked to state the field of study enabling us to confirm how WTP
varies across respondents with different characteristics. Respondents were also faced with
queries related to their personal experience in crime context. Following Atkinson et al.
(2005), respondents were asked if they had ever been victims of a crime (violent or
otherwise), the period in which the crime had occurred and the seriousness of the physical
and psychological consequences of the crime. Having been victims of a crime might be a
relevant variable affecting WTP as one might assume that WTP to avoid being victim of a
violent crime is higher for individuals who previously have been victims of a crime when
compared to the WTP stated by non-victims. We might also assume that victims of crimes
that resulted in more serious injuries would be willing to pay more than individuals that
suffered minor or no injuries as a consequence of a preceding crime (Atkinson et al.,
2005). Respondents were requested to assess separately the physical and psychological
seriousness of the injuries. The level of seriousness was classified in 5 categories ranging
“no damages” to “very serious damages”. Following Atkinson et al., (2005) we included
questions to infer the individual’s perception of safety, i.e., fear of crime and avertive
behaviour (whether individuals lock the door of their home). Respondents were then asked
to elicit their WTP to reduce the risk of being victims of violent crime:
Considering the existence of 2,28 violent crimes per 1000 habitants, how much would you be
willing to pay to reduce in 10% the probability of being the victim of a violent crime in the next 12
months (regardless of the payment vehicle)?
Information on the baseline risk and the amount of risk reduction was provided to
respondents. Available literature regards the inclusion of the baseline risk and the level of
risk reduction as crucial because individuals need a reference point and different levels of
risk reductions imply different amounts of WTP (Norinder et al., 2001). The figure of 2.28
violent crimes per 1000 habitants is an approximation of the actual risks of being a victim
of a violent crime in Portugal.11 Information on the timing of the risk change was also
supplied because it can be of significant importance. Given individual time preferences,
goods provided today have a different value than goods provided in the future (Bateman et
al., 2002). In our survey, it was considered that the risk reduction would take place in the
11 Own calculation using data from Eurostat.

24
following 12 months. Following Atkinson et al. (2005) we also chose the payment card as
the elicitation format providing respondents with a range of values from which to choose
the amount they would be willing to pay to reduce the risks of being victims of a violent
crime. However other techniques may be used in a CV survey to elicit the amount
individuals are willing to pay. Table 9 presents the main elicitation techniques, its
advantages and disadvantages. Different variants of these main techniques have also been
proposed (Bateman et al., 2002).
The open ended format has been increasingly abandoned by researchers (Bateman et al.
2002). In contrast the closed ended format (or referendum) has been endorsed by the
NOAA panel that considered it the technique of elicitation of choice (Arrow et al., 1993).
Other elicitation techniques are possible, for instance the bidding game and the payment
card. Considering the limitations and the advantages of each technique, Bateman et al.
(2002) suggested the use of closed ended formats or payment cards. Following Atkinson et
al., (2005) we used the payment card method to find WTP for risk reductions.
It should be noted, that following Cohen et al. (2004), our survey did not include a
complete description of the scenario - it did not include the institution responsible for the
risk change, the means used to achieve that alteration nor the method of payment (payment
vehicle). The decision to omit the information on the payment vehicle or the policy used to
reduce the risk of victimization is explained by the fact that this study aims at estimating
the willingness to pay of higher education students to reduce the probability of being
victims of a violent crime and not to evaluate a specific policy of crime control. However
we must bear in mind that the payment vehicle is considered a relevant item of the CV
method affecting the answers respondents offer (Morrison et al., 2000). Even though it was
not our goal to evaluate a specific payment vehicle or instrument used to reduce
victimization risks we decided to add a question specifying a payment vehicle (the increase
in taxes) and a description of a policy instrument (increase in policing) to understand if
these elements affect WTP. Considering we were interested in testing if there was a change
in WTP, respondents were only asked to state if they would be willing to pay more, less or
the same amount compared to the situation where no payment vehicle or instrument was
provided.

25
Ta
ble
9:
Ad
va
nta
ges
an
d d
isa
dv
an
tag
es o
f C
V m
eth
od
´s e
lici
tati
on
tec
hn
iqu
es
Eli
cita
tion
tech
niq
ue
Des
crip
tio
n
Ad
va
nta
ges
D
isad
va
nta
ges
Open
ended
In
dividuals are as
ked
their max
imum W
TP
without being given
any sugges
tion as to a
value
- No anch
oring bias – as no value is
given
to the resp
onden
t sh
e is not
“anch
ored” to any amount
- Very info
rmative as
to w
hat the
max
imum amount is
- Lea
ds to
man
y non-res
ponse
s, zero answ
ers or
unreliab
le amounts – it is difficu
lt for resp
onden
ts
to fin
d an amount without an
y guid
ance
particu
larly w
hen
they
are not familiar with the
good in ques
tion
- In
dividuals are use
d to thinkin
g in terms of price
s of goods an
d not in m
axim
um amounts
Bid
ding gam
e In
dividuals are su
gges
ted higher amounts of
WTP conse
cutively (as
in an auctio
n) until
the max
imum W
TP is fo
und.
- Helps resp
onden
ts think about their
preference
s th
rough this pro
cess
- Anch
oring bias: res
ponse
s are affected
by the
starting values
prese
nted and the bid
s use
d.
- Yea
-say
ing: resp
onden
ts are lea
d to acc
ept pay
ing
the am
ounts included
in the bid to avoid
the so
cial
embarrass
men
t of sa
yin
g no.
Pay
men
t ca
rd
Prese
nts res
ponden
ts w
ith a ran
ge of values
in
a card to choose
the max
imum W
TP
from. It m
ay also indicate th
e ex
pen
ditures
of a represe
ntative house
hold
to help
resp
onden
ts w
ith their an
swer.
- Avoid
s an
choring bias
- Avoid
s yea
-say
ing
- Avoid
s starting bias
- Ran
ge Bias - Vuln
erab
le to the ranges
of am
ounts
use
d
Sin
gle bounded
dichotomous ch
oice – the
resp
onden
t is ask
ed if sh
e is w
illing to pay
a
spec
ified amount of money
(the am
ounts
usu
ally var
y across res
ponden
ts)
- Eas
ier fo
r resp
onden
ts to answ
er as
they
are alrea
dy giv
en a spec
ific
amount
- Lowers th
e non res
ponse
rates
- Avoid
s outliers
- The am
ounts of W
TP are higher than
the ones
fo
und w
ith oth
er elicitation form
ats
- Nay
say
ing (pro
testin
g)
- Les
s in
form
atio
n pro
vid
ed by the resp
onden
t
Clo
sed ended
form
at
Double bounded
dichoto
mous ch
oice – after
the first ques
tion res
ponden
ts are given
a
follow up ques
tion w
here th
ey are
req
ues
ted
to answ
er if th
ey w
ould
be willing to pay
an
oth
er amount. T
his sec
ond price
is higher
if res
ponden
ts answ
ered
“yes
” to
the first
ques
tion, an
d lower if th
e an
swer to the first
ques
tion w
as “no”
- M
ore info
rmatio
n available fro
m
the resp
onden
t
- In
consisten
t resp
onse
s
- Anch
oring bias
- Yea
say
ing
Source: own form
ulation fro
m info
rmation fro
m H
anley and S
pas
h (1993), B
atem
an et al. (2
002), and W
hynes
et al. (2
004).

26
The method used for the administration of the survey is also key in preventing errors
(Mitchell and Carson, 1988). Surveys may be administered through a variety of
instruments. The main survey modes are mail surveys, telephone interviews and face to
face interviews (Bateman et al., 2002). However, variations of these instruments were used
by combining different modes in an attempt to benefit from the advantages and overcome
the difficulties of each instrument when used separately – e.g. combined mail-telephone
surveys (Bateman et al., 2002).12 Table 10 summarizes the main advantages and
disadvantages of three basic instruments and includes one more that has emerged with the
use of the internet: web based stated preferences surveys (Marta-Pedroso et al., 2007).
The survey used in our study was disseminated by e-mail that included in the message
body a link to the web based survey. The primary reason for the choice of this method was
the fact that respondents are students from the University of Porto. These students have
free access to internet on campus and are also given an e-mail account at the time of the
enrollment.13 The technology is thus available without costs to all respondents. Secondly,
the fact these respondents were higher education students results in the absence of
problems associated with illiteracy. This was also the reason why no attempt was made to
use visual aids as we assumed that high education students have a level of reasoning that
allows them to understand the scenario and the risk reduction involved. Moreover in web
based surveys like Google Docs Form the data is automatically collected into a spreadsheet
that can be downloaded to an Excel spreadsheet. Errors in data collection and transcription
are thus avoided.
The development of the questionnaire involved a pre-test as recommended by the NOAA
panel (Arrow et al., 1993). The questionnaire was administered to students enrolled in the
Innovation and Entrepreneurship Master (MIETE) from the Engineering School at
University of Porto. The students taking this Master Degree come from different fields of
study and the administration of this survey in the same format as the final survey allowed
us to infer if the group understood the questions and to diagnose possible problems with
the survey. This group did not report any difficulties in answering the questionnaire.
12 Other mixed methods have been purposed as computer assisted interviews (Bateman et al., 2002) 13 The Faculty of Architecture is an exception and students do not have an institutional e-mail account.

27
Ta
ble
10
: A
dv
an
tag
es a
nd
dis
ad
va
nta
ges
of
CV
met
ho
d´s
su
rvey
mo
des
Su
rvey
Mod
e D
escr
ipti
on
A
dv
an
tag
es
Dis
ad
va
nta
ges
Mail Surv
ey
The ques
tionnaires are se
nt by
mail to
the resp
onden
ts that
complete them
and sen
d them
bac
k to the rese
arch
ers
- Low cost
- Permits th
e use
of visual aid
s
- Res
ponden
ts can
answ
er the su
rvey
on their own tim
e
- Eas
y to answ
er sen
sitive ques
tions
- Low res
ponse
rates
- Req
uire the resp
onden
ts to rea
d and understan
d the sc
enario
– the level of literac
y
of th
e resp
onden
t may
be a pro
blem
- Preven
ts the use
of ques
tionnaires where re
sponden
ts should answ
er ques
tions in a
fixed
seq
uen
ce bec
ause
they
can
rea
d the whole ques
tionnaire before startin
g to fill
it in
- Possib
le self-se
lectio
n bias - the peo
ple w
ho answ
er the ques
tionnaires are more
likely the ones
that are m
ore interested
in the topic. This m
ight lead
to
unreprese
ntative sa
mples.
- No control over w
ho fills in the ques
tionnaire (hea
d of th
e house
hold
or an
other
individual?)
Fac
e to
fac
e in
terv
iews
The in
terv
iewer conducts an
in
terv
iew fac
e to
fac
e with the
resp
onden
t
- High res
ponse
rates
- Permits th
e use
of visual aid
s
- Allows th
e in
terv
iewer to explain
complex sce
nario
s an
d assist th
e resp
onden
t if he does
n’t understan
d the
ques
tions
- Allows th
e use
of ques
tionnaires where th
e in
form
atio
n
must be unfo
lded
seq
uen
tially to the resp
onden
t.
- High costs
- Tim
e co
nsu
min
g
- Possib
le interv
iewer bias – the interv
iewer m
ay affec
t th
e resp
onden
t’s an
swer
Telep
hone
interv
iews
The in
terv
iewer telep
hones
a
sample of in
dividuals an
d
interv
iews th
em.
- Les
s ex
pen
sive th
an fac
e to
fac
e in
terv
iews
- In
term
ediate lev
el of re
sponse
rate
- Allow the in
terv
iewer to explain
complex sce
nario
s an
d assist th
e resp
onden
t if he does
n’t understan
d the
ques
tions
- Allow the use
of ques
tionnaires where th
e in
form
atio
n
must be unfo
lded
seq
uen
tially to the resp
onden
t
- Do not allow the use
of visual aid
s
- Do not allow len
gth
y ques
tionnaires - res
ponden
ts m
ay not be willing to answ
er a
ques
tionnaire for more than
just a few
min
utes
- Res
ponden
ts w
ho do not hav
e a telephone will not be represe
nted in the sa
mple
Surv
eys hosted
on a w
eb pag
e
Web
bas
ed
surv
eys
Surv
eys ac
cessed
followin
g an e-
mail mes
sage link or a link hosted
in
anoth
er w
ebsite
-Res
ponden
ts can
answ
er the su
rvey
on their own tim
e
-Eas
y to answ
er sen
sitive ques
tions
-Low costs
-Possib
ility of des
ignin
g an interactive su
rvey
(th
e resp
onden
t only has
acc
ess to
the nex
t ques
tion if he has
su
bmitted the previo
us one - co
ntrols for ques
tion
sequen
cing)
- Answ
ers may
be downlo
aded
direc
tly into
a datab
ase
(e.g. Exce
l sp
read
shee
t)
- Sam
ple rep
rese
ntativen
ess - T
here is no control over w
ho fills in the ques
tionnaire
– T
he sa
me perso
n can
fill it in sev
eral tim
es and peo
ple w
ho are not su
ppose
d to
answ
er m
ay hav
e ac
cess
- Sam
ple selec
tivity
- Difficu
lt to use
visual aid
s
- Req
uire the resp
onden
ts to rea
d and understan
d the sc
enario
– lev
el of literac
y of
the resp
onden
t may
be a pro
blem
- Possib
le self-se
lectio
n bias
Source: O
wn form
ulation fro
m info
rmation available in B
atem
an et al. (2
002), M
itch
ell an
d C
arso
n (1988) an
d M
arta-P
edro
so et al. (2
007)
28
On the 20th of March 2009 an e-mail was sent to the e-mail addresses of students of 3
Faculties of the University (Faculty of Economics, Faculty of Engineering and Faculty of
Food Sciences and Nutrition) inviting students to answer the survey. Another e-mail was
sent this time addressed to the contacts listed at the University’s website14 as being the
contacts of the Units of Communication, Image and Public Relations of the each Faculty
and the university’s business school15. These contacts were asked to forward the e-mail
with the survey link to all students. These e-mails included a link to the survey and
informed respondents of the goal of the questionnaire and the scope of the study. The
limited time necessary to answer the questionnaire (approximately 3 minutes) was also
mentioned as an attempt to increase the response rates. Other information was included
namely the restricted use of the data.
To increase the response rate of some of the Faculties whose responses were inexistent,
telephone contacts were established with their Units of Communication, Image and Public
Relations to understand the reason behind the non-responses. We learnt that in some
schools students do not have the habit of responding to questionnaires (e.g. Faculty of
Medicine where the response rate was 0%) and in other schools, e.g. the Faculty of Dental
Medicine, students are not willing to participate acknowledging being tired of receiving
online questionnaires. One last attempt to boost response rates was made in May 2009 by
sending an e-mail to all the Presidents of the Directive Councils of all Faculties requesting
the dissemination of the questionnaire.
We considered the questionnaire response phase closed on the 7th of July 2009 with a total
number of 1122 responses. Considering that the total number of students of the University
is 29 896,16 the response rate was approximately 4%.
The next chapter details the model specifications and the results of our survey.
14 http://sigarra.up.pt/up/web_base.gera_pagina?P_pagina=122243 – accessed March 2009. 15 We could not send the survey directly to the students as their e-mail addresses were not available. 16 http://sigarra.up.pt/up/web_base.gera_pagina?p_pagina=122350 – accessed September 2009.

29
Chapter 3. Willingness to pay for violent crime reduction: results for Portuguese
Higher Education students
3.1. Initial considerations
The present chapter details the analysis of the results of the estimation of the econometric
regressions used to infer the willingness to pay of higher education students to reduce the
risks of being a victim of a violent crime. We conducted a survey that included questions
that allowed us to characterize our respondents in terms of some demographic indicators
(e.g. age, gender) and fields of study. In Section 3.2 we present the specification of the
model, the description of the variables and the methodology used in the econometric
estimation. The descriptive statistics that resulted from our survey are reported in Section
3.3. The following section (Section 3.4) presents the results of the estimation of the
regressions and, on the basis of those results, we focus on the similarities and differences
found between our results and the ones found in the existing (scarce) literature.
3.2. Model specification and variable description:
Our study aims at estimating the WTP of higher education students to reduce the risks of
being victims of a violent crime. The questions presented in our survey17 included a set of
variables that might influence WTP. Our theoretical model assumes that our dependent
variable, Willingness to Pay (WTP), is a function of a large set of variables as stated by the
existing literature in the field (cf. Chapter 2).
( )
=
vehiclepaymentdoorlockscrimefeardamagesicalpsycho
injuriesphysicalcrimepreviousdatevictimcrimefieldstudy
dependentsfamilyelementsfamilynumberincomefamilygenderage
WTPf
,,,log
,,,,
,,,,,
The description of the variables-proxies and the measurement adjustments undertook on
the original questions in order to get these proxies are detailed in Table 11.
17 See Appendix

30
Table 11: Variables Description
Variable Description
Age
Age – The questionnaire included an open question that required respondents to state their age. The age of the students that answered the survey varied between 17 and 68 years of age. For estimation purposes, respondent’s ages were grouped in 5 intervals: [17,19]; [20,22]; [23,25] ;[26,30] and [31,68].
Gend Gender – This variable refers to the gender of the respondent: male or female.
Inc Income – Represents monthly family income. The questionnaire referred 6 intervals of income, in euros, that were also used in our regressions: [0,450[; [450,900[; [900,1350[; [1350,1800[; [1800,2250[ and more than 2250 .
Fam Number of family elements – In the questionnaire respondents were asked to state how many individuals lived in their household; 1, 2, 3, 4 or more than 4. These were also the figures used in the estimation of our regressions.
Level of study For a better characterization of our sample, respondents were asked to state their level of study: Undergraduate, Postgraduate, Master Programs, PHD/Doctoral Program, Other
Fam Dep
This variable incorporates the answers respondents gave about having individuals that were financially dependent from our respondents. The possible answers were “yes” or “no”. This variable was not included in our estimation as over 90% of the students in the sample do not have family dependents. We thus lack observations for the case where there are family dependents to include in the estimation.
School of enrollment The question regarding the school of enrollment of respondents was included in the questionnaire to have a better understanding of our sample.
Vcrime Victim of crime - This variable represents if the respondent has previously been the victim of a crime.
FieldRed
Field of study (reduced) – Respondents were asked the area of their basic formation as a proxy for individual’s distinct inclinations or psychological traits. A few adjustments were made in this variable. First of all, for the respondents who were aged less than 23 years that stated an area of formation different from the one provided by the faculty of enrollment, we assumed that the area of formation was actually the one available at the faculty of enrollment because the respondent might have interpreted the area of formation as the one he studied in high school. In the case of students that were aged more than 23 years we maintained the area of formation even if it was different from the areas provided by the Faculty of enrollment as the respondent might be enrolled in a second level of study in a different area. Finally, we grouped the responses from three areas and categorized them under “Other”. This category includes the respondents from Arts, Sports and Law. This procedure was necessary to guarantee a minimum number of responses per category. Thus the areas of formation considered in the estimation of the regressions were Exact Sciences, Humanities, Economics and Management Sciences, Engineering, Psychology and Educational Sciences, Health Sciences and Other (Arts, Sports and Law).
Physical injuries
Psychological damages
The severity of the physical injuries and psychological damages suffered in a previous crime could be stated by the respondent using five levels of severity ranging from “no injuries” to “very serious injuries”. For practical purposes we decided to group them in three levels of severity: no injuries, some injuries and serious injuries. As 80% of respondents reported having suffered no damages we created a dummy variable that grouped both physical and psychological consequences of a previous crime: the variable represented the situation of “no injuries” vs “some injuries”.
Fear Fear of crime – This variable illustrates the answers respondents gave when asked if they worried about being victims of a violent crime. Three possible answers were presented: does not worry, worries moderately, worries a lot.
LockDoor Lock the door -Respondents could answer yes or no to usually locking the door of their home
PV Payment vehicle and policy – Respondents could state to pay more, the same or less when confronted with the possibility of risk reduction being achieved by increasing policing financed by higher taxes.

31
We estimate three set of models, two [(1) and (2)] by OLS, and one [(3)] resorting to a
logistic estimation. The models (1) and (2) differ as the latter includes age and income as
continuous variables instead of categorical as in the case of model (1).
iiii
iiiiiii
ePVLOCKDOORFEAR
VCRIMEAREAREDFAMINCGENDAGEWTP
++++
++++++=
987
654321ln
βββ
ββββββα
(1)
iiii
iiiiiii
ePVLOCKDOORFEAR
VCRIMEAREAREDFAMINCGENDAGEWTP
++++
++++++=
987
654321 lnlnln
βββ
ββββββα
(2)
In order to infer if results were robust, we resort to a different method of estimation - the
logit model (3). Using as the dependent variable Y=WTP_dummy= 1 in the case WTP
assumes a positive value and 0 in the case Y=WTP=0€, that is, a discrete variable, the
method to be used falls under the general probabilistic models as it is not reasonable to
assume, for instance, that the error distribution will be regular. Moreover, the predicted
values cannot be interpreted as probabilities as they are not restricted to the interval
between 0 and 1.
( ) ( ) [ ]parameterseffectsrelevantFjYoboccursjeventob :PrPr ===
Where 1=Y in the case WTP > 0€ and 0=Y if WTP=0€
In our model the set of variables that explain the amount that higher education students are
willing to pay to reduce the risk of being victimized by a violent crime are included in
vector X where:
( ) ( )β,1Pr Χ== FYob
( ) ( )β,10Pr Χ−== FYob
The parameters represented as β reflect the impact of the changes of the independent
variables on the probability of the respondent expressing an amount of willingness to pay
higher than zero.
For a certain vector of regressors it is expected that:
( ) 11Prlim ===∞→′
YobX β
( ) 00Prlim ===−∞→′
YobX β
The logistic distribution is given by:

32
( ) ( )ββ
β
Xe
eYob
X
X
′Λ=+
== ′
′
11Pr .
The probability model is a regression:
[ ] ( )[ ] ( )[ ] ( ).110 βββ xFxFxFxYE ′=′+′−=
Whatever distribution is used the parameters of the model are not necessarily the usual
marginal effects. For the logistic distribution, ( )( ) ( )
( ) ( )[ ]XXe
e
Xd
Xd
X
X
ββββ
β
β
′Λ−′Λ=+
=′′Λ
′
′
11
2
In the logit model: [ ] ( ) ( )[ ]βββ XXX
XYE′Λ−′Λ=
∂
∂1
The parameters for the logistic regression are estimated using the maximum likelihood
method (ML). Given the assumptions about the error distribution, the coefficients that
make the observed results more probable are selected.
3.3. Some descriptive results
A descriptive analysis of our data indicates that most of our respondents were aged 20 to
22 and were female (52.9%). As 52%18 of Porto University students are female there is no
overrepresentation of the female students in our respondents. The majority of our
respondents has the highest level of income mentioned in the questionnaire (over
2250€/month) and is integrated in a family of four elements (cf. Table 12). They were
mostly undergraduate students (50.3%), with no family dependents (92.9%), studying
Engineering (35.8%), Economics and Management (22.5%) or Health Sciences (17.3%).
18 http://sigarra.up.pt/up/web_base.gera_pagina?p_pagina=122350 (accessed in 06 – 09- 2009)

33
Table 12: Descriptive statistics
Variable Frequency (%)
[17,19] 16.8
[20,22] 42.1
[23,25] 20.7
[26,30] 11.1
Age (N=1122)
[31,68] 9.4
Male 47.1 Gender (N=1122)
Female 52.9
[0;450[ 4.0
[450;900[ 13.8
[900;1350[ 21.7
[1350;1800[ 15.2
[1800;2250[ 14.9
Income, in € (N=1122)
More than 2250 30.4
1 7.7
2 11.4
3 29.2
4 37.6
Nº Family elements (N=1122)
More than 4 14.1
No 92.9 Family Dependents (N=1122)
Yes 7.1
Undergraduate 50.3
Integrated Masters 18.0
Postgraduate 0.6
Master Programmes 23.7
PHD/Doctoral programme 6.9
Level of Study (N=1122)
Other 0.5
Exact Sciences 4.7
Humanities 11.1
Economics and management sciences 22.5
Engineering 35.8
Psychology and Educational Sciences 6.0
Health Sciences 17.3
Field of study (N=1122)
Other (Arts, Sport, Law) 2.7

34
(…)
Faculty of Fine Arts 1.2
Faculty of Sciences 1.6
Faculty of Nutrition and Food Science 8.0
Faculty of Law 0.7
Faculty of Economics 23.1
Faculty of Engineering 38.4
Faculty of Pharmacy 5.6
Faculty of Psychology and Education Science 6.6
Institute of Biomedical Sciences Abel Salazar 4.2
School of enrollment (N=1122)
Faculty of Arts 10.5
No 67.0 Victim of a previous crime (N=1122)
Yes 33.0
Less than 1 year 20.2
Between 1 to 5 years 40.7 Date of previous crime (N=376)
Over 5 years 39.1
No injuries 78.9
Some injuries 13.1 Severity of physical injuries related to the crime (N=374)
Serious injuries 8.0
No damages 78.9
Some damages 19.5 Severity of psychological damages related to the crime (N=374)
Serious damages 1.6
Does not worry 9.6
Worries moderately 52.8 Worries about being the victim of a crime (N=1122)
Worries a lot 37.6
No 16.6 Locks the door of the residence (N=1122)
Yes 83.4
0 25.5
[0;50[ 42.1
[50;250[ 20.8
[250;750[ 5.5
[750;1250[ 1.9
[1250;1750[ 0.7
[1750;2250[ 0.8
[2250;2750[ 0.2
Willingness to pay, in € (N=1122)
More than 2750 2.6
More 13.4
The same 58.6
Less 26.6
Willingness to pay if there is an increase in policing financed by an increase in taxes – payment vehicle and policy (N=1122)
No answer 1.5
Source: Author calculation based on direct survey, March – July 2009

35
The Faculty of Engineering and the Faculty of Economics have the highest number of
respondents followed by the Faculty of Arts and the Faculty of Nutrition and Food
Science. Our respondent sample is overrepresented (compare columns 3 and 5 of Table 13)
in the following courses: Engineering, Economics, and Nutrition. It under represents
Architecture, Sports, Medicine, and Dental Medicine, courses where we fail to obtain valid
answers.
Table 13: Percentage of responses per total number of Faculty students at the University of Porto (UP)
Faculty
Nº of
students
enrolled at
the UP [1]
% students
enrolled at the
UP by faculty
[1]/29896
Nº of
responses
by faculty
[2]
% of
responses
by faculty
[2]/1122
Response rate per
faculty [2]/[1]
Faculty of Architecture
1000 3.3% 0 0.0% 0.0%
Faculty of Fine Arts 800 2.7% 14 1.2% 1.8%
Faculty of Sciences 3648 12.2% 18 1.6% 0.5%
Faculty of Nutrition and Food Science
449 1.5% 90 8.0% 20.0%
Faculty of Sport 1494 5.0% 0 0.0% 0.0%
Faculty of Law 998 3.3% 8 0.7% 0.8%
Faculty of Economics 2859 9.6% 259 23.1% 9.1%
Faculty of Engineering
6922 23.2% 431 38.4% 6.2%
Faculty of Pharmacy 1306 4.4% 63 5.6% 4.8%
Faculty of Medicine 2357 7.9% 0 0.0% 0.0%
Faculty of Dental Medicine
506 1.7% 0 0.0% 0.0%
Faculty of Psychology and Education Science
1579 5.3% 74 6.6% 4.7%
Institute of Biomedical Sciences Abel Salazar
2257 7.6% 42 3.7% 2.1%
Faculty of Arts 3721 12.5% 118 10.5% 3.2%
Total 29896 100% 1122 100.0% 3.8%
Source: Own formulation using data from the report “Ensino_Estudantes Inscritos na U. Porto 2008” (31st December 2008)
Regarding the crime related responses, 33% of our respondents have been crime victims in
the past and most of these crimes occurred over a year ago. The crimes resulted mostly in
neither physical nor psychological injuries. The majority of our respondents worry
moderately about being victims of a crime (52.8%) and 37.6% worry a lot. This result is
consistent with the fact that almost 84% of our respondents usually lock the door of their
residences when they leave. When asked how much money they were willing to pay to
reduce the probability of being victims of a violent crime by 10%, 42.1% of our
respondents were willing to pay a positive sum but less than 50€ and 20.8% were willing
to pay between 50€ and 250€. It is also worth mentioning that 25.5% of respondents are

36
not willing to pay any money at all. We can speculate several reasons to have obtained
such high number of protesters: respondents might object to the scenario considering it
unrealistic or they could have considered that a reduction in 10% in violent crime rates is
negligible when the violent crime rate is so low in Portugal. The high percentage of
protesters is a problem that has been previously reported in the literature - Atkinson et al.
(2005) have encountered more than 30% of protesters in their study and future research
should focus more in explaining this phenomena.
Using the Kruskall – Wallis19 test to assess if there is evidence of statistically significant
differences in the mean of WTP between the different categories of the relevant variables
(cf. Table 13), we conclude that there are statistically significant differences in mean WTP
for the categories in all variables except for ‘students’ degree’, ‘having been victim of a
crime in the past’, ‘the date of the previous crime’, and ‘the injuries caused by that crime’.
This means, for instance, that although at a first glance data suggest that different
categories of students degrees imply different amounts of willingness to pay, on average
this difference is not statistically significant. The age variable, although being statistically
significant, shows a non-linear relationship with the mean WTP. The respondents aged 23
to 25 years old are willing to pay the highest amount on average and the eldest respondents
are the ones willing to pay the smallest amount. Female respondents have, on average,
more propensity to pay than male respondents. Additionally, students with the highest
family income category (over 2250€) are willing to pay, on average, the highest amount.
Once again, however, the relationship between the two variables is not linear as we cannot
sate that the higher (smaller) the family income, the higher (smaller) the median WTP.
The respondents that have family dependents are surprisingly willing to pay less on
average than the ones that have no family dependents. Indeed, we would expect an
opposite result as we speculate that individuals with family dependents would be more
worried about the financial burden they would impose on their relatives, not only because
of incurring in more costs associated with crime victimization but also because there could
be a decrease of family revenues due to possible days lost at work.
Respondents that study Psychology and Educational Sciences are the ones willing to pay
the highest amount on average, followed by Economics and Management. Respondents
that study in the fields of Arts, Sport or Law present the lowest mean of WTP.
19 The Kruskall Wallis tests the null hypothesis of the median of the populations being equal (Sheskin, 2007).

37
Ta
ble
14
: D
iffe
ren
ces
in t
he
mea
n o
f W
TP
fo
r th
e d
iffe
ren
t ca
teg
ori
es (
in e
uro
s)
Vari
ab
les
Vari
ab
les’
cate
gori
es
Qu
i2
p-v
alu
e a
nd
level
of
sig
nif
ican
ce
Ag
e [1
7;19]=
190.69
[20;22]=
161.76
[23;25]=
251.08
[26;30]=
251.01
[31;68]=
112.50
8.920
0.063*
Gen
der
Fem
ale=
246.71
Male=
127.03
18.624
0.000***
Inco
me
[0;450[=
210.00
[450;900[=
169.52
[900;1350[=
178.19
[1350;1800[=
87.43
[1800;2250[=
232.93
[2250;+
∞[=
236.44
10.362
0.066*
Fa
mil
y
elem
en
ts
1=159.01
2=149.41
3=189.63
4=225.83
More than
4 =
146.84
8.700
0.069*
Fa
mil
y
dep
en
den
ts
Yes
=63.13
No=200.05
8.786
0.003***
Deg
ree
Undergraduate=
199.47
Integrated
Mas
ters=170.79
Postgraduate=
35.71
Mas
ter
Pro
grams=
180.83
PhD/D
octoral
pro
gram=156.82
Oth
er=1012.50
5.734
0.333
Fie
ld o
f st
ud
y
Exac
t Scien
ces =
162.26
Human
ities=
160.08
Eco
nomics an
d
Man
agem
ent
Scien
ces=
228.37
Enginee
ring=172.51
Psy
chology and
Educa
tional
Scien
ces=
275.00
Hea
lth
science
s=189.95
Oth
er (Arts.
Sport.
Law
)=95.83
25.729
0.000***
Cri
me
vic
tim
Yes
=165.20
No=202.63
2.573
0.109
Cri
me
tim
e Les
s th
an a
yea
r=116.77
[1 yea
r;5
yea
rs]=
148.20
Over 5 yea
rs
ago=202.89
1.461
0.482
Ph
ysi
cal
da
mag
es
No dam
age = 164.24
Some
dam
age=
165.82
Serious
dam
age=
154.17
0.090
0.956
Psy
cholo
gic
al
da
mag
es
No dam
age = 164.24
Some
dam
age=
164.38
Serious
dam
age=
125.00
1.060
0.588
Lock
Doo
r Yes
=199.95
No=141.67
6.723
0.010***
Pay
men
t
veh
icle
an
d
Poli
cy
Les
s=310.00
The sa
me=
153.35
More=217.53
30.724
0.000***
Fea
r No fea
r=47.45
Some fear=128.46
Lots of fear=313.60
58.541
0.000***
Legend:
***(*
*)[
*]statistically significan
t at 1%
(5%
)[10%
] level

38
In our sample, respondents that usually lock the door of their residence are willing to
pay, on average, a higher amount. Those who state not to worry about being victims of a
violent crime, tend on average to report a lower WTP. These results are in line with
what is expected as people who lock the doors of their residence reveal an avertive
behaviour towards crime that is consistent with higher fear of crime.
Statistically significant is also the difference in the mean of WTP elicited for the
question regarding the payment vehicle and policy used to reduce crime. The
respondents who stated they would be willing to pay less than the amount they
previously claimed if the mechanism used to reduce the risk of violent crime
victimization was an increase in policing financed by rising taxes are the ones that
present, on average, the highest WTP. In contrast, the ones that claim they would pay
the same amount with the new description of policy present the lowest WTP.
An analysis of the correlation matrix of the variables presented in Table 15 reflects a
positive and significant correlation between the variable income and the number of
family elements in the household, without controlling for the other variables. Thus
households with the highest income are associated with the higher number of family
members and the families with the higher number of elements are related to the highest
income households. Therefore, the variable number of family elements was not
considered in the estimation of our regressions as it would lead to multicollinearity. A
significant and positive correlation was also found between the variable that represented
having been the victim of a previous crime and the time when the crime occurred.
Again, a strong correlation was found between the variables having been the victim of a
previous crime and the severity of the injuries suffered. Thus the variable that
represented the time when the crime occurred and the severity of the injuries were not
considered in our estimation.

39
Ta
ble
15
: C
orr
ela
tio
n m
atr
ix
Vari
ab
les
lnW
TP
Ag
e G
end
er
Inco
me
Fa
mil
y
elem
en
ts
Fie
ld
red
uced
C
rim
e
vic
tim
F
ear
of
crim
e L
ock
Door
Pay
men
t
veh
icle
Vic
tim
past
5
yea
rs
Du
mm
y _
inju
ries
lnW
TP
1
-0.069**
0.146***
0.043
0.025
0.051*
-0.050*
0.244***
0.082***
-0.045
-0.065**
-0.007
Ag
e
1
-0.078***
0.056*
-0.287***
-0.135***
0.018
-0.001
0.018
0.006
-0.061**
0.025
Gen
der
1
-0.144***
-0.006
0.080***
-0.243**
0.149***
0.053*
-0.113***
-0.166***
-0.079***
Inco
me
1
0.316***
0.065**
0.078***
-0.66**
-0.008
0.025
0.035
-0.053*
Fa
mil
y e
lem
en
ts
1
0.144***
0.003
-0.006
-0.076**
-0.18
0.026
-0.002
Fie
ld r
ed
uce
d
1
-0.028
0.016
0.012
-0.031
0.009
-0.003
Cri
me
vic
tim
1
-0.052*
-0.001
0.031
0.689***
0.387***
Fea
r of
crim
e
1
0.151***
0.043
-0.058*
0.049
Lock
Doo
r
1
0.049
-0.016
0.026
Pay
men
t veh
icle
an
d
poli
cy
1
-0.004
-0.007
Vic
tim
past
5 y
ears
1
0.299***
Du
mm
y_
inju
ries
1
Legend:
***(*
*)[
*]statistically significan
t at 1%
(5%
) [1
0%
]lev
el

40
3.4. Determinants of higher education students’ willingness to pay for violent crime
reduction: results from the estimation of the econometric models
The three models estimated present a reasonable quality of adjustment (goodness of fit).
The OLS estimated model albeit presenting a low adjusted R2 figure (which is normal in
micro data sets), reveals a global significant model as reflected by the F-statistics.
Regarding the logit model, the Hosmer and Lemeshow test indicates that we can accept the
null hypothesis that the estimated model represents the reality well. Moreover, more than
75% of the estimated values of the dependent variable are correctly predicted by the
model.
Taking the three models as a whole we are able to observe that estimates are quite robust,
evidencing similar signs and significance levels regardless the estimation method.
Demographic variables – age and gender – are key determinants of the willingness to pay
for violent crime among Portuguese higher education students. On average, all the other
determinants being held constant, senior students present a lower WTP, whereas female
students are more prone to pay for avoiding being victim of a violent crime than their male
counterparts. The first result is in line with the findings of existing literature. Cohen et al.
(2004) also found that WTP decreases with age thus in this regard Portuguese higher
education students are not different from the general individuals living in more developed
and highly crime incidence countries. This does not seem to be the case for the impact of
gender on WTP as this is not statistically significant factor in the available literature on
crime costs. However our results are in accordance with psychological literature that
suggests that traditional female gender roles are associated with avoidance (Rubinstein,
2005).
Results concerning the relationship between income level and WTP are mixed – only in
model II, we might conclude that students with higher income levels tend, on average, and
other things remaining constant, to pay more to avoid being victim of a violent crime. The
existing evidence in literature concerning such relationship indeed suggests that higher
incomes influence positively WTP (Atkinson et al., 2005; Ludwig and Cook, 1999). Cohen
et al. (2004) further reinforces this evidence claiming that the ability to pay plays a role in
explaining the amount in WTP as low income individuals, despite having higher
victimization rates, are willing to pay less.

41
Table 16: results of model estimation
OLS – Ordinary Least Squares Maximum
Likelihood Variables Categories
Model 1 Model 2 Model 3
[20,22] -0,055
[23,25] 0,014
[26,30] 0,021
AGE – default: [17;19]
[31,68] -0,127*
AGE (ln) -0,143* -0,811**
GEND - default: Male Female 0,114*** 0,110*** 0,520***
[0;450[ -0,082
[450;900[ -0,074
[1350;1800[ -0,080
[1800;2250[ 0,028
INC – default: [900;1350[
[2250;+∞[ 0,066
INC (Ln) 0,099*** 0,236
1 0,025 0,067 0,745**
2 -0,057 -0,058 -0,040
4 0,015 0,006 0,131 FAM – default :3
More than 4 -0,061 -0.058 0,013
Exact Sciences -0,105 -0,090 -0,510
Humanities -0,062 -0,066 -0,516*
Economics and Management Sciences
0,096** 0,082* 0,202
Engineering -0,057 -0,056 -0,475**
Psychology and Educational Sciences
0,026 0,027 -0,556
FIELDRED – default: Health Sciences
Other (Arts, Sport, Law) -0,167* -0,195** -1,106**
VCRIME – default: No Yes -0,007 -0,006 -0,036
Some fear 0,230*** 0,223*** 1,099*** FEAR – Default: no fear
Lots of fear 0,400*** 0,393*** 1,454***
LOCKDOOR (default: No)
Yes 0,065 0,068* 0,386**
Less 0,242*** 0,248*** 1,290*** PVP (default: the same)
More 0,100*** 0,104*** 0,543***
Constant 0,325 0,616 1,595
N 1122 1122 1122
WTP>0€ - - 836
WTP=0 - - 286
Goodness of fit
Adjusted R2 0.120 0.120 -
F-statistics (significance)
6.863 (0.000) 8.686 (0.000) -
Hosmer-Lemeshow Test (significance)
- - 6.388 (0.604)
% corrected - - 75.8
Legend: ***(**)[*]statistically significant at 1% (5%)[10%] level

42
The relationship between the number of family elements in the household and WTP is also
mixed showing a positive and statistically significant association only in the model
estimated using the maximum likelihood method. The positive impact of household size on
WTP is also reported by Ludwig and Cook (1999) and might be explained for altruistic
reasons as individuals in families with several elements would be willing to pay more than
individuals who live alone. This altruistic factor might also explain Ludwig and Cook’s
(1999) findings that WTP is strongly associated with the number of children in the
household.
In comparison to Health sciences students, and considering that all other variables remain
constant, only students in the field of Economics and Management are willing to pay more.
Another statistically significant result is that students from the field of Arts, Sport and Law
are willing to pay less than Health sciences students, other things being equal. This result is
achieved regardless of the estimation procedure that is used. Literature does not account
for the impact of the field of study as a determinant of WTP but our results suggest that
this variable has an important role in the elicitation of WTP. Researchers have found
evidence of an existing relationship between people’s personalities and their interests areas
(Tokar et al., 1998). Several authors have found an association between the field of study
of university students and personality traits (Rubinstein, 2005; Silver and Malone, 1993;
Kline and Lapham, 1992). Silver and Malone (1993), for instance, found that engineers
tend to be mostly obsessive,20 accountants are predominantly paranoid,20 and students of
medicine are particularly narcissistic.20 Psychological literature uses the field of study as a
proxy for personality characteristics of individuals. By estimating that distinct fields of
study are associated with different amounts of WTP, we suggest that different personality
characteristics might have a determinant role in the elicitation of WTP to reduce violent
crime victimization.
After controlling for all other variables likely to impact on the WTP, worrying in a higher
extent about being a possible victim of a violent crime is associated to a higher WTP, on
average, which corroborates the findings in literature (Atkinson et al., 2005).
20 Silver and Malone (1993) focus on different personality styles. Among them are the obsessive, the paranoid and the narcissistic style. Individuals with an obsessive style usually look for perfection and are never completely satisfied with what they accomplish. They have a rigid mode of thinking, pay great attention to technical details and have a need to control everything around them. Paranoid individuals are good observers characterized by an acute form of attentiveness and a constant sense of anticipation. They have a particular advantage in highly competitive settings like corporations. Narcissistic personality is characterized by a high sense of self, a need for attention and acceptance.

43
Another pertinent aspect to take into account is that having an avertive behaviour towards
crime, reflected in locking the door of the residence, is positively associated with the WTP.
This evidence is not in line with the estimates presented by Atkinson et al. (2005) that
suggest that people who do not lock the door of their residence are actually willing to pay
more. The authors speculate that people whose behaviour puts them more at risk are
willing to pay more for a policy that reduces their probability of victimization. Our
estimates, on the contrary, might be explained by the fact that people that lock the doors of
their residence might be more concerned about the crime issue and thus willing to pay
more.
Payment vehicle and policy emerge as a strongly significant variable in explaining
Portuguese higher education students’ WTP. However, results are not clear cut, both
groups of students that would pay less and more (relative to those that would pay the same)
in the case the payment was made through higher taxes to increase policing reveal higher
willingness to pay for avoiding being victims of a violent crime. We suggest that students
with a strong opinion on policies and payment vehicles that might be used to reduce crime
risks are willing to pay more than students who are neutral to these variables. CV literature
emphasizes that the payment vehicle and policy are considered relevant variables that
should be included in the surveys given their impact on individual’s responses (cf. Section
2.3). In crime costs literature, Ludwig and Cook (1999) do not address this issue directly in
the survey by changing the payment vehicle or the policy and requesting the elicitation of
the amounts of WTP. However, they used as a proxy of respondents that did not agree with
the payment vehicle the answers of individuals that stated “that taxes are too high”. By
removing these responses from the sample the estimates of WTP were 13% higher
(Ludwig and Cook, 1999).
Regarding the policy used to reduce risks of being victimized, Atkinson et al. (2005)
estimate that the belief in the effectiveness of policing has a positive impact on WTP. We
provide further evidence in the support of the hypothesis that this/these variable(s) is (are)
an important determinant in explaining WTP for crime risk reduction.
Table 17 summarizes the main results obtained by comparison with the scarce studies
available in the literature in the field.

44
Ta
ble
17
: C
om
pa
riso
n o
f th
e p
rese
nt
stu
dy
wit
h s
om
e ex
isti
ng
av
ail
ab
le s
tud
ies
in t
he
lite
ratu
re
Pri
or
stu
die
s
Lu
dw
ig a
nd
Co
ok
(1
99
9)
Coh
en e
t al.
(2
00
4)
Atk
inso
n e
t al.
(2
005
) C
urr
ent
stu
dy
Ris
k r
ed
uct
ion
Gun vio
lence
(in
juries
) by 30%
Sev
eral crimes
by 10%
(burg
lary
, se
rious as
sault, armed
robbery, rape
or se
xual assau
lt, murd
er)
Violent crim
e by 50%
(ca
tegorize
d in
three differe
nt types
of offen
ces –
common assau
lt, oth
er w
ounding,
serious woundin
g)
Violent crim
e by 10%
Poli
cy
Pro
gramme to
red
uce
gun thefts and
illegal gun dea
lers
n.c.
Raise
in policing
n.c.
Pay
men
t veh
icle
Tax
Increa
se
n.c.
Rise in
loca
l ch
arges
n.c.
Vari
ab
les
Age
n.c.
- 0
-
Gen
der (defau
lt: male)
n.c.
0
0
+
Inco
me
+
+
+
0/+
Fam
ily elemen
ts
+
n.c.
n.c.
0/+
Field
of studies
n.c.
n.c.
n.c.
Significan
t
Victim of a previo
us crim
e n.c.
n.c.
0
0
Fea
r of crim
e n.c.
n.c.
+
+
Lock
Door
n.c.
n.c.
- +
Pay
men
t veh
icle and policy
+
n.c.
+
+
Sev
erity of in
juries
/crime type
n.c.
+
+
n.c.
Source: O
wn form
ulation
Leg
end: 0 – not statistica
lly significan
t; n.c - not co
nsidered

45
Conclusion
In a society of scarce resources that can be allocated to different uses, the need to find
instruments to analyze the costs and benefits of different policies will help policy makers
make more informed decisions (Cohen, 2000). Crime policy is no exception and estimating
the costs of crime is part of the benefit-cost analysis. Tangible costs have been calculated
but not including estimates of pain, suffering or changes in life style – that are particularly
important in violent crime - has resulted in biased estimates of the total costs of crime
(Czabanski, 2008). Several methodologies have been used to incorporate the intangible
costs of crime (cf. Chapter 1) and the Contingent Valuation method offers a “fresh
perspective” (Czabanski, 2008: 122) to this problem. Our study applied the contingent
valuation method to estimate the amount high education students are willing to pay to
avoid being victims of a violent crime.
The present study contributes with two main elements to the existing literature. Firstly it is,
to our best knowledge, the first study conducted in a relatively low crime country. Our
research indicates that even though crime rates are lower in Portugal, the main elements
that have an impact on WTP in countries like the U.K. or the U.S. – with high crime rates
- are the same Portuguese university students present (cf. Table 17). They have in common
the positive influence of characteristics such as higher income, the number of family
elements and fear of crime on willingness to pay to reduce the risk of violent crime. The
negative impact of age is also common to both types of countries. The payment vehicle and
the policy used to reduce this risk are also strongly significant in both contexts. However,
unlike the results presented for high crime rate countries, our results show that gender is a
statistically significant variable and female individuals are willing to pay more to reduce
the risk of being victimized. Psychology literature supports our results by explaining the
different gender roles and confirming that women are more prone to avoidance
(Rubinstein, 2005). Locking the door of the residence was found to have a negative impact
on WTP in the UK whereas we found that in Portugal, individuals who lock the doors of
their homes are willing to pay more to reduce their risks. We explain the opposite findings
of our study by suggesting that people who lock the doors of their home demonstrate a
crime avoidance behaviour that is compatible with a higher WTP.
Our study also contributes to the existing literature by being the first study that uses the
contingent valuation method to estimate the amount that a particular sector of the

46
population - university students - is willing to pay to reduce the risk of being victims of a
violent crime. Literature on WTP to avoid crime victimization does not discuss the impact
of different fields of study of individuals on WTP. By conducting this study we have
concluded that psychological traits, as indicated by the field of study, play a key role in
determining the amount people are willing to pay. We found that Economics and
Management students are willing to pay more than Health Science students and Art, Law
and Sport students are willing to pay less.
The fact that our results suggest a relationship between the field of study and WTP might
have an impact on policy particularly in insurance policy. In light of these results insurance
companies might be interested in designing different insurance packages for individuals
depending on their psychological traits indicated by their field of study. These packages
would be tailored to include different benefits and costs depending on individual’s
preferences that should include some features based on the individual’s field of study.
Governmental policy might also be affected as crime policies aimed at reducing
victimization risks are perceived differently by people with different educational
background. Individuals with a background study in Economics and Management Sciences
are willing to incur in more costs than individuals in other fields. Governments should be
aware of this distinction to tailor crime policies depending on the geographical distribution
of the individuals with different educational backgrounds in the city/country. Different
locations with the same crime rates might benefit from different crime reduction policies
that should also be tailored in accordance with its population field of study.
Despite the results that were obtained in this study we also acknowledge some limitations.
Firstly it should be noted that we had a low response rate to our questionnaire. This low
participation rate in our survey could be explained by the lack of interest higher education
students demonstrate in answering surveys due to the high number of questionnaires they
are asked to answer. Other methods of conducting the survey could be used to achieve a
higher number of respondents, particularly the face to face interview as recommended by
the NOAA panel (Arrow et al., 1993).
It should also be mentioned that to tailor our scenario we used official statistics on violent
crime in Portugal – EUROSTAT – to present respondents with the baseline risk. However
official statistics underreport the number of criminal offenses as it is estimated that a high
number of crimes are not reported (MacDonald, 2002), particularly sex crimes (Rice et al.,

47
2006). Future research should focus on the impact of different baseline risks and different
percentages in the change of risk reduction on WTP so that reliable and robust estimates
can be produced and used in the definition of crime policy.
Moreover as stated by Cohen et al. (2004) different results could have been obtained if a
detailed description of the consequences of victimization had been provided. Future
research should investigate if different amounts of WTP would be reported in those
circumstances.
In our study we reported 25.5% of protesters and Atkinson et al. (2005) stated having more
than 30% of responses classified as protests. Even though this high percentage of protesters
did not bias our results as the logistic regression estimated using the maximum likelihood
method produced the same results as the ordinary least squares estimation, several
explanations can be suggested such as the fact that respondents object the valuation
scenario (e.g. the percentage of risk reduction involved) but a comprehensive study of the
reasons behind the protests should be conducted. Future research should thus focus in
trying to explain the high percentage of protesters that are encountered in the CV studies
applied to the costs of crime.
Finally, an in depth analysis of the relationship between individual’s background education
(used as a proxy for psychological traits) and WTP to avoid being victims of crime should
also be conducted. We have suggested that there is an association between these two
variables but given the implications it might have in crime policies further research is
recommended.

48
References
Ahlheim, M. (1998), “Contingent valuation and the budget constraint”, Ecological
Economics, 27, pp 205-211
Alberini, A.; Chiabi, A., (2007), “Urban Environmental health and sensitive populations:
How much are the Italians willing to pay to reduce their risks”, Regional Science
and Urban Economics, 37, pp 239 – 258
Arrow, K., Solow, R., Portney, P., Leamer, E., Radner, R., Schuman, H. (1993), “Report of
the NOAA Panel on Contingent Valuation” – accessed at
http://www.cbe.csueastbay.edu/~alima/courses/4306/articles/NOAA%20on%20conti
ngent%20valuation%201993.pdf
Atkinson G., Healy A., Mourato S., (2005) “Valuing the costs of violent crime: a stated
preference approach”, Oxford Economic Papers, 57, 559-585
Bateman, I., Carson, R., Day, B., Hanemann, M., Hanley, N., Hett, T., Jones – Lee,
M.,Loomes, G., Mourato, S., Ozdemiroglu, E., Pearce, D., Sugden, R., Swanson, J.
(2002), “Economic valuation with Stated Preference Techniques: A manual”,
Cheltenham : Edward Elgar, UK
Bjornstad, D., Cummings, R., Osborne, L. (1997), “A Learning Design for Reducing
Hypothetical Bias in the Contingent Valuation Method”, Environmental and
Resource Economics, 10, pp. 207-221.
Brand, S., Price, N., (2000), “The economic and Social Costs of Crime”, Home Office
Research Study, 217
Carson, R. (2000), “Contingent Valuation: A User’s Guide”, Environmental Science &
Technology, 34, 8, pp.1413-1418
Carson, R., Flores, N., Meade, N. (2001), “Contingent Valuation: Controversies and
Evidence”, Environmental and Resource Economics, 19, pp.173-210
Carthy, T., Chilton, S., Covey, J, Hopkins, L., Jones-Lee, M., Loomes, G., Pidgeon, N.,
Spencer, A. (1999), “On the Contingent Valuation of Safety and the Safety of
Contingent Valuation: Part 2 – The CV/SG “Chained” Approach”, Journal of Risk
and Uncertainty, 17:3, pp. 187-213

49
Cohen, M. (1988), “Pain suffering and jury awards: A study of the cost of crime to
victims”, Law and Society Review, 22, pp. 538-555
Cohen, M. (2000), “Measuring the Costs and Benefits of Crime and Justice”, in Vol. 4:
Measurement and Analysis of Crime and Justice, Criminal Justice 2000, National
Institute of Justice (July 2000), NCJ 182411, accessed at
http://www.ncjrs.gov/criminal_justice2000/vol_4/04f.pdf
Cohen M. (2007), “Valuing Crime control Benefits Using Stated Preference Approaches”,
Working paper Number 08-09, Vanderbilt University Law School - Law and
Economics, accessed at http://papers.ssrn.com/sol3/papers.cfm?abstract_id=1091456
Cohen, M., Rust, R., Steen, S., Tidd, S. (2004), “Willingness to pay for Crime Control
Programs”, Criminology, 42, 1, pp.89-109
Corso, H., Hammitt, J., Graham, J. (2001), “Valuing Mortality – Risk Reduction: Using
Visual Aids to Improve the Validity of Contingent Valuation”, Journal of Risk and
Uncertainty, Vol. 23 (2), pp. 165 – 184
Cummings, R., Taylor, L. (1999), “Unbiased Value Estimates for Environmental Goods: A
Cheap Talk Design for the Contingent Valuation Method”, The American Economic
Review, Vol. 89, 3, pp. 649-665
Czabanski, J. (2008), “Estimates of Cost of Crime – History, Methodologies, and
Implications”, Springer Berlin Heidelberg
Dolan, P, Loomes, G., PeasGood, T., Tsuchiya, A. (2005), “Estimating the Intangible
Victim Costs of Violent Crime”, British Journal of Criminology, 45, pp 958-976.
Dolan, P., PeasGood. T, (2007), “Estimating the Economic and Social Costs of the Fear of
Crime”, British Journal of Criminology, 47, pp. 121-132
Dubourg, R., Hamed, J., Thorns, J. (2005), “The Economic and social costs of crime
against individuals and households 2003/04”, Home Office Online Report 30/05,
accessed at http://www.homeoffice.gov.uk/rds/pdfs05/rdsolr3005.pdf
Gerking, S., Hann, M., Schulze, W. (1988), “The Marginal Value of Job Safety: a
Contingent Valuation Study”, Journal of Risk and Uncertainty, 1, pp 185-199
Gibbons, S. (2004), “The costs of Urban Property crime”, The Economic Journal, 114, pp.
441-463

50
Hanley, N., Spash, C. (1993), “Cost-Benefit Analysis and the Environment”, Edward Elgar
Publishing Company, England
Jongejan, R., Jonkman, S, Vrijling, J. (2005), “Methods for the economic valuation of the
loss of life; in: Boyer, M., N. de Marcellis, B. Sinclair – Desgagne (eds.)
Proceedings of Conference on the international law and management of large scale
risks 2005, Montreal Canada
Kline, P., Lapham, S. (1992), “Personality and faculty in British universities”, Personality
and Individual Differences, Vol. 13, 7, pp. 855-857
Ludwig, J., Cook, P. (1999), “The benefits of reducing gun violence: Evidence from
Contingent Valuation Survey Data”, NBER Working papers, 7166
Lynch, A., Rasmussen, D. (2001), “Measuring the impact of crime on house prices”,
Applied Economics, 33, pp.1981-1989
MacDonald, Z. (2002), “Official Crime Statistics: Their Use and Interpretation”, The
Economic Journal, 85-106
Marta – Pedroso, C., Freitas, H., Domingos, T. (2007), “Testing for the survey mode effect
on contingent valuation data quality: A case study of web based versus in-person
interviews”, Ecological Economics, 62, pp. 388-398
Miller, T., Cohen, M., Wiersema, B. (1996), “Victim Costs and Consequences: A New
Look”, National Institute of Justice, Washington DC
Ministério da Administração Interna (2009), “Relatório Anual de Segurança Interna – Ano
2008”, Gabinete do Secretário-Geral do Sistema de Segurança Interna, accessed at
http://www.mai.gov.pt/data/actualidades_e_destaques/2008%20actualidades%20e%
20destaques/docs%202009/%7BC7AC5B4E-8B0D-40B4-B9EE-
33180D012751%7D_RASI%202008_26032009---Versao%20AR.pdf
Mitchell, R., Carson, R. (1988), “Evaluating the validity of Contingent Valuation Studies”,
in Peterson, G., Driver, B., Gregory, R. (Eds.), Amenity Resource Valuation:
Integrating Economics with Other Disciplines, Venture Publishing Co., State
College, PA
Moore, S. (2006), “The value of reducing fear: an analysis using the European Social
Survey”, Applied Economics, 38, pp. 115-117

51
Moore, S., Shepherd, S. P. (2006), “The cost of fear: shadow pricing the intangible costs
of crime”, Applied Economics, 38, 293-300
Morrison, M.D., Blamey, R.K., Bennett, J.W. (2000), “Minimising Payment Vehicle Bias
in Contingent Valuation Studies”, Environmental and Resource Economics, 16, pp
407-422
Nagin, D., Piquero, A., Scott, E., Steinberg, L., (2006), “Public Preferences for
Rehabilitation versus Incarceration of Juvenile Offenders: Evidence from a
Contingent Valuation Survey”, Number 4, Vol. 5, pp. 627 - 652
Norinder, A., Hjalte, K., Persson, U. (2001), “Scope and scale insensitivities in a
contingent valuation study of risk reductions”, Health Policy, 57, pp 141-153
Pearce, D., Turner, R (1990), “Economics of Natural Resources and the Environment”,
New York, Harvester Wheatsheaf
Persson, U.; Norinder, A. ; Hjalte, K.; Grálen, K., (2001), “The value of a statistical life in
Transport: Findings from a New Contingent Valuation Study in Sweden”, Journal of
Risk and Uncertainty, 23 (2), pp 121-134
Pouta, E. (2005), “Sensitivity to scope of environmental regulation in contingent valuation
of forest cutting practices in Finland”, Forest Policy and Economics, 7, pp. 539-550.
Rajkumar, A., French, M. (1997), “Drug Abuse, Crime Costs, and the Economic Benefits
of Treatment”, Journal of Quantitative Criminology, 13, 3, pp.291-323
Rice, M., Harris, G., Lang, C., Cormier, C. (2006), “Violent Sex offences: How are they
best measured from official records?, Law and human Behaviour, Vol. 30, 4, pp.
525-541
Roeser, R. (2006), “On the study of Educational and Occupational Life-Paths in
Psychology: Commentary on the Special Issue”, Educational Research and
Evaluation, 12, 4, pp.409-421.
Rubinstein, G. (2005), “The big five among male and female students of different
faculties”, Personality and Individual Differences, 38, pp. 1495-1503
Sheskin, D. (2007), Handbook of Parametric and Nonparametric Statistical Procedures (4th
edition), Boca Raton, Florida, Chapman & Hall/CRC, Taylor & Francis Group

52
Silver, C., Malone, J. (1993), “A Scale of Personality Styles based on DSM-III-R for
Investigating Occupational Choice and Leisure Activities”, Journal of Career
Assessment, Volume 1, 4, pp. 427-440
Streff, F., Molnar, L., Cohen, M., Miller, T., Rossman, S. (1992), “Estimating Cost of
Traffic Crashes and Crime: Tools for Informed Decision Making”, Journal of Public
Health Policy, Vol. 13, 4, pp. 471-471
Thaler, R. (1978), “A Note on the Value of crime Control: Evidence from the Property
Market”, Journal of Urban Economics, 5, pp. 137-145
Tita, G., Petras, T., Greenbaum, R. (2006), “Crime and Residential Choice: A
Neighboorhood Level Analysis of the Impact of Crime on Housing Prices”, Journal
of Quantitative Criminology, 22, pp. 299-317
Tokar, D., Fischer, A., Subich, M. (1998), “Personality and Vocational behavior: A
Selective Review of the Literature, 1993-1997”, Journal of Vocational Behavior, 53,
pp. 115-153
Tyrvainen, L., Vaananen, H. (1988), “The economic value of urban forest amenities: an
application of the contingent valuation method”, Landscape and Urban Planning, 43,
pp. 105-118
Universidade do Porto, Reitoria, Serviço de Melhoria Contínua (2009),
“Ensino_Estudantes Inscritos na U. Porto 2008”, in
http://sigarra.up.pt/up/conteudos_geral.conteudos_ver?pct_pag_id=122350&pct_par
ametros=p_pagina=122350 (accessed 06-09-2009)
Van Dijk, J., Manchin, R., Van Kesteren, J., Nevala, S., Hideg, G. (2007), “The burden of
crime in the EU : A comparitive analysis of the European Crime and Safety Survey
(EU ICS) 2005”, accessed at:
http://www.europeansafetyobservatory.eu/downloads/EUICS_The%20Burden%20of
%20Crime%20in%20the%20EU.pdf
Viscusi, W. K. (2008),”How to value a life”, Journal of Economics and Finance, 32, pp
311-323
Viscusi, W. (2000), “The Value of Life in legal contexts: Survey and Critique”, American
Law and Economics Review, Vol. 2, 1, pp. 195-222

53
Viscusi, W. K. (1993),”The Value of Risks to Life and Health”, Journal of Economic
Literature, Vol. XXXI, pp. 121-134.
Walker, A., Flatley, J., Kershaw, C., Moon, D. (2009), “Crime in England and Wales
2008/2009, Volume 1 – Findings from the British Crime Survey and police
recorded crime”, Home Office Statistical Bulletin
Whynes, D., Wolstenholme, J., Frew, E. (2004), “Evidence of range bias in contingent
valuation payment scales”, Health Economics, 13, pp 183-190

54
Appendix
Inquérito: Disposição a pagar pela redução da criminalidade violenta
* Obrigatório
Idade * Sexo *
Feminino
Masculino Rendimento familiar mensal *
Até 450€/mês
De 450€ até 900€ mês
De 900€ até 1350€
De 1350€ até 1800€
De 1800€ até 2250€
Superior a 2250€
Número de membros do agregado familiar * Algum dos membros do agregado familiar depende financeiramente de si? *
Sim
Não Actualmente frequenta: *
Licenciatura
Pós - Graduação
Mestrado
Doutoramento/Programa Doutoral
Outro: Qual é a sua área de formação base? *
Artes e Arquitectura
Desporto
Economia e Ciências Empresariais
Ciências Humanas e Sociais
Psicologia e Ciências da Educação
Direito
Engenharia
Saúde
Ciências Exactas e Naturais

55
Outro: Actualmente está inscrito na(o): *
Faculdade de Arquitectura
Faculdade de Belas Artes
Faculdade de Ciências
Faculdade de Ciências da Nutrição e Alimentação
Faculdade de Desporto
Faculdade de Economia
Faculdade de Engenharia
Faculdade de Farmácia
Faculdade de Letras
Faculdade de Medicina
Faculdade de Medicina Dentária
Faculdade de Psicologia e Ciências da Educação
Instituto de Ciências Biomédicas Abel Salazar
Escola de Gestão do Porto
Faculdade de Direito
Outro: Alguma vez foi vítima de um crime (violento ou não)? *
Sim
Não Se respondeu sim à questão anterior, o crime ocorreu?
Nos últimos 12 meses
Entre 1 ano e 5 anos
Há mais de 5 anos Se já foi vítima de crime, como o classificaria em função das suas consequências em termos de danos físicos? 1 - Sem danos; 5 - Danos muito graves
1 2 3 4 5
Danos Físicos
E em termos de danos psicológicos? 1 - Sem danos; 5 - Danos muito graves
1 2 3 4 5
Danos Psicológicos
Numa escala de 1 a 3 diria que se preocupa com o facto de poder vir a ser vítima de um crime violento (que pressuponha o uso de violência contra a pessoa)? * 1 - não se preocupa; 2 - Preocupa-se moderadamente; 3 - Preocupa-se bastante
1 2 3

56
Costuma fechar a porta à chave antes de sair do seu local de residência? *
Sim
Não Havendo 2,28 crimes violentos por cada mil habitantes, quanto estaria disposto a pagar para reduzir em 10% a probabilidade de ser vítima de um crime violento nos próximos 12 meses (independentemente da forma de pagamento) ? *
0€
0 até 50€
50€ até 250€
250€ até 750€
750€ até 1250€
1250€ até 1750€
1750€ até 2250€
2250€ até 2750€
2750€ ou um valor superior Se o pagamento fosse feito sob a forma de aumento de impostos para suportar o acréscimo de policiamento estaria disposto a pagar
Mais
Menos
O mesmo
Enviar
Tecnologia Google Docs Termos de Serviço - Termos Adicionais