faculty of resource science and technology - ir.unimas.my distribution of butterflies...declaration...
TRANSCRIPT

BUTTERFLIES OF SARAWAK: DOCUMENTATION OF RHOPALOCERAN
MODELLING DISTRIBUTION OF BUTTERFLIES (NYMPHALIDAE:
SATYRINAE) FROM SECONDARY RECORDS AND DATABASE IN SARAWAK
Siti Zakiah Binti Hamid
Bachelor of Science with Honours
(Animal Resource Science and Management)
2012
Faculty of Resource Science and Technology

MODELLING DISTRIBUTION OF BUTTERFLIES (NYMPHALIDAE:
SATYRINAE) FROM SECONDARY RECORDS AND DATABASE IN SARAWAK
SITI ZAKIAH BINTI HAMID (25135)
This project is submitted in partial fulfilment of the requirement for a
Bachelor of Science with Honours
(Animal Resource Science and Management)
Supervisor: Miss Siti Nurlydia Bt Sazali Co-supervisor: Miss Ratnawati Bt Hazali
Animal Resource Science and Management
Department of Zoology
Faculty of Resource Science and Technology
Universiti Malaysia Sarawak
2012

DECLARATION
No portion of the work referred to this dissertation as been submitted in support of an
application for another degree of qualification of this or any other university of institution of
higher learning.
Siti Zakiah Binti Hamid
Animal Resource Science and Management Programme
Faculty of Resource Science and Technogy

i
Acknowledgement
Firstly, thanked to Allah s.w.t by giving me great health during this research. I feel
grateful that I am able to finish my Final Year Project on time. Throughout this project I
have learn many experience, skills and had good practice in communication that I would
never forget. Moreover, I would like to show my greatest appreciation and thankful to my
supervisor Miss Siti Nurlydia binti Sazali@Piksin for her guidance and encouragement
until the end of this project. Her patience and understanding make me feel comfortable.
Furthermore, I would also like to thank Miss Ratnawati binti Hazali as my co-
supervisor that always give me informative ideas and guidance. I really thank to Mr.
Mohamad Jalani Mortada for trusting me by allowing me to use the butterfly voucher
specimens in Unimas Museum. He is a very kind and a helpful lab assistant person who
tried hard to help me to find butterfly data sheet from previous researchers in Museum
Preparation Room.
Besides, I want to show my thankfulness to Dr. Charles Leh from Sarawak
Museum. I will never forget their kindness for showing me butterfly specimens and
allowed me to use the data from Sarawak Museum. Then, thanked to Madam Margarita
Naming from Sarawak Biodiversity Centre for her cooperation to allow me to use the data
and show me the specimen collections. I would like to thank to Mr. Ngumbang Juat from
Wildlife Conservation Society for teaching me more about data analysis.
Last but not least, I would like to show my gratefulness to my beloved parents, Mr.
Hamid bin Che Awang and Mdm Norisah binti Yusof, belong with them are my eldest
brother and three little brothers who always gave me motivation and courage to finish my
final year project. Nevertheless, I want to show my special gratitude to all my course mates
Afiqah, Nuraishah, Nazirah, Amiera, Shakirah, and Nadia for their companionship. I also
would like to thank to my housemate Hazlinda for her supporting.

ii
Table of Contents
Acknowledgements
i
Table of Contents ii
List of Abbreviations
iii
List of Tables
List of Figures
iv
V
Abstract
1
1.0 Introduction 2
1.1 Problem Statements 6
1.2 Objectives 6
2.0 Literature Review
2.1 Satyrinae (Family: Nymphalidae)
7
2.2 Ecological Modelling
3.0 Materials and Methods
14
3.1 Data collections 16
3.2 Data analysis 16
3.2.1 R software 16
3.2.2 Predictor variables 16
3.2.3 General Linear Model (GLM) and Akaike Information Criterion
(AIC).
17
4.0 Results and Discussions
4.1 Distribution and mapping of the Subfamily Satyrinae based on
locality and all species and genus collected correspond with
predictive variables selected.
4.1.1 Predictor Variables
4.1.1.1 Habitat type
4.1.1.2 Disturbance effect
4.1.2 General Linear Model (GLM) and Akaike Information
Criterion (AIC) values.
19
19
21
33
5.0 Conclusion and Recommendation
38
6.0 References 40
7.0 Appendices 45

iii
List of Abbreviations
GPS Global Position System
Km kilometer
UNIMAS Universiti Malaysia Sarawak
GIS Geographical Information System
SFRC Sarawak Forestry Research Centre
R-Project Raster Project
GLM Generalized Linear Model
AIC Akaike Information Criterion
MAXENT Maximum Entropy
Glm.nsphab number species + habitat type
Glm.nspdis number species + disturbance effect
Glm.nsphaddis number species + habitat type + disturbance effect
Glm.nindhab number individual + habitat type
Glm.ninddist number individual + disturbance effect
Glm.nindhabdist number individual + habitat type + disturbance effect

iv
List of Tables
Table Page
Table 1
List of predictor variables and their number of interval given.
17
Table 2
A list of most abundance species at different location and year.
20
Table 3
List of the genus collected from twenty places from year 2000 until
present.
21
Table 4
Differences of AIC value depend on the variables provided.
35
Table 5 Akaike Information Criterion (AIC) values for several genera of
butterflies from subfamily Satyrinae.
37

v
List of Figures
Figure
Figure 1
Procedure during research study of Modelling distribution of
butterflies (Subfamily: Satyrinae) from secondary records and
database in Sarawak
Page
15
Figure 2
Amathusia phidippus phidippus
24
Figure 3
Species distribution of the genus Ragadia
27
Figure 4
Species distribution of the genus Orsotriaena
28
Figure 5 Species distribution of the genus Mycalesis 31
Figure 6 Species distribution of the genus Elymnias 32
Figure 7 Species distribution of the genus Ypthima 33
Figure 8 Distribution of the species from the subfamily Satyrinae. 36

vi
List of appendices
Appendix Page
Appendix 1 Species collected at Sarawak, Kubah National Park. 45
Appendix 2 Species collected at Bau. 46
Appendix 3 Species collected at Similajau National Park. 50
Appendix 4 Species collected at Gunung Gading National Park. 51
Appendix 5 Species collected at Bako National Park. 51
Appendix 6 Species collected at Niah National Park. 52
Appendix 7 Species collected at Kampung Giam Baru Padawan. 53
Appendix 8 Species collected at UNIMAS. 54
Appendix 9 Species collected at Samarahan, Miri, Limbang, Sri Aman, 55
Sarikei,Mukah, Bintulu, and Betong.
Appendix 10 Responding variables versus predictive variables based on 57
different years recorded from the data collections.
Appendix 11 Species collected in all 20 places from year 2000 until 2011. 58
Appendix 12 Generalized Linear Model (GLM) and Akaike’s information 60
criterion (AIC) value.
Appendix 13 Script in R software. 66

1
MODELLING DISTRIBUTION OF BUTTERFLIES (NYMPHALIDAE:
SATYRINAE) FROM SECONDARY RECORDS AND DATABASE IN SARAWAK
Siti Zakiah Binti Hamid
Animal Resource Science and Management Programme
Faculty of Resource Science and Technology
Universiti Malaysia Sarawak (UNIMAS)
ABSTRACT
The study of species diversity of Rhophaloceran species from family Nymphalidae (subfamily: Satyrinae)
had been studied by many researchers. Although there was a documentation studied had been done, but the
overview on the species distribution are still in the concept of datasheets, while our main objective of
modelling distribution of the butterflies family Nymphalidae (subfamily: Satyrinae) is to map current
distribution of butterflies from subfamily Satyrinae and identify area(s) with high species diversity. The
secondary data were collected from UNIMAS Zoological Museum, Sarawak Museum, and also Sarawak
Biodiversity Centre. There is a total of 860 individual collected from 82 species from this subfamily
Satyrinae. All of these data were collected from the compilation of 19 sites while the highest number of
species collected was from Samarahan (24) with 128 individuals, compared to the lowest species collected at
Sri Aman, Sarikei, and Betong with only one species, respectively. Besides that, the Akaike’s Information
Criteria (AIC) value has been shown from the analysing data of Generalised Linear Model (GLM). The AIC
value will determine the best variable from set of variables and the variable that have the lowest AIC are the
best. From the data analysis, the best predictive variables is disturbance effect by having the lowest AIC
value of 139.9 compared to the habitat type (142.4) which corresponding to the species distribution of
butterflies from subfamily Satyrinae.
Keywords: Butterfly, Satyrinae, Sarawak, modelling, GLM.
ABSTRAK
Kajian tentang taburan spesis rama-rama daripada famili Nymphalidae (subfamili: Satyrinae) telah dikaji
oleh ramai pengkaji. Walaupun kajian tentang dokumentasi rama-rama telah dibuat, namun data koleksi
rama-rama masih lagi di dalam bentuk senarai, oleh itu objektif utama saya untuk kajian model taburan ke
atas rama-rama famili Nymphalidae (subfamili: Satyrinae) ialah untuk melakar taburan rama-rama
daripada subfamili Satyrinae pada masa kini dan mengenalpasti kawasan-kawasan yang mempunyai
kepelbagaian yang tinggi. Data sekunder telah dikumpulkan daripada Muzium Zoologi UNIMAS, Muzium
Sarawak, dan juga Pusat Kepelbagaian Bio Sarawak. Terdapat 860 jumlah individu yang telah dikumpulkan
daripada 82 spesis subfamili Satyrinae. Semua data yang telah dikumpulkan adalah daripada 19 buah
tempat, sementara itu, jumlah spesis yang paling tinggi yang telah dikumpulkan ialah daripada Samarahan
(24) di dalam 128 individu, berbanding jumlah spesis yang paling rendah telah dikumpulkan di Sri Aman,
Sarikei, dan Betong yang hanya mempunyai satu spesis sahaja. Selain itu, nilai ‘Akaike’s Information
Criteria (AIC) telah ditunjukkan hasil daripada data analisis melalui ‘Generalized Linear Model (GLM)’.
Nilai AIC akan menentukan pembolehubah yang paling bagus antara semua pembolehubah- pembolehubah
dan pembolehubah yang mempunyai nilai AIC yang paling rendah merupakan pembolehubah yang paling
bagus. Daripada data analisis juga telah menunjukkan pembolehubah yang paling bagus di dalam kajian ini
ialah pembolehubah kesan gangguan yang mempunyai nilai AIC 139.9 berbanding pembolehubah jenis
tempat tinggal (142.2) yang selaras dengan taburan spesis rama-rama daripada subfamili Satyrinae.
Kata kunci: Rama-rama, Satyrinae, Sarawak, permodelan, GLM.

2
1.0 INTRODUCTION
Rhopalocerans or generally known as butterflies are the most attractive of insects due to
their glowing, brilliant colour and patterns. According to Sen (1983), butterflies are found
almost everywhere on dry land where Malaysia consists of more than 1000 recorded
species, and also more new species are expected to be discovered. Moreover, as of 2001
about 950 species of butterflies were recorded in Borneo; 200 of this number are
introduced in Sarawak (Otsuka, 2001). In addition, due to the gorgeousness of physical
appearance of butterflies make many people appreciate them while others study them in
scientific depth. As the habit of many Malaysia’s finest butterflies to sit with wings erected
while sucking up liquid from muddy spot or from animal dung by roadside, they can be
easily approached and photographed or captured. Normally, the butterflies have the
antennae just like threadlike and tips are distinctly thickened to form a club (Sen, 1993).
In addition, butterflies are the most glamorous insects, and they have been better studied
worldwide compared to all other insect groups. In the Malay Peninsula, there are 1,031
species, with 21 endemics (Corbet and Pendlebury, 1992), while the number of species is
lower in the island of Borneo with 936 species, but with a much higher number of 94
endemics species (Otsuka, 1996). About 88% of the species in the Malay Peninsula are
also found in Borneo. However, most of them occur as different subspecies in the two
different regions. Half of the species are distributed in the lowlands below 750 m, and one-
seventh of the species occur in the highlands. The rest are found in habitats at both
elevations (Corbet and Pendlebury, 1992).

3
According to Corbet and Pendlebury (1992), Nymphalidae is a large family which consists
of seven subfamilies including Danainae, Satyrinae, Morphinae, Acraeinae, Nymphalinae,
Charaxinae and Libytheinae. During adult stage, the forelegs of both sexes are much
reduced and cannot be used for walking, except in female of Libytheinae, and usually the
family also being called as Tetrapoda or four-footed butterflies (Corbet and Pendlebury,
1992). The subfamily Satyrinae is usually medium-sized butterflies, with the wings short
and broad, often with the tremens scalloped, or dentate or caudate on the hindwing. Other
than that, their wings usually dull brown and ornamented with submarginal eye-spots.
Furthermore, the eyes are hairy in only a few genera and their body is slender. Palpi
flattened laterally and usually densely hairy. Fore tarsi imperfect and brush-like in both
sexes and useless for walking. Then, their forewing have all veins present, and with the
veins basally thickened or more usually with one or more veins swollen at the base (Corbet
and Pendlebury, 1992).
The subfamily Satyrinae is represented by 12 genera (Corbet and Pendlebury, 1992),
comprising of Melanitis, Elymnias, Lethe, Neorina, Ethope, Xanthotaenia, Mycalesis,
Orsotriaena, Erites, Coelites, Ragadia and Ypthima. All of these genera have their
common species that belonged to their genus such as The Common Evening Brown, the
common species to the genus Melanitis, and The Striped Ringlet that common species to
genus Ragadia (Corbet and Pendlebury, 1992).

4
Other than that, based on Willott et al. (2001), the impacts of habitat disturbance on
biodiversity within tropical forests are an area of current concern but are poorly understood
and difficult to predict. This is due in part to a poor understanding of how species respond
to natural variation in environmental conditions within primary forest and how these
conditions alter following anthropogenic disturbance. Overall, there was little difference in
butterfly diversity between primary forest and forest that had been selectively logged 10-12
years previously. In contrast, there were marked differences in the composition of the
butterfly assemblages in the two habitats, which were strongly associated with species' gap
preferences and geographical distributions (Willott et al., 2001).
Apart from that, data sets of subfamily Satyrinae had been collected from UNIMAS
Zoological Museum, Sarawak Museum, Sarawak Biodiversity Centre and Forest Research
Centre, subsequently being compiled using Microsoft Excel, (2007). All of the data sets
had been arranged based on their families, subfamilies, species, locality, total individual
and species, date, and Global Position System (GPS) reading. Apart from that, the data
collection that act as the predictive variables also has been recorded such as habitat type,
type of sampling site, seasonal and also level of disturbance at all of the location of the
specimens and any other relevant data. All of the parameter of the specimen had been
recorded in order to make the results more precise or increased the validity of the results
that will obtain. Besides that, all the data collected are based on published reports, journals,
and from voucher specimens deposited in museums. Moreover, the data recorded has being
run using R Project software and data analysis extracted. Apart from that, Tinn-R editor
also has been used in order to manage many lines in R codes or routines. Besides that, all
the results obtained will be tagged later, into Sarawak maps for discover their distribution
based on their abundance at location chosen.

5
Furthermore, United Nations (2000), states that Geographical Information System (GIS)
has benefited greatly from developments in various fields of computing. Better database
software allows the management of vast amounts of information that is referenced to
digital maps. Digital techniques allow better management, faster retrieval and improved
presentation of such data, therefore, always been a close linkage between geography and
statistics. Moreover, a new generation of commercial, high-resolution satellites promise
pictures of nearly any part of the earth’s surface with enough detail to support numerous
mapping applications (United Nations, 2000).
Kocsis and Hufnagel (2011), stated that climate change conditions greatly influence the
development and range of insects populations. Moreover, according to current estimates,
the annual average temperature of the Earth increases with 1°C by 2025 and the probable
rise in temperature by the end of the century is expected to reach 3°C (IPCC, 2007;
Hufnagel and Kocsis, 2011). Lepidoptera is the fourth largest order of insects in Europe
with 8470 species living in the area of 35 countries and from this species richness, the
taxon list of a given area provides an extremely detailed view of environmental conditions
of the site. Level of sensitivity of the butterflies and moths populations to the changes of
abiotic factors can be considers as good indicator species in monitoring climate change
(Hufnagel and Kocsis, 2011).

6
1.1 Problem Statement
Lack of database distributions of butterflies through mapping concept tends to make any
researchers, scientists or students difficult to done their research. There are also due to
insufficient data collection on butterflies from secondary records and database in Sarawak.
1.2 Objectives
To compile museum specimens and published records of butterfly from the
subfamily Satyrinae based on data collected at Sarawak.
To determine the distribution of butterfly species from the subfamily Satyrinae
within Sarawak, based on previous and current records.
To detect the most abundance species of butterfly from the subfamily Satyrinae in
Sarawak.
To map distribution of butterflies from the subfamily Satyrinae and identify area(s)
with high species abundance.

7
2.0 LITERATURE REVIEW
2.1 Satyrinae (Family: Nymphalidae)
According to Abang (2006), butterflies are not really so distinct from moths and share with
them many aspects of appearance and behaviour and generally recognised by their bright
colours and clubbed antennae. Abang (2006) stated that, being the best-known insects,
butterflies are perhaps the best group of insects for examining patterns of terrestrial biotic
diversity and distribution. Hence they are an excellent group for communicating
information on science, biological diversity, and conservation issues. Butterflies of Borneo
also are very similar to that of Peninsular Malaysia, Sumatra and Java (Abang, 2006).
Borneo is rich in evergreen tropical rain forest as the natural vegetation, except for small
areas on beaches, riverbanks and rocky cliffs while the butterflies are found in almost all
habitat types ranging from lowland mixed dipterocrap forest to montane forests. In
addition, the distribution of Lepidopteran fauna normally correlates with the plant
community in the forest and the elevation of geographical locations above sea level
(Abang, 2006).
Tropical rainforests are well known as centres of biodiversity (Wallace, 1878; Richards,
1952) and much interest had focused on the ecological processes responsible for generating
and maintaining this diversity, with recent authors emphasizing the importance of natural
disturbance and non-equilibrium dynamics, coupled with variations across environmental
gradients generated by topographic and edaphic landscape features within forest (Huston,
1994; Rosenzweig, 1995). Unluckily, lack of consensus is due in part to differences in the

8
spatial scale at which studies were carried out (Hamer and Hill, 2000) and is compounded
by a poor understanding of how species respond to natural variation in environmental
conditions within primary forest and how these conditions alter following anthropogenic
disturbance. For example, tropical butterflies differ in body morphology and habitat
associations partly in relation to phylogeny. In butterflies, adult morphology has been
related to flight ability (Chai and Srygley, 1990; Dudley, 1990; Srygley and Chai,
1990; Hall and Willmott, 2000). Within the Nymphalidae, members of the subfamilies
Satyrinae and Morphinae have relatively broad wings, favouring slow agile flight, and are
often encountered beneath the canopy in dense forest (Holloway, 1984; Schulze and
Fiedler, 1998).
Apart from that, Devries and Walla (2001), in their study on species diversity and
community structure in neotropical fruit-feeding butterflies, from the raw data for the five
years sampling period provided a rough estimation of species richness and abundance of
butterflies from the family Nymphalidae. About 25% of species were found only in
canopy, 32% were found only in the understory, and 42% were found in both strata but
total abundance were nearly equal in canopy and understory. Although there was
significant variation in the magnitude of richness and abundance among years, the
inversion of canopy and understorey faunas at the onset of the rainy season pointed to an
underlying pattern of seasonal population fluctuations.

9
According to Pang et al. (2004), most abundance individuals that collected at Jambusan,
Bau, Sarawak are from the family Nymphalidae. This collection is reasonable as the
Nymphalidae butterflies are sun lovers and like warm temperature and luckily the weather
during the sampling period was very sunny which contributed to the high capture. In
addition, four Bornean endemic species that were recorded in the Bau Limestone area were
not successfully captured throughout this survey due to differences of survey period and
number of sampling sites between present survey and their study. The endemic species are
Paralaxila nicevillei, Jamides puloensis, Arhopala denta, and Stibochiona schoenbergi
(Pang et al., 2004). Moreover, the low captured by baited trap of forested species might be
due to the logging activity in the study area (Pang et al., 2004).
Rahim et al. (2006) who studied on butterfly of Similajau National Park, Bintulu, Sarawak
stated that the largest family recorded during his study was Nymphalidae, with total of 20
species in which, Amathusia phidippus phidippus (Nymphalinae) with 158 individuals
mostly females, Junonia ortihya metion (Nymphalinae) represented by 44 individuals and
followed by Hypolimnas bolina philippensis (Nymphalinae) with 22 individuals were
recorded. Nymphalidae which consists of three subfamilies has the most diverse species in
Similajau National Park which representing 86% of the individuals totally collected
(Rahim et al., 2006).
Catherine (2007), who studies faunistic composition of butterflies (Lepidoptera:
Rhopalocera) on Pulau Satang Besar and Kubah National Park, Sarawak, stated that the
subspecies from Pulau Satang Besar is slightly different from the subspecies on mainland
of Borneo. From the research, she successfully recorded Ideopsis juventa sitah where

10
species occurred mostly in Peninsular Malaysia such as, Tioman Island, Aur Island,
Bunguran and Anamba. Migratory phenomenon is most widespread in Danainae as noted
by (Catherine, 2007), and thus, I. juventa sitah possibly comes a long way from Tioman
Island or Aur Island (Catherine, 2007).
Xiang (2011), documented a total of 654 species with 6894 individuals of Rhopaloceran in
Sarawak where six endemic butterfly species have been compiled. She suggested that more
butterfly species including Ragadia sp., Troides sp. and Paralaxita sp. should be
nominated to be covered under Wild Life Protection Ordinance 1998 as these butterflies
are good indicator for forest health due to lack of previous studies that focus on
conservation status of butterfly (Xiang, 2011).
2.2 Ecological modelling
According to Kery et al. (2010), predicting species distributions using site-occupancy
models, has offer a powerful framework for making inferences about species distributions
corrected for imperfect detection. The problems caused by imperfect detection in
conservative species distribution models also carry over to species richness models
because common species richness do not account for unobserved and missed species, thus
they model only apparent species richness, not true species richness which is also known
as species detection probability. They are not modelling the true distribution of a species
but they model the apparent of species distribution, such as the combination of the
probability of occurrence of a species and the probability of detecting it. Most species
present at a site are not always detected during sampling (Yaccoz et al., 2001; Kery, 2002;

11
Williams et al., 2002; Kery et al., 2010). Apart from that, there are two nested logistic
regressions (i.e. binomial GLMs; McCullagh and Nelder, 1989; Kery et al., 2010), that
explained the detection or non detection data which are commonly called presence and
absence data. Firstly, it will determine the true state of the system (occupied or not
occupied) and the other governing the observation of the system state (detected or not
detected) (Kery et al., 2010).
Dennis and Eales (1998), stated that, threatened species such as Coenonympha tullia
(Müller) (Lepidoptera: Satyrinae) which is threatened in British Isles and Europe is needed
on being able to identify sites with suitable habitats and to be able to predict the occupancy
of the sites. This probability of site occupancy of this butterfly is depends as much on the
quality of resources within habitats as on site geography (habitat area and isolation). Thus,
site-specific data can readily be used to predict the occupancy of sites within a region. It
was also demonstrated that using just site-specific data (i.e. habitat area and habitat quality
measures) it is possible to predict the presence or absence of C. tullia at sites, in the same
area, with a high degree of success (Dennis and Eales, 1998).
Scheingross (2007) studied on predicting species distribution of Sierra Nevada butterflies
in response to climate change, stated that distributional modelling has been used to predict
species ranges from limited data and the effects of environmental change. Two distinct
modelling techniques of BIOCLIM and MAXENT were compared to predict distributions
for each butterfly based on bioclimatic variables averaged over 1950-2000. This suggests
BIOCLIM and MAXENT are both valid modelling approaches for alpine organisms.
Future climate models showed the most suitable habitat moving towards areas of higher
elevation and an overall reduction in alpine habitat within the Sierra Nevada. Such shifts in

12
geographic distribution may have important implications for ongoing efforts to monitor
and conserve alpine species by (Scheingross, 2007). Nevertheless, Beaumont and Hughes
(2002) stated that, although studies such as these have detected a range of responses in
some species of butterflies to changes in climate experienced so far, field and laboratory
experiments alone will never be sufficient to determine the potential response of large
numbers of species. Therefore, BIOCLIM modelling is needed to assess potential changes
in species distribution, and identify those species that may be most vulnerable to climate
change. This models also enable species to be studied either individually or grouping, and
for hypotheses to be developed regarding factors that may limits the distributions. Besides
that, this models attempts to match the climatic variables with the current distribution of a
species. Then, the potential changes in distributions under various climate change scenario
and parameters could be estimated (Beaumont and Hughes, 2002).
Ripley (2001) suggested that, the R Project was for Statistical computing of data analysis.
R is an advanced statistical computing system with very high quality graphics that is freely
available for most computing platforms. Besides that, according to Rossiter (2011), R is
also currently exists as source code, as well as binary distributions for most distributions of
Linux, for Windows and for the PowerPC Macintosh. In addition, R is an open-source
environment for statistical computing and visualisation, based on the S language developed
at Bell Laboratories in 1980’s. It is the product of an active movement among statisticians
for a powerful, programmable, portable, and open computing environment, applicable to
the most complex and sophisticated problems as well as “routine” analysis, without any
restriction on access or use (Rossiter, 2011).

13
Tinn-R editor is a free open-source text editor, useful when doing any editing or managing
many lines of R codes or routines (Gusnanto, 2010). Furthermore, Tinn-R is a small, free
and simple, yet efficient, replacement for the basic code editor provided by Rgui. Latest
Tinn-R version and source is available on SourceForge. Other than that, Tinn-R also runs
only under Windows 9X/Me/2000/XP/Vista/7 (Gusnanto, 2010).
Drever (2004) stated that, in order to determine which landscape or ecological parameters
were the most important determinants of the distribution of individual genetic diversity,
they built a series of models containing all possible combinations of explanatory variables
(distance from the St Lawrence River, proportion of extensive and intensive cultures at 500
m, year and sex) and compared them using Akaike’s information criterion. The AIC was
defining the model with the lowest AIC value as the best model (Drever, 2004).

14
3.0 MATERIALS AND METHODS
Data sets of butterflies were gathered based on collection of voucher specimens at
UNIMAS Zoological Museum, Sarawak Museum, Biodiversity Centre, and Forestry
Research Centre. Other than that, the data collection also was being recorded from
published report, journal, books and also articles. The specimens had been examined and
rearranged based on families, subfamilies, species, individuals, locality, total individual
and species, date, and Global Position System (GPS) reading. Apart from that, the data
collection that act as predictive variables also has been recorded such as habitat type, type
of sampling site, seasonal and also level of disturbance at all of the location of the
specimens and any other reliable information that related to the specimens collection.
Apart from that the data collected has been arranged into the table by using Microsoft
Office Excel 2007. From that arrangement into table it easier to see the most abundance
species based on location chosen.
Global Position System (GPS) has being used for marking their respective location based
on tagging upon their location of the butterflies on the Sarawak map. Moreover the
Sarawak map also had been downloaded from Google Earth Version 5, 2011.
Identification process of butterflies was based on several books such as Butterflies of West
Malaysia and Singapura by McCartney and Flemming (1983) and Butterflies of Borneo-A
pocket guide by Abang (2006), The Butterflies of The Malay Peninsula by Corbet and
Pendlebury (1992), and also Butterflies of Borneo Volume 1 for Nymphalidae, Pieridae
and Papilionidae by Otsuka (1988).
15
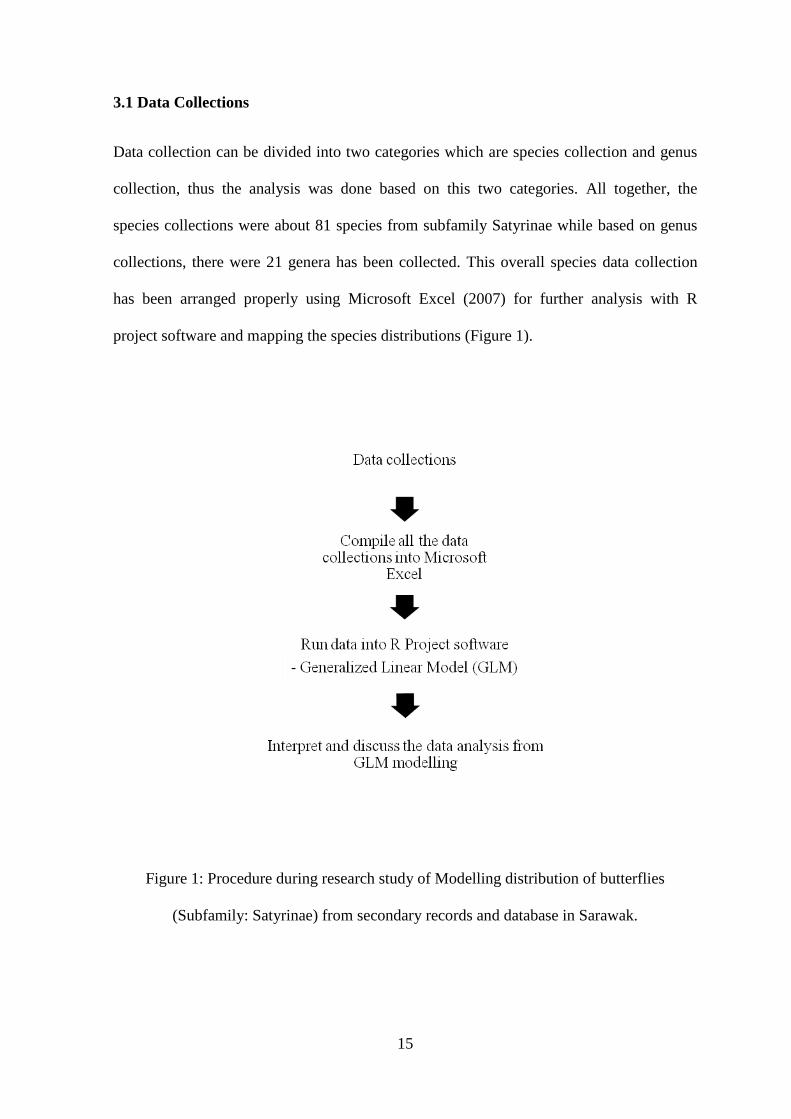
3.1 Data Collections
Data collection can be divided into two categories which are species collection and genus
collection, thus the analysis was done based on this two categories. All together, the
species collections were about 81 species from subfamily Satyrinae while based on genus
collections, there were 21 genera has been collected. This overall species data collection
has been arranged properly using Microsoft Excel (2007) for further analysis with R
project software and mapping the species distributions (Figure 1).
Figure 1: Procedure during research study of Modelling distribution of butterflies
(Subfamily: Satyrinae) from secondary records and database in Sarawak.