faculty recruitment and retention 1 february 2020
TRANSCRIPT

Faculty Recruitment and Retention February 2020 1

Report to SCUP on Faculty Recruitment and Retention
Office of the Vice Provost (Academic Planning, Policy and Faculty)
February 2020
Faculty Recruitment and Retention February 2020 2

History, Purpose and Format of the Report
• Beginning 2014, the Faculty Collective agreement has required an annual reporting of metrics related to faculty recruitment
• The data in this report fulfill that objective; as well, this report provides additional faculty recruitment & retention data
• Data and analyses are provided with numerical “counts” in order to allow for readers of the report to extract and review these data from a variety of lenses
Faculty Recruitment and Retention February 2020 3

Organization of the ReportThe report is organized by faculty group:
1. Probationary and Tenured Faculty2. Limited‐Term non‐Clinical Faculty 3. Part‐Time non‐Clinical Faculty4. Full‐Time Clinical Faculty
Definitions for each group and descriptions of data sources are provided.
Faculty Recruitment and Retention February 2020 4

Section 1: Probationary and Tenured Faculty
• Data are cross‐sectional counts as of October 1; the most recent data in Western’s HRIS system is October 1, 2019; the most recent UCASS (comparator) data are from the 2017‐18 data– reflected by different timelines where comparator data are used
• This section pertains to all Full‐Time Probationary (Tenure‐track) and Tenured Faculty
• includes those in senior academic administrative roles who are exempt from the UWOFA Collective Agreement provisions
Faculty Recruitment and Retention February 2020 5
Key Observations from slides 9 to 23Probationary and Tenured Faculty
• The total number of Probationary/Tenured faculty increased from 1998 to 2008, stabilized, then decreased modestly since 2015; in 2019, some of this decrease was due to a retirement incentive window
• In the 2018 data reflected in slides 10‐11, women comprise 34.8% of all Western faculty and 46.5% of Assistant Professors, illustrating increasing representation with recent cohorts
• New probationary/tenured faculty hires were approximately 50% women in the past two hiring years
Faculty Recruitment and Retention February 2020 6
Key Observations from slides 9 to 23continued
• representation of women varies by discipline (the data include all faculty thus reflect historic, as well as recent, cohorts)
• time‐to‐tenure and time‐to‐promotion shows little influence of gender but greater influence of discipline (some of this is likely explained by longer post‐doctoral training in STEM disciplines)
• Probationary cohort success rates are similar for men and women; data in slide 17‐18 reflect the cohorts who would ordinarily have completed their probationary period (more data will be presented in the June P&T report to Senate)
• Resignation patterns for tenured and probationary faculty illustrate disciplinary differences in retention with annual attrition rates of 1.66% for women and 1.38 % for men
Faculty Recruitment and Retention February 2020 7

Key Observations from slides 9 to 23 continued
• as shown in slide 22, the annual retiring rate was fairly constant among post‐60 faculty cohorts since 2006
• The count of faculty over the age of 65 increased from 2006, then stabilized in 2016 as the rate of exit due to retirement became similar to the rate of entry of new cohorts into the post‐65 age group; it decreased in 2019 as a result of an incented retirement window
• The difference between the red and black lines in slide 23 reflect individuals with a retirement plan on record
Faculty Recruitment and Retention February 2020 8

Probationary and Tenured Faculty at Western1985 ‐ 2019
Source: Western Corporate Information 1985 – 1999UCASS Data 1999 – 2009
U15 Data 2009 – 2018Human Resources Information System - 2019
Faculty Recruitment and Retention February 2020 9

Women as a Percentage of Tenured/Probationary Faculty: G‐13/U15 excluding Western vs. Western
Source: UCASS Data 2000-2009, U15 Data 2009-2017 (Data unavailable for: Laval and Montreal for 2012-2013, Montreal for
2013-2016, and Saskatchewan, 2015. Montreal data includes EcolePolytechnique & Ecole des Hautes Etudes Commericales)
Faculty Recruitment and Retention February 2020 10

Women as a Percentage of Probationary Assistant Professors,G‐13 /U15 excluding Western vs. Western
Faculty Recruitment and Retention February 2020 11
Source: UCASS Data 2000-2009, U15 Data 2009-2018 (Data unavailable for: Laval and Montreal for 2012-2013, Montreal for
2013-2016, and Saskatchewan, 2015. Montreal data includes EcolePolytechnique & Ecole des Hautes Etudes Commericales)

Gender distribution, Newly hired Tenured/Probationary Faculty at Western (including those at Western previously in a Limited
Term position): 1999 – 2019
Source: UCASS Data for 1999 – 2010 Western Human Resources Information Systems 2011 - 2019 (October)
Data excludes faculty joining from Robarts
Faculty Recruitment and Retention February 2020 12

Percentage of Women, Tenured/Probationary Faculty, 2009 to 2019
Western Human Resources Information System 2009 - 2019 (October).
Faculty Recruitment and Retention February 2020 13

Percentage of Women, Probationary Assistant Professor Rank 2009 to 2019
Western Human Resources Information System 2009 - 2019 (October).
Faculty Recruitment and Retention February 2020 14

Time to Tenure from Highest Degree(STEM and non‐STEM Disciplines)
Source: Western HR Information System
Faculty Recruitment and Retention February 2020 15
For the purpose of this analysis:• “STEM” = Faculty of Engineering, Science, Medicine & Dentistry
• Only those with > 3 years from RF to Tenure are included• Three year rolling average
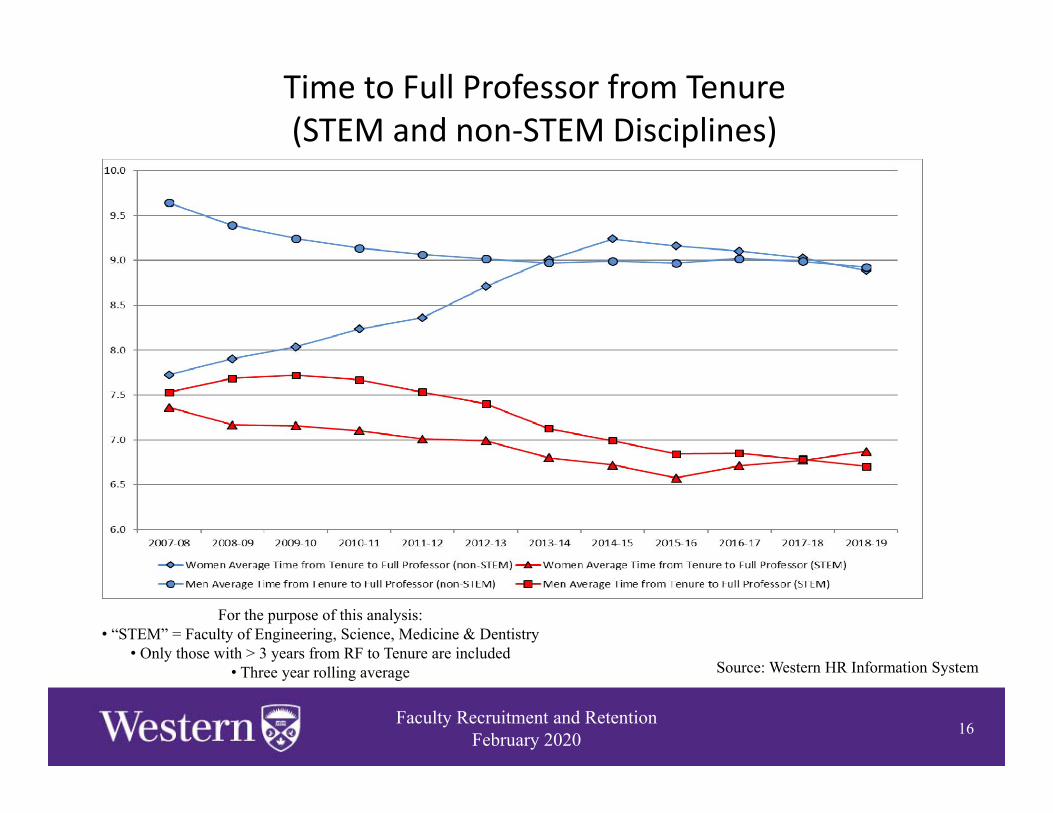
Time to Full Professor from Tenure(STEM and non‐STEM Disciplines)
Source: Western HR Information System
Faculty Recruitment and Retention February 2020 16
For the purpose of this analysis:• “STEM” = Faculty of Engineering, Science, Medicine & Dentistry
• Only those with > 3 years from RF to Tenure are included• Three year rolling average
Faculty Recruitment and Retention February 2020 17
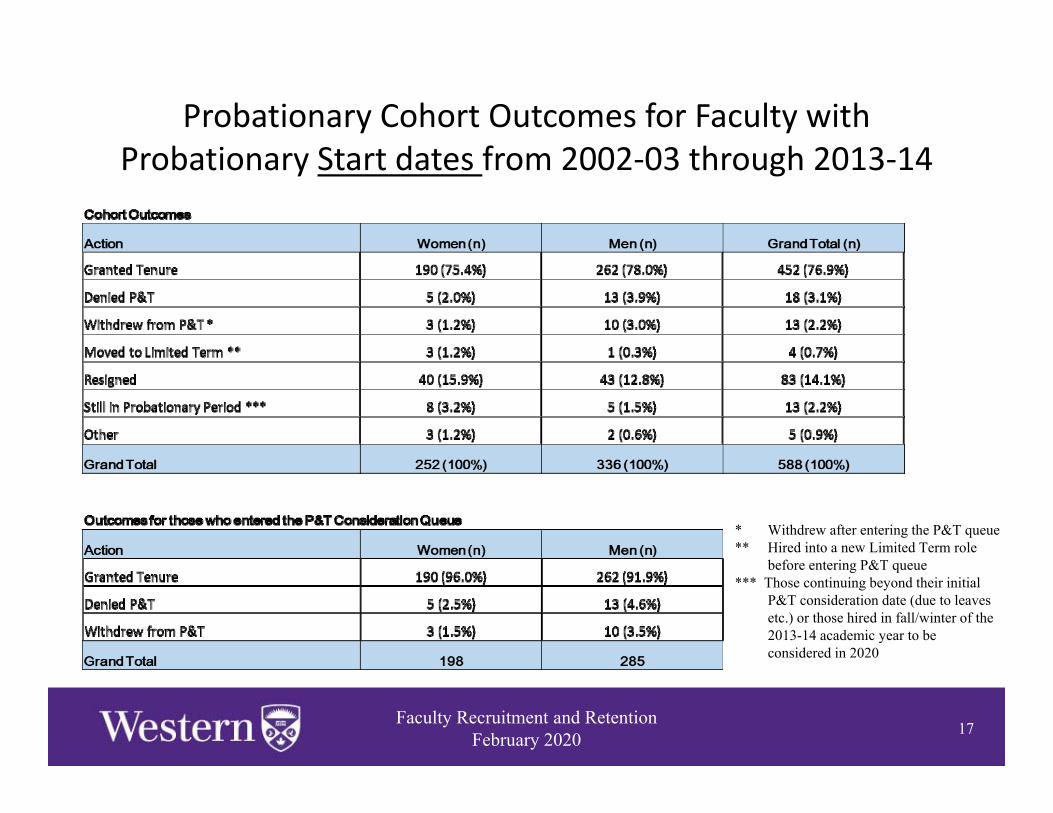
Probationary Cohort Outcomes for Faculty with Probationary Start dates from 2002‐03 through 2013‐14
* Withdrew after entering the P&T queue** Hired into a new Limited Term role
before entering P&T queue*** Those continuing beyond their initial
P&T consideration date (due to leaves etc.) or those hired in fall/winter of the 2013-14 academic year to be considered in 2020

Faculty Recruitment and Retention February 2020 18
Reasons for Resignation: Probationary Cohort withStart dates from 2002‐03 through 2013‐14

Reasons for Resignation: All Probationary and Tenuredfaculty resigning from 2004‐05 through 2018‐19
Data Source: Exit interviews conducted with the Faculty Member or Chair/Dean of the Department/Faculty and letters received from Faculty Member. Fractional numbers result when multiple reasons are given for resignation; one individual is fractionally attributed across reasons they gave.
Faculty Recruitment and Retention February 2020 19
Women: 1.66% average attrition rate (annual attrition rate = resignations/current year faculty count)Men: 1.36% average attrition rate (annual attrition rate = resignations/current year faculty count)

Total Probationary & Tenured Resignations by Faculty: resigning from 2004‐05 to 2018‐19
Faculty Recruitment and Retention February 2020 20
Source: Western Information Systems as of December 2019Includes only faculty under age 55 at the time of resignation.

Total Probationary & Tenured Resignations % by Faculty: exit dates 2004‐05 to 2018‐19
Faculty Recruitment and Retention February 2020 21

Source: UCASS 2004 – 2010UWO Data 2011 – 2019
Probationary and Tenured Faculty at Western:Cohorts Aged 60 or Greater
Faculty Recruitment and Retention February 2020 22
Age 2004 2005 2006 2007 2008 2009 2010 2011 2012 2013 2014 2015 2016 2017 2018 201960 33 36 23 37 25 23 28 38 27 25 17 28 31 34 24 3061 34 30 34 23 33 25 22 29 38 27 23 15 28 29 32 2262 32 33 30 34 22 32 24 21 28 37 25 21 13 27 31 2963 22 31 32 25 31 21 30 23 21 28 37 24 20 13 27 2864 20 21 29 32 23 30 19 30 23 21 27 36 23 19 13 2165 8 6 9 24 26 22 24 13 28 21 18 25 31 23 18 1166 0 0 0 7 20 21 19 19 11 27 20 16 23 29 17 1267 0 0 0 0 4 18 15 14 17 8 24 17 13 18 19 1268 0 0 0 0 0 3 10 13 11 16 7 20 14 10 17 1169 0 0 0 0 0 0 3 8 11 10 9 6 14 12 6 1270 0 0 0 0 0 0 0 3 8 9 7 8 4 11 11 471 0 0 0 0 0 0 0 0 3 6 7 6 8 2 9 572 0 0 0 0 0 0 0 0 0 2 5 7 4 7 2 573 0 0 0 0 0 0 0 0 0 0 2 5 7 4 7 174 0 0 0 0 0 0 0 0 0 0 0 2 4 6 3 275 0 0 0 0 0 0 0 0 0 0 0 0 1 2 5 176 0 0 0 0 0 0 0 0 0 0 0 0 0 0 2 3Total 149 157 157 182 184 195 194 211 226 237 228 236 238 246 243 209

Probationary and Tenured Faculty at Western:Continuing Beyond Normal Retirement Date (NRD)
Source: Western Human Resources Information System Cohort continuing with <= July 1 NRD in each year
Faculty Recruitment and Retention February 2020 23
Section 2: Limited Term Appointments
• Data are cross‐sectional counts as of October 1, 2019• Includes Limited Term UWOFA faculty:
– Those with fixed‐term (with end date) – Full‐time contract faculty “without end date” – Full‐time contract faculty who are “permanent”
• Does not include:– Visiting faculty– Externally funded faculty
Faculty Recruitment and Retention February 2020 24

Key Observations from Slides 26 to 29Limited Term Faculty
• On October 1, 2019 there were 218 LT faculty with the following characteristics: – 98 (45%) are women and 120 (55%) are men– 127 (58.3%) were at the Professorial ranks– Length of employment at Western
• 66 (30.3%) had been employed >12 years (therefore are either “without end date” or “permanent” or eligible for “without end date” status at next renewal)
• 114 (41.0%) have been in LT contract status for <7 years• Each vertical bar in slide 29 represents the workload of
one LT individual; most LT faculty are teaching‐intensive; other WLs are seen (e.g. Basic Scientists in a Clinical Department are often research‐focused)
Faculty Recruitment and Retention February 2020 25

Number of Individuals with Limited Term Appointments:Stratified by Gender 2003 to 2019
Source: Western’s Human Resources Information Systems 2003 – 2019 (October)
Faculty Recruitment and Retention February 2020 26

Number of Individuals with Limited Term AppointmentsStratified by Rank, 2003 ‐ 2019
Source: Western’s Human Resources Information Systems 2003 - 2019 (October)
Faculty Recruitment and Retention February 2020 27

Number of Limited Term Appointments by Years of Service2003 ‐ 2019
Source: Western’s Human Resources Information Systems 2003 - 2019 (October)
Faculty Recruitment and Retention February 2020 28

All Active Limited Term Appointments by Workload Percentages2019
Source: Western’s Human Resources Information Systems 2019 (October)
Faculty Recruitment and Retention February 2020 29

Section 3: Part‐Time Faculty
• Count of individuals employed, by fiscal year, as part‐time faculty including:– Limited Duties Appointments through competitive advertising (includes
individuals with no other employment relationship with Western as well as Post‐Retirement individuals, Extra‐Load, and Graduate Students or Post doctoral trainees who applied to an open Limited Duties competition)
– Standing Assignments and Course Authoring agreements – Post Doctoral and Graduate Student Teaching Assignments hired under
Appointments Article, Clause 3. d) of the UWOFA Collective Agreement– Excludes Limited Duties Appointments at Trois Pistoles
• In fiscal 2018‐19, there were 840 Part‐time faculty; of these, 394 were UWOFA members (taught ≥ 2 half‐courses in each of 2 of the last 3 fiscal years)
Faculty Recruitment and Retention February 2020 30

Key Observations from Slides 32 to 37Part‐Time Non‐Clinical Faculty
• In fiscal 2018‐19, of 840 part‐time non‐clinical faculty– 448 (53.3%) were women– 297 (35.4%) were at a Professorial ranks
• The number of part‐time faculty varied by discipline (in Professional programs, this can reflect the part‐time employment at Western of professionals employed elsewhere in the community)
• Most part‐time faculty are employed for low teaching loads and short duration
Faculty Recruitment and Retention February 2020 31

Number of Individuals with Part‐Time Faculty Appointments, Stratified by Gender, Fiscal Years 2002‐03 to 2018‐19
Source: Western Human Resources Information Systems
Faculty Recruitment and Retention February 2020 32

Number of Individuals with Part‐Time Faculty AppointmentsStratified by Rank, Fiscal Years 2002‐03 to 2018‐19
Source: Western Human Resources Information Systems
Faculty Recruitment and Retention February 2020 33

Degree Credit Courses taught by Part‐Time Faculty by Faculty and Gender: 2018‐19 (Fiscal Year)
Source: Western Information Systems
Faculty Recruitment and Retention February 2020 34

Number of Individuals with Part‐Time Faculty Appointments byYears of Service
2018‐2019
Source: Western Human Resources Information SystemsIncludes Consecutive Years of Service, allowing for one single year gap
Excludes Extra Load Teaching and Course Authoring Appointments
Faculty Recruitment and Retention February 2020 35
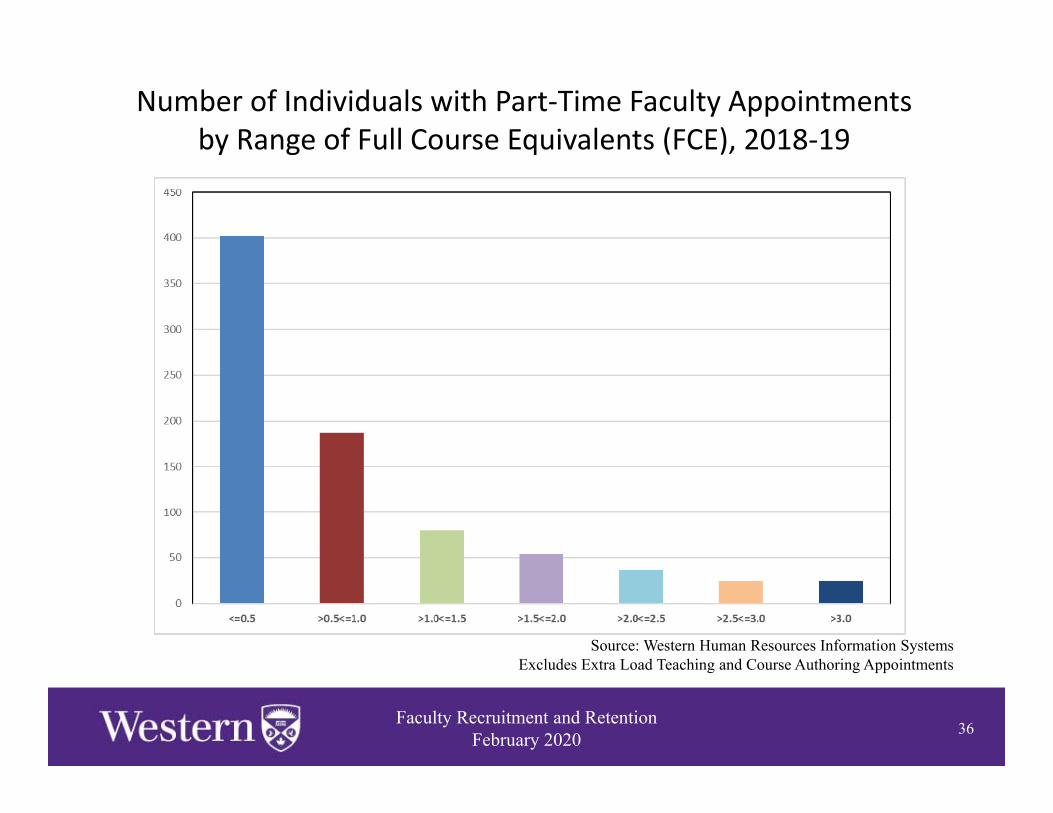
Number of Individuals with Part‐Time Faculty Appointmentsby Range of Full Course Equivalents (FCE), 2018‐19
Source: Western Human Resources Information SystemsExcludes Extra Load Teaching and Course Authoring Appointments
Faculty Recruitment and Retention February 2020 36

Number of Individuals with Part‐Time Faculty Appointments by Average Range of FCEs Taught by Years of Service 2018‐2019
Source: Western Human Resources Information
SystemsExcludes Extra Load Teaching and Course
Authoring Appointments
Faculty Recruitment and Retention February 2020 37

• Cross‐sectional counts on October 1 • Includes Physicians in Schulich hired under the “Conditions of Appointment for Physicians” under the following appointment types:– Continuing Clinical Appointment– Clinical Limited Term Appointment (some of these will go on to become Continuing Clinical Appointments since “Continuing Track” hires are initially Clinical LT)
Faculty Recruitment and Retention February 2020 38
Section 4: Clinical Full‐Time Faculty

Key Observations from Slides 40 to 44Clinical Full‐Time Faculty
• The number of Clinical full‐time faculty has been steadily increasing and is currently 880
• The percentage of women overall, inclusive of all career stages, is increasing and is currently 35.6%
• The representation of women achieved 55.2% among those hired in 2018‐19
• annual resignation rates fluctuate due to small numbers
Faculty Recruitment and Retention February 2020 39
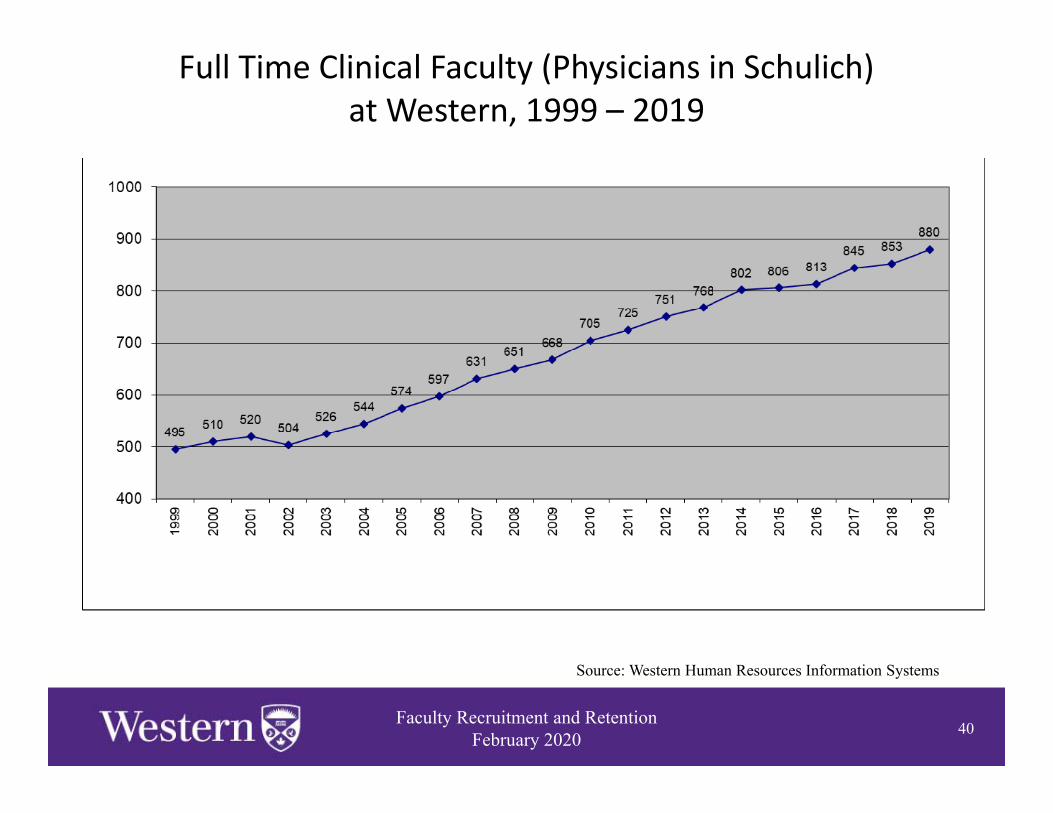
Full Time Clinical Faculty (Physicians in Schulich) at Western, 1999 – 2019
Source: Western Human Resources Information Systems
Faculty Recruitment and Retention February 2020 40

Women as a Percentage of Full‐Time Clinical Faculty at Western, 1999 – 2019
Source: Western Human Resources Information Systems
Faculty Recruitment and Retention February 2020 41

Newly Hired Clinical Full Time Faculty (Physicians in Schulich)at Western by Gender: 2000 – 2019
Source: Western Human Resources Information Systems
Faculty Recruitment and Retention February 2020 42

Percentage of New Full Time Clinical Faculty at Western by Gender: 1999‐00 – 2018‐19
Source: Western Human Resources Information Systems
Faculty Recruitment and Retention February 2020 43

Full Time Clinical Faculty Resignations by Gender2004‐05 – 2018‐2019
Source: Western Human Resources Information System
Faculty Recruitment and Retention February 2020 44
2.04% average attrition rate (annual attrition rate = resignations/current year faculty count)

For further information
• After presentation at SCUP, this report can be found at:http://uwo.ca/facultyrelations/academic_planning/Recruitment_Retention_Report_2020.pdf
• The report on Promotion and Tenure of UWOFA faculty, librarians and archivists, which is presented at the end of each promotion cycle, can be found at:
https://www.uwo.ca/facultyrelations/academic_planning/pdf/promotion‐tenure‐report‐2019.pdf
• For additional information on academic staff, Institutional Planning and Budgeting’s website contains additional data:
https://www.ipb.uwo.ca/
(Note: definitions, inclusion criteria and the dates at which data are collected will influence counts. Therefore, counts may differ slightly among
reports prepared from different data sources and for different purposes.)
Faculty Recruitment and Retention February 2020 45