recruitment and retention of faculty in computer science and
TRANSCRIPT

RECRUITMENT AND RETENTION OF FACULTY IN COMPUTER SCIENCE AND ENGINEERING
By John Stankovic and William Aspray
Computing Research Association
1100 17th Street, NW, Suite 507
Washington, DC 20036-4632
E-mail: [email protected]
Tel: 202-234-2111
Fax: 202-667-1066
URL: http://www.cra.org
CO
MPUTI
NGRESEARCH ASSO
CIA
TION
C R A
AUTHORS:
John Stankovic and William Aspray
STUDY GROUP MEMBERS:
John Stankovic, University of Virginia (Chair)
William Aspray, CRA and Indiana University
Doris Carver, Louisiana State University
C. William Gear, NEC Research Institute
Barbara Grosz, Harvard University
Juris Hartmanis, Cornell University
Jolene Jesse, AAAS
Willis King, University of Houston
Clayton Lewis, University of Colorado, Boulder
Eric Roberts, Stanford University
Henry Walker, Grinnell College
Elaine Weyuker, AT&T Labs - Research
Wei Zhao, Texas A&M University
Stuart Zweben, Ohio State University
This study and report were made possible by the generous support of the Computer and
Information Science and Engineering Directorate of the National Science Foundation (Award
EIA0107409, Principal Investigator, William Aspray).
Copyright 2003 by the Computing Research Association. Permission is granted to reproduce the contents, provided thatsuch reproduction is not for profit and credit is given to the source.
Additional copies of this report are available from CRA:
COMPUTING RESEARCH ASSOCIATION
1100 17th Street, NW, Suite 507Washington, DC 20036-4632E-mail: [email protected]: 202-234-2111Fax: 202-667-1066URL: http://www.cra.org
ACKNOWLEDGMENTS:
The following people kindly reviewed drafts of the report and provided comments that thestudy group considered in preparing the final report:
Joanne Cohoon, University of VirginiaSarah Douglas, University of OregonEric Roberts, Stanford UniversityHenry Walker, Grinnell CollegeStuart Zweben, Ohio State University
The study group appreciates the excellent work done by Patrick McMullen (CRA) who draftedthe survey forms, conducted the surveys, prepared the initial analysis of the survey results, conducted background research, assisted with the report writing, and in many other ways provided support to the study group. Our thanks to Jean Smith (CRA), who edited the report.

CONTENTS
Executive Summary................................................................................................1
1. Introduction......................................................................................................3
2. Study Methodology ..........................................................................................5
3. Faculty Retention..............................................................................................9
4. Faculty Recruitment........................................................................................21
5. Recommendations ..........................................................................................33
6. Additional Work Needed................................................................................39
Appendices:
A. Survey of Chairs of Doctoral Programs ..........................................................41
B. Survey of Chairs of Undergraduate Colleges...................................................57
C. Survey of New Hires .......................................................................................65
D. Survey of Academic Recent Job Changers ......................................................73
E. Survey of Faculty Search Committees..............................................................81


EXECUTIVE SUMMARY
This report addresses the recruitment and retention of faculty in computer scienceand engineering (CSE) in the United States. The study was initiated to address
concerns about the effect that departures of faculty to industry (e.g., dot-com com-panies) might have on the ability of universities to carry out their research and teach-ing missions. There was particular concern about the possibility of another “seed-corn” crisis—that the flight from the universities would mean not only an inadequatenumber of faculty to train this generation of information technology professionals,but also that the teaching ranks themselves would not be replenished, thereby affect-ing our ability to educate future generations of information technology workers.
During 2001 and 2002, the period in which the proposal was written and the studywas conducted, many events had an effect on the recruitment and retention of CSEfaculty—not the least being the dot-com crash and an economic recession. Clearlythe edge has been taken off the industrial pull of faculty for now. This is not to say,however, that the issue has been resolved. There remains a legacy of unfilled facul-ty positions. There is also every indication of an increasing need for computer sci-ence and engineering faculty over the long term.
The report identifies significant problems in the faculty recruitment process. Mostsignificantly, about one-third of open faculty slots remain unfilled. At the same time,competition is intense for the pool of top candidates. It is especially difficult to hirewomen and underrepresented minorities. The report also reveals that the recruit-ment process is becoming very burdensome. The recruitment season is increasing inlength, more candidates are being interviewed, and more effort is being made toencourage the acceptance of job offers. Many departments are “maxed out” in thesense of interviewing candidates almost every day during recruiting season. The costin time and money is significant.
The study found that the major reasons for accepting faculty job offers include thepresence of colleagues in one’s area of research, the ranking/reputation of thedepartment, geography, and the quality of graduate students (in that order).Reasons for rejecting offers include geography, “two-body” problems, the rank-ing/reputation of the department, and the lack of colleagues in one’s research area.
Contrary to the common perception, the study also found that faculty retention wasnot a significant issue in terms of raw numbers. Departments lost an average of less
1

than 10 percent of their faculty per year. However, 53 percent of these went toanother academic institution, 32 percent to industry, and the rest to “other institu-tions.” The loss rate to other academic departments has increased during the pasttwo years. The study also found that 18 percent of new hires came from industry.Consequently, the net loss to industry is not large. It is hypothesized that the per-ception that faculty retention is a problem comes from a combination of factors—more faculty are on leave (sabbaticals and other leaves), open slots are not beingfilled, projected open slots are not being filled, the number of faculty leaving forother academic departments is increasing, and hiring top candidates is difficult.Additionally, even though the raw numbers of faculty who leave are low, some maybe key members of the department.
Survey results indicated that departments lose faculty for many reasons, includingretirement, death, personal reasons, change to part-time status, and departures forother jobs in industry or academia. Chairs of doctoral departments reported thatthe factors that most influenced faculty to leave were, in descending order, theappeal of industry, personal reasons, salary, and departmental ranking/reputation.Undergraduate chairs reported a higher percentage of faculty losses due to death,retirement, and personal reasons than did the doctoral chairs; they also reportedfewer losses due to salary and teaching load. Academics who had recently changedjobs gave highest priority to the following reasons: access to quality graduate stu-dents; departmental morale/culture; departmental ranking/reputation; and salary.
The study makes several key recommendations. These include ways to improverecruiting by addressing: 1) personal issues (e.g., those dealing with salary and“two-body” problems); 2) environmental factors (e.g., suggesting that departmentstrategic plans be developed to articulate a vision and how the candidate fits intothis vision); 3) the recruiting process (e.g., dealing with the interview process); and4) ways to increase the pool of top candidates.
Recommendations for retaining faculty are divided into how to prevent faculty loss-es and how to react to potential faculty losses. A set of preventative measures is enu-merated. Counteroffers are highly recommended as a reactive measure, in spite ofthe potential difficulties that these may cause within a department.
Several general recommendations are also provided: 1) carefully track the facultyretention issue; 2) investigate techniques to reduce the overhead of faculty recruit-ing; and 3) develop approaches to increase the pool of CSE Ph.D.s.
Lastly, the report also recommends that a long-term process of data collection beinstituted so that recruitment and retention issues can be tracked over many years.
2

3
This report from the Computing Research Association (CRA) addresses therecruitment and retention of faculty in computer science and engineering (CSE)
in the United States. The study was initiated because of CRA’s concern about theeffect that faculty departing for industry (e.g., dot-com companies) might have onthe ability of universities to carry out their research and teaching missions. Therewas particular concern about the possibility of another “seed-corn” crisis—that theflight from the universities would mean not only an inadequate number of facultyto train this generation of information technology professionals, but also that theteaching ranks themselves would not be replenished, thereby affecting our ability toeducate future generations of information technology workers.
During 2001 and 2002, the period in which the proposal was written and the studycarried out, many events had an effect on the recruitment and retention of CSE fac-ulty—not the least being the dot-com crash and an economic recession. For now,the edge has been taken off the pull of faculty to industry. This is not to say, how-ever, that the issue has been resolved. There remains a legacy of unfilled faculty posi-tions. There is also every indication of an increasing need for CSE faculty over thelong term. No exogenous event, whether economic or terrorist-related, has curtailedthe impacts of Moore’s Law and networking technologies on the creation of infor-mation technology jobs. The continued growth of jobs in this sector creates a long-term need to ensure that we can recruit and retain adequate numbers of qualifiedfaculty in the future to teach computer science and engineering in our colleges anduniversities.
The study had three overall goals: 1) to assess the reality of faculty recruitment andretention problems in CSE (i.e., to separate fact from fiction); 2) to propose long-term tracking of recruitment and retention by identifying which data to collect; and3) to make specific recommendations for improving the recruitment and retentionprocesses.
1. INTRODUCTION

4

2. STUDY METHODOLOGY
With the study goals in mind, CRA formed a study group to evaluate prob-lems in the recruitment and retention of CSE faculty and to identify poten-
tial solutions. The group selected represents a wide range of backgrounds andinterests. Several are members of the CRA board of directors. It also includes fac-ulty from small and large universities, top-ranked and lesser-ranked research insti-tutions, schools from urban and rural settings from across the country, and schoolsboth near to and distant from concentrated centers of high-tech industry. Thestudy focuses mostly on research universities; however, since the four-year collegesalso play a role in both education and research in the information technology field,we included an expert on the subject to represent faculty at undergraduate institu-tions. Industrial research laboratories are one of the common career destinationsfor graduate students and faculty in computing, and so we also included peoplewho have worked in and managed industrial research laboratories.
While CRA controlled these appointments and the study group included CRA boardmembers, the board did not control the content of the report. The study group itselfis solely responsible for the report’s views, findings, and recommendations.
The study group met three times for two-day meetings between December 2001 andJune 2002 to refine the basic issues, identify data that needed to be collected, ana-lyze the data collected from other sources and from our own surveys, and shapefindings and recommendations. Between January and June 2002, Patrick McMullenof the CRA staff conducted five surveys (see Appendices A through E) and preparedan initial analysis of the data collected. Several subgroups (led by Clayton Lewis,Eric Roberts, Jack Stankovic, and Stuart Zweben) drafted sections of the report.Preliminary results were presented at the CRA conference for department chairs, labmanagers, and IT deans at Snowbird, Utah, in July 2002. A number of people thenreviewed and commented on the draft. The final version was prepared by JackStankovic and Bill Aspray, with staff assistance from Jean Smith at CRA.
During their three meetings, the study group identified a number of widely held per-ceptions about the recruitment and retention of CSE faculty. Some of the data col-lected were intended to confirm, disprove, or otherwise shed light on these percep-tions. The study group also identified a number of other issues that they thoughtdeserved attention, including, for example:
5

• the impact of non-sabbatical leaves on the ability of departments to cover theirteaching load;
• whether certain common recruitment strategies limit the ability of departmentsto fill their open positions;
• gender differences in the job application process;• the frequency and severity of “two-body problems”; and• the effectiveness of various kinds of interventions by administrators when faced
with the possible loss of a faculty member.
Data on these issues were collected as well. In general, the study group wanted toidentify specific issues in advance and shape survey questions that would uncoverinformation about them, and avoid the random collection of masses of data in thehope that some knowledge could be mined from them.
Overall, the process was iterative. After some discussion of key issues, the groupfirst conducted a survey of some chairs of computer science departments that granta Ph.D. Based on these results, we then conducted four additional surveys of:
1. department chairs of computer science departments at undergraduate institu-tions;
2. recent Ph.D.s in CSE;3. job changers who recently held faculty positions in CSE; and4. faculty-hiring committees in doctoral-granting CSE departments.
The sample sizes of these five surveys are small for several reasons. It was difficultto identify job changers. Our staffing, financial resources, and time were all limit-ed. And we were reluctant to burden department chairs with yet another survey, sowe selected only a minority to sample. Indeed, the first survey asked if the chairwould be willing to respond to follow-up questions, and not a single chair wantedto take the time to do this.
The questions and responses from all five surveys appear in Appendices A throughE. Information about the targeted group and the sample size is also provided foreach survey.
We compared our survey results with those of the annual surveys conducted by bothCRA (Taulbee Survey) and the National Center for Education Statistics, and thelevel of consistency among these data sets was heartening. One concern we had wasthe timing of our study, which might have taken a snapshot at just the wrong time(at the height of the dot-com bubble or at a low point after the dot-com crash).However, our data, which cover the years 1999-2002, span both of these events,and thus are less likely to be indicative of a single point in this process.
6

References are made throughout the report to Tier 1, Tier 2, and Tier 3 depart-ments. These refer to the rankings assigned by the National Research Council’sstudy Research-Doctorate Programs in the United States: Continuity and Change(study conducted in 1993, released in 1995). Tier 1 refers to departments ranked 1to 36; Tier 2 to those ranked 37 to 72; and Tier 3 to those ranked 73 to 108.
This study is the first to attempt to analyze the many different aspects of the recruit-ment and retention process from multiple perspectives. Although the sample sizes aresmall, we believe that the results suggest important issues that future studies mightexplore more fully.
The report includes a set of recommendations. They are informed, but not deter-mined, by the data that we have collected. Many of the recommendations are basedas well on the knowledge and experience of the study group members as they haveworked through these problems themselves. For example, the data show that salaryadjustments are only somewhat successful in retaining faculty, so the recommenda-tions focus on other measures. In another case, the data show that “two-body”problems influence recruiting success, so the recommendations call for departmentsto address this issue. Future empirical study could test the effectiveness of these rec-ommendations. One important aspect of the recommendations is to identify datathat should be collected on an ongoing basis.
We believe that this study, although not definitive, is a good first step toward under-standing a set of issues that will be with the computing research community formany years to come.
7

8

3. FACULTY RETENTION
There are two prevalent perceptions about the retention of CSE faculty. One isthat the loss rate of faculty to industry is high. The other is that many faculty
are being lost to other academic institutions.
Before addressing these specific perceptions, it is helpful to consider the overall rateof faculty losses. The CRA Taulbee data show that, excluding leaves of absence,there were 1.95 losses per department in AY00-01, and that this rate was up from1.36 losses in AY98-99. The average size of a doctoral department is about 20 to25 tenured or tenure-track faculty, with more than 30 faculty on average in the top-ranked institutions and fewer than 20 faculty in the lower-ranked departments.Thus the total loss rate, excluding leaves of absence, averages less than 10% peryear per department. (It should be pointed out that the vacancy rate could be muchhigher than the loss rate if unfilled positions were carried over from a previous year.Indeed, there are many such examples.)
Chairs of doctoral departments surveyed (Appendix A) reported that for facultywho left their university:
• 53% went to another academic institution• 32% went to industry• 12% went to “other”• 2% went to a non-profit organization• 0% went to government
How do we put these numbers in perspective? Is a loss rate of less than 10% high,low, or about average? Several comparisons are suggestive:
• The high-tech industry has indicated that it regards a vacancy rate of 5% as fullemployment because there are always some positions in the process of beingfilled, and having open positions provides opportunities to hire quickly whendesirable candidates become available (“evergreen positions”).
• The American physics community reports that its turnover rate had increasedto 7.3% for tenured and tenure-track faculty in 1999—not much differentfrom the rate for computer science. [APS News Online, April 2001,http://www.aps.org/apsnews/0401/040104.html]
9

10
• Annual turnover rates for the entire faculty of a university (across all disciplines)ranged from 2% to more than 10% in the mid-1990s in a survey of 13 collegesand universities. [Margaret N. Harrigan, “An Analysis of Faculty Turnover at theUniversity of Wisconsin-Madison,” presented at the 39th Annual AIR Forum,May 30-June 2, 1999, Seattle, WA. http://wiscinfo.doit.wisc.edu/obpa/FacultyTurnover/FacultyTurnover2.html]
• In the State of Texas, faculty turnover rates for AY99-00 averaged 6% for pub-lic universities and Lamar two-year institutions. The turnover rate for universi-ties with more than 500 tenured or tenure-track faculty was 5%, whereas for allother institutions it was 7%. The disciplines losing the greatest number of facul-ty (in descending order on number of faculty lost) were liberal/fine arts, healthprofessions, education, and science/mathematics. About 29% of the losses atresearch universities were of faculty moving to other academic institutions(“Faculty Turnover and Retention: A Summary of Faculty Exit Surveys at TexasPublic Universities, Health-Related Institutions, and Technical Colleges, FiscalYear 2000,” Texas Higher Education Coordinating Board, March 2001).
• Turnover rates in some low-level service positions, such as workers at fast-foodrestaurants, range up to 400% per year.
These comparisons suggest that the overall faculty loss rate for CSE is not some-thing to be alarmed about.
The doctoral chairs’ survey reveals some striking patterns regarding at what pointin their careers faculty members leave for other jobs (Figure 1). The results andsome speculations about the reasons are as follows:
Figure 1. Faculty Losses by Years of Service
01 3 5 7 9 11 13 15 17 19 21 23 25 27 29 31 33 35
2
4
6
8
Freq
uen
cy
Years at Former Institution
Source: CRA Survey of Ph.D. Department Chairs 2002.
10
12

• The largest number of faculty left after 10 years of service in their previous insti-tution. These may be people who have passed tenure and promotion to the asso-ciate level and, having established themselves, are ready to move on to higher-ranked schools or places that are better suited to their research interests. Theircareers may be in full stride and they may be close to being promoted to full pro-fessor. These faculty are often actively recruited by other institutions and may beviewed as emerging stars in their area.
• The second-largest number of faculty left their previous institution after eightyears—presumably soon after having received tenure and being promoted toassociate professor, and likely for many of the same reasons that the 10-yearcohort chose to depart. These are faculty who have proven themselves withstrong research records. They may have waited until after the tenure decision asa safety precaution that would make it easier to demand tenure elsewhere.
• A number of people left after six years, presumably because of a tenure offerfrom another school that was more suitable for them or because of concernsabout their chances for tenure at their current institution. Another frequentdeparture time was after three years. This may be because the faculty memberdecided another environment was more suitable or because of an unfavorablereport from the department after completing the initial three-year term as assis-tant professor. Faculty also may have found their environment less desirable thanthey thought it would be.
PERCEPTION: Faculty are being lost to industry.
FINDINGS: It is easy to understand why there would be a widespread perception of a signifi-cant loss of CSE faculty to industry. The dot-com boom of the mid-to-late 1990screated many opportunities for faculty to engage in industry employment involvinginteresting research and entrepreneurship. Media reports heightened the awarenessthat a migration from academia to industry was taking place. The Chronicle ofHigher Education, for example, ran a story entitled “Computer Scientists FleeAcademe for Industry’s Greener Pastures” (September 24, 1999). Similar articlesappeared in other high-profile publications, including The New York Times (EthanBronner, “Voracious Computers are Siphoning Talent from Academia,” June 25,1998). Word-of-mouth reports of prominent people leaving academia further fueledthe belief that something significant was happening nationwide. Department chairsalso were complaining about the increased number of departures and faculty tak-ing non-sabbatical leaves.
11

To investigate the accuracy of this perception, we used the following data sources:
1. The CRA Taulbee Survey. This survey collects information annually about facul-ty departures, including the number that leave for industry positions.
2. Our surveys of doctoral and undergraduate chairs. Both included questions thatshed some light on this issue. For example:
• Does the recruiting picture look any different now than it did prior to the dot-com bust?
• Did the recruiting picture change following the September 11, 2001, terroristattacks?
• How many faculty left for industry positions during the past three years, andwhat kinds of companies did they join?
• What were the ranks of the faculty who left (i.e., assistant, associate, or fullprofessor)?
• What factors (including “the appeal of industry”) did chairs believe had themost influence on a faculty member’s decision to leave?
• For chairs who answered “the appeal of industry,” what specific factors didthey believe made industry positions appealing to their faculty?
• How many faculty were hired from industry during the past year?• How have retention issues changed during the past decade?• What are your leave-of-absence policies (such as their duration) for unpaid (i.e.,
non-sabbatical) leaves, and how many faculty currently are taking such leaves?
3. Our survey of job changers. We hoped that this survey would also provide rele-vant data, but since only four of the respondents applied to industry, the sampleis too small to obtain any useful data about migration to industry.
Although many of the questions in the doctoral chairs’ survey were more aboutrecruitment than retention, it is possible to get some sense of both absolute and netloss of faculty to industry positions. The survey from doctoral-granting departmentsshowed that 18% of new hires during the past year came from industry. It alsoshowed that 29% of losses during the past three years were to industry, with a high-er percentage loss from tiers 1 and 2 than from tier 3 departments. Undergraduatedepartment chairs reported that industry hires comprised 17% of their total hires(similar to that of Ph.D.-granting departments), and the departures to industry were21% (somewhat less than that of doctoral-granting departments).
Looking at these percentages, one gets the impression that there was a net loss offaculty to industry. However, when one observes that there were more hires thanlosses during this period (that is, that departments were gaining in size), the picture
12

is reversed. For the doctoral-granting departments surveyed, total losses during thepast year were 1.3 faculty per department. Considering the fraction going to indus-try, this departure rate suggests that approximately 0.4 faculty members per depart-ment were lost to industry annually. The average number of tenure-track facultyhired in these departments during the past year was about 2.7, which suggests—given the statistics concerning the source of new faculty—that about 0.5 per depart-ment were hired from industry. Thus, this suggests there may have been a net gainof about 0.1 persons per department from industry during the past year.
It is also interesting to note that faculty departures are by no means uniformly spreadover industrial opportunities. Of faculty who moved to industry, two-thirds went toIT start-ups and one-third joined established companies with research laboratories(Lucent, IBM Watson Labs, Microsoft, Sun). None went to other industrial firms.
For undergraduate colleges, the total losses were about 1.1 per department overthree years, indicating that slightly more than 0.2 faculty per department (a littlemore than 3% of the total tenure-track size of 6.4 per department) are being lost toindustry over a three-year period. This is less than 1% per year. As with doctoral-granting institutions, the data suggest that more faculty were hired from industryduring the past year than departed to industry.
It is not possible to disaggregate the results of the chairs’ survey in order to get year-by-year trends on departures to industry; the survey only provides numbers for thepast year and the (aggregated) past three years. It is possible, however, to examineyear-by-year trends from the Taulbee data. These data show that, while the absolutenumber of departures from doctoral-granting departments to industry increasedsomewhat during the past few years, the number of departments reporting alsoincreased during this period, so that the number of departures per department wasconsistently in the 0.35 to 0.40 range—and these numbers did not change appre-ciably from year to year.
The Taulbee Survey typically includes data from 80% to 90% of the doctoral-grant-ing departments each year (for AY 2000-01, 173 of 215 departments surveyed par-ticipated). The doctoral chairs’ survey we conducted had a much smaller sample (21of 30 departments surveyed responded). How well did their numbers agree? In thecase of average annual departmental loss to industry, the results have strong agree-ment. In the case of total faculty losses, the agreement is somewhat less: the chairs’survey shows 1.3 per department for the past year and an average of 1.03 per year perdepartment as a three-year average (suggesting that the loss rate was slightly higher inAY00-01 than in the two previous years). The Taulbee Survey reported a somewhathigher total loss rate of 1.64 per department per year. In reexamining the raw data
13

from the Taulbee Survey, we noted that schools ranked 1 to 24 had a faculty loss rateof about 5 percent, whereas lower-ranked schools had a loss rate of 10 percent.
The appeal of industry was stated by 47% of chairs as one of the main reasons whythey lost faculty during the past three years. Salary and the presence of colleaguesin the same research area were the most frequent industry attractions, according todepartment chairs.
To gain a better overall picture of faculty losses to industry, non-sabbatical leaves aswell as departures should be considered because faculty often take such leaves to pur-sue their entrepreneurial aspirations or join a start-up. The chairs’ survey providesinformation about these leaves. On average, two persons per department were onnon-sabbatical leave during the past year. Departments typically cap the length of non-sabbatical leaves at either one or two years (about equally divided between theselengths). A few schools have a three-year maximum and a small number of schoolshave no official limit. The average length of leave is a little over a year, but the aver-age longest leave is 2.3 years. This number is so high because 23% of the departmentsreported breaking their policy and allowing a leave longer than their stated maximumto at least one faculty member. Several chairs report that retention is a more seriousproblem now than in past years, but only once was industry mentioned as a maincause. Many chairs reported that retention is no more serious now than it used to be.
The departure rate of faculty to industry appears to be relatively small, and, byitself, the rate does not suggest a significant retention problem. This rate does notseem to have increased on a per department basis during the past few years. Somedepartments may, however, have a problem with a large number of entrepreneurialleaves. The more highly ranked departments, for instance, are more apt to have alarge number of people on leave. These leaves are not necessarily bad for the depart-ment or for the field, although they do reduce the number of faculty who areengaged in the department on campus. For a few departments, however, the com-bination of those on entrepreneurial leave and those who have recently departed(whether to industry or elsewhere) may present a significant retention problem.
The study group also received anecdotal evidence that some people do not re-inte-grate well into the departments after they return from an entrepreneurial leave.These included people who exhibited less commitment to teaching and service, lesswillingness to tolerate the academic processes of decision-making and change, andbad attitudes about having to resort to an academic career because certain entre-preneurial opportunities were no longer available.
Problems involving faculty migration to industry, therefore, appear relatively iso-lated. There does not seem to be a high correlation in our data between faculty
14

15
departures to industry and the dot-com boom. Obviously some faculty did leavetheir universities to join start-ups, and the dot-com crash may have reduced onethreat of faculty loss. However, our chairs’ survey indicates that the total number offaculty departures in this past year—that is, during the year of the dot-com bust—was slightly higher than during the previous two years, during the height of the dot-com boom. And this increased number does not include those people (about twoper department) on non-sabbatical leave. The Taulbee data also show a slight risethis past year in the number of departures per department for non-academic posi-tions. One possible explanation is that these data reflect a residual of previous entre-preneurial leaves (i.e., several persons who are shown as having left the departmentthis year to work for industry could be resignations that were a byproduct of entre-preneurial leaves in the previous two years. The survey instrument does not havethe depth of questioning to fully explain the data).
Thus, in conclusion, it appears that there is not a serious problem of faculty flightto industry—and that one did not exist even at the height of the dot-com phenom-enon. In fact, there appears to have been a recent net flow of people from industryto academia in CSE, not the other way around. Certainly this statement is true forthe most recent year for doctoral departments and for all three years for under-graduate departments. It may be true for the first two years of doctoral depart-ments, but we do not have sufficient data to be certain.
PERCEPTION: Faculty are being lost to other academic institutions.
FINDINGS:Like the discussion of faculty losses to industry, it is also easy to understand whymany computer scientists might believe that faculty are being lost in significantnumbers to other research-oriented academic departments. Vacant positions appearto be more plentiful in recent years than in the past. At the same time, there havebeen fewer new Ph.D.s on the market (Figure 2), and a greater fraction of Ph.D.shave chosen industry positions during the past decade (Figure 3).

16
Figure 2. Average Number of Doctorates Produced Per Department 1992-2001
Figure 3. Academic Employment vs. Industry Employment forNew CS/CE Ph.D.s 1992-2000
While some vacant academic positions have been filled by hiring people from indus-try and universities overseas, anecdotal evidence abounds that there has been con-siderable movement of faculty from institution to institution. This phenomenon isknown colloquially as churn (although from the perspective of department chairs it
0
0
10
20
30
40
50
60
1992 1993 1994 1995Year
Perc
ent
of P
h.D
.s
University Employment Industry Employment
1996 1997 1998 1999 2000
1
2Ave
rag
e p
er D
epar
tmen
t
Academic Year
Source: CRA Taulbee Surveys.
Source: CRA Taulbee Surveys.
1992
6.5
7.3 7.37.7
7 7.2
6.5
5.55.1 5.2
1993 1994 1995 1996 1997 1998 1999 2000 2001
3
4
5
6
7
8
9
Figure 3. Academic Employment vs. Industry Employment forNew CS/CE Ph.D.s 1985-2001
Year
University Industry
20
10
01985 1986 1987 1988 1989 1990 1991 1992 1993 1994 1995 1996 1997 1998 1999 2000 2001
30
40
50
60
70
Perc
ent
of P
h.D
.s
Source: CRA Taulbee Surveys.

17
might also be considered raiding). Some university administrations have respondedquickly to provide new faculty slots. Overall, about one-third of the slots remainopen because of difficulties in recruiting. These open positions can contribute to asituation where the faculty and chair are overwhelmed by the current workloadwithout the extra faculty needed to do the job.
At other universities, some faculty and department chairs claim that their institu-tions are not reacting to the growth in computer science enrollment by increasingthe resources for their department. There are also many complaints about salarycompression and inversion caused by the sharp rise in starting salaries for new com-puter science faculty, as departments compete for the diminishing pool of newPh.D.s to fill an increasing number of jobs. (Salaries for new Ph.D.s reported inCRA’s Taulbee Survey were increasing by 6% to 8% per year over a period of sev-eral years, while overall computer science faculty salaries typically were increasingby less than the rate for these new graduates.) Departments have made an effort tokeep salaries for current junior faculty from getting too far behind salaries of newhires (figure 4); despite these efforts, however, current junior faculty have beenfalling further behind, with a cumulative effect of more than 10% over three years.
Figure 4. Salary Increases (Percentage) for New Hires andAssistant Professors 1997-2001
We used various data sources to examine faculty losses to other institutions:
1. The surveys we conducted of doctoral and undergraduate chairs provide infor-mation on a number of related issues, including:• number of faculty who left during the past three years to join other academic
institutions;
1997-980
2
4
6
8
10
12
14
1998-99Year
Perc
enta
ge
Incr
ease
Source: CRA Taulbee Surveys.
1999-2000 2000-2001
New HiresAssistant Professors

18
• institutions they selected;• factors that most influenced them to leave;• where they were in their career path;• why people who considered leaving decided to remain;• what chairs identified as the main retention issues in their department;• what they were doing to try to prevent retention from being a problem;• how chairs addressed retention problems once they surfaced; and• what help/support chairs received from their university administration in
dealing with retention issues.
2. The survey we conducted of recent job changers provides:• most important factors that caused them to change jobs;• criteria they used to decide where to apply for a new position;• criteria that most influenced their choice among competing offers;• their former department’s response, if any, when they learned that they were
considering leaving; and• migration patterns in terms of the ranking of the current and former academic
employers.
3. The CRA Taulbee Survey results provide the number of people leaving graduatedepartments for various kinds of employment.
The doctoral chairs’ survey results (Appendix A) indicate that departments lost fac-ulty for many reasons, including retirement, death, personal reasons, change topart-time status, and departures for other jobs in industry or academia. Of full-timefaculty losses, 53% moved to other academic positions, by far the most commonreason given for faculty loss. The average annual faculty loss to another academicdepartment is approximately 0.5 persons, which represents about 2.5% of the totaltenure-track faculty.
The Taulbee Survey suggests a recent increase in losses to other academic departments.The most recent Taulbee data show a departure of 0.80 faculty per department toother academic positions, up from 0.48 per department just two years earlier.
The job-changers’ survey (Appendix D) suggests that it is relatively easy for facultyto find another faculty position. On average, respondents submitted 5.2 applica-tions each and received 3.1 offers to interview (or 1 interview for every 1.8 appli-cations submitted). The average applicant received 2.1 job offers (or 1 offer forevery 2.6 applications submitted).
Department chairs report that the factors that most influenced faculty to leave werethe appeal of industry (in 47% of departments), personal reasons (42%), salary

(32%), and departmental ranking/reputation (32%). However, the data indicatethat there was no real difference in departure rates by the ranking of the institutionthe faculty member left, that most faculty churn occurred within the same rankingtier, and that about as many moved to a lower tier as moved to a higher tier. Theaverage time to departure was 10.7 years, but, as noted earlier, the greatest numberof departures occurred after years 10, 8, 6, and 3, respectively.
In the survey of doctoral department chairs, offering a salary adjustment was theapproach cited most frequently to prevent retention problems, followed by provid-ing better facilities and staff support; trying to attract more and better Ph.D. stu-dents; and promoting teamwork, communication, and collegiality within thedepartment. A salary adjustment was also mentioned most often as a way ofaddressing an individual retention problem once it has surfaced; this often involvesmaking a suitable counteroffer. However, we do not know from the data how oftenthe steps taken to address retention problems have been successful. Some deanshave been very supportive of retention efforts, others less so. But it does seem gen-erally true that deans are much more reactive than proactive in addressing facultyretention. Some chairs lamented that their administration has been neglectful oftheir department for several years running.
Undergraduate department chairs (Appendix B) reported a higher percentage oftheir faculty losses due to death, retirement, and personal reasons than did the doc-toral department chairs. In undergraduate colleges, 37% of the faculty losses wereto other schools; and like the doctoral departments, this percentage was higher thanfor those who left for industrial positions. The loss rate to other academic institu-tions was about 0.13 faculty per year, representing about 2% of total faculty. Salaryand teaching load were each mentioned as reasons in about one-sixth of the facul-ty losses—a lower number than for the graduate departments. In undergraduatecolleges, the retention issues cited most frequently by chairs are salary (51%), teach-ing load (32%), general workload (30%), and geographical considerations (26%).Departmental ranking is not a factor for the undergraduate colleges.
The job-changers’ survey results showed striking gender differences in the reasonscited for changing academic jobs. Men cited access to quality graduate students,department morale/culture, departmental ranking/reputation, and salary as themain reasons why they left their former institution. Women cited access to qualitygraduate students, department morale/culture, and the presence of colleagues in thesame research area most frequently. Among males, 43% selected “salary” as a rea-son for leaving, compared with only 13% of women. While 43% of men selected“departmental ranking/reputation,” only 25% of women did so.
19

These two gender differences are also mirrored in the survey of new hires (Appendix C).In deciding where to apply for faculty positions, men overwhelmingly cited depart-mental ranking/reputation as a key criterion in deciding where to apply, followed byaccess to quality graduate students. No other factor was cited by more than 35% ofthe men. Women cited departmental ranking/reputation, access to quality graduatestudents, presence of colleagues in their research area, and geography (each of thesefactors cited by at least half of the women) as the main factors in deciding where toapply. Here the gender differences are most striking, in that men valued salary (28%to 0%) and departmental ranking (76% to 50%) more highly than women.
An interesting gender pattern also was evident in the number of applications sub-mitted. In the new hires’ survey, women submitted far fewer applications than men(6 per person for women, 25 per person for men). But in the job-changers’ survey,women submitted slightly more applications on average than men (5.6 to 5.1), sug-gesting that women had “learned the game” of faculty hiring after being in acade-mia for a few years. Interestingly, almost half (47%) of all job changers—both menand women—applied for only one or two faculty positions.
Gender differences were far less evident in responses to the job-changers’ surveywith respect to the deciding factors when choosing among multiple offers ofemployment. Both men and women cited departmental ranking/reputation first, fol-lowed by geography and access to quality graduate students, and then salary andpresence of colleagues in their research area.
According to job changers, the offer of a salary increase was the only systematicresponse that departments made to counter an impending departure. The main rea-son cited for the inadequacy of departmental responses was the inability to changethe department’s culture, morale, or reputation, relative to their new institution.Better institutional support was cited most often by job changers as a factor thatmight have made a difference in keeping them at their former institution.
In conclusion, while losses to other academic institutions were higher than those toindustry, the numbers do not seem to be very high per department. However, thelosses per department definitely have increased during the past several years. Thetotal retention problem may be more serious for some departments when the num-ber of faculty losses to industry is combined with the number of faculty on leave.For higher-ranked departments, which tend to have larger numbers of faculty, theabsolute attrition numbers tend to be higher and this is what is being noticed. Forlower-ranked departments, even though the total attrition percentages are compa-rable, the people who are leaving or on leave may represent a more significant frac-tion of the best people in the department. Here the effect on the department’s effortsto become stronger is more serious.
20

4. FACULTY RECRUITMENT
Acommon perception about CSE faculty recruitment is that academic institu-tions cannot hire enough qualified faculty. Four intertwined assumptions are
involved:
1. Universities are not producing enough Ph.D.s.2. Most Ph.D.s take positions in industry.3. There is intense competition for the pool of top candidates.4. It is especially difficult to hire women and underrepresented minorities.
Our surveys, along with data from the larger CRA Taulbee Survey, confirm the firstand third of these assumptions, and lend qualified support to the other two.
As seen earlier in Figure 2, the average Ph.D. production per department has fallenfrom a high of 7.7 in 1995 to a low of 5.1 in 2000. With the end of the dot-comboom, however, there are signs that future Ph.D. production might once againincrease substantially. The 2000-01 Taulbee Survey showed a 31% increase in thenumber of people entering Ph.D. programs in computer science, an 11% increase inthe number passing their qualifying exams, and a 16% increase in those passing theirthesis proposal exams. This increase in doctoral candidates may improve the balancebetween faculty supply and demand over the coming years. Of course, relying oneconomic downturns to spur graduate enrollments is not a sustainable strategy. Thusit seems unlikely that the problem of low Ph.D. production will be self-correcting.
The second common assumption—that most Ph.D.s go to industry instead of acad-emia—has been true during the past decade. The percentage of doctoral recipientsaccepting employment in industry has increased since the late 1980s from about40%, reaching a peak of about 60% in 1997, and receding to a little more than50% during the past year (Figure 5). At the beginning of the same period, the per-centage of doctoral recipients going to academia was nearly 60%, dropped toaround 40% in 1997, and has been increasing since that time. The gap betweenindustry and academia was about 20% in favor of academia in the late 1980s, flip-flopped to around 20% in favor of industry by 1997, and has closed since 1997 toabout 6% in favor of industry during the most recent year. Thus, during the heightof the dot-com boom there was a clear trend in favor of industry and a marked dif-ference from the situation during the preceding decade. However, with the burst ofthe dot-com bubble, the signs are pointing toward another possible change.
21

Figure 5. Academic Employment vs. Industry Employment forNew CS/CE Ph.D.s 1985-2001
The third assumption, that competition for the top candidates is intense, is sup-ported by some circumstantial evidence in our surveys. The new hires’ survey showsthat candidates from the top tier of graduate institutions (NRC rank 1-36) inter-viewed at 8.0 departments and received 4.3 offers, tier 2 graduates received 3.6interviews and 1.9 offers, and tier 3 graduates received 4.4 interviews and 3.0offers. Clearly there is some overlapping demand for the best applicants.
Although the difficulty of recruiting quality faculty is in part a supply problem, withtoo few Ph.D.s being produced and too few going to academic institutions, there isan equally pressing problem of demand. The number of academic positions hasgrown faster than the number of new Ph.D.s taking academic positions. In theannual Taulbee Survey, total faculty sizes reported (including tenure-track faculty,lecturers, and research faculty) have increased steadily over the past 5 years, withthree of those years showing a double-digit percentage increase from the previousyear (Figure 6). However, after accounting for the difference from year to year inthe number of departments providing data, the increases, particularly in the earlierperiod during the height of the dot-com boom, are more modest (Figure 7).
22
Year
University Industry
20
10
01985 1986 1987 1988 1989 1990 1991 1992 1993 1994 1995 1996 1997 1998 1999 2000 2001
30
40
50
60
70Pe
rcen
t of
Ph
.D.s
Source: CRA Taulbee Surveys.

Figure 6. Total Faculty Sizes Reported 1995-2001
Source: CRA Taulbee Surveys.
Increasing undergraduate enrollments and faculty departures have created manynew and open positions that have outnumbered the new Ph.D.s who might fillthem. According to the Taulbee Survey, estimated open slots, either from the cre-ation of new positions or faculty losses, outnumbered new Ph.D.s going to acade-mia by a total of 325 during the two-year period 1997-99. That number more thandoubled to 735 in the subsequent two-year period (Figure 7). Although we do nothave longitudinal data showing how many of those open positions were eventuallyfilled, our surveys do reveal that doctoral institutions filled 66% of their open posi-tions in the last academic year, while undergraduate colleges filled 64%. Recent eco-nomic changes would predict that there will be better balance in the new Ph.D. sup-ply and demand in the near future.
Figure 7. Change in Positions Open
23
098-99 99-00 00-0198-9995-96 96-97 97-98
Num
ber
99-00 00-01
1000
2000
3000
4000
5000
6000
Years
Year
Totalfaculty
reported
No. of depts.
reporting
Adjusted total for
00-01depts.1
Differencefrom prev.
year
Totaldeparturesreported
Adjusteddeparturesfor 00-01depts.2
Estimatedtotal
openings
ReportedPh.D.s
going toacademic
depts. Difference
96-97 3491 135 4251 177 227 23797-98 3947 144 4527 276 205 246 522 274 24898-99 4344 157 4664 137 211 233 370 293 7799-00 4939 166 5079 415 275 287 702 273 42900-01 5344 173 5344 265 335 335 600 294 306
Source: CRA Taulbee Surveys.1Estimate of 20 faculty per departments not reporting in earlier years.2Based on the same rate of departures per department for departments not reporting in earlier years.

In a perfect system, every open position would be filled by a qualified and appro-priate candidate. If one-third of open positions remain unfilled, then obviously aproblem exists. To this extent, the common perception that recruiting is difficult,and sometimes even futile, is correct. The source of this difficulty is less obvious,however, and the reasons seem to go beyond supply and demand. Thus we surveyedfresh Ph.D.s, faculty moving from one institution to another, faculty search com-mittees, and department chairs in an effort to find out how the recruitment processworks, or in some case does not work, and why it succeeds or fails.
Our survey of chairs of Ph.D.-granting CSE departments was a first attempt to isolatethe answers to these questions. The results showed an average of four open positionsper institution, with little variation between top-tier and lower-ranked institutions.Tier 1 departments did receive more applications per open position (36) than did tier3 schools (21), indicating that more candidates are vying for jobs at the highest-rankedinstitutions. Of the many applications departments received, chairs indicated that only25% were “seriously considered,” meaning that three-quarters were quickly deemedunacceptable and set aside. This lends some support to anecdotal reports that depart-ments receive many untargeted, inappropriate, and uncompetitive applications(although some might say that departments set their standards too high).
These department chairs reported that 22% of their new hires are women, less than1% are underrepresented minorities, and 36% were not U.S. citizens at the time ofhiring. While 75% of chairs said that hiring women and minorities was a priority fortheir departments, 56% reported having difficulty finding and hiring such candidates.
Chairs identified a number of problems generally in their recruitment efforts (Figure 8).
Figure 8. Recruitment Problems Reported by Ph.D. Department Chairs
24
Quality grad students 65%
Ranking/reputation 50%
Salary 40%
Geography 40%
Startup packages 30%
General workload 25%
Teaching loads 20%
Source: CRA Survey of Ph.D. Department Chairs 2002.

25
Recruiting problems seemed to vary by departmental rankings. Lower-tier institu-tions reported more problems due to their inability to attract quality graduate stu-dents, salaries offered, and their ranking/reputation (Figure 9). Top-tier institutionsreported many of the same problems, but to a much lesser extent.
Figure 9. Recruiting Problems Reported (by Departmental Rankings)
We also asked department chairs why they thought most candidates had eitheraccepted or declined their employment offers. Figure 10 shows the results, with geog-raphy, “two-body” problems, departmental rankings, and access to quality graduatestudents leading the list of reasons why offers were declined. Offers were acceptedbecause of the presence of colleagues in the same research area, departmental rank-ings, geography, and graduate students. The one notable difference between theselists is the percentage citing “two-body” issues as a motivating factor: 55% of thosewho lost a candidate said that “two-body” problems were partly to blame, while norespondents offered the resolution of this issue as a reason they were able to hire fac-ulty. This may be because employment for a spouse or partner is seen as a “gatewayissue,” in that resolving this problem is not a reason for someone to accept an offer,but it does make it possible to consider the offer on its merits.
Quality grad students 65%
Ranking/reputation 50%
Salary 40%
Geography 40%
Startup packages 30%
General workload 25%
Teaching loads 20%
Source: CRA Survey of Ph.D. Department Chairs 2002.
AverageTier 1 (NRC 1-36)Tier 2 (NRC 37-72)Tier 3 (NRC 73-108)

Figure 10. Ph.D. Chairs’ Reasons Why CandidatesRefused/Accepted Offers
Our survey (Appendix C) of new faculty hires (those hired at the associate or assis-tant level in the past three years) honed in on a candidate’s criteria for decidingwhich positions to apply for and which offers to accept. It is important to note thatour sample may have been unrepresentative of the candidate pool as a whole. Thepeople surveyed were highly motivated young faculty who were driven to succeed,and perhaps their experiences and qualifications do not match those of the averageapplicant. On the other hand, respondents were fairly well distributed among theranks of graduate institutions, with 59% coming from tier 1 institutions and 41%from tiers 2 or 3. Even if the sample is somewhat skewed toward the most qualifiedcandidates, their perceptions would seem important to any department seeking tohire the best and the brightest.
The new hires we surveyed reported a very favorable climate for job seekers. Theaverage applicant applied for 22 positions, had 6 interviews, and received 3.5 offers.These patterns vary somewhat by the ranking of the student’s graduate institution.
• Tier 1 (NRC rank 1-36) graduates had 8.0 interviews and 4.3 offers.• Tier 2 (NRC 37-72) graduates had 3.6 interviews and 1.9 offers.• Tier 3 (NRC 73-108) graduates had 4.4 interviews and 3 offers.
New hires reported using fairly similar criteria when deciding where to apply andwhich offers to accept (Figure 11). Ranking/reputation and geography were amongthe top factors, with the department’s morale/culture cited as a recruiting draw by38% of respondents.
26
Reasons for refusing offerGeography 55%Two-body problem 55%Ranking/reputation 45%Quality grad students 35%Colleagues in area 30%Space/facilities 30%Salary 20%Cost of living 20%Startup package 15%Teaching load 10%General workload 5%Tenure process 5%Chance for impact 0%Publishing pressure 0%
Source: CRA Survey of Ph.D. Department Chairs 2002.
Reasons for accepting offerColleagues in area 75%Ranking/reputation 50%Geography 45%Quality grad students 35%Cost of living 20%Teaching load 20%Salary 15%Startup package 10%General workload 10%Space/facilities 5%Two-body problem 0%Tenure process 0%Chance for impact 0%Publishing pressure 0%

Figure 11. New Hires’ Reasons for Applying/Accepting Job Offer
Despite the emphasis on rankings and graduate students, many new hires acceptedfaculty positions at institutions ranked lower than their graduate institution, indicat-ing some “trickle-down” of Ph.D.s from higher- to lower-ranked departments. Incomparing the NRC rankings of the departments that hired the respondents with therankings of the departments that granted their degree, the average tier 1 graduatemoved down almost a full tier, while tier 2 graduates remained in roughly the sametier and tier 3 graduates moved up half a tier. Although only 21% of respondentsreceived their Ph.D.s from tier 3 institutions, 41% were hired by those institutions.
Our survey of faculty search committees (Appendix E) requested some of the sameinformation as the new hires’ survey, but the results showed a less positive atmos-phere for job seekers. The new hires’ survey included only applicants who had actu-ally obtained a job, which may explain why the search committees reported a muchhigher ratio of applications to offers than the new hires reported. According to thesearch committees:
• Only 23% of open positions went unfilled. (Note that this is different from theresponses of the department chairs, who reported that 33% of positions gounfilled.)
27
Reasons for applyingRanking/reputation 71%Geography 62%Focus on research 41%Balance teaching/research 38%Department morale/culture 38%Quality graduate students 32%Spouse/partner employment 24%Colleagues in research area 21%Advisor's recommendation 18%Salary 18%Strong department support 18%Startup package 15%Focus on teaching 1%Facilities/equipment 1%Recommendation of peers 1%Publishing pressure 1%Cost of living 0%Quality undergrad students 0%Other 0%
Source: CRA Survey of Ph.D. Department Chairs 2002.
Reasons for accepting offerGeography 41%Ranking/reputation 38%Department morale/culture 38%Salary 29%Startup package 26%Quality graduate students 24%Strong department support 21%Focus on research 21%Balance teaching/research 21%Colleagues in research area 21%Other 15%Advisor's recommendation 12%Spouse/partner employment 9%Facilities/equipment 1%Recommendation of peers 1%Cost of living 0%Focus on teaching 0%Quality undergrad students 0%Publishing pressure 0%

• One interview was granted for every 12.7 applications (compared with the 1.0 to3.5 ratio from the new hires’ survey).
• One offer was extended for every 43 applications (compared with the 1 to 6 ratiofor new hires).
Many applications were summarily rejected for reasons that are not entirely clearfrom our survey. It may be that such candidates clearly did not meet even the min-imum threshold set by the search committee for the position, or that limitations orinefficiencies in the search process, not the candidate’s qualifications, were respon-sible for most of the early cuts. The most common characteristics of an obviouslyunviable application, according to the search committees, include a poor researchand publishing record, a poor area match for the department’s needs, and a Ph.D.from a lower-ranked institution or a foreign institution of unknown quality.
The search committee survey also mirrored the finding of the chairs’ survey that thenumber of applications varies by institutional rank. Tier 1 schools received 67 appli-cations per open position, tier 2 schools received 54 applications per position, andtier 3 schools received 47 applications per position. According to the new hires’ sur-vey, many of these applicants are also applying to, and interviewing with, otherinstitutions. This would explain why 67% of search committees surveyed reportedlosing their second candidate while waiting for a decision from their first candidate,and 20% said it happens frequently or very frequently. Of the schools surveyed,52% are able to make more offers than they have positions open, but there is noconclusive evidence that multiple offers substantially improve the chances of hiringa good candidate.
After hearing anecdotal accounts of a recruiting crisis in the undergraduate colleges,we decided to ask chairs of CSE departments at these colleges the same questionswe asked chairs of Ph.D. departments. This allowed us to construct a more com-plete picture of the recruiting environment at the colleges:
• Colleges averaged 0.7 open positions per institution, which, scaled by depart-ment size, is roughly half the number open at Ph.D. institutions (2.2 vs. 4.0).
• Colleges received approximately 10 applications per position, compared with 30reported by Ph.D. department chairs. Even the lowest tier of Ph.D. departments(NRC 73-108) received an average of 21 applications per position.
• Only 40% of applications were “seriously considered,” a result that somewhatsupports anecdotal claims that colleges receive many untargeted and inappropri-ate applications.
28

29
• 64% of open positions were filled, about the same as the 66% reported by Ph.D.department chairs.
• 32% of new hires are women (compared with 22% in Ph.D. departments).
• 41% of new hires were not U.S. citizens at the time of hiring (vs. 36% in Ph.D.departments).
• Like the Ph.D. departments, most new hires at colleges came from academia,with 27% from new Ph.D.s, 51% from other academic institutions, and 17%from industry.
• On balance, colleges gained more faculty from industry than they lost.
CSE departments in undergraduate colleges indicated a number of general recruit-ing problems, with salary, teaching load, and general workload topping the list(Figure 12). The obstacles to recruiting reported by college chairs were very differ-ent from those of their counterparts at Ph.D. schools. Among colleges, 61% citedteaching loads as a recruiting problem, compared with 20% of Ph.D. schools; andonly 5% of colleges worried about attracting quality graduate students, while 65%of Ph.D. schools described this as a barrier to recruiting.
Figure 12. Recruiting Problems Reported by Undergraduate Chairs
Salary 79%
Teaching load 61%
General workload 34%
Geography 32%
Startup packages 27%
Ranking/reputation 18%
Quality grad students 5%
Don't know 4%
Source: CRA Survey of Undergraduate Chairs 2002.

When we asked department chairs at undergraduate colleges why candidates hadaccepted or declined their offer of employment (Figure 13), more differences fromthe Ph.D. schools appeared:
• 59% of colleges lost candidates because of salary, compared with 20% of Ph.D.institutions. This is not surprising, given the low salaries offered by many under-graduate colleges. The average salaries for full, associate, and assistant professorswere 71%, 79%, and 73% of salaries for the same ranks at Ph.D. institutions.
• 38% of colleges lost candidates because of teaching loads, compared with just10% at Ph.D. schools. The average teaching load in the undergraduate depart-ments surveyed was 6.8 classes per year. According to 1999 data from theNational Center for Education Statistics, only 30% of faculty at Ph.D.-grantingCSE departments taught this many or more courses per year.
• Although 55% of Ph.D. chairs cited the “two-body” problem as a reason for los-ing candidates, only 14% of the colleges said the same. This may be because 61%of candidates at the colleges are accepting offers based, in large part, on geogra-phy, which may be the “two-body” issue with a different label.
• 45% of Ph.D. schools lost candidates because of their ranking/reputation, versus11% for the colleges. Among Ph.D. schools, 75% cited the presence of colleaguesin the same research area as a reason candidates accepted their offers, comparedwith only 6% of colleges.
30
Reasons for refusing offer
Salary 59%Teaching load 38%Geography 27%Two-body problem 14%General workload 12%Colleagues in area 12%Ranking/reputation 11%Cost of living 10%Quality grad students 9%Don't know 9%Space/facilities 9%Chance for impact 5%Tenure package 2%Startup package 1%Publishing pressure 0%
Source: CRA Survey of Undergraduate Chairs 2002.
Reasons for accepting offer
Geography 61%Salary 19%Ranking/reputation 19%Cost of living 17%Two-body problem 10%General workload 8%Tenure process 7%Don't know 6%Colleagues in area 6%Teaching load 6%Publishing pressure 4%Space/facilities 4%Quality grad students 2%Chance for impact 1%Startup package 1%
Figure 13. Undergraduate Chairs’ Reasons Why CandidatesRefused/Accepted Offers

For colleges, the main reason candidates refused their offer was salary and the mainreason they accepted was geography. Especially in the case of acceptances, geogra-phy dominated the list, indicating that a college’s location was far and away themost important factor in recruiting candidates.
FACTORS IN RECRUITMENT OF WOMEN
In the course of our surveys, we found a number of interesting results relevant tothe recruitment of women. While the number of women in our samples was gener-ally too small to draw any firm conclusions, the following should spark some inter-est in further research targeted at the question of gender differences in recruitmentand retention:
1. As new Ph.D.s, women submitted far fewer applications than men and receivedmany more offers per application. Female new hires applied for only 6 positions(compared with 25 for men), obtained 0.77 interviews per application (vs. 0.37for men), and received 0.55 offers per application (vs. 0.19 for men). Obviouslywomen were much more selective in where they applied, and also much more suc-cessful in the application process, but the reasons for this selectivity are unclear:
• Women may have been more efficient in their searches, only applying to thepositions that fit them best, or they may have underestimated their value andsubmitted fewer applications than they should have.
• The latter theory is partly supported by two additional results from our sur-vey. First, the job-changers’ survey shows women applying for slightly morepositions than men. This may indicate that women have learned how to gamethe system more effectively or have gained more confidence in their abilities.Second, if women are underestimating their value, they may be applying toschools with lower hiring standards, which would explain their high ratio ofapplications to offers.
2. Factors determining which jobs to apply for and which offers to accept weredifferent for female and male new hires:
• For female respondents, the presence of colleagues in the same research area(44%) and access to quality graduate students (44%) were the most importantfactors in choosing a job, while these factors were much less important tomales. Only 12% of male respondents ranked colleagues in their research areaas one of their top four factors in choosing a position, and 20% included grad-uate students in that list.
31

• Departmental ranking and reputation were far more important to men; 44%listed rankings as a top factor, while only 22% of women did.
3. For job changers, male and female responses were fairly even in most areas, butmen valued salary (28% to 0%) and departmental rankings (76% to 50%) morehighly than women.
32

5. RECOMMENDATIONS
The recommendations presented here are based primarily on the data collectedfor this study and partly on the experience of the study group members and
their discussions during their meetings. Recommendations related to faculty recruit-ment are organized into four topics: 1) personal issues, 2) environmental factors,3) the recruiting process, and 4) the candidate pool. Recommendations for improv-ing faculty retention are organized into those that are preventative and those thatare reactive. Lastly, several general recommendations are discussed.
FACULTY RECRUITMENT
Personal Issues
1. Offer competitive salaries. Although salary does not appear to be a primary factor when a candidate isdeciding whether to accept an offer, it is an important one. CRA data are pub-lished every year that enumerate salaries for new hires and at each facultyrank. Small differences within the competitive range may not preclude anoffer being accepted, but a non-competitive salary can be a strong reason torefuse an offer.
2. Establish mechanisms and offer direct support to address “two-body” problems.Solutions to “two-body” problems seem to be a necessary but not sufficientcondition for successful recruiting. It is important to identify such problemsearly in your contact with a potential candidate and actively pursue solutions.Some universities have formal mechanisms in place to help; this seems desir-able since the problem is best addressed at the university, rather than thedepartmental, level.
3. Exploit any positive aspects of geographical location.Geography is an important consideration in accepting an offer. Departmentsshould ensure that geographical advantages are made clear to candidates.
33

4. Establish competitive teaching loads.It is important to have teaching loads that are comparable to those at otherinstitutions with which you are competing for faculty. Heavy teaching loadsor onerous buyout policies place a department at a competitive disadvantage.
5. Establish a multi-year plan to support new faculty.New faculty may find the following departmental actions supportive in buildingtheir careers: a) identifying mentors to assist them, 2) offering multi-year supportfor equipment and research assistants, and 3) establishing procedures to speedup the process of helping them find graduate students to work with them.
Environmental Factors
1. Improve the quality of graduate students.New faculty regard access to quality graduate students as a key factor in decid-ing whether to accept a job at a particular university. Solutions to this problemare difficult because it is a “chicken-and-egg” problem: better faculty drawbetter students and better students draw better faculty. This suggests a classicbootstrapping approach of improving the quality of graduate students and fac-ulty one step at a time as opportunities arise. Actions can be taken to increasethe number of Ph.D. students to the levels needed by the program and the fac-ulty, and to create a good working atmosphere for graduate students and fac-ulty. Faculty should exploit links they have to strong schools, both in theUnited States and abroad, to attract good graduate students.
2. Create and expound a departmental vision/strategic plan.Candidates are interested in the future plans of the department. Using astrategic plan, explain how it will strengthen the department and discuss withthe candidates how they would fit into the plan. Also discuss specific detailsabout colleagues in the same or complementary research fields. Present astrong plan for the candidate’s research area.
3. Improve the collegial atmosphere of the department.Many techniques can be used to improve departmental collegiality. Involvingfaculty in the decision-making process and being open regarding how decisionsare made form a good basis for collegiality. Overall, decisions need to be fairto avoid favoritism. Proactive approaches to team building—working togetherto apply for large grants or cooperating on teaching activities, for example—can also help. Positive feedback and encouragement work much better than a“big stick” approach. Various social activities also foster collegiality. Depart-
34

mental awards and other mechanisms for recognition can be instituted at littlecost. Improvements in space or staff support can also improve morale.
Recruiting Process
1. Convince deans to permit more offers than there are faculty openings.The success rate for faculty hiring is low and the recruiting process is long anddifficult. Allowing simultaneous offers to be made to more candidates thanthere are authorized slots increases the chances of successful recruiting and isunlikely to result in more hires than authorized positions. This mechanismenables a department to act quickly in making an offer, and many times thisability to act will make a positive impression on candidates.
2. Departments should be realistic in extending invitations for faculty interviews.All departments want to improve. Many departments, at every ranking level,attempt to recruit stars. Departments should make realistic assessments oftheir chances of recruiting these candidates to avoid wasting precious time oncandidates they cannot hope to attract. If an opportunity to invite a “star”arises, it may be wise to invite this person late in the interview season. In thisway, a candidate who is truly interested can still interview—or can cancel(and waste nobody’s time) if better offers are already in hand. Some schoolsinvite stars so they can influence them with a strong impression of theirdepartment, which they hope helps them indirectly.
Candidate Pool
1. Look for candidates in non-traditional places.Non-traditional places can include industry, overseas, and fields in which peo-ple have degrees related to CSE (especially if these people fit into multidisci-plinary activities already underway or planned).
2. Create a plan for attracting and retaining women and minority faculty, andactively implement it.It is important to have a plan for retaining women and minorities, rather thanjust hoping that you will find qualified candidates in your applicant pool thatyou can hire. If the department is supportive of its current women and minor-ity faculty and graduate students, it will be easier to attract additional womenand minority faculty.
35

3. Create a pipeline to other universities.Build on recent hires to help attract new faculty from those same schools.Involve your entire faculty in reaching out to their colleagues at other schoolsto identify strong candidates.
FACULTY RETENTION
Preventing Faculty Loss
1. Initiate preventative measures within the department to retain faculty.Once faculty have become dissatisfied enough to interview elsewhere, thedepartment often has few prospects of retaining them. Department cultureand collegiality, quality of graduate students, departmental ranking, andsalaries are key factors in retaining faculty. Since ranking is a long-term issue,special attention must be given to the other areas over which departmentshave more direct control. Providing mentoring and reasonable teaching loadsare important factors. It is also important to reward faculty who are espe-cially effective (e.g., with tenure or early promotion). Proactive measures anda generally favorable environment will preclude many faculty from ever seri-ously considering another job.
2. Teaching institutions must pay competitive computer science salaries. The average salary for a full professor at a teaching institution is almost 30%lower than the average salary for an assistant professor at a research univer-sity. Salaries at research universities ranked in the bottom third also signifi-cantly trail those at the higher-ranked research universities. Computer sciencefaculty generally are highly marketable, and when the salary gap is widebetween what the department pays and what they could receive in industry orelsewhere in academia, this is a strong incentive to consider relocating.
3. Continue to monitor and solve “two-body” problems.The “two-body” problem can be an ongoing one. While often considered pri-marily a recruitment problem, it may also contribute to retention problems.Sometimes couples are willing to live apart for the sake of their careers whenthey are young, but either they tire of the commuting relationship or find itunworkable when they have children. Occasionally, “two-body” problemsarise after the couple has joined the faculty, through the relocation of a spouseor the establishment of a new personal relationship with someone at a dis-tance. Continuous monitoring of such situations, and a willingness to apply
36

both departmental and university-wide resources to address them, can help toretain faculty.
4. Provide collaborative work environments.Data show that access to colleagues in the same research area is important,especially for women. Efforts must be made to support collaborative workenvironments and to fairly assess any multidisciplinary work that arises fromthese collaborations. Departments may choose to concentrate their hiring ina few research areas, rather than maximizing breadth of technical area cover-age, in order to improve the chances that faculty members will have col-leagues to work with on campus.
5. Deans must be proactive as well as reactive.Deans are often critical players in helping a department to react to the antic-ipated departure of an individual faculty member. However, deans must alsobe cultivated as allies to be proactive in preventing retention problems. Theycan both help to create a favorable environment in the department and makeavailable financial and university-wide resources as they are needed. Suchproactive measures may reduce the number of retention cases that will arise.
Reacting to Potential Faculty Loss
1. Actions should be taken to retain a valuable faculty member.In many cases, the only action available to try to retain faculty members afterthey indicate they are considering leaving is to talk to them. Useful topics fordiscussion include reminders of the advantages your department offers andplans for departmental improvements and how they would affect that facultymember, in addition to any issues the individual raises. Counteroffers mayalso increase the probability that the person will stay; such offers demonstrateto the individual and to the rest of the faculty that top people are appreciat-ed. This may be tricky, of course, since a counteroffer can sometimes createjealousy among other faculty members.
GENERAL RECOMMENDATIONS
1. The computer science community should carefully track the problem offaculty retention.It is likely that the faculty retention problem will continue to rise and fall overthe years. For example, the recent dot-com phenomenon (both its rise and
37

crash) had an impact on retention. Similar cycles may occur in the future.Some systemic issues may also affect faculty retention. For example, there isanecdotal evidence that faculty dissatisfaction with their teaching loads andadministrative overhead is increasing. These factors do not seem to haveaffected retention to date, but they bear watching.
2. The computer science community should investigate techniques, or possiblynon-binding agreements, that can reduce the overhead of recruiting.Recruiting is time-consuming and expensive, to the point that it is strainingthe department’s ability to carry out its research and teaching missions. Thesearch process now extends over much of the academic year; still, timingissues mean that search processes do not get completed and open positions donot get filled, even when viable candidates are still available. Implementingchanges in the recruiting process is partly in the hands of individual depart-ments, but it also depends on the overall action of other schools that are hir-ing, and on the candidates themselves. Non-binding agreements among uni-versities regarding the length of the recruiting season and limiting the numberof interviews could be useful. However, such cooperative arrangements maybe impractical, especially if schools that do not abide by the agreement gainan unfair advantage. Novel ways of reducing problems in the recruitingprocess should be explored further, perhaps by organizations such as theComputing Research Association.
3. Increase the pool of Ph.D.s applying for faculty positions.Because of Moore’s Law and the continued growth of the Internet, theincreasing demand for IT workers and, hence, for CSE faculty, is likely to besustained. Departments should try to increase the number of graduate stu-dents to meet the needs of their research and teaching functions. Efforts mightinclude talking to undergraduate majors about graduate school and givingthem research experience, widening the net of schools from which new grad-uate students are recruited, and possibly accepting more students with under-graduate majors other than computer science if they show promise that theycould succeed in a computer science graduate program. Graduate studentsshould be educated on the positive aspects of a career in academia. Workingconditions for faculty should be improved so that more Ph.D.s will consideracademia as an attractive career choice. For example, many fields and uni-versities offer a pre-tenure sabbatical, whereas computer science departmentstypically do not.
38

6. ADDITIONAL WORK NEEDED
Faculty recruitment and retention issues in computer science are of great inter-est to many people. We have seen actual trends and perceptions change dra-
matically from year to year. It is important to collect reliable data every year.
One recommendation is to add several queries to the CRA Taulbee Survey thatspecifically relate to recruitment and retention. Surveys tend to increase in size overtime and can be burdensome to complete. Hence, we need to request only criticaldata to answer the most important questions.
We recommend that the following relevant questions be added to the TaulbeeSurvey:
• How many faculty left the department this past year for industry __, for non-sabbatical leaves __, for retirements __ for other reasons __?
• How many faculty returned from non-sabbatical leaves?
• How many faculty applications did you receive?
• How many faculty candidates did you interview?
• How many offers were made?
• How many offers were accepted?
39

40

APPENDIX A. SURVEY OF CHAIRSOF DOCTORAL PROGRAMS
SURVEY METHODOLOGY
CRA contacted 30 chairs of doctoral-granting computer science departmentsand asked them to complete an online survey on faculty recruitment and
retention. The 30 departments were drawn from the 108 research-doctorate pro-grams in computer science ranked by the National Research Council in 1995,using an algorithm to distribute invitees evenly among the ranks. Of the 30 chairscontacted, 21 (70%) completed the survey.
ANALYSIS
Faculty Recruitment
• Recruiting faculty is a challenge for most, if not all, of the departments surveyed.In general, departments have been unable to fill all their open positions, withclose to one-third of these positions going unfilled. Looking at the retention fig-ures, each department loses one faculty member per year on average, makingrecruiting even more important. There is also a lack of “serious” applicants,defined as those whose application has a real chance of success at that particularschool. Although departments receive many applications, 75% of those areculled immediately.
• The results of this survey do not resolve the question of whether recruiting prob-lems are cyclical or systemic. Several chairs suggested the number of qualifiedapplicants has increased since the dot-com shakeout, with more people movingfrom industry to academia and more fresh Ph.D.s taking teaching positions.Industry has supplied 18% of the new academic hires in the past year, althoughthat figure seems small compared with the 76% coming from new Ph.D.s orother academic institutions. Indeed, the fact that 38% of new hires come fromother colleges and universities suggests that faculty movement is a significantissue in both recruitment and retention.
41

• From the chairs’ perspective, quality graduate students, departmental rankings,geography, salary, the “two-body” issue, and the presence of colleagues in thesame area seem to be the main motivating factors in applicants’ decisions toaccept or decline employment offers.
• Responses were grouped and analyzed along departmental tiers: Tier 1 (NRCrank 1-36), Tier 2 (NRC 37-72), and Tier 3 (NRC 73-108). Although in manycases there was no significant variance in responses by tier, in a few areas poten-tially important differences appeared. Total applications for open positions, bothby department and by position, were higher for Tier 1 schools than Tier 2, andhigher for Tier 2 schools than Tier 3. This suggests that more candidates areapplying for positions at the higher-ranked schools, leaving fewer, and possiblylower-quality, candidates for lower-ranked schools. Lower-ranked schools didmanage to fill open positions at a rate only slightly lower than higher-rankedschools, with Tier 1 schools filling 68% of positions, Tier 2 filling 54%, and Tier3 filling 62%.
• In reporting the major obstacles their departments face in the recruiting process,chairs of Tier 3 schools were much more concerned about salary and teaching loadsthan other chairs, and both Tier 2 and Tier 3 schools listed “Getting QualityGraduate Students” and “Rankings” as much greater problems than Tier 1schools. In the case of graduate students, the difference was dramatic: only 33% ofTier 1 schools listed getting quality graduate students as a major obstacle to facul-ty recruiting, while 86% of Tier 2 and 71% of Tier 3 schools felt it was a problem.
Faculty Retention
• Here again, there is much more faculty movement between academic institutionsthan between industry and academia. Although 29% of faculty departures are toindustry positions, 53% are to another academic institution. Faculty who doleave tend to have some seniority, with the average departing faculty memberhaving spent 10 years at the former institution. Salary, rankings, and the draw ofindustry are significant factors in the decision to move on. Personal reasons alsoplay an important role.
• Faculty who considered leaving but ultimately stayed may provide some insightinto how departments retain faculty members who are “on the fence.” Accordingto the chairs, salary is one of the top motivations to leave in close to 70% ofcases; raising salaries is also one of the most-noted solutions to retention prob-lems, suggesting that the simple act of increasing individual salaries can resolvesome or many retention problems. It is important to note, however, that in oursurvey of “recent job changers,” faculty who actually left one academic institu-tion for another did not feel that higher salaries alone could retain faculty whohad already decided to depart.
42

• Rankings and the lack of colleagues in the same area of research are other causesof retention problems.
Faculty Leave
• 60% of departments reported having at least one person on leave. Of those, thehighest percentage of faculty on leave was 6.7% (two departments), the lowestpercentage was 3%, and the median was 5.3%.
RESULTS
Faculty Recruitment
How many faculty positions did you have open in the 2000-2001 academic year?Average of 4 open positions per department
By department rank:Tier 1—3.8 open positions per department (excluding outliers)Tier 2—3.1; Tier 3—3.4
If your institution does not count applications for each position, how many appli-cations did you receive for all of your open positions?
Average of 134 applications per department. Average of 30 applications perposition
By department rank:Tier 1—228 applications per department, 36 applications per positionTier 2—98 applications per department, 28 applications per positionTier 3—75 applications per department, 21 applications per position
If your institution does not count applications for each position, how many of thetotal applications you received did you seriously or realistically consider?
25% of applications were seriously considered
By department rank:Tier 1—26% of applications were seriously considered; Tier 2—18%; Tier 3—32%
How many faculty positions did you fill in the 2000-2001 academic year?66% of open positions were filled
43

At what rank did you hire faculty for each position? (Full, Associate, Assistant,Non-Tenure Track)
8% hired as Full professors; 19% as Associate professors;65% as Assistant professors; 11% as non-tenure track.
Of the faculty you hired, how many are male and how many are female?78% male, 22% female
Of the faculty you hired, how many are underrepresented minorities (URM)?(Defined as those groups that are generally underrepresented in computer science:African Americans, Hispanic Americans, and Native Americans).
< 1% URM
If you hired underrepresented minorities, how many of them are female?The sample size for this question was too small to be useful.
Was it a priority for your department to hire women and underrepresentedminorities?
Yes (75%); No (10%); Not directly answered (15%)
Did you have any difficulty hiring women and ethnic or racial minorities?Yes (56%); No (38%); Not directly answered (6%)
Of the faculty you hired, how many were not US citizens at the time of hiring?36% were not US citizens at the time of hiring
Of these non-US citizens, how many joined your department on temporary visas?27% joined their department on temporary visas.
When do you start the recruiting season in a typical year? When do you end it?September (5%); October (30%); November (15%); December (15%);January (30%); February (5%). The average recruiting season lasts 6 months.
Has the recruiting season gotten longer, shorter, or stayed roughly the same dura-tion over the last decade?
Shorter (0%); Same (40%); Longer (60%)
During the recruiting season, how many hours does the chair personally spend onrecruiting in an average week?
8 hours
44

During the recruiting season, how many person-hours do your faculty, includingyourself, spend on recruiting in an average week?
45 hours
What logistical problems, if any, do you face in the interview process? General scheduling problems (55%)Getting faculty to attend candidate talks (50%)No logistical problems (25%)Getting the candidates to commit to sufficient time onsite (0%)Money to bring candidates to campus (0%)
What are the major obstacles you face in the recruiting process today?Getting quality graduate students (65%)Rankings/departmental reputation (50%)Geography (40%)Salary (40%)Startup packages (30%)Teaching loads (20%)General workload (25%)Don’t know (0%)
By department rank:Salary: (Tier 1) 33%, (2) 29%, (3) 57%Teaching loads: (1) 17%, (2) 0%, (3) 43%Getting quality graduate students: (1) 33%, (2) 86%, (3) 71%Rankings/departmental reputation: (1) 33%, (2) 57%, (3) 57%Other choices showed no significant difference over ranks.
Thinking of all those who turned down offers from you, what do you feel weretheir three main reasons?
Geography (55%)“Two-body” problem (55%)Rankings/departmental reputation (45%)Access to quality graduate students (35%)Lack of colleagues working in the same research area (30%)Space/research facilities/equipment (30%)Salary (20%)Cost of living (20%)Startup package (15%)Teaching load (10%)General workload (5%)Tenure process (5%)
45

Opportunity to make a scientific or product development impact (0%)Publishing pressure (0%)Don’t know (0%)
For those who accepted your offer, what do you feel were their three main reasons? Presence of colleagues working in the same research area (75%)Rankings/departmental reputation (50%)Geography (45%)Access to quality graduate students (35%)Cost of living (20%)Teaching load (20%)Salary (15%)General workload (10%)Opportunity to make a scientific or product development impact (10%)Startup package (10%)Space/research facilities/equipment (5%)Publishing pressure (0%)Tenure process (0%)“Two-body” problem (0%)Don’t know (0%)
Where did each new hire come from? New Ph.D. (38%)Academic institution (38%)Industry (18%)Non-profit institution (5%)Government (5%)
Faculty Retention
How many faculty have left your department in the past year?1.3 faculty left per department
How many faculty have left your department in the past three years?3.1 faculty left per department
By departmental rank:Tier 1—3.7 faculty left per department; Tier 2—2.0; Tier 3—4.3
Where did the faculty who left go?53% went to another academic institution; 32% to industry; 12% to “other”;
46

2% to a non-profit institution; 0% to government.
By department rank:To Industry: (Rank 1) 31%, (2) 44%, (3) 23%To Academia: (Rank 1) 50%, (2) 47%, (3) 56%
By destination rank:(Calculated by comparing the NRC rank/tier of the schools faculty left andthe schools they went to)Average departing faculty member moved down 0.17 ranksNumber going up one tier—5Number going to same tier—17Number going down one tier—4Number going down two tiers—3
What were the ranks of the faculty who left?Full (36%); Associate (38%); Assistant (26%)
How long were these people members of the faculty before leaving?Average time at institution was 10.7 years per faculty member.Modalities: most faculty left at years 3, 6, 8, and 10; 74% left in the first 10 years.
Thinking of all the faculty who left, what were the main reasons for their departure?Appeal of industry (47%)Personal reasons (42%)Salary (32%)Departmental ranking/reputation (32%)Opportunity to make a scientific or product development impact (21%)Tenure/promotion (16%)Access to quality graduate students (16%)Lack of colleagues working in the same research area (16%)Geography (16%)“Two-body” problem (16%)Teaching load (5%)General workload (5%)Space/research facilities/equipment (5%)Cost of living (0%)Publishing pressure (0%)Don’t know (0%)
47

If you chose “appeal of industry,” what specifically attracted the facultymember(s) to work in industry?
Presence of colleagues working in the same research area (33%)Salary (33%)Less grant-writing demand (22%)Less committee work (11%)Stock options/equity (11%)Better space/facilities (11%)Better support staff (11%)Don’t know (11%)Less publishing demand (0%)Better access to research materials (e.g., large databases for data-mining research) (0%)
For those faculty who have considered leaving (but did not actually leave), whatwere the key factors in their decisions?
Salary (57%)Departmental ranking/reputation (24%)Geography (24%)Appeal of industry (24%)Access to quality graduate students (19%)Personal reasons (19%)General workload (14%)Lack of colleagues working in the same research area (14%)Space/research facilities/equipment (14%)Opportunity to make a scientific or product development impact (14%)“Two-body” problem (10%)
Teaching load (10%)Tenure/promotion (8%)Publishing pressure (5%)Cost of living (0%)Don’t know (0%)
What do you feel are the key faculty retention issues in your department?Salary (67%)Departmental ranking/reputation (38%)Space/research facilities/equipment (38%)Lack of colleagues working in the same research area (29%)Teaching load (29%)General workload (24%)Geography (19%)Opportunity to make a scientific or product development impact (10%)
48

Publishing pressure (5%)Tenure/promotion (5%)“Two-body” problem (5%)Cost of living (5%)Access to quality graduate students (0%)Startup package (0%)
When a faculty member presents an offer from another employer, how free areyou to make counteroffers in the following areas?
Greater salary: No freedom (20%); Some freedom (75%); Total freedom (5%)Summer support: No freedom (28%); Some freedom (61%);
Total freedom (11%).Decreased teaching load: No freedom (29%); Some freedom (47%);
Total freedom (24%).Leave of absence: No freedom (10%); Some freedom (75%);
Total freedom (15%).
Faculty Leave
How many faculty are currently on non-sabbatical leave?Average 2 per department.Adjusted average 0.7 per department (this excludes outliers).60% of responding chairs reported having at least one person on leave. The highest percentage of faculty on leave was 6.7% (2 schools), the lowest
was 3%, and the median was 5.3%.
By department rank:Tier 1—Average 1.1 per department (excluding outliers)Tier 2—Average 0.85; Tier 3—Average 0
What is your policy on how long a faculty member may take unpaid leave?Leave up to 1 year (43%); up to 2 years (43%); up to 3 years (5%); no official policy (9%).
How long is the average unpaid leave? How long is the longest unpaid leave?Average leave is 1.1 years; average longest leave is 2.3 years.
49

PH.D. PRODUCTION
How many Ph.D.s did your department produce last year? over the past three years?Average 7 Ph.D.s produced per school last year.Average 21 Ph.D.s produced per school over the past three years.
Where did those Ph.D. recipients go?Industry (45%); academia (40%); other (13%); government (1%); non-profit (1%).
RESPONSES TO OPEN-ENDED QUESTIONS
Did you have any difficulty hiring women and ethnic or racial minorities? If so,what were those difficulties?
“Availability of competitive applicants”; “Too many positions open for toofew applicants”; “There were some female applicants, but none from racialminorities”; “Few applicants, strong competition”; “Few if any applicantseach year”; “There were no minority applicants in the applicant pool”;“Competition with peer institutions and industry, two-body issues, spouse didnot like [location]”; “Few applications”; “One offer to female candidateturned down”; “Lack of good candidates”; “Pool is too small, plus we havevery high expectations.”
Have you seen any overall changes in the recruiting process over the past decade,and especially over the past several years? If so, what are those changes?
“More qualified applicants/more open positions in our department”; “Nomarked changes other than a trend toward fewer applicants in the late1990s”; “The only change is that the number of applications we receive hasgone down from over 200 to around 50”; “We now have more flexibility”;“Electronic communications more important, greater emphasis on minorities,more competition for top candidates”; “No”; “No”; “A much better pool ofexcellent candidates”; “Less number of candidates; high expectations fromcandidates as far as salary and starting packages are concerned, competitionwith industry and other universities”; “More competition from peer institu-tions, longer season, higher startup packages”; “More competition for fewergood candidates ==> more work”; “No substantial changes”; “Much morecompetition for the top candidates; people making decisions for personal overprofessional reasons”; “Weaker candidate pool, fewer good candidates”;“More candidates on market”; “More intense and competitive.”
50

Have you seen any changes in the recruiting process, either overall or in yourdepartment, due to the “dot-com” crash? If so, what are those changes?
“No”; “I believe that we are suddenly seeing better resumes”; “Minorchanges in that we now have more industrial applicants”; “Many more appli-cants; increase in applicants from industry”; “More candidates, especially inthe number of senior positions”; “Better applicant pool this year”; “When‘dot-coms’ were hot, it was difficult to recruit”; “More qualified candidatesseem to be available this year”; “More applications”; “Increase in number ofapplicants”; “More industry applicants; fewer fresh Ph.D.s considering bothuniversity and industry.”
Is your department doing anything different in the recruiting process now thanyou have in previous years?
“No” (7 times). “I am aggressive in telephoning people prior to the interview.We are aggressive in making offers, and our dean is willing to make multipleoffers for the same position”; “We are more flexible regarding the area of thecandidates”; “Beginning the process earlier. Targeting specific research groupsof interest nationally rather than simply relying on ads”; “We have a recruit-ing committee working year around; developed online recruiting database tofacilitate wider faculty participation in the evaluation process”; “Startedadvertising earlier; started interviews earlier; and make offers earlier”; “Smalltweaks but nothing significant”; “More aggressive recruiting”; “Differentrecruiting methods: web postings, different periodicals, etc.”; “Starting earlier,keeping posts open until filled”; “We are doing ‘pre-interview’ visits in fall.”
Would you characterize the “two-body” issue as a problem in recruiting? (This isthe issue of finding appropriate jobs for both the applicant and her/his partner). Ifso, how and to what extent has it affected your recruiting efforts? What accom-modations or adjustments has your department made?
“It has had a huge effect; more than half of our unsuccessful recruitingepisodes involve spouse jobs”; “We have lost good candidates due to this”;“This has not been a significant problem for us”; “We’ve solved some ‘two-body’ problems in the past. We’ve also been unsuccessful in solving others”;“No”; “To a limited extent. We try to help the spouse find a job in the localarea. We have had some success with this but it is difficult”; “Not if bothbodies are in CS. We have many positions”; “Local industry has been verycooperative with us in the past with this problem”; “Sometimes; it was not adecisive factor”; “Yes. It has not affected our recruiting process so far. We canaccommodate the political aspect of this problem”; “Yes, we have an office toassist partners of faculty candidates”; “No. We look for ‘two-body’ opportu-nities. Spouses can often pursue careers in local industry”; “We will help thepartner network in the local area to help find them positions. If appropriate,
51

we will interview the partner as a faculty candidate”; “Yes, this is especially aproblem in hiring female candidates. On one occasion (10 years back), wehired a female candidate and her husband—a year later”; “We have a goodspouse-hiring program, offering 1/3-1/2 of the support for the spouse. We’vemade two of these offers the past two years; they are a lot of work to generateand neither couple came”; “YES! Either we do not interview when there areobvious problems, or we lose good candidates through lack of responsivenessby the institution”; “We have had applicants turn down offers due to two-body problems”; “This comes up every year with 1-2 candidates”; “Being in alarge city helps, but even so we are proactive in finding jobs for the spouse,including on-campus jobs.”
What are you doing proactively to prevent retention problems within your depart-ment as a whole?
“Improving research and teaching facilities increase reputation”; “Not applic-able. After years of mistreatment, some of which was justified, we have analmost totally reborn department in a new college with a new chair and newdean. The upper administration will expect a payoff in the long run”; “Tryingto attract more PhD students”; “Try to keep up with national salary levels”;“Trying to find relief from the issues above, but with little success”; “Workingto improve faculty salaries. We have already reduced teaching load for facultywho are actively involved in research. Working to attract better graduate stu-dents”; “Negotiating with the dean for more resources (special salary raises,space, graduate student support, staff support)”; “Working to facilitate teamactivities and to provide adequate resources for teaching and research”; “Iconsult with the Dean and try to promote most productive faculty as fast asacceptable to the administration. I always insist on off-scale salary”; “Work tokeep salaries at competitive levels. Create a feeling of collegiality among facul-ty and staff. Secure resources for additional technical and clerical staff”;“Salary adjustments, resource enhancements, better communication with fac-ulty”; “Raise salaries, improve ranking, make environment better, build newCSE building”; “Working with our dean’s office”; “Provide a great deal ofsupport and investment in their research programs. Provide infrastructure”;“i) giving salary raises, ii) recruiting more faculty (creating a better researchenvironment) iii) attracting more Ph.D. students”; “Trying to get additionalsalary support from the campus administration; trying to get commitment fornew CS building”; “1. Addressing salary inversion, 2. Solving two-bodyproblems, 3. Early tenure for outstanding juniors, 4. Reduction in teachingload 5. Encouragement to do joint research, 6. Interdisciplinary ties withother departments, 7. Mentoring”; “Nothing”; “Listen closely; Last year didextraordinary salary adjustments.”
52

How do you address retention problems, once they appear, for the department asa whole?
“Deal on individual basis”; “We really don’t have a serious problem withretention. Most people, once they arrive here, really like it here and stay”; “Tryto improve the general atmosphere in the department”; “No one has seriouslyconsidered leaving to my knowledge”; “For salaries, need to get cooperationfrom the Dean. Others are handled internally”; “Nothing special”; “If possiblework to address problems or deficiencies in the department if this is the moti-vation for interest in leaving”; “We were fortunate to avoid any retentionproblems in the last 4-5 years that would require any substantial efforts”; “Itry to address specific problems and then solve for general body”; “Talk toDean”; “I am working on many fronts to increase salaries and endowments,and reduce teaching load”; “Department faculty collaboration”; “Dependsupon the cause of the problem: People often leave a department if they feel it isnot progressing/improving and there is a lack of an active research atmosphere.Salary issues can be addressed by a supportive Dean. Students can be a difficultproblem”; “No department-wide process”; “1. Retreats and open faculty meet-ings, 2. Discussions with Deans”; “Salary adjustments.”
How do you address retention problems, once they appear, for an individual fac-ulty member? In other words, how do you deal with a faculty member who isconsidering leaving your department?
“Special salary raises for best”; “We have negotiated reduced teaching loadsto permit greater research productivity”; “We have only been faced with oneretention problem and there was really nothing we could have done to retainthe couple”; “One-on-one talks and deals”; “Counteroffer”; “Salary raises,lighter teaching load”; “I try to find out the key reasons for considering leav-ing the department and act correspondingly, i.e., try to get an increase insalary, get a special position, etc.”; “Meet with faculty member and addressall his/her concerns, then facilitate a meeting with the faculty member andadministration”; “Talk with faculty member, talk to Dean to match offer”;“Determine factors for leaving and try to provide support in areas they feelthey aren’t receiving it”; “Again, there might be a variety of causes. We arepresently losing two faculty members to two-body problems. In both cases,the spouse wanted to find employment in another city. Occasionally in thepast, salary has been an issue, and we match the offer”; “Match the offerfrom the competition”; “1. Open discussion and mentoring, 2. Addressingproblems head on”; “If we want the person, we do salary and touchy-feely.”
Have you seen any changes in retention issues over the past decade? If so, whatare they?
“No” (6 times); “10 years ago, retention was not such a big deal in our depart-
53

ment”; “Just happening more often”; “No significant change”; “One of themain retention issues is dot- com boom and rapid success of industry”;“Retention was not a problem until recently”; “Have lost some faculty to dot-com and other industry”; “No new issues. When the computing industry doeswell some faculty leave for industry while other faculty move (up) to replacethem”; “Many faculty members feel that other institutions have a better deal(more, better resources, lower teaching loads, more supportive administration).”
How accommodating or helpful is your dean (i.e., the university officer youreport to as department chair) with regard to general recruitment and retentionissues? (Please briefly explain with details or examples.)
“Somewhat; dean insists on handling everything through him. Higher admin-istration very rigid”; “The current dean has been strongly supportive”; “Willtry to match the salary of the competing institution (but only within reason)”;“Moderately helpful within his own constraints”; “Quite”; “Reasonablyattentive. Fortunately we have not had any serious problems in this area”;“Very helpful and willing to scramble for money to talk to people who hesi-tate”; “The Dean is helpful. He understands “market” issues and has beenopen to such issues as increasing levels of starting salaries and attractive coun-teroffer packages”; “The Dean is reasonably cooperative. Ex: 2 years ago afull professor was considering leaving. We worked with the Dean and VicePresident to get him a 20% salary increase”; “Very—increase salary, generateendowed chair”; “Helpful in arranging startup packages”; “Somewhataccommodating”; “Our Dean is very helpful. We have made higher salaryoffers and granted leaves of absence in order to retain faculty”; “Very sup-portive. Approximately 60%-70% of the cost of these retention packages hasbeen provided by the Dean or the campus”; “The Dean controls salaries andstartup money, but is responsive when pushed”; “Sometimes helpful, some-times not”; “Very. Sees senior people, helps arrange aggressive job offers.”
How accommodating or helpful is your dean in proactively addressing retentionissues? Does your dean work to create an environment that will avoid retentionproblems? (Please briefly explain with details or examples.)
“Is willing to find ways and fight for them; frequently innovative ideasblocked”; “He is trying to find ways to address the problems above”; “Very.Yes”; “Just recently the dean has begun to provide more resources (facultyslots and space), but over the past five years, essentially no new resourceswere given to the department”; “Yes, he is very supportive of creating anattractive environment for faculty productivity”; “Quite helpful. Keeps an eyeon compensation”; “The Dean is very concerned about retention and checkswith chairs about potential problems”; “Here the Dean is not as helpful orproactive. In particular, the issue of space and staff support has been a source
54

of dissatisfaction for quite some time (and one of the key reasons why peopleleave), yet it has not yet received adequate attention”; “Recently, the dean hasstarted responding to our request to be proactive”; “Yes, salary program toavoid salary inversion”; “The dean does work with department heads to pro-vide support for these issues. He relies heavily on the recommendations of thefaculty”; “This year, I worked with the Dean to obtain substantial salary rais-es for several faculty members”; “Yes. This year we have a faculty spouseapplying for a position and the Dean is working with the Provost to get uspartial salary support for that person”; “Not that I can see”; “Dean notstrong in this area.”
How accommodating or helpful is your dean in reacting to retention problems,such as a faculty member who is considering leaving? (Please briefly explain withdetails or examples.)
“The dean and upper administration want research productivity. To retainsomeone who is productive, they will be very helpful”; “Moderately helpfulwithin his own constraints”; “Hasn’t come up yet”; “Greater salaries as apart of counteroffers are easy to negotiate. High salaries for new hires aremuch harder to negotiate”; “If we had problems with a highly productive fac-ulty member leaving I believe the dean would be very supportive of workingout special arrangements”; “The Dean usually acts by increasing salary and/orrank”; “The Dean is able to quickly come up with counteroffers. However, atthe time a faculty member is seriously considering leaving and has otheroffers, these efforts are not always successful”; “Yes, raise salary, get chair”;“Helpful with counteroffers”; “Case dependent.”
55

56
APPENDIX B. SURVEY OF CHAIRSOF UNDERGRADUATE COLLEGES
SURVEY METHODOLOGY
CRA contacted chairs of computer science departments at 800 four-year under-graduate colleges and asked them to complete an online survey on faculty
recruitment and retention. Of the 800 contacted, 104 chairs completed the survey,a 13% response rate.
ANALYSIS
• Undergraduate college computer science departments filled only 64% of openpositions in the last academic year and only 40% of applications were “serious-ly considered” (seen as potentially viable). In an earlier survey, Ph.D.-grantinginstitutions reported filling 66% of their open positions, and seriously consider-ing only 25% of applications received.
• 67.5% of new faculty hires were male, 32.5% female, 2.5% are underrepresent-ed minorities (all of whom were also female), 41% are non-US citizens, and 13%of those hired joined the department on a temporary visa. For Ph.D.-grantinginstitutions, 78% of new hires were male, less than 1% were minorities, 36%were non-US citizens, and 27% of those were on temporary visas.
• When asked for the most significant barriers to faculty recruitment, salary wasthe top choice, with 79% of respondents listing it as a major obstacle. Teachingload (61%), general workload (34%), and geography were other significantrecruiting problems. In contrast, only 40% of Ph.D. institutions ranked salary asa major problem in recruiting, 20% listed teaching load, and 25% cited generalworkload. For Ph.D. institutions, getting quality graduate students (65%) anddepartmental ranking/reputation (50%) were much more important. The samefactors ranked near the bottom for undergraduate colleges, at 18% and 5%.
• For those candidates who turned down offers from undergraduate colleges,salary (59%) and teaching loads (38%) were once again the major factors, withgeography (27%) ranking third. For Ph.D.-granting institutions, salary was
57

much less important (20%) and teaching loads were near the bottom of the list(10%). For these schools, geography (55%), the “two-body” problem (55%),and departmental rankings (45%) were more significant.
• Where a candidate accepted an offer, geography (61%) was the only factorlabeled significant by more than 20% of respondents. When combined with the27% who said geography was a major reason for a candidate going elsewhere, itseems clear that location is a major factor in the decision-making process forapplicants to undergraduate colleges. Geography was also important for thePh.D.-granting institutions (45% of chairs rated it as significant), but the pres-ence of colleagues in the same research area (75%) and departmental rankings(50%) were seen as more important.
• Faculty retention seems to be much less of a problem for undergraduate collegesthan for Ph.D.-granting institutions. The colleges reported losing only 0.4 facul-ty members per department over the last year and 1.1 per department over thepast 3 years. Ph.D. institutions reported losing 1.3 and 3.1 faculty members overthe same periods. This may be because undergraduate college faculty, for whomgeography is a significant factor in choosing a position, feel more anchored totheir location, or possibly because faculty at Ph.D.-granting institutions are moreupwardly mobile and have more opportunities to move to industry or other aca-demic institutions. It may also be true that the demands of research compel thesefaculty to seek out positions at better research institutions.
• We asked the undergraduate colleges how many faculty they had lost to industryover the past three years and how many they had hired from industry over thatperiod. The colleges reported hiring 18% more faculty from industry than theylost to industry.
• The key retention issues for undergraduate colleges mirrored their recruitingissues: salary (51%), teaching loads (32%), general workload (30%), and geog-raphy (26%) topped the list. Salary was even more important to the Ph.D.-grant-ing institutions (67%), and teaching loads (29%), general workload (24%), andgeography (19%) were in the same range. Departmental ranking (38% to 6%)and space/research facilities (38% to 12%) were much more significant for thePh.D. institutions. however.
• Salaries for computer science faculty at undergraduate colleges were lower acrossthe board than at Ph.D.-granting institutions. The CRA Taulbee Survey, whichcollects salary information from Ph.D.-granting institutions, reported the follow-ing average salaries in 2001: Full professor $105, 396; Associate professor$81,050; Assistant professor $ 76,651; Non-tenure-track teaching faculty $55,450. At the undergraduate colleges, salaries for a Full professor average$75,015, for an Associate $63,892, for Assistants $56,036, and for non-tenure-track faculty $49,250.
58

RESULTS
Applications and Positions
64% of open positions were filled10.5 applications were submitted per position4.2 applications were “seriously considered” per position40% of applications were “seriously considered”18% of applications lead to an interview53% of interviews lead to an offer62% of offers were accepted
Gender and Ethnicity of Hired Faculty
Of the faculty you hired, how many are male and how many are female?67.5% of those hired are male; 32.5% of those hired are female.
Of the faculty you hired, how many are underrepresented minorities? (Defined asthose groups that are generally underrepresented in computer science: AfricanAmericans, Hispanic Americans, and Native Americans).
2.5% of those hired are underrepresented minorities.2.5% of those hired are underrepresented minority females.
Of the faculty you hired, how many were not U.S. citizens at the time of hiring?41% of those hired were non-U.S. citizens at the time of hiring.
Of these non-U.S. citizens, how many joined your department on temporary visas?13% of those hired joined a department on a temporary visa.
Recruiting Problems/Issues
Has the recruiting season gotten longer, shorter, or stayed roughly the same dura-tion over the last decade?
Longer (54%); Same (40%); Shorter (6%).
What are the major obstacles you face in the recruiting process today?Salary (79%)Teaching loads (61%)General workload (34%)Geography (32%)Startup packages (27%)Rankings/departmental reputation (18%)
59

Getting quality graduate students (5%)Don’t know (4%)
During the recruiting season, how many hours does the chair personally spend onrecruiting in an average week?
Response: 3.3 hours.
During the recruiting season, how many person-hours do your faculty, includingyourself, spend on recruiting in an average week?
Response: 8 hours.
What logistical problems, if any, do you face in the interview process?General scheduling problems (37%)Money to bring candidates to campus (36%)Getting faculty to attend candidate talks (17%)Getting the candidates to commit to sufficient time onsite (8%)
Thinking of all those who turned down offers from you, what do you feel weretheir three main reasons?
Salary (59%)Teaching load (38%)Geography (27%)Two-body problem (14%)General workload (12%)Lack of colleagues working in the same research area (12%)Departmental ranking/reputation (11%)Cost of living (10%)Access to quality graduate students (9%)Don’t know (9%)Space/research facilities/equipment (9%)Opportunity to make a scientific or product development impact (5%)Tenure process (2%)Startup package (1%)Publishing pressure (0%)
For those who accepted your offer, what do you feel were their three main reasons?Geography (61%)Salary (19%)Departmental ranking/reputation (19%)Cost of living (17%)Two-body problem (10%)General workload (8%)
60

Tenure process (7%)Don’t know (6%)Presence of colleagues working in the same research area (6%)Teaching load (5%)Publishing pressure (4%)Space/research facilities/equipment (4%)Access to quality graduate students (2%)Opportunity to make a scientific or product development impact (1%)Startup package (1%)
New and Former Faculty
Where did each new hire come from?Academia 51%; New PhD 27%; Industry 17%; Other 4%; Government 1%.
How many faculty have left your department in the last year?38 faculty (0.4/department)
How many faculty have left your department in the last three years?87 faculty (1.1/department)
Over the last three years, where did the faculty who left go?Left due to retirement, death, or other reasons (39%)Left for another academic position (37%)Left for industry (not research lab) (14%)Left for industrial research lab (7%)Left for non-profit (7%)Left for government (0%)
Thinking of all the faculty who left, what were the main reasons for their departure?Other (33%)Personal reasons (17%)Salary (16%)Teaching load (14%)Geography (10%)Appeal of industry (8%)General workload (8%)Tenure/promotion (8%)Two-body problem (5%)Departmental ranking/reputation (4%)Opportunity to make a scientific or product development impact (4%)
61

Cost of Living (2%)Lack of colleagues working in the same research area (2%)Access to quality graduate students (1%)Publishing pressure (1%)Space/research facilities/equipment (0%)Don’t know (0%)
How many faculty have left for industrial positions in the past three years? Response: 17
How many faculty have you hired from industry in the past three years?Response: 24Net inflow from industry to academia: 7
What do you feel are the key faculty retention issues in your department?Salary (51%)Teaching load (32%)General workload (30%)Geography (26%)Other (18%)Tenure/promotion process (14%)Space/research facilities/equipment (12%)Cost of living (10%)Two-body problem (9%)Departmental ranking/reputation (6%)Presence of colleagues working in the same area (5%)Startup package (1%)Opportunity to make a scientific or product development impact (0%)
When a faculty member presents an offer from another employer, how free areyou to make counteroffers in the following areas?
Salary increase: No freedom (49%); Some freedom (25%); Total freedom (<1%); Did not respond (26%).
Summer support: No freedom (41%); Some freedom (24%);Total freedom (<1%); Did not respond (35%).
Decreased teaching load: No freedom (49%); Some freedom (21%);Total freedom (0%); Did not respond (30%).
Leave of absence: No freedom (36%); Some freedom (33%); Total freedom (4%); Did not respond (27%).
62

Demographic and Institutional Data
Institutional Control: Private 58%; Public 42%.
Highest Degree Offered: BA/AB/AS 73%; CA 1%; MA 24%.
Enrollment/MajorsAverage Institutional Enrollment: 6,761CS StudentsAverage CS Enrollment: 494Average CS Grads: 26MS StudentsAverage MS enrollment for schools with some MS students: 103Average MS graduates for schools with some MS students: 22 per department
Faculty Totals, Composition, and Compensation
For CS/CE Faculty:
FTE # with PhD # women Avg. salary
Overall CS/CE Faculty 6.4 4.5 1.6 $53,896
Full Professor 2.3 1.4 0.18 $75,015
Associate Professor 2.1 1.5 0.37 $63,892
Assistant Professor 1.8 1.3 0.45 $56,036
Full-time Instructor/ 1.45 0.2 0.4 $49,520Adjunct/Lecturer
For all faculty:
What are your average salaries, for each rank, college-wide?Full Professor $66,999 Associate Professor $54,858 Assistant Professor $45,491 Full-time Instructor/Lecturer/Adjunct $35,718
Total number of full-time faculty: 6.5 per institution.
Total FTE (full-time equivalent) number of part-time faculty: 2 per institution.
63

Faculty Teaching Loads
What is your expected college-wide faculty teaching load?7.6 courses per academic year
What is your expected CS/CE faculty teaching load?6.8 courses per academic year
Factors in Evaluating Faculty
How important a factor is research in evaluating faculty college-wide?Most important 3%; Very important 33.3%; Important 38%;Not very important 19%; Not at all important 7%.
How important a factor is teaching in evaluating faculty college-wide?Most important 69%; Very important 20%; Important 10%;Not very important 1%; Not at all important 0%.
How important a factor is research in evaluating CS/CE faculty?Most important 4%; Very important 32%; Important 38%;Not very important 19%; Not at all important 7%.
How important a factor is teaching in evaluating CS/CE faculty?Most important 66%; Very important 27%; Important 6%;Not very important 1%; Not at all important 0%.
64

APPENDIX C. SURVEY OF NEW HIRES
SURVEY METHODOLOGY
CRA contacted 50 recently-hired faculty members at doctoral-granting com-puter science departments and asked them to complete an online survey on
faculty recruiting and retention. Of the 50 contacted, 34 completed the survey, a68% response rate. Respondents were fairly well distributed among the tiers ofgraduate institutions: 59% received Ph.D.s from NRC-ranked schools 1-36; 21%from schools ranked 37-72; and 21% from schools ranked73-108. Of the respon-dents, 35% are currently employed at institutions ranked 1-36, 24% are at schoolsranked 35-72, and the remaining 41% are at schools ranked 73-108.
ANALYSIS
• Respondents were largely male (74%) and either white (50%) or non-residentaliens (35%). The CRA Taulbee Survey, which polls the population of com-puter science faculty as a whole, reported 86% of Assistant- and Associate-level faculty, the two ranks the current survey addresses, are male, 58% arewhite, and 16% are non-resident aliens.
• Data on applications and offers point to a positive atmosphere for applicants. Onaverage, applicants were invited to interview for one out of every 3.5 positionsthey applied for, and the average applicant was invited to interview for 6 differ-ent positions. The average applicant received 3.5 job offers, or one offer for every6 applications submitted.
• Female respondents submitted far fewer applications than males, with only 6 applications per person compared to 25 per person for men.
• Breaking down the application, interview, and offer data by the tier of the appli-cant’s graduate institution reveals some notable differences. As expected, Tier 1graduates received more offers to interview and more job offers per person thangraduates of Tier 2 and 3 institutions. In fact, Tier 1 graduates received morethan twice as many invitations to interview and job offers than Tier 2 gradu-ates. Interestingly, Tier 3 graduates did much better in both areas than their Tier
65

2 counterparts.• Questions about applicants’ decision criteria for positions to apply for revealed
that departmental ranking/reputation (71%), geography (62%), the ability focuson research (41%) or balance research and teaching (38%) most often drovedecisions on which positions to apply for. Access to quality graduate students(32%) and departmental morale/culture (24%) were also relevant decision crite-ria. The advice of peers and advisors was also an important factor in choosingpositions to apply for. Among respondents, 85% said that the advice of peers waseither “somewhat” or “very” important, although only 1% characterized theopinion of peers as one of the top four decision criteria. Recommendations fromadvisors were “somewhat,” “very,” or “most” important to 75% of applicants,although a comparatively small number (18%) reported that their advisor’s opin-ion was one of the four most important factors in their decision.
• For those applicants who received multiple job offers, each of the job traits list-ed above remained important in the final decision, with the important additionof salary considerations. Salary was ranked by 29% as one of the top four fac-tors in choosing which offer to accept, while 26% selected startup packages.Considering the overlap between respondents who included both salary andstartup packages among their top four factors, 38% of applicants included oneor the other as a decisive factor. Geography (41%), departmental ranking/repu-tation (38%), morale/culture (38%), and access to quality graduate students(24%) were the other considerations ranked most highly.
• When these responses are further categorized by gender, some differences in pri-orities become clear. For female new hires who received multiple job offers, thepresence of colleagues in the same research area (44%) and access to qualitygraduate students (44%) were the most important factors in choosing a job,while these factors were much less important to males. Only 12% of malerespondents ranked colleagues in their research area as one of their top four fac-tors in choosing a position, and 20% included graduate students in that list.Departmental rankings and reputation were far more important for men—44% of men listed rankings as a top factor, while only 22% of women did. Allother factors were roughly equal considerations for men and women
• Finally, we used the collected data to determine where candidates from each tierof graduate institutions ended up. By comparing the NRC rankings of the insti-tutions that hired the respondents with the ranks of their graduate institutions,we found that the average Tier 1 graduate moved down almost a full tier, whileTier 2 graduates stayed in roughly the same tier and Tier 3 graduates moved upa half tier. In general, there is some downward movement for Tier 1 and 2 grad-uates, and upward movement for Tier 3 graduates. Significantly, although only 21% of respondents received their Ph.D.s from Tier 3 institutions, 41% endedup employed by those institutions. This indicates that there is at least some over-all “trickle down” of Ph.D.s from the higher- to lower-ranked institutions.
66

RESULTS
Demographic Information
Current Rank: 1 Associate, 33 Assistant
Gender: 9 Female, 25 Male
Ethnicity: 17 White; 12 Nonresident alien; 3 Asian; 1 African-American; 1 Other
Graduate Institution:Tier 1 (NRC ranks 1-36): 59%; Tier 2 (NRC ranks 37-72): 21%;Tier 3 (NRC ranks 73-108): 21%.
Applications and Offers
Number of Applications Submitted:22 applications per person For women: 6 applications per personFor men: 25 applications per person
Interviews: 203 total; 6 interviews per person, 1 interview per 3.5 applications
Interviews and Offers by Graduate Institution Rank:
Tier 1 (NRC Rank 1-36)(n=20)8 interviews per person; 4.3 offers per person
Did you receive a job offer from your first-choice academic institution?Yes: 26%; Didn’t have a first choice: 53%; No: 26%.
By gender:Male: 9.2 interviews per person, 4.8 offers per personFemale: 4.6 interviews per person, 3.3 offers per person
Tier 2 (NRC Rank 37-72)(n=7)3.6 interviews per person; 1.9 offers per person
67

Did you receive a job offer from your first-choice academic institutionYes: 43%; Didn’t have a first choice: 43%; No: 14%.
By gender: No females
Tier 3 (NRC Rank 73-108)(n=7)4.4 interviews per person; 3 offers per person(Excluding outliers: 2.7 interviews per person, 2 offers per person)
Did you receive a job offer from your first-choice academic institution? Yes: 71%; Didn’t have a first choice: 29%; No: 0%.
By gender: Sample size too small
Decision Criteria
Did you apply for industrial positions as well as academic positions?No (74%); Yes (26%)
What were the four most important criteria in choosing the academic positionsyou applied for?
Departmental ranking/reputation (71%)Geography (62%)Ability to focus on research (41%)Ability to balance teaching and research focus (38%)Departmental morale/culture (38%)Access to quality graduate students (32%)Ability to find employment for spouse or partner (24%)Presence of colleagues in the same research area (21%)Recommendation of advisor (18%)Salary (18%)Strong institutional support for your department (18%)Startup package (15%)Ability to focus on teaching (1%)Space/research facilities/equipment (1%)Recommendation of peers (1%)Publishing pressure (1%)Cost of living (0%)Access to quality undergraduate students (0%)
68
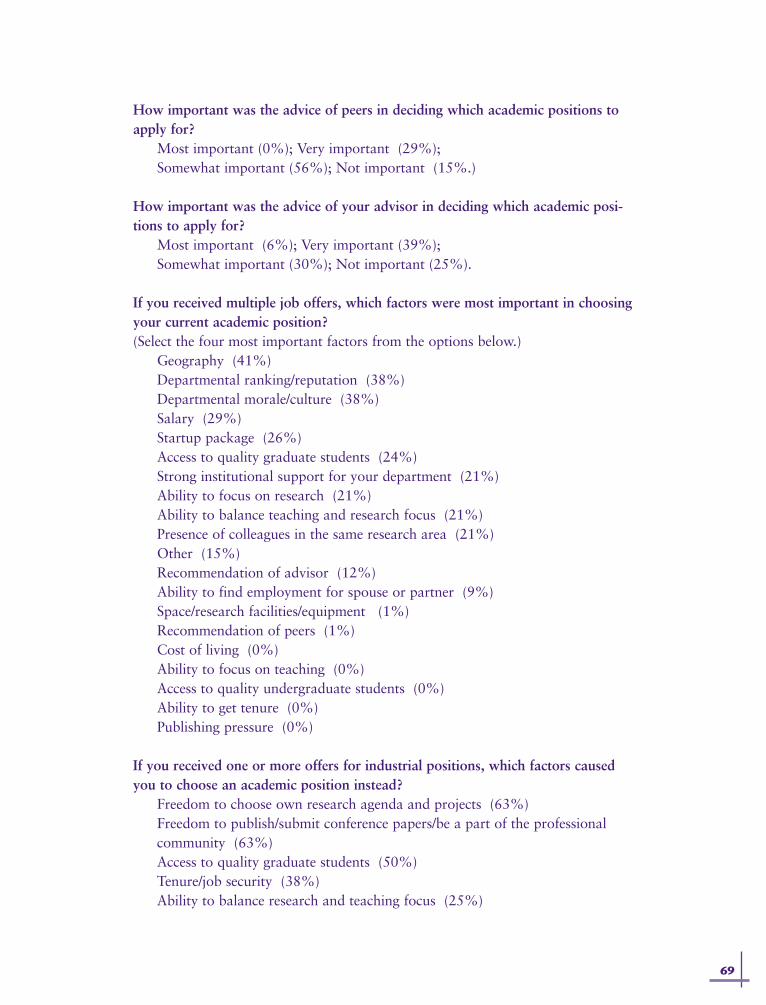
How important was the advice of peers in deciding which academic positions toapply for?
Most important (0%); Very important (29%); Somewhat important (56%); Not important (15%.)
How important was the advice of your advisor in deciding which academic posi-tions to apply for?
Most important (6%); Very important (39%);Somewhat important (30%); Not important (25%).
If you received multiple job offers, which factors were most important in choosingyour current academic position?(Select the four most important factors from the options below.)
Geography (41%)Departmental ranking/reputation (38%)Departmental morale/culture (38%)Salary (29%)Startup package (26%)Access to quality graduate students (24%)Strong institutional support for your department (21%)Ability to focus on research (21%)Ability to balance teaching and research focus (21%)Presence of colleagues in the same research area (21%)Other (15%)Recommendation of advisor (12%)Ability to find employment for spouse or partner (9%)Space/research facilities/equipment (1%)Recommendation of peers (1%)Cost of living (0%)Ability to focus on teaching (0%)Access to quality undergraduate students (0%)Ability to get tenure (0%)Publishing pressure (0%)
If you received one or more offers for industrial positions, which factors causedyou to choose an academic position instead?
Freedom to choose own research agenda and projects (63%)Freedom to publish/submit conference papers/be a part of the professionalcommunity (63%)Access to quality graduate students (50%)Tenure/job security (38%)Ability to balance research and teaching focus (25%)
69

Access to quality undergraduate students (13%)Geography (13%)Presence of colleagues in the same research area (13%)Ability to find employment for spouse or partner (13%)Recommendation of peers (13%)Recommendation of advisor (13%)Startup package (13%)Cost of living (13%)Ability to focus on teaching (0%)Ability to focus on research (0%)Salary (0%)Space/research facilities/equipment (0%)
Movement Through the Ranks
(Determined by calculating the difference between each respondent’s graduateinstitution rank and the rank of the institution that hired him/her).
Graduates of Tier 1 institutions:(n = 20)Average Tier 1 grad went to Tier 1.75 institution.50% stayed at the same tier, 50% moved down at least one tier.
Graduates of Tier 2 institutions:(n = 7)Average Tier 2 grad went to Tier 2.1 institution.14% moved up one tier, 57% stayed at same tier, 29% moved down one tier.
Graduates of Tier 3 institutions:(n = 7)Average Tier 3 grad went to Tier 2.4 institution.43% moved up at least one tier, 57% stayed at the same tier.
Composition of Academic Institutions by Graduate Institution Rank
Tier 1 schools:83% are graduates of Tier 1 institutions8% are graduates of Tier 2 institutions9% are graduates of Tier 3 institutions
70

Tier 2 schools:25% are graduates of Tier 1 institutions50% are graduates of Tier 2 institutions25% are graduates of Tier 3 institutions
Tier 3 schools:58% are graduates of Tier 1 institutions17% are graduates of Tier 2 institutions25% are graduates of Tier 3 institutions
71

72

APPENDIX D. SURVEY OF ACADEMIC RECENT JOB CHANGERS
SURVEY METHODOLOGY
Sixty-four computer science faculty members who moved from one academicinstitution to another in the past three years were asked to complete an online
survey on faculty recruitment and retention. Of the invitees, 38 completed the sur-vey, a 60% response rate. Respondents’ institutions were well distributed amongthe NRC ranks: 35% represented NRC-ranked schools 1-36, 24% worked forschools ranked 37-72, and 41% for schools ranked 73-108.
ANALYSIS
• Respondents were mainly male (79%) and either white (53%) or Asian (26%).The CRA Taulbee Survey, which polls the population of computer science facul-ty as a whole, reported that 92% of Full Professors and 86% of AssociateProfessors, the two ranks the current survey addresses, are male; 76% and 71%are white; and 16% and 21% are Asian.
• Data on applications and offers point to a positive atmosphere for applicants. Onaverage, respondents submitted 5.2 applications each, and received 3.1 offers tointerview each, or 1 interview offer per 1.8 applications. The average applicantreceived 2.1 job offers, or one offer for every 2.6 applications submitted.
• When asked to select their four most important reasons for leaving their previ-ous position, respondents chose access to quality graduate students (47%),departmental morale/culture (42%), departmental ranking (40%), and salary(37%) most often. Though similar in most other areas, 43% of males selected“salary” as a reason for leaving, while only 13% of females did; and 43% ofmales selected “departmental ranking/reputation,” while only 25% of femalesdid. This split is mirrored in both the “new hires” survey and the data on deci-sion criteria for job applications discussed below.
• Questions about the criteria applicants used when deciding what positions toapply for revealed that departmental ranking/reputation (70%) and access toquality graduate students (57%) were dominant selection criteria. The presence
73

of colleagues in the same research area (38%), geography (38%), and depart-mental morale/culture (35%) were also important factors. Male and femaleresponses were fairly even in most areas, but men valued salary (28% to 0%) anddepartmental rankings (76% to 50%) more highly than women.
• For those applicants who received multiple job offers, each of the job traits list-ed above remained important in the final decision, with the important additionof salary considerations. Salary was ranked by 40% of respondents as one of thetop four factors in choosing which offer to accept, while 7% selected startuppackages. The ability to find employment for a spouse or partner (33%) was alsoa major deciding factor.
• Because this survey deals with faculty who have left another academic institution,we asked how, if at all, their previous department tried to prevent them from leav-ing. Additional salary was the major incentive to stay in most cases (42%). Simplepersuasion, without any tangible incentive or change, was another popular response(24%). The 37% of respondents who selected “other” described a wide range ofdepartmental reactions, all of which ultimately failed. Of respondents, 47% saidthat nothing their department could have done would have convinced them to stay.
• Finally, we used the collected data to determine where candidates from each tierof academic institutions ended up. By comparing the NRC rankings of the insti-tutions that hired the respondents to the rankings of their former employers, wefound that the average Tier 1 employeemoved a third of a tier down, while Tier2 employees moved two-thirds of a tier up, and Tier 3 employees moved upthree-quarters of a tier. In general, there is some downward movement for Tier 1employees, and upward movement for Tier 2 and 3 graduates. Only 7% ofrespondents moved down a tier, however, and none moved down more than onetier. No respondent moved from industry to a Tier 3 institution.
RESULTS
Demographic Information
Current Rank: 15 Professors; 21 Associate; 1 Assistant.
Gender: 8 Female; 29 Male.
Ethnicity: 20 White; 9 Asian; 4 Other; 3 Nonresident alien; 1 Hispanic; 0 African American.
Current Institution: Tier 1 (NRC ranks 1-36): 35%Tier 2 (NRC ranks 37-72): 24%Tier 3 or unranked (NRC ranks 73-108): 41%
74

How many tenure/tenure-track jobs have you held, including your current position?0 positions: 2 3 positions: 81 position: 7 4 positions: 12 positions: 19 5 positions: 1
Applications and Offers
Number of Applications submitted:5.2 applications per person; 47% submitted 2 or less applications.For women: 5.6 applications per person; For men: 5.1 applications per person.
Interviews: 107 total; 3.1 interviews per person; 1 interview per 1.8 applications.
Decision Criteria
Did you leave your immediately previous position because you were denied tenure?Yes (0%); No (100%).
Why did you leave your immediately previous position?Select the four most important reasons from the options below.
Overall Male Female
Access to quality graduate students 47% 46% 50%Departmental morale/culture 42% 43% 38%Departmental ranking/reputation 40% 43% 25%Salary 37% 43% 13%Presence of colleagues in same research area 29% 27% 38%Geography 26% 27% 25%Inadequate institutional support for your dept. 21% 20% 25%Ability to find employment for spouse/partner 18% 17% 25%Desire to balance teaching and research focus 18% 20% 13%Desire to focus on research 11% 7% 25%Cost of living 5% 3% 0%Recommendation of peers 5% 7% 0%Space/research facilities/equipment 5% 7% 0%Access to quality undergraduate students 3% 3% 0%Startup package 3% 3% 0%Desire to focus on teaching 0% 0% 0%Recommendation of advisor 0% 0% 0%Publishing pressure 0% 0% 0%
75

Did you apply for industrial positions as well as academic positions?No (89% ); Yes (11%)
If you received one or more offers for industrial positions, what attracted youmost to industry?
Select the three most important factors from the options below.
Stock options/Employee Stock Purchase Plan (50%)Salary (25%)Less grant-writing demand (25%)No teaching requirement (25%)Presence of colleagues working in the same research area (25%)Less committee work (0%)Less publishing demand (0%)Better access to research materials (e.g., databases for data mining research) (0%)Better space/facilities (0%)Better support staff (0%)
What were the most important criteria in determining which academic positionsto apply for?
Select the four most important criteria from the options below.
Overall Male Female
Departmental ranking/reputation 70% 76% 50%Access to quality graduate students 57% 59% 50%Presence of colleagues in same research area 38% 35% 50%Geography 38% 35% 50%Departmental morale/culture 35% 38% 25%Ability to find employment for spouse/partner 24% 24% 25%Salary 22% 28% 0%Ability to focus on research 22% 21% 25%Ability to balance teaching and research focus 11% 10% 13%Strong institutional support for your dept. 8% 10% 0%Cost of living 8% 10% 0%Recommendation of peers 5% 7% 0%Space/research facilities/equipment 5% 7% 0%Access to quality undergraduate students 5% 3% 12%Startup package 5% 3% 0%Ability to focus on teaching 0% 0% 0%Recommendation of advisor 0% 0% 0%Publishing pressure 0% 0% 0%
76

77
Did you receive a job offer from your first-choice academic institution?Yes (74%); No (3%); Didn’t have a first choice (23%).
By gender:Men (n=27): Yes (67%); No (4%); Didn’t have a first choice (29%).Women (n=8): Yes (100%); No (0%); Didn’t have a first choice (0%).
If you received multiple academic job offers, which factors were most importantin choosing your current position?
Select the four most important factors from the options below.Departmental ranking/reputation (60%)Geography (47%)Access to quality graduate students (47%)Salary (40%)Presence of colleagues in the same research area (40%)Departmental morale/culture (33%)Ability to find employment for spouse or partner (33%)Ability to focus on research (20%)Strong institutional support for your department (15%)Recommendation of peers (13%)Ability to balance teaching and research focus (7%)Cost of living (7%)Space/research facilities/equipment (7%)Startup package (7%)Ability to focus on teaching (0%)Access to quality undergraduate students (0%)Publishing pressure (0%)Recommendation of advisor (0%)Ability to obtain tenure (0%)
When your previous department learned that you were leaving or consideringleaving, what was their response?
Select all applicable choices.Offered more salary (42%)Attempted to persuade you to stay, but did not offer additional incentives (24%)No action by department (13%)Offered lower teaching load (8%)Offered tenure (5%)Offered summer support (3%)Offered sabbatical (3%)Other (37%)

“Other” responses included:• Asked “What can they do to convince me to stay?” • At first they did not make a counteroffer, and then as they realized I
was serious, did so.• Goodbye and good luck.• Offered housing loans.• Offered me Associate Dean position.• Offered to buy a house.• Offered to create a university research institute for me.• Offered to find another department head to replace me.• Exploring a more flexible work environment (e.g., telecommuting
support, remote office space, and so forth).
Which of these responses was the most persuasive to you?More salary (16%); Lower teaching load (2%).
Why was your department’s response ultimately inadequate to persuade you to stay?• Couldn’t change the departmental culture. • Given the huge difference in ranking/reputation, my previous institution
knew that nothing they would offer could really make me stay.• I wanted to work at the same institution as my spouse, and I was curious
to try an academic environment after several years in industrial research.• I was determined to move to academia.• Lack of quality grad students and the poor research promise of department.• Department reputation, plus child’s education.• My decision to leave is purely for family concern.• None. I had already decided to leave. The change in culture to a major
research institution was going to take too long.• They did not help in finding a position for my spouse.• Lack of employment opportunities for spouse.• Overall department morale was low due to inadequate university support
over a period of years.
What, if anything, could your department or institution have done to prevent youfrom leaving?
• Nothing (47%)• Demonstrate stronger institutional support for my department and for my
research institute.• Fired the president.• Nothing. Even an offer to be considered as chair at that institution would
not have been attractive because I did not see the vision for growth fromthe administration.
78

• Better institutional support. Willing to invest and hire in new areas.• Offered a modest salary increase.• Helped in finding a position for my spouse.• Promoted me to Professor.• Kept salaries in a reasonable range.
Movement Through the Ranks
(Determined by calculating the difference between each respondent’s immediatelyprior employer ranking and the ranking of their current institution).
Employees coming from Tier 1 institutions (n = 7):Average Tier 1 employee went to Tier 1.29 academic institution
Employees coming from Tier 2 institutions (n = 8):Average Tier 2 employee went to Tier 1.33 academic institution
Employees coming from Tier 3 institutions (n = 5):Average Tier 3 employee went to Tier 2.15 academic institution
Employees coming from industry (n = 8):Average industry employee went to Tier 1.38 academic institution
Composition of Academic Institutions by Immediately Prior Employer InstitutionRanking
Tier 1 schools: 26% came from Tier 1 institutions32% came from Tier 2 institutions16% came from Tier 3 institutions26% came from industry
Tier 2 schools: 15% came from Tier 1 institutions23% came from Tier 2 institutions39% came from Tier 3 institutions23% came from industry
Tier 3 schools: 0% came from Tier 1 institutions0% came from Tier 2 institutions100% came from Tier 3 institutions0% came from industry
79

80

APPENDIX E. SURVEY OF FACULTY SEARCH COMMITTEES
SURVEY METHODOLOGY
CRA contacted chairs of 30 Ph.D.-granting computer science departments andasked them or the heads of their current faculty search committees to com-
plete an online survey on faculty recruitment and retention. Of the 30 invitees, 21completed the survey, a 70% response rate. Respondents were somewhat skewedtowards the top tier of graduate institutions, with 52% from NRC-ranked schools1-36, 19% from schools ranked 37-72, and 29% from schools ranked 73-108.
ANALYSIS
• While the previous surveys (new hires and job changers) showed a very positiveatmosphere for applicants, responses from search committees portray a morerestrained environment. The new hires survey showed that, on average, appli-cants were invited to interview for one out of every 3.5 positions they applied for,and the average applicant was invited to interview for 6 different positions. Theaverage applicant received 3.5 job offers, or one offer for every 6 applicationssubmitted. The search committee chairs, however, reported extending only oneinterview for every 12.7 applications received, and one offer for every 43 appli-cations. These differences seem greater than normal variance could account for,and may indicate that our previous sample of new hires was skewed towardsmore attractive candidates (by definition, the new hires were at least qualified forone position, which may differentiate them from some of the applicants thesearch committees draw from).
• There is a clear difference between the number of applications received by Tier 1(NRC rank 1-36) and Tier 3 (NRC rank 73-108) institutions, with Tier 1 schoolsreceiving 43% more applications than Tier 3.
• When asked for the most important factors in choosing applicants to interview,search committee chairs ranked “area/needs” first (with 67% ranking this first
81

or second), followed by “number of quality papers” and “letters of recommen-dation” (62% ranking first or second for both).
• We were interested in anecdotal reports that large numbers of applications wereobviously unviable, with the applicant having little or no chance of receiving aninterview. With this in mind, we asked for the distinguishing characteristics ofboth good and bad applications, and received a variety of answers. Marginalapplications included a weak publication record, poor matches with the needs ofthe department, degrees from lower-ranked institutions, and poor written andinterpersonal skills. Potentially viable applications indicated broad interests, aclear research agenda, a good publication record, solid recommendation lettersfrom respected scholars, and a strong graduate institution.
• Several questions asked search committee chairs how they valued different typesof applicants, in particular candidates who are of very high quality overall but apoor match for the area needs of a department, and candidates who are womenand underrepresented minorities. In the first case, responses were mixed, withseveral search chairs indicating that they would ignore area needs for a high-quality candidate, and others saying they would either not even interview poorarea matches, or ultimately choose a lower-quality but more suitable applicant.Of respondents, 76% said they screen for women and underrepresented minori-ties, meaning they flag those applications and pay special attention to them.Some respondents indicated that female/URM status is a significant primary con-sideration, while others said that such status would only come into play after aca-demic credentials were found to be comparable.
• Anecdotal accounts of departments waiting a long time for their first-choice can-didate to decide and then losing a second choice when the first fell throughprompted us to ask several questions about this scenario. Of respondents, 67%reported losing a second choice after waiting an extended period for their firstchoice to decide, and 20% said this happened “frequently” or “very frequently”(with another 53% responding “occasionally”). On the other hand, most depart-ments reported success in getting their first choice; of their last five hires, 75%were a first choice.
• Our results provide no solid evidence that lengthening the search process orextending multiple offers for each position significantly improve recruiting.Searches lasting 3 to 5 months resulted in an 80% fill rate, 6 to 7 months an 82%fill rate, and 8 to 10 months a 67% fill rate. Departments that extended multi-ple offers filled 79% of their positions, while other departments filled 74% ofavailable positions. Though this is not a substantial improvement, many chairsexpressed the belief that multiple offers increased their chances of landing a qual-ity recruit.
• Lastly, we asked search committee chairs why they did not fill all of their openpositions. For the 23% of positions that remained open, 50% went unfilledbecause there was no acceptable candidate, while another 25% were left open
82

after the department made an offer, waited for a reply, and then lost their nextchoice. When asked to consider the strongest candidate to which they did notmake an offer, 62% did not make an offer because of another, stronger candi-date, 33% thought it was unlikely the candidate would accept, and 24% did notbelieve the candidate would raise the level of their faculty.
RESULTS
Open Positions
21 institutions reported 69 open positions, or 3.3 open positions per school.
By department rank:Tier 1 (NRC ranks 1-36): 3.4 open positions per schoolTier 2 (NRC ranks 37-72): 4.8 open positions per schoolTier 3 or unranked (NRC ranks 73-108): 2.2 open positions per school
Applications and Offers
Number of Applications received: 57 applications per open positionBy department rank:Tier 1 (NRC ranks 1-36): 67 applications per open positionTier 2 (NRC ranks 37-72): 54 applications per open positionTier 3 or unranked (NRC ranks 73-108): 47 applications per open position
Interviews:Overall, institutions extended 4.5 offers to interview for each open position. 7.9% of applications led to an interview (1 interview for every 12.7 applica-tions).
Offers: Overall, institutions extended 1.4 offers per open position.3.4 interviews per offer30% of interviews led to an offer2.3% of applications led to an offer
83

84
Decision Criteria
In general, what were the most important factors in choosing interviewees?
Rank order each from 1 to 5. The factor ranked “1” is the most important.
Least Important Most important Factor 1 2 3 4 5
Number of quality papers in quality journals or conferences 33% 29% 14% 14% 24%
Letters of recommendation from advisors 38% 24% 19% 19% 0%
Graduate school ranking/reputation 19% 38% 5% 24% 10%
Area/needs 43% 24% 24% 5% 5%
Other 0% 0% 0% 0% 0%
If you ranked “Number of quality papers in quality journals or conferences” 1, 2,or 3, how do you determine if a paper is “quality”?• As perceived by senior people in the field.• Knowledge of conferences in the area; sometimes by reading the paper; from let-
ters of reference.• Based on which conferences/journals the paper is published in.• We know the conferences and read the individual papers.• Reading it.• Have our faculty in the related research area evaluate the quality of the papers.
How do you determine that a journal or conference is “quality”?• Faculty familiarity with the literature and journal selectivity; conferences must be
refereed-reviewed.• Based on the opinion of our existing faculty.• Reputation among peers; composition of editorial board and program commit-
tee; acceptance rates.• Knowledge of the conferences from current faculty.• Faculty in the relevant area.
How important are interviews in evaluating candidates?Very important (100%); Somewhat important (0%); Not important (0%).
What do you hope/expect to see in a candidate’s interview?• Innate curiosity about a variety of fields; desire for collaboration; interest in
working across traditional boundaries.• Teaching ability. Ability to think and speak. Personality.

85
• Solid foundation, scientific thinking, creativity, articulate.• People who are capable of good teaching, who seem to be interested in working
with the existing faculty, and who can think on their feet.• Confidence, maturity, good academic citizenship.• Smarts, capability, excitement, high interest level, maturity.• Ability to communicate at several levels: personal, with a group, in a seminar. • Verification of resume.• Does this person have good people, presentation, and interaction skills?• Maturity; a vision of early scholarship and funded research path(s); interest in
teaching and working with students at BS, MS, and doctoral levels; indication ofcollegial attitudes; interest/indication of being a team player; interest in our pro-gram and environment.
How important are talks in evaluating candidates?Very important (81%); Somewhat important (19%); Not important (0%).
What do you hope/expect to see in a candidate’s talk?• Ability to organize presentations clearly; some levels of experience and sophisti-
cation in using visual aids; clarity of expression; ability to respond to informedand not-so-informed questions; humor helps.
• Find compatibility with our needs; ensure the candidate can defend his/her work;gauge level of interest by existing faculty.
• Depth of knowledge and ability to present complex ideas to a fairly general audience.• Teaching potential; verbal skills; handling questions.• Clarity, depth of knowledge, ability to make ideas clear.• Importance of research problem, candidate’s expertise, teaching ability.• The talk should demonstrate an excellent technical presentation capability, and
reflects an apparent competence of doing innovative research.• Ability to be a strong teacher; depth and importance of research; ability to
explain what he/she is doing.• Clear statement of a problem; clear explanation of the solution; honest assess-
ment of the solution; context to enable audience to understand the contribution.
What are the distinguishing characteristics of an obviously unviable application?Poor publications (38%); Poor area fit (19%); Graduate school reputation/ranking (14%)
Comments included:• Weak or no publications; weak letters.• Poor area match. Degree far outside CS. Very weak school.• Poor publication record (often very poor outlets).• Talk incomprehensible or poorly organized or presented; interactions that annoy
people; superficial research.

• People with poor presentation skills, who cannot answer simple questionssmoothly, and who do not seem to have a concrete idea of the direction his/herresearch.
• Area of interest; graduate school ranking.• Few publications, not a major university, research outside of normal areas.• Glaring uncorrected technical errors in faculty meetings or seminar presentation;
lack of enthusiasm (or at least some demonstration of it) in their research area;poor interpersonal skills.
What are the distinguishing characteristics of a potentially viable application?Strong publications (43%); Research record (19%); Graduate school reputation (14%); Strong letters (14%); Broad research interests (10%); Area fit (10%).
Comments included:• Informed and broad interests; solid interpersonal skills; clear vision of near-term
research agenda; some accurate information about department and specificknowledge of faculty with whom candidate interests overlap.
• Good publication record; coming from a good department/school; Advisor’sfame.
• Sense of research direction, fit with existing efforts, communication skills.• Solid list of published research articles (some as principal author and some as col-
laborative author).• Knows research area and presents it well.• Strong technical ability, clearly articulated research plan, charm.• Excellent school, good letters, publications.• People who present well, who ask deep (non-canned) questions, and who have
some “concrete good ideas” of where they want to go next.• Good publications in extremely competitive conferences (often 10%-20% accep-
tance rates, recognized best conferences and papers).
How do you handle the tradeoff between the general quality of an applicant andhis/her ability to match your need in a specific research/teaching area? In otherwords, if a candidate is of very high quality but in the wrong area, how do youvalue them?
• We typically value candidate quality over area needs.• We consider very strong candidates even if the area match is not ideal.• If he/she is a potential “walk-on-water” person, we will interview him/her any-
way. We have a special “at-large” committee set up to handle such candidates.• Very highly, unless in a very few areas that we are explicitly not investing in.• We wouldn’t hire in the wrong area.
86

• We try not to interview candidates in “wrong” areas. Our department is too smallto afford such hires.
• Key thing is quality of applicant; beyond that, area comes into play.• If a case can be made that the applicant is a “star,” being in the wrong area, while
reducing the likelihood of hire, does not preclude it.• We have desperate needs in certain areas and we would not interview someone
who does not meet them unless they are from a minority group. We would hirea minority candidate outside our needs.
• Strong candidates in all areas are given serious consideration; about 1/3 of appli-cants invited fall into this category.
• With great pain and difficulty. If in an area in which we are “overstaffed,” wouldlikely pass; if in any other area would likely (and have) made offer of a tenure-track position.
Do you specifically screen the applicant pool for female and underrepresentedminority candidates? (An example would be flagging such applications as theycome in and then evaluating the list of those invited to interview with flaggedapplications in mind.)
Yes (76%); No (24%).
Briefly explain your answer:• We take note of candidates from the underrepresented group and will take
some liberties in our normal standards if a candidate seems likely to meetmost of our expectations. We do not invite candidates for an on-campusinterview unless we believe there is a good chance of hiring them.
• The first level of screening is based on quality and needs.• We are only interested in the academic credentials.• We add underrepresented as factor in the metric used when deciding whom
to invite.• Preference is given to female and underrepresented minority candidates in
setting interviews.• The search committee did not, but I instructed them to go back and do that.• We flag them; we almost always ask for letters; we try to interview them
whenever possible.• We are especially careful not to miss highly qualified candidates from this
pool.• To do so is probably illegal.• During the search process, we make sure every female and minority appli-
cation has been carefully reviewed and that we have explicit and well rea-soned explanations as to why the candidate is not being interviewed/hired(if they aren’t).
87

88
Do members of the search committee pre-screen applicants before the interview? If yes, in which of the following ways do you so? Select all that apply:
Speak to or email candidate (52%)Speak to or email candidate’s advisor (43%)
Do not contact/pre-screen applicants (24%)Other (24%)Go to a public talk/conference to see candidate (19%)
“Other” responses included:• Talk to letter-writers.• Intense look at CV, talk to faculty in area, study letters of recommenda-
tion, etc.• Call references.• If there is no indication that the application should be treated as confiden-
tial, we will check with friends and colleagues in the applicant’s depart-ment or closely affiliated departments.
Search Processes and Results
When your faculty search committee evaluates applicants, is there usually signifi-cant unanimity on who the leading candidates are?
Yes (86%); No (14%).
In which month do you start and end a search? Use the time between the posting datefor a position and the date the position is either closed or the search is suspended.
Start: August (5%); September (19%); October (9%); November (19%);December (43%); January (5%).
End: February (9%); March (14%); April (10%); May (48%); June (14%);July (5%).
How long do you give candidates to decide on an offer?2 to 4 weeks (67%); 3 to 6 weeks (10%); Flexible (23%).
How do you react when a candidate you have interviewed pushes you for a decision?• It depends on how quickly the candidate wants a decision, how early/late we
are in the process, and how strongly we feel about the candidate. We do makeoffers before we have completed the entire interview roster, but always retain atleast one open slot.
• Depends on how badly we want the candidate; usually try to make a quickdecision if need be.

• Give the facts regarding our decision process. Ask candidate to request exten-sion for other offers.
• Give them a time frame in which we will make our decision.• Not an issue: decisions are made rapidly for top candidates.• Positively—we understand their needs.• Try to respond in a way to keep the candidate interested.• We explain up front what our timetables and constraints are. Generally the uni-
versity will not provide us with any flexibility beyond this.• We try to give them one of three answers immediately: 1) We are not consider-
ing your case further; 2) The paperwork isn’t final, but we expect to make youan offer; 3. You are still under strong consideration, and we can give you moreconcrete feedback soon.
Have you lost second-choice candidates because you waited a long time for yourfirst choice to decide?
Yes (67%); No (33%).
If “yes,” how frequently does this occur?(n = 15): Very frequently (7%); Frequently (13%); Occasionally (53%); Almost never (27%).
Of your last 5 hires, how many were your first-choice candidates?Schools hired their first-choice candidate 75% of the time.
Were you permitted by your Dean to make more offers than you had open positions?Yes (52%); No (48%)By department rank:Tier 1: Yes (82%), No (18%); Tier 2: Yes (25%), No (75%); Tier 3: Yes(17%), No (83%).
If yes, did you take advantage of that opportunity?Yes (100%); No (0%)
What was the outcome of this decision?• Increased our chances, never exceeded number of open slots.• It increased the probability of filling all the slots.• Hired the original number planned.• Sometimes we get people we might not otherwise have gotten; other times, it did-
n’t make a difference.• We overbid; but we only choose candidates we want. So in some sense we just
have more #1 choices that year. We never go to #2 on our list.
89

90
• Once we got 2 candidates where one was expected; once we got one of our toptwo candidates.
• We hired 2 excellent people.
How would the university handle a situation in which all the offers were accept-ed, leaving you with more new faculty than open positions?• Would never happen.• Honor the offers.• They would give us the positions from future hires; would result in change in
how many offers can be made.• We would borrow from next year.• No problem; budget is approved for these.• Most likely the department’s open positions next year will be cut accordingly.• We got some bulges to cover the gaps and it affected future hiring. It also was a
strategy that let us grow the department beyond the projection.• We’d accept the new faculty and be more careful in the future.
Hiring Decisions and Outcomes
Is your search complete for the 2000-2001 academic year?Yes (67%); No (33%)
How many unfilled openings did you have at the end of your search?77% of open positions were filled.By department rank:Tier 1: 81% filled; Tier 2: 68% filled; Tier 3: 77% filled.
Which best describes the reason the position was not filled?No acceptable candidate; did not make offer (50%).Made offer(s) which was/were declined; missed chance to make offer(s) toother acceptable candidate(s) (25%).Another scenario (25%).Made offer which was declined; no other acceptable candidates (0%).
Consider the strongest candidate(s) to which you did NOT make offers. Why didyou not make offers to them? Please select all that apply.
Another candidate was stronger (62%)Judged unlikely they would accept (33%)Would not raise the level of our faculty (24%)Didn’t think person would fit socially in the department (19%)Other (19%)Unable to do the job (5%)

AUTHORS:
John Stankovic and William Aspray
STUDY GROUP MEMBERS:
John Stankovic, University of Virginia (Chair)
William Aspray, CRA and Indiana University
Doris Carver, Louisiana State University
C. William Gear, NEC Research Institute
Barbara Grosz, Harvard University
Juris Hartmanis, Cornell University
Jolene Jesse, AAAS
Willis King, University of Houston
Clayton Lewis, University of Colorado, Boulder
Eric Roberts, Stanford University
Henry Walker, Grinnell College
Elaine Weyuker, AT&T Labs - Research
Wei Zhao, Texas A&M University
Stuart Zweben, Ohio State University
This study and report were made possible by the generous support of the Computer and
Information Science and Engineering Directorate of the National Science Foundation (Award
EIA0107409, Principal Investigator, William Aspray).
Copyright 2003 by the Computing Research Association. Permission is granted to reproduce the contents, provided thatsuch reproduction is not for profit and credit is given to the source.
Additional copies of this report are available from CRA:
COMPUTING RESEARCH ASSOCIATION
1100 17th Street, NW, Suite 507Washington, DC 20036-4632E-mail: [email protected]: 202-234-2111Fax: 202-667-1066URL: http://www.cra.org
ACKNOWLEDGMENTS:
The following people kindly reviewed drafts of the report and provided comments that thestudy group considered in preparing the final report:
Joanne Cohoon, University of VirginiaSarah Douglas, University of OregonEric Roberts, Stanford UniversityHenry Walker, Grinnell CollegeStuart Zweben, Ohio State University
The study group appreciates the excellent work done by Patrick McMullen (CRA) who draftedthe survey forms, conducted the surveys, prepared the initial analysis of the survey results, conducted background research, assisted with the report writing, and in many other ways provided support to the study group. Our thanks to Jean Smith (CRA), who edited the report.

RECRUITMENT AND RETENTION OF FACULTY IN COMPUTER SCIENCE AND ENGINEERING
By John Stankovic and William Aspray
Computing Research Association
1100 17th Street, NW, Suite 507
Washington, DC 20036-4632
E-mail: [email protected]
Tel: 202-234-2111
Fax: 202-667-1066
URL: http://www.cra.org
CO
MPUTI
NGRESEARCH ASSO
CIA
TION
C R A