fairhaven economic development plan | mass.gov
TRANSCRIPT

Fairhaven Economic Development Plan
Prepared for
Town of Fairhaven
Prepared by
FXM Associates
December 2017
FXM Associates
Fairhaven Economic Development Plan 2
Contents
Section Page Introduction 3 Summary Findings 4 Market Conditions and Trends 5 Competitive Position 28 Shared Workspaces 39 Marketing 44 Funding Sources 47 Appendices
A. Shared Workspace Examples 51 B. Highlights of Interviews 58 C. Rental Housing Demand 60 D. Economic Development Goals 69

FXM Associates
Fairhaven Economic Development Plan 3
Introduction FXM Associates has been retained by the Town of Fairhaven to prepare an Economic Development Plan. The project has been funded by a grant from the Massachusetts Community Compact Program. The Plan includes: An assessment of market conditions and trends affecting potential job creation
and retention based on historical and projected growth in Fairhaven and the larger market area comprising Bristol and Plymouth Counties, as well as trends in net absorption of office, retail, and wholesale/industrial space in a real estate submarket comprising Fairhaven and nearby Southcoast communities.
An assessment of Fairhaven’s competitive position with respect to taxes and
education, and the perceptions of developers and other interviewees on the Town’s permitting processes compared to those in nearby communities.
A detailed analysis and discussion of potential opportunities for shared
workspaces. This subset of broader economic development potential was selected for special attention by the Town’s Economic Development Committee, based on inquiries received by local business and property owners and the potential for such uses to reoccupy vacant and underutilized commercial space.
Discussion of potential marketing initiatives to promote and support economic
development in Fairhaven, and potential funding sources for additional economic development initiatives.
Appendices including results of FXM’s Housing Demand Model, additional
information on shared workspaces, and a synopsis of the 12+ confidential interviews conducted by FXM senior staff.
On September 9, 2017, FXM staff met with the Economic Development Committee to kick off the project and to discuss key issues affecting economic development in Fairhaven, objectives for the project, and potential contacts for interviews. The Committee subsequently sent a list of potential contacts to FXM. A dozen confidential personal interviews were completed. The Appendix section of this report contains a synopsis of the key points made by the interviewees. On November 16, 2017, FXM staff met with the Economic Development Committee to present work in progress and to discuss the Goals and Objectives for economic development articulated in the Town’s draft Master Plan, and/or other appropriate goals for economic development. The Committee agreed to adopt the Master Plan’s Goals for economic development with the exception of the waterfront component (Goal 1), which they proposed to re-word. The Goals as accepted by the Committee are included as Appendix D.

FXM Associates
Fairhaven Economic Development Plan 4
Summary Findings The prevailing sentiment among members of the Economic Development
Committee and businesses, developers, and property owners interviewed is that Fairhaven should focus on helping existing businesses grow rather than expending substantial effort to try to recruit outsiders. Examples include maintaining the working waterfront and facilitating the retention as well as expansion needs of successful restaurants and retailers and the emerging health care sector. The latter could provide more jobs for local residents with expanded workforce training in concert with existing workforce training providers and community colleges.
Opportunities exist, based on historical and projected growth in jobs, as well as
declining vacancy rates in existing office space, to develop additional office space in Fairhaven. Shared workspaces offer particular promise for reuse of vacant and underutilized commercial buildings.
Prospects for reuse of vacant or underutilized buildings and buildable spaces,
now and in the foreseeable future, are most likely to be realized with zoning changes that enable further office space development and mixed residential/commercial uses.
Demand exists for market rate rental housing (especially of higher density) and
developing such housing could attract a skilled labor force from a broader area as well as offer opportunities for younger households and empty nesters to remain in Fairhaven.
Interviews revealed general satisfaction by businesses and developers with
Town permitting processes. Fairhaven has a relatively high commercial tax rate compared to most nearby
communities, but substantially lower than that of New Bedford, which is considered its chief competitor for development. The Town’s relatively low residential tax assessments, rates, and per capita levies are a distinct competitive advantage for attracting a skilled labor force.
Marketing content via a new or expanded website for economic development
should highlight the Town’s superior regional transportation accessibility and infrastructure, population and economic stability, diversified businesses and employment, cultural and recreational resources, and relatively affordable housing with low tax rates.

FXM Associates
Fairhaven Economic Development Plan 5
Market Conditions and Trends This section includes analyses of demographic and business characteristics, comparing key population, household, workforce, and industry attributes in Fairhaven with those of Bristol and Plymouth Counties as well as Massachusetts overall. Prospective developers and businesses use these kinds of profiles when comparing alternative locations for investment. Additionally, the analysis can reveal where public and private sector economic development initiatives may be useful to enhance a community’s competitive profile. Historical and projected changes in employment by industry are then analyzed, given that job growth is typically the most reliable indicator of an industry’s strength in any community or region. Such analyses point out those industries with a local competitive advantage whose ability to add jobs might be enhanced with public or private initiatives such as infrastructure, workforce training, zoning changes, expedited permitting, or other actions. Projected growth in employment by industry is then translated into potential demand for space of a type suitable to accommodate growth in a given industry. The employment-driven space demand forecast is augmented by analysis of trends in the inventory, vacancies, net absorption, and lease prices in the local supply of office, retail, and wholesale/industrial space. This is the type of analysis done by or for virtually all prospective real estate developers, and the proprietary data source used by FXM (Co Star Property Information Systems) is the most comprehensive and widely used by real estate professionals. Because retailing is an important sector in Fairhaven, providing both jobs and tax revenues, FXM performed a retail opportunity/surplus analysis to show current leakage of consumer spending by store type and to identify prospective opportunities for additional retail development. Demographic and Business Characteristics The following section highlights demographic and business characteristics, comparing Fairhaven to Bristol and Plymouth Counties and Massachusetts overall.

FXM Associates
Fairhaven Economic Development Plan 6
Population & Household Growth Compared
Demonstrated by the growth rates below, population and household growth in Fairhaven lags considerably behind growth in both Bristol and Plymouth Counties, and in the rest of the Commonwealth. Economic growth is closely tied to growth in population and households, as local residents comprise the demand for goods and services in the town and serve as a source of labor for town businesses.
Table 1
Source: Environics Analytics, Spotlight, 2016, and FXM Associates Household Incomes Compared While incomes in Fairhaven are below the average incomes for Bristol and Plymouth Counties as well as the rest of the state, the median is higher than Bristol County’s, and the town’s poverty rate is lower than that of the Bristol County and Massachusetts. The income data show a clear delineation between Fairhaven and Bristol County on the one hand and Plymouth County and the State of Massachusetts on the other. The town is more like surrounding Bristol County than it is like bordering neighbor Plymouth County.
Table 2
Population Fairhaven Bristol County Plymouth County State of MA2022 Projection 16,107 573,266 533,071 7,103,3762017 Estimate 15,897 559,805 515,428 6,861,490Estimated Growth 2017-2022 1.32% 2.40% 3.42% 3.52%Estimated Growth 2010-2017 0.20% 2.10% 4.14% 4.79%
Households Fairhaven Bristol County Plymouth County State of MA2022 Projection 6,851 224,513 198,460 2,787,1852017 Estimate 6,736 218,711 190,870 2,682,402Estimated Growth 2017-2022 1.71% 2.65% 3.98% 3.91%Estimated Growth 2010-2017 1.00% 2.68% 5.38% 5.31%
# % # % # % # %2017 Estimated Household Incomes Less than $25,000 1468 22% 48,722 22% 27,422 14% 505,882 19% More than $150,000 713 11% 27,294 12% 37,874 20% 517,798 19%2017 Families by Poverty Status Families Below Poverty 261 6.2% 14,257 9.8% 7,777 5.8% 140,682 8.4% Families Below Poverty with Children 161 3.8% 10,513 7.2% 6,171 4.6% 106,438 6.3%
Fairhaven Bristol County Plymouth County State of MA
FairhavenBristol County
Plymouth County
State of MA
2017 Estimated Average Household Income
$76,675 $81,616 $104,884 $102,378
2017 Estimated Median Household Income
$62,929 $60,649 $79,189 $72,671

FXM Associates
Fairhaven Economic Development Plan 7
Workforce Characteristics Workforce characteristics bear out the indications of the above income data. Education levels in Fairhaven mirror those of Bristol County, and both are considerably lower than those in Plymouth County and statewide. Fairhaven and Bristol County have almost twice the proportion of people with less than a high school diploma as have Plymouth County and the state and smaller proportions of college graduates. The workforces in both Bristol County and Fairhaven are relatively more blue-collar than those in Plymouth County and the rest of the state. Vehicle ownership is similar across all geographic areas.
Table 3
Source: Environics Analytics Spotlight, 2016 (estimates updated from 2010 US Census) Data in the following table show the proportion of the workforce (residents of Fairhaven) by occupational classification compared to Bristol and Plymouth Counties and Massachusetts overall. Noteworthy in this comparison is that, in spite of a high concentration of health care jobs in town (see following business profile discussion)
# % # % # % # %Education (Pop. Age 25 +) Less than high school diploma 1,784 15% 68,056 17% 27,586 8% 493,613 10% Bachelor's degree or higher 3,041 25% 99,461 25% 120,457 34% 1,925,651 40%Occupation (Pop. Age 16 +) White Collar 4,663 56% 159,229 58% 163,891 63% 2,322,054 67% Blue Collar 1,816 22% 59,289 22% 45,696 17% 540,157 15% Service and Farming 1,789 22% 54,930 20% 51,948 20% 627,817 18%2017 Est. Households by Number of Vehicles No Vehicle 637 9% 23,010 11% 11,854 6% 334,370 12% One Vehicle 2,335 35% 75,548 35% 59,531 31% 972,376 36%
Fairhaven Bristol County State of MAPlymouth County

FXM Associates
Fairhaven Economic Development Plan 8
the proportion of residents employed in “Health Care Practitioner/Technician” is less than in the counties and state overall, while “Health Support” is only slightly higher.
Table 4
Source: Environics Analytics Spotlight, 2016 (estimates updated from 2010 US Census)
Sector Fairhaven Bristol County
Plymouth County
State of MA
Architecture/Engineering 1.6% 1.7% 1.5% 2.2%Arts/Design/Entertainment/Sports/Media 1.0% 1.7% 1.8% 2.2%Building/Grounds Cleaning/Maintenance 3.3% 3.2% 3.5% 3.5%Business/Financial Operations 3.2% 4.1% 5.5% 6.0%Community/Social Services 3.1% 1.7% 1.8% 2.0%Computer/Mathematical 2.2% 2.4% 2.3% 3.8%Construction/Extraction 5.1% 5.6% 5.2% 4.3%Education/Training/Library 6.3% 6.0% 6.2% 7.2%Farming/Fishing/Forestry 1.5% 0.5% 0.2% 0.3%Food Preparation/Serving Related 6.4% 5.6% 6.4% 5.6%Healthcare Practitioner/Technician 5.4% 5.7% 6.8% 6.4%Healthcare Support 4.5% 4.2% 3.5% 2.7%Installation/Maintenance/Repair 2.9% 3.2% 2.8% 2.4%Legal 1.2% 0.8% 1.2% 1.4%Life/Physical/Social Science 0.9% 0.7% 0.8% 1.8%Management 9.5% 8.9% 10.5% 11.2%Office/Administrative Support 12.9% 14.2% 13.3% 12.5%Production 6.2% 6.9% 4.2% 4.4%Protective Services 2.0% 2.7% 2.7% 2.2%Sales/Related 9.3% 10.3% 11.2% 10.0%Personal Care/Service 4.0% 3.9% 3.5% 3.7%Transportation/Material Moving 7.7% 6.0% 5.3% 4.4%

FXM Associates
Fairhaven Economic Development Plan 9
Housing Characteristics The proportion of those in Fairhaven who own their homes is higher than in Bristol County and in the state as whole. Additionally, the proportion of Fairhaven’s housing stock built before 1939 is virtually the same as that in Bristol County and the state. Fairhaven’s median home values are the lowest of those in all three geographic areas examined, a possible advantage in attracting new residents.
Table 5
Source: Environics Analytics Spotlight, 2016 (estimates updated from 2010 US Census)
# % # % # % # %Tenure (Occupied Housing Units) Owner-Occupied 4,852 72% 137,039 63% 145,377 76% 1,667,112 62% Renter-Occupied 1,884 28% 81,672 37% 45,493 24% 1,015,290 38%2017 Est. Housing Units by Year Structure Built Built 2010 or Later 219 3% 8,667 4% 12,517 6% 170,978 6% Built 2000 to 2009 362 5% 17,216 7% 19,683 9% 219,300 7% Built 1990 to 1999 557 7% 21,561 9% 18,662 9% 214,738 7% Built 1939 or Earlier 2,589 34% 79,281 33% 47,179 22% 938,630 32%
Fairhaven Bristol County Plymouth County State of MA
Fairhaven Bristol CountyPlymouth
CountyState of MA
2017 Est. Median All Owner-Occupied Housing Value
$288,083 $306,041 $365,821 $369,832

FXM Associates
Fairhaven Economic Development Plan 10
Fairhaven Business Profile The table below shows establishments, jobs and sales by major industry group in Fairhaven.1 The greatest number of jobs in Fairhaven are in Health Care and Social Assistance (primarily health care) followed by Retail Trade, Accommodation & Food Services (hotels/motels and restaurants) and Manufacturing.
Table 6
Source: Massachusetts Department of Labor and Workforce Development, ES202 Reports, 2016, US DOC Regional Economic Information System, & Environics Analytics
1 The employment data shown in this report do not necessarily correspond to the jobs by industry data in other reports. For example, the MassDOL ES202 data series counts only those jobs covered by unemployment insurance, thereby excluding self-employed persons. FXM uses another data source, the US Department of Commerce, Bureau of Economic Analysis, Regional Economic Information System to adjust upward by industry the ES202 numbers to include self employed persons.
Sectors Total Jobs Establishments Sales (000s)11: Agriculture, Forestry, Fishing and Hunting 247 2 $1,34223: Construction 533 75 $52,54431-33: Manufacturing 927 77 $53,88642: Wholesale trade 114 22 $131,70144-45: Retail trade 1226 99 $185,58748-49: Transportation and warehousing 68 121 $317,28851: Information 88 13 $59,42652: Finance and insurance 440 51 $43,73853: Real estate and rental and leasing 24 28 $9,22654: Professional, scientific, & technical svcs 441 57 $33,02655: Management of companies and enterp 130 N/A N/A56: Admin&supp. and waste mgt &remed. svcs 503 22 $13,06162: Health care and social assistance 2311 154 $112,91671: Arts, entertainment, and recreation 228 15 $17,05872: Accommodation and food services 1028 63 $48,22081: Other services (except pub admin) 513 93 $20,60892: Gvt and gvt enterprises 653 32 N/A TOTAL All Industries 9496 811 $1,352,219

FXM Associates
Fairhaven Economic Development Plan 11
The next table compares the distribution of employment in Fairhaven with the overall distribution of jobs in Bristol and Plymouth Counties, ordered by their two-digit North American Industry Classification System (NAICS) codes. The percentages listed in each column indicate what proportion of the total jobs in the given geography is employed in that industry. For example, 24.3% of the total jobs in Fairhaven are designated as Healthcare & Social Assistance, compared to 17.6% in Bristol County overall and 14% in Plymouth County. The industries and numbers that are bolded are industries in which the proportion of total jobs in Fairhaven exceeds the distribution of total jobs in Bristol and Plymouth Counties overall. Fairhaven may have a comparative advantage in those industries evidenced by their relatively high concentration. Those potentials and others are further explored in the section on employment trends and projections.
Table 7
Source: Massachusetts Department of Labor and Workforce Development, ES202 Reports, 2016, US DOC Regional Economic Information System, 2016, and FXM Associates
Fairhaven Bristol County Plymouth County11- Forestry, fishing, and related activities 2.6% 1.3% 0.6%23-Construction 5.6% 6.5% 7.9%31-33-Manufacturing 9.8% 9.9% 4.6%42-Wholesale trade 1.2% 0.0% 3.5%44-45-Retail trade 12.9% 14.7% 12.3%48-49-Transportation and warehousing 0.7% 0.0% 2.7%51- Information 0.9% 1.5% 1.0%52-Finance & Insurance 4.6% 3.5% 5.5%53-Real estate and rental and leasing 0.5% 4.1% 4.7%54-Professional, scientific, & technical svcs 4.6% 5.1% 6.6%55-Management of companies and enterp 1.4% 1.3% 1.6%56-Admin&supp. and waste mgt &remed. svcs 5.3% 5.8% 4.9%
62-Health care and social assistance 24.3% 17.6% 14.0%71-Arts, entertainment, and recreation 2.4% 2.2% 2.9%72-Accommodation and food services 10.8% 8.5% 7.9%81-Other services (except pub admin) 5.4% 6.4% 6.6%92-Gvt and gvt enterprises 6.9% 11.7% 12.7%92-Gvt and gvt enterprises 11.3% 12.6% 12.3%

FXM Associates
Fairhaven Economic Development Plan 12
Wages in Fairhaven lag behind those statewide in most sectors. However, wages in Fairhaven’s Agriculture, Forestry, Fishing, and Hunting (primarily fishing) are significantly higher than industry-wide averages for the county and state as are wages in Transportation and warehousing. Fairhaven’s average wages in Manufacturing, Professional services, and all Industries combined are greater than in Bristol County overall.
Table 8
Source: Massachusetts Department of Labor and Workforce Development, ES202 Reports, 2016
Sectors FairhavenTown as % of County
Town as % of State
Bristol County
State of Massachusetts
11: Agriculture, Forestry, Fishing and Hunting $149,240 159% 264% $94,016 $56,57623: Construction $55,848 91% 77% $61,256 $72,22831-33: Manufacturing $78,000 119% 90% $65,728 $86,37242: Wholesale trade $43,160 57% 46% $75,816 $93,54844-45: Retail trade $24,336 83% 75% $29,224 $32,34448-49: Transportation and warehousing $58,448 127% 110% $46,124 $53,14451: Information $54,912 89% 52% $61,828 $105,76852: Finance and insurance $48,984 75% 34% $64,896 $144,61253: Real estate and rental and leasing $37,284 81% 50% $46,228 $74,56854: Professional, scientific, & technical svcs $85,800 111% 71% $77,116 $121,16055: Management of companies and enterp $54,933 37% 42% $147,160 $130,78056: Admin&supp. and waste mgt &remed. svcs $30,472 92% 67% $33,228 $45,44862: Health care and social assistance $44,304 101% 81% $43,992 $54,60071: Arts, entertainment, and recreation $15,340 69% 41% $22,152 $37,28472: Accommodation and food services $15,756 87% 67% $18,096 $23,34881: Other services (except pub admin) $27,768 104% 76% $26,780 $36,34892: Gvt and gvt enterprises $64,067 101% 88% $63,388 $73,060 Average All Industries $51,064 107% 76% $47,788 $67,444
FXM Associates
Fairhaven Economic Development Plan 13
Employment Trends This part of the report focuses on potential for growth in those parts of the economy which are likely targets for Fairhaven’s development. The measure most used for market trends analyses is employment because jobs are a good indicator of the current status and future direction of a given industry. . Increasing employment indicates industries that are growing, whether through expansion of existing businesses or opening of new ones. Also, reasonably reliable historic data are readily available and can be used to project employment trends are readily available. The two sources used here for the employment trends graphs are the ES202 reports from the Massachusetts Department of Labor and Workforce Development, modified by the more inclusive (because it includes self-employment data) reports from the Regional Economic Information System (REIS) of the U.S. Department of Commerce, Bureau of Economic Analysis. When using historical data to produce future projections, it is important to consider the reliability of a given dataset. The statistic used to signify the reliability of a given projection is called the R2 calculation, and is presented alongside each projection given below. The closer the R2 value is to 1, the better the predictive value of past performance. A limiting factor on 2017 projections is the influence of the 2008-9 recession, which is still being felt in some sectors and may also affect the R2 values. For example, a sector might be showing strong growth since 2011 but the volatility introduced by the recession could pull down the projected future growth and also lower the R2 value of the projection. Meanwhile, it is still too soon to know whether and how post-recession growth will be sustained. The following graphs display trends and projections for the Town of Fairhaven and Bristol and Plymouth Counties. Note that because of the size differences, the graphs should be read on two axes, the counties on the left and Fairhaven on the right.

FXM Associates
Fairhaven Economic Development Plan 14
Figure 1 shows these data for all industries.
Figure 1
Although the R2 values for the projection lines are not very high for Fairhaven and Plymouth County, they are high enough to suggest upward trends for both since the recession. By contrast, Bristol County’s projection, with a stronger R2, indicates likely decline. Office-using industries are a potential target for more growth and development. For the purposes of this analysis FXM has defined office-using sectors by NAICS codes:
Professional Offices, Non-medical 51–Information 52-Finance and Insurance 53-Real Estate and Rental & Leasing 54–Professional, Scientific, and Technical Services 55–Management of Companies and Enterprises 561-Administrative and Support Services

FXM Associates
Fairhaven Economic Development Plan 15
Figure 2 shows trends and projections for all office-using industries.
Figure 2
Trends in all three areas are positive with R2 values above .5, making the projections reasonably reliable.
Employment Trends in Fairhaven and Bristol and Plymouth Counties, 2006-2022:
OFFICE-USING INDUSTRIES
y = 52.433x + 1008.4R2 = 0.706
y = 758.8x + 54006R2 = 0.9264
y = 507.34x + 49025R2 = 0.634
30,000
35,000
40,000
45,000
50,000
55,000
60,000
65,000
70,000
2006 2007 2008 2009 2010 2011 2012 2013 2014 2015 0 0 0 0 0 0 0
Jobs
in B
risto
l and
Ply
mou
th C
ount
ies
400
600
800
1,000
1,200
1,400
1,600
1,800
2,000
Jobs
in F
airh
aven
Plymouth County Bristol County Fairhaven
FXM Associates
Fairhaven Economic Development Plan 16
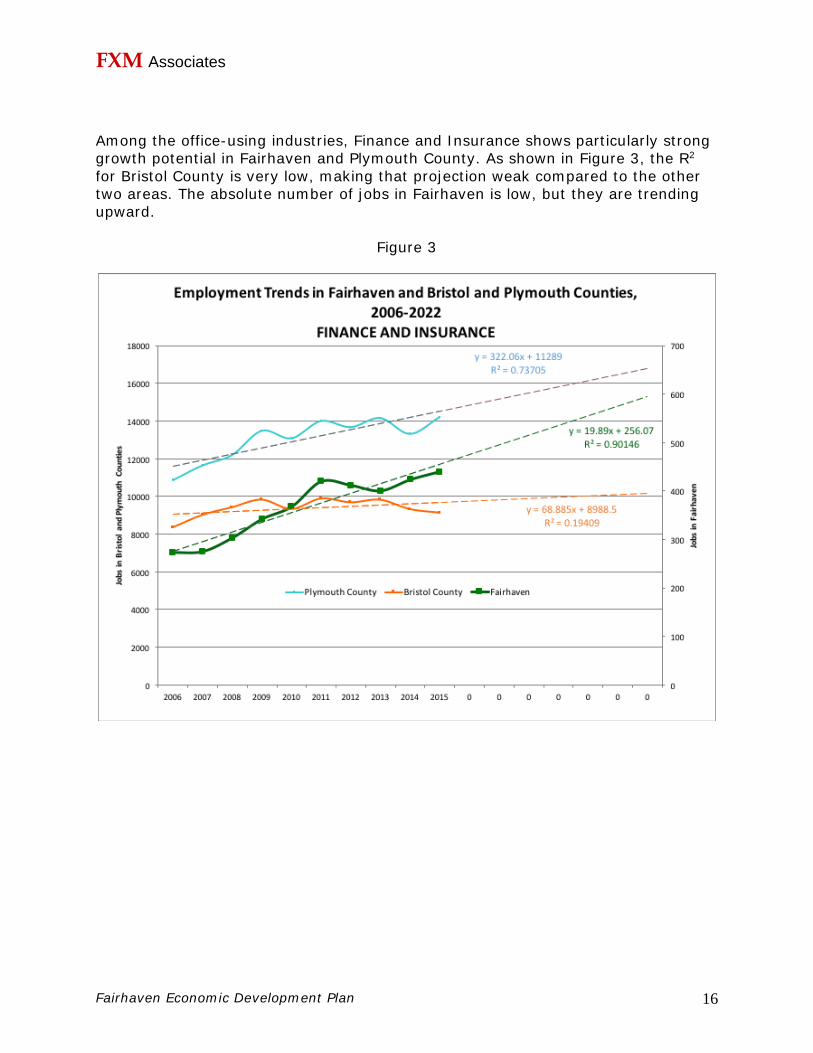
Among the office-using industries, Finance and Insurance shows particularly strong growth potential in Fairhaven and Plymouth County. As shown in Figure 3, the R2 for Bristol County is very low, making that projection weak compared to the other two areas. The absolute number of jobs in Fairhaven is low, but they are trending upward.
Figure 3

FXM Associates
Fairhaven Economic Development Plan 17
The Accommodation and Food Services sector shows potential in Fairhaven. Restaurants are the main component of this industry. Figure 4 shows strong growth potential since the recession, but the R2 for Fairhaven is low relative to the counties. The Town might want to take measures to attract some of that county growth to Fairhaven.
Figure 4

FXM Associates
Fairhaven Economic Development Plan 18
The Manufacturing industry in Fairhaven is distinctive in that it has been growing and shows potential for more growth, unlike in either Plymouth or Bristol County. In Fairhaven, this sector includes Titleist, FootJoy, and shipbuilding and repair businesses. Figure 5 shows the trends and projections.
Figure 5

FXM Associates
Fairhaven Economic Development Plan 19
The Healthcare and Social Assistance industry employs the largest number of residents in the Town of Fairhaven and in both counties. It also shows the strongest growth potential across all three areas. By 2022, this sector will employ almost half of Fairhaven’s workforce. Figure 6 shows the trends and projections:
Figure 6

FXM Associates
Fairhaven Economic Development Plan 20
The Retail Trade sector bears attention, because although it is not growing in Fairhaven, the sector remains important in terms of both total employment and economic activity for the immediate area. Retail employment in Plymouth County is holding its own, albeit with a very weak projection to 2022, Bristol County overall shows a slight downward trend, while Fairhaven exhibits a marked downturn and downward trend since 2006, as shown in Figure 7.
Figure 7
Employment Trends in Fairhaven and Bristol and Plymouth Counties, 2006-2022
RETAIL TRADE
y = -21.139x + 1460.4R2 = 0.8976
y = 8.5818x + 31102R2 = 0.0025
y = -295.51x + 40088R2 = 0.5232
10000
15000
20000
25000
30000
35000
40000
45000
2006 2007 2008 2009 2010 2011 2012 2013 2014 2015 0 0 0 0 0 0 0
Jobs
in B
risto
l and
Ply
mou
th C
ount
ies
800
900
1,000
1,100
1,200
1,300
1,400
1,500
Jobs
in F
airh
aven
Plymouth County Bristol County Fairhaven

FXM Associates
Fairhaven Economic Development Plan 21
Space Demand Through 2022 The above employment projections, with their relevant caveats, can be translated into estimates of future demand for commercial space. Table 9 compiles these projections, with projected job losses shown in red.
Table 9
In the above table, there appears to be a data problem for Educational Services in Fairhaven. ES202 reports show no jobs in this sector, across all years reviewed, but Fairhaven is home to a maritime educational institution that should have appeared in this category. In the table, office-using industries are grouped since they require similar kinds of space. Note that job growth for Fairhaven in all office-using industries, except Information, is expected to be positive. Healthcare and Social Assistance is a major employer and growth industry across all three areas, with implications for demand for commercial space. Retail Opportunity Gap/Surplus Analysis Another approach to assessing potential opportunities for expanding retailing is a retail opportunity gap/surplus analysis, a tool used by major retailers and chain restaurants to gauge market demand and competition within a specified geographic area. It presents a snapshot of the current consumer spending on various retail categories within a specified geographic area alongside actual retail store sales in those same categories within the same geographic area. Where expenditures by households in the market area exceed sales in that market area, a gap or opportunity exists for stores within the market area to “capture” more of those
SectorProjected New Jobs
Projected Space Demand
(SF)Projected New Jobs
Projected Space Demand
(SF)
Fairhaven % of Bristol
County Jobs 2015
Projected New Jobs
Projected Space
Demand (SF)
Fairhaven % of Plymouth County Jobs
2015
31-33-Manufacturing 109 58,415 (15,826) - 4% (2,233) - 8%44-45-Retail trade (125) - (3,020) - 3% (573) - 4%
Office-using51- Information (18) - (761) - 2% 95 23,824 4%52-Finance & Insurance 154 38,623 1,041 260,144 5% 2,563 640,674 3%53-Real estate and Rental and Leasing 44 10,936 730 182,509 0.4% 1,443 360,676 0.4%54 - Professional, Scientific, & Technical 68 17,071 1,543 385,719 7% 355 88,762 5%56-Administrative & Support;Waste Mgt&Remed. 127 31,727 2,236 558,935 3% 561 140,330 4%
Subtotal Office-using 375 98,357 4,788 1,387,307 5,017 1,254,267
61-Educational services* 0 0 327 424,596 0% (168) -62-Health care and Social Assistance 1,226 490,599 8,598 3,439,103 5% 6,440 2,575,825 6%71-Arts, Entertainment, and Recreation 71 28,491 376 150,349 4% 229 91,644 3%72 - Accommodation & Food Services 14 2,527 764 134,553 5% 1,904 335,185 5%92-Government & gov't enterprises 7 3,445 1,320 660,003 2% 1,204 602,233 2%TOTALS 1,678 681,835 (2,673) 6,195,911 11,820 4,859,154
* ES202 reports showed no Educational Services employment for FairhavenSource: Massachusetts Department of Labor and Workforce Development, ES202 reports (adjusted by REIS); FXM Associates
Fairhaven
Projected Space Demand Through 2022 Based on Historical Employment Trends
Plymouth CountyBristol County

FXM Associates
Fairhaven Economic Development Plan 22
household expenditures. (This loss of potential sales is also called “leakage.”) Conversely, where market area household expenditures are less than actual sales categories, it indicates that stores in that retail category in the market area already attract consumer dollars from outside the market area and opportunities for additional retail activity are more limited. The retail gap/surplus analysis is a picture of current opportunities for retailers to newly locate or expand facilities based on a well-established principle drawn from empirical studies showing that people will typically purchase goods and services within the shortest available walk or drive time from where they live. The principle applies to comparable and competitive goods, services, and pricing: there is no guarantee of success based strictly on location advantage, which simply presents the opportunity. Retailers typically define market areas in terms of drive times, with a 15-minute drive time considered the maximum time consumers would be willing to drive for all but the largest stores and store types. Market support within a 5-minute drive time is considered the maximum time consumers would be willing to drive to smaller, convenience type retailers, and market demand within a 10-minute drive time is considered essential for most medium sized stores and restaurants. If a specific category of retail sales opportunity were shown for a 5-minute drive-time market area and held up at the 10-minute market area, then most retailers would consider market conditions favorable – from a demand standpoint – to locating or expanding a store within that market area. Figure 8 following shows the areas encompassed by a 5-, 10-, and 15-minute drive times.

FXM Associates
Fairhaven Economic Development Plan 23
Figure 8
The total number of households, their estimated spending on retail/restaurants, and the estimated total store sales within this market area in 2017 are shown in Table 10 below.
Table 10
At the level of total expenditures and store sales, Fairhaven is clearly already drawing in consumer spending from beyond all three of its market areas, showing little room for more growth in retail. When spending at the level of multi-digit

FXM Associates
Fairhaven Economic Development Plan 24
NAICS categories is examined, however, there appear to be areas where expansion might be possible. Table 11 presents the results of the comparison of spending and sales in selected retail store types, along with the translation of the gap identified into square footage and then into an estimate of how many stores and square feet might be captured by potential development in Fairhaven.
Table 11
The estimates in the “Estimated Capturable” column are conservative and were arrived at with considerable professional judgment based on past experience with retail development. The estimations reflect the informed consideration that Fairhaven would likely capture only a portion of the total new retail development which might be attracted to the market area. Depending on town choices regarding the role of retail in key development areas, the analysis shows opportunities that could be attractive to several different types of retail stores with varying space requirements. The total number of potentially supportable stores, however, is small and suggests that efforts to attract more retail development might not be the best use of scarce economic development resources. The preceding section on employment trends in Fairhaven and Bristol and Plymouth Counties bears out this assessment.
Retail Stores Market Area GapSupportable
SFPotentially
Captured SF
Potentially Supportable
Stores4422 - Home Furnishing Stores 5,052,052$ 18,993 4,100 144422 - Nursery and Garden Centers 10,348,810$ 44,463 10,000 144612 - Cosmetics, Beauty Supplies and Perfume Stores 3,169,618$ 7,170 1,600 144814 - Family Clothing Stores 10,141,097$ 28,628 8,000 14529 - Other General Merchandise Stores 26,396,802$ 121,762 17,000 14539 - Other Miscellaneous Store Retailers 3,050,983$ 9,417 2,300 17223 - Special Foodservices 6,600,680$ 19,460 2,000 1TOTALS 64,760,042$ 249,892 45,000 7
Retail Opportunities in the Fairhaven Retail Market Area: 2017

FXM Associates
Fairhaven Economic Development Plan 25
Real Estate Supply Trends With employment growth projected for office using industries, additional analyses have been done to chart the trends in the supply of office space. Figure 9 shows historical trends in the inventory and vacancy rates in Fairhaven and the local market area, which includes New Bedford, Dartmouth, Westport, Acushnet, Mattapoisett, Marion and Wareham. As the graph indicates, there has been little change over the past 10 years in the inventory of office space in either Fairhaven or the broader market area. Because of the growth in demand, noted in the previous discussion of employment trends, vacancy rates are declining sharply – 2% in the market area overall and virtually zero in Fairhaven.
Figure 9
Source: Co Star Property Information Systems, October 2017, and FXM Associates
Fairhaven & Local Market OFFICE Space Inventory and Vacancy Rates2008-2017
0
500,000
1,000,000
1,500,000
2,000,000
2,500,000
3,000,000
3,500,000
4,000,000
4,500,000
2008 2009 2010 2011 2012 2013 2014 2015 2016 2017
Inve
ntor
y SF
0
1
2
3
4
5
6
7
8
9
10
Vaca
ncy
Rat
e (%
)
Fairhaven Inventory SF Local Market Inventory SF Fairhaven Vacant % Local Market Vacant %
FXM Associates
Fairhaven Economic Development Plan 26
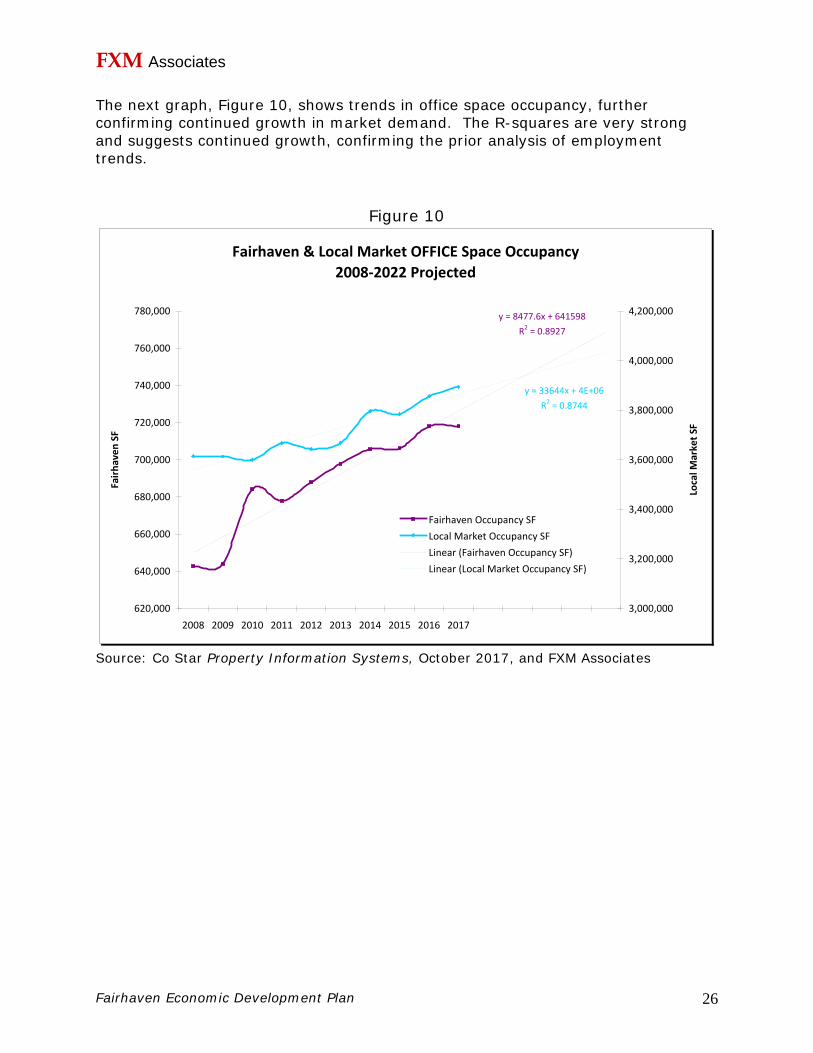
The next graph, Figure 10, shows trends in office space occupancy, further confirming continued growth in market demand. The R-squares are very strong and suggests continued growth, confirming the prior analysis of employment trends.
Figure 10
Source: Co Star Property Information Systems, October 2017, and FXM Associates
Fairhaven & Local Market OFFICE Space Occupancy2008-2022 Projected
y = 8477.6x + 641598R2 = 0.8927
y = 33644x + 4E+06R2 = 0.8744
620,000
640,000
660,000
680,000
700,000
720,000
740,000
760,000
780,000
2008 2009 2010 2011 2012 2013 2014 2015 2016 2017
Fairh
aven
SF
3,000,000
3,200,000
3,400,000
3,600,000
3,800,000
4,000,000
4,200,000
Loca
l Mar
ket S
F
Fairhaven Occupancy SFLocal Market Occupancy SFLinear (Fairhaven Occupancy SF)Linear (Local Market Occupancy SF)

FXM Associates
Fairhaven Economic Development Plan 27
Figure 11 compares occupancy and rental rate trends. Average office gross rents in Fairhaven spiked compared to the local market between 2011 and 2014 but have since returned to close to the local market average of $15-16 per square foot per year. While that rent level will not support new construction, with declining availability (decreasing vacancy rates) in the existing supply, over time demand is likely to force up average rents and create new opportunities for development, particularly cost-effective rehabilitation and/or repositioning of existing buildings. One of the advantages of shared workspaces, which will be discussed subsequently, is that the prices per square foot that are typically charged tenants can substantially exceed the average rents because of the shared services and facilities they provide, as well as the fact that single tenants do not need to lease large amounts of space.
Figure 11
Source: Co Star Property Information Systems, October 2017, and FXM Associates
Fairhaven & Local Market OFFICE Space Occupancy and Gross Rent2008-2017
0
500,000
1,000,000
1,500,000
2,000,000
2,500,000
3,000,000
3,500,000
4,000,000
4,500,000
2008 2009 2010 2011 2012 2013 2014 2015 2016 2017
Occ
upan
cy S
F
$-
$5.00
$10.00
$15.00
$20.00
$25.00
Gos
s Ren
t/SF
/Yea
r
Fairhaven Occupancy SFLocal Market Occupancy SFFairhaven Office Gross RentLocal Market Office Gross Rent

FXM Associates
Fairhaven Economic Development Plan 28
Competitive Position One of the principal economic development issues raised by members of the Economic Development Committee is whether and to what extent the tax rates in Fairhaven – particularly the commercial tax rate, which is high relative to most of the surrounding communities - reflects town services that are competitive with other communities. While it is not possible within the scope of this study to analyze town services and infrastructure costs relative to other communities, it is possible to examine tax levies and rates on a per household and per job basis as a proxy for Fairhaven’s competitive fiscal position. The results, as discussed below, show that Fairhaven’s current tax policy favors residents with relatively low residential tax rates compared to surrounding communities. This is a competitive advantage not only for potential new residential development (workforce rental housing for example) but is also a feature that can help retain and attract businesses to locate in town and to promote that advantage to attract workers. The advantage extends to the quality of Fairhaven’s schools relative to regional norms, as will be shown subsequently. It should be noted that FXM’s interviewees did not mention Fairhaven’s commercial or residential tax rates when queried on potential competitive advantages or disadvantages for economic development. Another competitive issue – the Town’s permitting processes – received generally positive grades from local businesses and developers. This extended to the building department, public works, and general administrative functions. The single exception – noted by several interviewees -- was the propensity of some boards to extend their review into design details that were viewed as overreaching authority and delaying the approval process. Nevertheless, the objections were minor; Town government was viewed favorably overall and perceptions of doing business or developing in Fairhaven were positive and competitive compared to surrounding communities. Zoning – and appropriate zoning for commercial development removed from the existing commercial centers along Route 6, Alden Road, and Mill Street – is another matter. Lack of appropriately zoned land for office-type and mixed residential/commercial development was cited as constraining development potential in Fairhaven. Zoning is beyond the scope of this study and has been extensively addressed in the recent Master Plan update. Fiscal Comparison
This section presents an analysis of where Fairhaven stands in terms of its existing tax policy compared to that of nearby communities: New Bedford, Acushnet, Dartmouth, Mattapoisett, Marion, Wareham, and Westport. Tax Rates Fairhaven’s commercial tax rate, while it is well below that of New Bedford, is the second-highest commercial tax rate of the eight communities included in the fiscal

FXM Associates
Fairhaven Economic Development Plan 29
comparison. Interviews suggest that those who deal in commercial property consider New Bedford to be Fairhaven’s principal competitor. As compared to New Bedford’s $36.03 commercial rate, Fairhaven’s $24.27 is favorable. Additionally, Fairhaven’s residential tax rate is close to average for the given communities.
Figure 12
Tax Rates (Per $1,000)
$36.03
$24.27
$15.39
$13.07$11.41 $11.25
$7.97
$17.25$18.57
$12.04
$16.69
$14.44
$9.70
$12.07
$0.00
$5.00
$10.00
$15.00
$20.00
$25.00
$30.00
$35.00
$40.00
New Bedford Fairhaven Acushnet Dartmouth Mattapoisett Marion Wareham Westport Average
Commercial/Industrial Personal Property Residential

FXM Associates
Fairhaven Economic Development Plan 30
Residential and Commercial Property as Percent of Total Assessed Valuation According to the chart below, 13% of the total value of all property in Fairhaven is commercial. In this measure, Fairhaven is comparable to Wareham and Dartmouth, where 14% of assessed valuation is commercial. This proportion is slightly below New Bedford’s, where 16% of assessed valuation is commercial. Assessed valuations in Westport, Marion, Acushnet, and Mattapoisett are significantly less commercial – ranging from 4% to 6% across the four towns.
Figure 13
Residential & Commercial Property % of Total Assessed ValuationFY 2017
80% 83% 82% 85% 93% 92% 91% 94%
13%14%16% 4%14% 6% 6% 5%
0%
20%
40%
60%
80%
100%
120%
New Bedford Dartmouth Wareham Fairhaven Westport Marion Acushnet Mattapoisett
Commercial Residential

FXM Associates
Fairhaven Economic Development Plan 31
Residential and Commercial as Percent of Total Tax Levy As displayed below, commercial properties comprise 23% of Fairhaven’s tax levy. This number is higher than the proportion of total assessed valuation in Fairhaven that is commercial, 13%, due to the town’s relatively high commercial tax rate. The same occurs to an even higher degree in New Bedford, where commercial properties account for 16% of the total assessed valuation (Figure 13) and 29% of property tax revenues.
Figure 14
It should be noted that special assessment districts (such as fire districts in Dartmouth and Wareham, which are independent of municipal budgets) are not included in this fiscal comparison and are therefore not included in the subsequent per job and per capita tax comparisons.
Commercial and Residential as % of Total Tax LevyFY 2017
65%74% 75% 82% 89%
93% 94% 92%
29%23%
20%14% 3%6% 6% 4%
0%
20%
40%
60%
80%
100%
120%
New Bedford Fairhaven Dartmouth Wareham Acushnet Westport Mattapoisett Marion
Commercial Residential

FXM Associates
Fairhaven Economic Development Plan 32
Assessed Valuation per Job A comparison of assessed valuation per job shows that on this measure Fairhaven ranks below the average of the local communities.
Figure 15
Assessed Valuation Per JobFY 2017
$36,950
$49,349
$38,221
$47,082
$39,455
$43,263
$23,761
$31,588
$38,709
$14,010
$4,945$5,375
$11,867$14,466$14,588
$15,892$15,961
$28,982
$0
$10,000
$20,000
$30,000
$40,000
$50,000
$60,000
Acushnet Wareham Mattapoisett Westport Marion Dartmouth NewBedford
Fairhaven Average
Commercial/Industrial Personal Property

FXM Associates
Fairhaven Economic Development Plan 33
Tax Levy Per Job Next to New Bedford, Fairhaven has the highest tax levy per job of the eight communities considered below.
Figure 16
Tax Levy Per JobFY 2017
$686
$500
$856
$666
$555
$250
$767
$375
$582
$538
$208 $194 $183 $180 $165
$120 $116
$213
$0
$100
$200
$300
$400
$500
$600
$700
$800
$900
Acushnet Mattapoisett New Bedford Dartmouth Wareham Marion Fairhaven Westport Average
Commercial/Industrial Personal Property
FXM Associates
Fairhaven Economic Development Plan 34
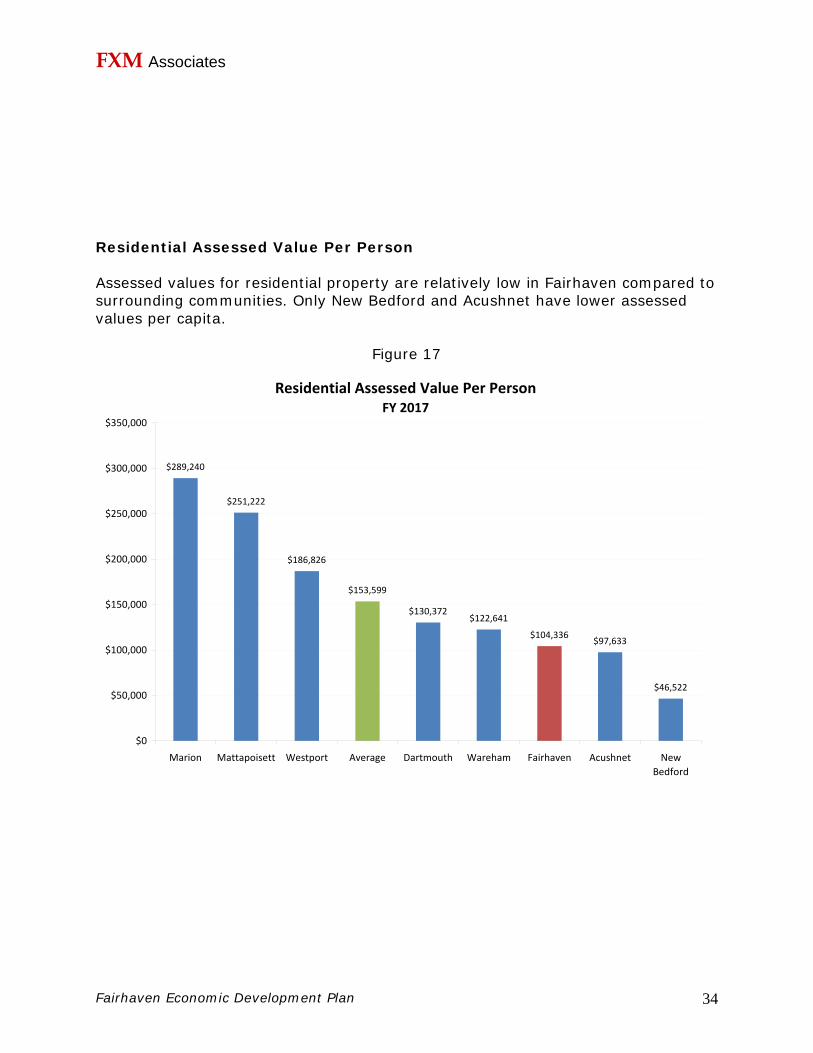
Residential Assessed Value Per Person Assessed values for residential property are relatively low in Fairhaven compared to surrounding communities. Only New Bedford and Acushnet have lower assessed values per capita.
Figure 17
Residential Assessed Value Per PersonFY 2017
$289,240
$251,222
$186,826
$153,599
$130,372$122,641
$104,336 $97,633
$46,522
$0
$50,000
$100,000
$150,000
$200,000
$250,000
$300,000
$350,000
Marion Mattapoisett Westport Average Dartmouth Wareham Fairhaven Acushnet NewBedford

FXM Associates
Fairhaven Economic Development Plan 35
Residential Tax Levy Per Person The tax levy per person in Fairhaven is also low compared to the surrounding communities. The revenues from Fairhaven’s relatively high commercial tax rate, as well as relatively low assessed home values, allow citizens to pay less in residential taxes.
Figure 18
Residential Tax Levy Per PersonFY 2017
$3,300 $3,283
$1,770
$1,380$1,265 $1,256
$776
$1,489$1,410
$0
$500
$1,000
$1,500
$2,000
$2,500
$3,000
$3,500
Marion Mattapoisett Average Westport Acushnet Wareham Dartmouth Fairhaven New Bedford

FXM Associates
Fairhaven Economic Development Plan 36
Revenue by Source In Fairhaven, 48% of total revenue comes from real and personal property taxes. Local receipts for the town, which include fees and charges, are about average for the area. Compared to most of the other surrounding communities, Fairhaven is less reliant on property taxes as a revenue source.
Figure 19
Revenue by SourceFY 2017
0%
57%
51%
33%
48%
68%
65% 65%
51%55%
14%
25%
47%
20%
5%4%
18%
21%19%
22%
16%
20%
24%21%
26%
15%
24%21%
7% 8% 7%6% 5%
2% 3%5%
0%
10%
20%
30%
40%
50%
60%
70%
80%
Dartmouth Acushnet New Bedford Fairhaven Mattapoisett Marion Westport Wareham Average
Tax Levy State Aid Local Receipts Other

FXM Associates
Fairhaven Economic Development Plan 37
Jobs in Restaurants/Accommodations and Retail Trade A high commercial tax rate can be explained by the mix of jobs in a community. A commercial tax rate may be higher if a town has a relatively high proportion of jobs that demand more public services, such as retail jobs, which generate more auto trips and police work than most other industries. The graph below shows the proportion of jobs in Fairhaven and the surrounding seven communities that are restaurant/accommodations and retail industries. As displayed below, Fairhaven’s high commercial tax rate is not explained by a high number of service-intensive jobs in the town. In fact, Wareham and Dartmouth all have a substantially higher proportion of jobs that are in service-intensive industries, and the commercial tax rates in these towns are lower than in Fairhaven.
Figure 20
Percentage of Total Jobs that are in Restaurants/hotels and Retail Trade
FY 201738%
36%
26% 26%
23%
21% 21%
14% 14%
0%
5%
10%
15%
20%
25%
30%
35%
40%
Wareham Dartmouth Westport Fairhaven Average Acushnet Mattapoisett New Bedford Marion

FXM Associates
Fairhaven Economic Development Plan 38
Educational Services The graph below compares 2017 MCAS performance for tenth grade students attending Fairhaven High School to other public high schools in the region, as well as to the statewide average. As shown, Fairhaven outperforms all but one local high school in terms of average percentage of tenth graders achieving a rating of “Proficient” or “Advanced” on the 2017 MCAS tests in Math and English. Additionally, tenth grade students at Fairhaven High School scored considerably higher than the statewide average for 2017.
Figure 21

FXM Associates
Fairhaven Economic Development Plan 39
Shared Workspaces
At the initial meeting with the Economic Development Committee, some members expressed interest in identifying models for shared workspaces that might be applicable in Fairhaven. These can be an especially important opportunity for Fairhaven given the high costs of new construction, vacancies in former retail spaces, and interest already expressed to property owners and businesses. The section is organized as follows: Accelerators Incubators
Life Sciences Incubators and Accelerators Makerspaces
FabLab Co-working Spaces
The Co-Working Industry Demand for Co-working Space
• Trends in Independent Employment • Trends in Remote Employment • Trends in Small Business Employment
Building Reuse Appendix
Examples Funding Information Useful sources
Accelerators Business accelerators are as much programs as they are shared workspaces. In other words, in addition to offering office space, accelerators consist of programs aimed at accelerating the growth of startups. This programming generally includes professional advice and guidance. Unlike a business incubator, where there is no time limit on membership, startups are only in the accelerator for a limited timeframe. The programming is more intense, earning accelerators the nickname “business boot camps.” At the conclusion of their time in the accelerator, businesses are considered “graduates.” Often upon graduating from an accelerator startups will initiate their premier market launch. It is also customary for

FXM Associates
Fairhaven Economic Development Plan 40
accelerators to provide funding for startups, often through awarding grants or investing in equity. Accelerators can be operated publicly or privately, as well as through a public-private partnership. According to the Global Accelerator Report from 2015, 65% of accelerators are for-profit, with 35% non-profit.2 MassChallenge, the largest business accelerator in Massachusetts and a non-profit, is run through a partnership between public and private organizations. MassChallenge benefits from partners that include the State of Massachusetts, as well as corporations such as Microsoft and CVS. More examples of business accelerators in Massachusetts can be found in the appendix. Incubators Like accelerators and co-working spaces, incubators are shared workspaces that offer infrastructural support such as mailboxes, printers, and IT assistance. Incubators, like accelerators, offer support services aimed at helping small businesses succeed. Incubators regularly host relevant events and classes for member startups. The key distinction between incubators and accelerators is the membership timeframe – incubators generally do not limit participation to any set amount of time. Therefore, the programming offered by incubators is markedly more passive than that of accelerators. About one-third of business incubators are funded by economic development organizations. Another 21% of incubators are funded by the government, and another 20% by colleges and universities. A much smaller proportion of incubators – around 6% - are privately funded and for-profit.3 A list of Massachusetts-based business incubators can be found in the appendix. Life Sciences Industry – Incubators and Accelerators Massachusetts, as a leader in the life sciences industry, is home to a large number of incubators and accelerators that support businesses in this industry. Life sciences incubators and accelerators generally provide entrepreneurs with shared lab space and equipment. Examples of science-specific incubators, as well as information about funding opportunities for these types of initiatives, can be found in the appendix. Makerspaces
http://gust.com/global-accelerator-report-2015/ 3 Linda Knopp (2007). "2006 State of the Business Incubation Industry". Athens, Ohio: National Business Incubation Association.

FXM Associates
Fairhaven Economic Development Plan 41
Makerspaces share many characteristics with accelerators, incubators, and co-working spaces, insomuch as each of these shared space models provides workers with share facilities and services. The defining feature in a makerspace is the workshop component. Makerspace members share common tools, ranging from 3D printers and laser cutters to woodworking tools and sewing machines. Makerspaces vary in the level of programming they offer. Some are comprised of loosely-organized individuals sharing tools and space, while many other makerspaces offer workshops, presentations and lectures focused on knowledge sharing. Makerspace members generally engage in fields like science, technology, and engineering, however some makerspaces support artistic endeavors as well. Makerspaces are often hosted by schools, universities, and libraries. Most Makerspaces are not-for-profit collectives, while some are for-profit or public-private partnerships. 4 See the appendix for examples of makerspaces in Massachusetts. Fab Lab FabLabs, short for fabrication laboratories, are a trademarked type of makerspace. FabLabs are all part of a global network of labs, the first of which was created in 2001 by Professor Neil Gershend at the Center for Bits at Atoms at MIT. The Fab Charter lays out requirements for FabLabs, which include certain required tools and software, as well as mandates about some degree of public access. FabLabs are usually run by local, non-profit organizations.5 Coworking Space Coworking spaces are membership-based shared office spaces that offer infrastructural support such as wifi, printers, mailboxes, and IT services. Other popular features are dedicated desks, private offices, and conference rooms. Unlike business accelerators and incubators, co-working spaces generally do not offer business-support programming. Coworking spaces are often run by an office manager, and charge members per head or per desk. Those who are independently employed, remote workers, and small businesses make up the majority of those who utilize coworking spaces. Coworking offers these individuals a flexible and affordable alternative to a traditional lease. Coworking as a workspace model has gained significant popularity in recent years, due largely to a growing contingent workforce, a rise in entrepreneurship, and technological advancements that facilitate remote work. According to the 2017 Global Coworking Survey, there are about 1 million people working in coworking spaces worldwide. Additionally, between 2015 and 2016 the number of coworking
4 MassDevelopment Makerspace Report 2013 5 https://makezine.com/2013/05/22/the-difference-between-hackerspaces-makerspaces-techshops-and-fablabs/

FXM Associates
Fairhaven Economic Development Plan 42
spaces increased 49%. The demand section below will outline how this trend manifests itself in Fairhaven and the surrounding region. In its early stages, the coworking movement was dominated by large companies with locations primarily in major cities. WeWork, for instance, is now the sixth-most-valuable startup in the world, and their 273 locations (including six in Boston) capture 63% of coworking leasing activity. More recently, smaller companies have led the coworking movement into cities and towns of all sizes. As coworking has continued its mainstream expansion, boutique companies are operating independent coworking spaces in Massachusetts towns from the Berkshires to Cape Cod. Examples of large and small coworking organizations can be found in the appendix. In addition to meeting a potential demand for shared workspace, a coworking space might serve to repurpose one of Fairhaven’s vacant or underutilized properties as well. Historically, small town coworking spaces have taken up residence in repurposed structures such as abandoned warehouses, vacant retail stores, and former churches. The industry’s repurposing tendency is perhaps best embodied by WeWork’s recent purchase of Lord and Taylor’s flagship New York store for use as their new headquarters. A more local example exists in New Bedford, where the Groundwork coworking space occupies a former mill. Demand As stated above, most users of coworking spaces (79%) are independently employed, remote workers, or small business people. Trends in employment in these three groups can help to predict demand for coworking space in Fairhaven and the surrounding region. Trends in Self Employment In Bristol and Plymouth Counties there is considerable growth in self employment across all industries. In Bristol County, the number of jobs designated as self employment is projected to grow 11% between 2015 and 2022, adding a total of 2,968 jobs in this category. Self employment is expected to increase in Plymouth County as well, where 18% growth is expected between 2015 and 2022, adding a total of 5,781 jobs designated as self employment. While data on self employment across all industries for Fairhaven do not yield a reliable projection, there is steady, reliable growth in Fairhaven in the finance/insurance industry. Between 2015 and 2022, self employment in the finance/insurance industry is projected to grow 88% in Fairhaven, from 476 to 897 self employed persons. This pattern mirrors the national trend in self employment for this industry. The projection is based on historical trends and could suggest demand for over 100,000 square feet of coworking space in Fairhaven (though many will remain working from home). Trends in Remote Work

FXM Associates
Fairhaven Economic Development Plan 43
Nationally, the proportion of employees who are working remotely is increasing. According to polling by Gallup, as of 2016 43% of all employees work at home at least part of the time, up from 39% in 2012. For the town of Fairhaven, this would amount to about 2,500 remote workers in 2015. The industry with the fastest-growing proportion of remote workers is a sector that consists of finance, insurance, and real estate. According to Gallup, in 2016, 47% of workers in finance, insurance, and real estate worked remotely. Both Bristol and Plymouth Counties show strong, reliable growth in this sector. If the 47% figure remains until 2022, there are projected to be approximately 24,300 remote workers in the industries of finance, insurance, and real estate in Plymouth and Bristol Counties combined. In Fairhaven, the real estate industry is volatile and difficult to track. Growth in finance and insurance at the town-level, however, shows steady growth. There is a projected growth rate of 35% in employment in the finance/insurance industry for Fairhaven between 2015 and 2022. Applying Gallup’s 47% number for real estate, finance, and insurance to finance and insurance alone, Fairhaven is projected to see an increase of 73 remote workers in finance/insurance between 2015 and 2022 – from 206 to 279. Actual amounts may differ, as this projection excludes any growth in the real estate industry. Trends in Small Business There is limited data at the town level on small business employment activity. At the state level, however, Massachusetts is a leader in entrepreneurship. According to the Kauffman Index of Entrepreneurship, the leading indicator of new business creation in the United States, Massachusetts is ranked third nationally for “Main Street Entrepreneurship.” This indicator includes the percentage of all adults who own a business as their main job, the number of small businesses per 1,000 firms, and the survival rate of startups. Massachusetts ranks fourth in another Kauffman measure, “Growth Entrepreneurship.” This index measures growth in startups by number of employees, and the number of startups experiencing high rates of growth. This data suggests that Massachusetts enjoys a healthy small business economy. Given the above information regarding trends in Fairhaven, the surrounding region, and the Commonwealth for independent employment, remote work, and small businesses, and given that these groups makeup the majority of coworking space users, it is reasonable to assume that there is considerable demand for a coworking space in Fairhaven.

FXM Associates
Fairhaven Economic Development Plan 44
Marketing Strategies There are several approaches that can be taken to market Fairhaven’s assets and opportunities for economic development. This section discusses potential marketing strategies. The data and analyses presented in this report can be an important source of content for a marketing campaign. 1. Engage People It is common consensus that the most powerful marketing takes place through word of mouth. According to a 2017 study by Development Counselors International, dialogue with industry peers has remained the top source of information about an area since 1996, followed by business travel and articles in newspapers and magazines. Consequently, marketing campaigns are more successful when economic development organizations allow third parties to share their success stories, rather than promoting themselves. Below are two strategies for engaging third party individuals and organizations with an economic development marketing campaign.
Leverage the media Keep local outlets informed of initiatives as they develop. Compile any news coverage online, like the New Bedford Economic Development Council does, here: http://www.nbedc.org/news/. Utilize press releases to communicate developments to the public. Employ digital ambassadors Ambassador programs have been popular in chambers of commerce and economic development organizations for decades. These ambassadors are generally local executives who promote their town to their professional network.
The digital ambassador grew out of this role, leveraging social media to allow economic development groups to spread their town’s selling points even farther. Digital ambassadors can be residents, business owners, students, or any other local stakeholder. Digital ambassadors share content that promotes the town to their personal social media accounts – namely Facebook, Instagram, and Twitter. These posts could promote local events or share links to local news coverage.
Historically, word of mouth advertising has been handicapped by the limited ability to track its affects. Digital ambassador campaigns, however, are traceable. When a digital ambassador shares a post that includes a link, it is possible to trace how many individuals utilize that link. This information can serve to improve the marketing efforts.

FXM Associates
Fairhaven Economic Development Plan 45
The city of El Paso, Texas had great success with their Digital Ambassadors Program. Within one week of launching the program aimed at sharing positive news about the region, 1,000 citizens had signed up to participate. The New Hampshire Division of Economic Development launched a digital ambassador program in 2015 aimed at telling the world why New Hampshire is great place to live, work, and do business. Other places with digital ambassadors are Houston Texas, Raleigh North Carolina, and Kistap County Washington. 2. Develop a Website
According to a 2017 study by Development Counselors International, having a website is the number one most effective marketing technique for economic development. Additionally, 65% of executive respondents used the internet during their last site-selection search, and 65% reported a strong likelihood that they would visit an economic development organizations’ website during the next site search. Of the communities surrounding Fairhaven- Mattapoisett, Marion, Wareham, Westport, Acushnet, and New Bedford- New Bedford is the only one whose economic development organization, the New Bedford Economic Development Council, hosts a separate website.
A website should serve as a one-stop location for relevant information. Whereas social media accounts like Facebook and Twitter can be utilized to share discrete posts about specific news or events, people will visit a website when they want to learn additional information about the town. The Fairhaven Office of Tourism’s website, which is linked to the Town of Fairhaven’s website, serves as an example of an effective and informative site. The site was done with Spectrum Marketing Group through their Community Collaborative Program, which offers marketing advice and services to nonprofits and community organizations at reduced rates. Features common on economic development websites are listed below.
• Staff contact information • Up-to-date demographic information • An inventory of available sites • Latest news • Leading employers/industries • Incentive information • Business intelligence tools to support existing businesses
Example: http://www.okcchamber.com/index.php?submenu=GreaterOKCLocalBusinessIntelligenceTool&src=gendocs&ref=LBI&category=EconomicDevelopment

FXM Associates
Fairhaven Economic Development Plan 46
Examples of Economic Development Organization Websites: Framingham Community and Economic Development: http://www.chooseframingham.com/ Marlborough Economic Development Corporation: http://marlboroughedc.com/ New Bedford Economic Development Council: http://www.nbedc.org/ 3. Differentiate A crucial step in executing an economic development marketing plan is creating messaging which will be displayed on the website, communicated to the press, or shared by ambassadors. This messaging will contain the town’s selling points. Key in coming up with selling points is differentiating the town. Often times, economic development marketing initiatives are unsuccessful because a town fails to differentiate itself. Many towns fall back on run of the mill attributes such as quality of life or strong labor force. To avoid this, Fairhaven could incorporate differentiators such as its working waterfront, prime highway access, low residential tax rate, and strong school system into its marketing campaign. Branding Just like products, cities, towns, and regions can develop their own brand as part of a larger marketing campaign. The purpose of a place brand is to communicate a unique story and leave a lasting impression, and in turn compel people to choose your community over another for their home or business. A place brand should both reflect the will of the town about where they want to see their community go, as well as celebrate the history, geography, and culture of a place. It is important to consider that brands are bottom up, rather than top down. In other words, how a town attempts to portray their intended brand often differs from how the community is perceived by onlookers. Brands help to give those who are relatively unfamiliar with a town a baseline understanding of it. A town’s brand is reflected on the town website, any printed collateral, and any town-run social media accounts. When a municipality brands itself it almost always creates a logo and a tagline. A place logo should not be a literal illustration of the town, but rather should incorporate some design elements that tie back to well known attractions. One example of an effective logo to consider is that of Providence Rhode Island, a city that recently underwent a branding process with North Star, adopted a capital “P” logo with the tagline “The Creative Capitol.” Branding example: North Star and Providence Rhode Island: http://www.northstarideas.com/case-studies/providence-rhode-island

FXM Associates
Fairhaven Economic Development Plan 47
Potential Funding Sources
This section summarizes key potential finding sources for implementing economic development goals, objectives, and opportunities identified in the overall report. Italics indicate sections that are largely extracted from the sources. TA Connect Mass Development serves as the Department of Housing and Community Development’s agent for the Community Compact program, and the TA Connect is a primary resource for implementing the Fairhaven Economic Development Plan. The DHCD Community Compact directors and other State agency partners identified in the Town’s Compact will review the Fairhaven Economic Development Plan, focusing on “best practices” and municipal official(s) responsible for implementation. Subsequent Town requests for technical/funding assistance will be reviewed by Compact Community State agency committee, and the Town should complete application for assistance online here: https://www.massdevelopment.com/what-we-offer/real-estate-services/technical-assistance/#ta-connect
Contact: Amanda Maher [email protected] Direct: 617-330-2053 Cell: 617-921-4338
Community Development Block Grant Massachusetts Community Development Block Grant Program is a federally funded, competitive grant program designed to help small cities and towns meet a broad range of community development needs.
Contact: Community Development Block Grant staff at the Department of Housing and Community Development (617-573-1100) Eligibility: Municipalities with a population of under 50,000 that do not receive CDBG funds directly from the federal Department of Housing and Urban Development (HUD) are eligible for CDBG funding. Communities may apply on behalf of a specific developer or property owner
Notes: Grant utilized for Framingham Downtown Renaissance, a large downtown redevelopment initiative in Framingham. Strategies for this development included mixed use.
Community Investment Tax Credit Program (CITC) The Community Investment Tax Credit (CITC) was created by Chapter 238 of the Acts of 2012. CITC is designed to enable local residents and stakeholders to work with and through community development corporations (CDCs) to partner with nonprofit, public, and private entities to improve economic opportunities for low and

FXM Associates
Fairhaven Economic Development Plan 48
moderate income households and other residents in urban, rural, and suburban communities across the Commonwealth. CDCs accomplish this through adoption of community investment plans to undertake community development programs, policies, and activities. The CITC provides a 50% tax credit against Commonwealth of Massachusetts tax liability. The CITC program is a refundable tax credit.
Contact: The Department of Housing and Community Development (DHCD) is the administering agency for CITC. Main Office (617) 573-1100 Notes: This tax incentive is utilized by the Community Economic Development Center of New Bedford.
Economic Development Fund (EDF) The Economic Development Fund (EDF) finances projects and programs that create and/or retain jobs, improve the local and/or regional tax base, or otherwise enhance the quality of life in the community. EDF gives priority to assistance for physical improvements and mixed-use projects supporting downtown and commercial center development.
Contact: EDF Program Staff: 617-573-1400
Massachusetts Downtown Initiative (MDI) DHCD's Massachusetts Downtown Initiative (MDI) offers a range of services and assistance to communities seeking help on how to revitalize their downtowns. MDI staff provide ongoing technical assistance on downtown-related issues. Recent requests have included how to develop business recruitment programs, upper story spaces, and downtown organizational bylaws.
Contact: Massachusetts Department of Housing & Community Development: 617.573.1100
Peer to Peer Technical Assistance Program The Peer-to-Peer Technical Assistance Program awards small grants to Community Development Block Grant (CDBG) non-entitlement communities to hire Peer Consultants from other municipalities for short-term problem solving or assistance with projects that support local community development and capacity building activities. The Program is funded with Massachusetts CDBG technical assistance funds.
Contact: DHCD: 617-573-1400. Neighborhood Stabilization Program (NSP) NSP1 is a $54.8 million grant program from the Housing and Economic Recovery Act (HERA) awarded by the federal Department of Housing and Urban Development (HUD) to Massachusetts and four of its cities. These NSP funds are to be used

FXM Associates
Fairhaven Economic Development Plan 49
primarily for the acquisition and rehabilitation of abandoned and foreclosed properties.
Contact: Mark Siegenthaler, Community Development Manager: (617) 573-1426 Email: [email protected]
Brownfields Redevelopment Fund Created to encourage the reuse of Brownfield sites — vacant or underutilized properties complicated by environmental contamination and liability. In FY17, the Commonwealth authorized $45 million in capital funding for the Brownfields Redevelopment Fund.
Contact: MassDevelopment: (617) 330-2000
Brownfields Site Assessment Program Provides unsecured, interest-free financing up to $100,000 per site for environmental testing.
Contact: MassDevelopment: (617) 330-2000 Collaborative Workspace Program The Collaborative Workspace Program provides funds to accelerate the pace of new business formation, job creation and entrepreneurial activity in Massachusetts communities, by supporting infrastructure that funds community-based innovation.
Contact: MassDevelopment: (617) 330-2000 Commonwealth Places Commonwealth Places provides a creative funding mechanism to advance community placemaking projects throughout Massachusetts. The statewide program will help fund place-based, community-driven projects – art installations, parks, bike trails, markets, and more – that revitalize downtowns and neighborhood commercial districts. The program aims to engage and mobilize community members to make individual contributions through a crowdfunding platform with the incentive of a dollar-for-dollar funding match (up to $50,000) from MassDevelopment if the crowdfunding goal is reached within 60 days.
Contact: MassDevelopment: (617) 330-2000 Transformative Development Initiative Grant TDI is a place-based development program for Gateway Cities designed to enhance local public-private engagement and community identity; stimulate an improved quality of life for local residents; and spur increased investment and economic activity. The initiative is organized around these programs: · TDI Assistance: a technical assistance program through which
MassDevelopment provides and manages tailored third-party professional services; community-building placemaking projects; and TDI Fellows, a fellows program through which a MassDevelopment employee is embedded in and works with a TDI District’s local partnership.

FXM Associates
Fairhaven Economic Development Plan 50
· TDI Investment: an equity investment program through which MassDevelopment makes equity investments in real estate within TDI Districts.
· TDI Cowork: a business growth tools program that will expand in 2016 and 2017 with new programs to support collaborative workspaces and innovative initiatives to catalyze business development.
· TDI Local: a small grants program initiated to pilot grants to help support local market development.
Contact: [email protected]
Massachusetts Life Sciences Center (MSLC)
MSLC is an investment agency that supports live sciences innovation,
education, research & development, and commercialization. The MSLC is responsible for implementing the Massachusetts Life Science Initiative, a $1 billion investment to secure and strengthen the state’s leadership in the life sciences, and to bolster the life sciences as an economic engine for the Commonwealth The Massachusetts Life Science Initiative was passed by the State Legislature in June 208.
Since 2008 the MSLC has directly invested or committed more than $640 million and leveraged more than $2 billion in third-party investment. The MSLC has numerous funding programs including:
• A tax incentive program for companies engaged in life sciences research and development, commercialization and manufacturing in Massachusetts. Through seven rounds of the program, more than $160 million has been awarded to over 100 life science companies of all sizes
• A capital program that provides funding for capital projects for not for profit entities such as academic and research institutions, research hospitals, and business incubators and accelerators.
• The Massachusetts Ramp-Up program,or, MassRamp, provides supplemental funding for companies who have been awarded Small Business Innovtation Research or Small Business Technology Transfer Phase 1 Federal Grants/Congrats
• Massachusetts Transition and Growth program, or MassTAG, provides grant funding to encourage life science companies to establish operations in Massachusetts
Contact: 781-373-7777; [email protected]

FXM Associates
Fairhaven Economic Development Plan 51
Appendix A
Shared Workspace Examples
Appendix Outline 1. Examples of Shared Workspaces
Accelerators Incubators Science-Specific Incubators Makerspaces Coworking Spaces
2. Useful Resources for Developing a Coworking Space 3. Interview Highlights 4. Demand for Rental Housing
ACCELERATOR EXAMPLES Smarter in the City, Roxbury A 5-month rigorous program that will test both the business and entrepreneur. Launch your business here with us, and we’ll provide you with the strong foundation you need to get started. We’ll provide stipends, workspace, a mentorship program, and other resources to help you get your idea off the ground. Since 2014, we’ve been making strides in creating a more inclusive tech environment here in Boston, helping launch 14 20 minority-run startups so far. E for All Southcoast
Entrepreneurship for All (EforAll) is accelerating economic and social impact through entrepreneurship in mid-sized cities. Prepare entrepreneurs for the many responsibilities they will face, using our year-long accelerator program that starts with a 12-week intensive session. A 12 week program that gives entrepreneurs the opportunity to move their businesses forward, followed by nine months of additional support. During the program, there are workshops, mentors, and an opportunity to share a $30K Prize Pool.
E for All also offers coworking spaces throughout Massachusetts including Groundwork in New Bedford. LearnLaunch, Boston The leading startup program personalized for edtech entrepreneurs InnoLoft, Waltham The InnoLoft is a first-of-its-kind accelerator. It’s designed to support entrepreneurs passionate about helping small businesses by building new products, features and services.

FXM Associates
Fairhaven Economic Development Plan 52
Twice a year, small classes of startups will take up residence in our show-stopping InnoLoft: part lab, test kitchen, play room, business school, safe space, and launch pad for startups to work, disrupt, dream, test, strategize and plan.
In three-month sessions, startups get the run of the InnoLoft, from reconfigurable meeting and work space to showers for those late nights. And they get the run of our network, too. From our marketing, social media, tech and small business experts, to advisors, investors, and potential customers. They’ll meet everyone critical to the growth, scalability and success of their startup.
INCUBATOR EXAMPLES
Business Innovation Center, Fall River Building in downtown Fall River renovated and turned into incubator space and coworking space. In addition to facilitating a membership driven shared working community for high tech and creative entrepreneurs, the space will also occupy CNP Integrations www.cnpintegrations.com as an anchor tenant. Also home to an artificial intelligence lab, and 3D printing and multimedia lab, and a research and robotics lab Tech Sandbox, Hopkinton Metrowest Innovation Hub, 8500+ square foot, facility in the newly designated Hopkinton Innovation Park . Home to a coworking space and an incubator. Room & Works, Providence ROOMS&WORKS™ is the first live-work community in Providence offering 40 designer residences and shared workspace under the same roof. A home for the future generation of urban dwellers within one of New England’s most iconic historic mills with over one-hundred years of industrious past. Room & Works is home to Armory Kitchen, Providence’s first culinary incubator and shared-use commercial kitchen. We provide commercial grade kitchen space and supporting facilities to aspiring food entrepreneurs and chefs at affordable and convenient terms. Our mission is to foster emerging food entrepreneurs enabling them to grow their business amongst a community of innovators. Programs include a pop-up restaurant, demonstration kitchen, culinary classes, indoor market and supper club.
SCIENCE-SPECIFIC INCUBATOR EXAMPLES
Center for Innovation and Entrepreneurship, UMass Dartmouth in Fall River Founded in 2001, UMass Dartmouth opened the Advanced Technology Manufacturing Center (ATMC) in Fall River to encourage and support technology-focused businesses. In 2015, the ATMC reviewed and refined its mission to provide more experiential opportunities for UMass Dartmouth students and faculty and more proactively build economic development in the region.

FXM Associates
Fairhaven Economic Development Plan 53
The CIE (formerly ATMC) has graduated dozens of successful start-ups in the fields of • marine technology • clean technology • biomedical engineering
The Center for Innovation and Entrepreneurship provides the infrastructure to help early-stage companies grow and mature. The primary objective of the Center is to provide an environment where technology companies will develop into employers located in Southeastern Massachusetts. By attracting these companies to the UMass Dartmouth Center for Innovation and Entrepreneurship we hope to facilitate the economic growth of the region. CIE just launched RapidLab this past August
a new ‘rapid prototyping center’ which will offer research & development infrastructure and cutting edge fabrication technologies for startups in the manufacturing and marine technology sectors. The new facility, housed at UMass Dartmouth’s Center for Innovation & Entrepreneurship (CIE) in Fall River, previously received a $250,000 grant from the Baker-Polito Administration’s Seaport Economic Council (SEC). The RapidLab facility will build on the CIE’s experience working with manufacturing-focused startups. As one of the only facilities of its type in Southern New England, RapidLab will allow the CIE to engage with a range of firms in a 50-mile radius of Fall River, helping grow Massachusetts companies and to attract startups that are looking to prototype, develop, and launch innovative technologies. This includes startups in a range of sectors which have a maritime-focus, including advanced manufacturing, clean energy, and robotics.
Other science-related incubators:
• Massachusetts Biomedical Initiatives • North Shore Innoventures • Mansfield Bio-Incubator • MD Informatics Lab – UMass Boston • Massachusets Medical Device Development Center – UMass Lowell • Tufts Biotechnology Transfer Center – Tufts Vet School, Grafton • Biosquare at Boston University Medical Center • Arthur Blank Center For Entrepreneurship at Babson • The Business Growth Center at Springfield Technology Park /Scibelli
Enterprise Center

FXM Associates
Fairhaven Economic Development Plan 54
MAKERSPACE EXAMPLES South Coast Innovator Labs, Taunton AKA Massachusett’s South Coast Makerspace, founded in 2012, a nonprofit network of 20 engineers who meet on a weekly basis Technocopia, Worcester An 8,000 squ.ft. non-profit makerspace with common work space, rental bays, and a variety of tools for artisans to create and work with. Worcshop, Worcester The Worcshop is an 18,000 sq.ft makerspace facility specializing in larger scale projects & industrial applications such as machining, welding, plasma cutting, sandblasting, ventilated painting, blacksmithing, forging, casting, and various other processes that require lots of heat and pressure. Geek Group at Indian Orchard Mills, Springfield Founded in 2010 by a mechanical and a software engineer who have sponsored the space to share with others on a sliding scale basis, the Geek Group has built a membership of 132 mostly not-yet-dues-paying or donating-in-kind members through word-of-mouth and Meetup.org. The Springfield entity is the first spinoff chapter of The Geek Group in Grand Rapids, MI. Its space consists of 1,500 SF in a large mill that houses dozens of lock-and-key artist studios and small business stalls. The Geek Group has a large array of donated equipment, including a Bridgeport milling machine, thanks in part to excellent freight elevator access to its second floor location.
COWORKING EXAMPLES CapeSpace, Hyannis The first true, full-service shared workspace facility on Cape Cod. Opened: June 2016 The space: 8,600 square feet in a 40,00 square foot one-story building. The building was a manufacturing plant then converted to medical offices before becoming CapeSpace. Amenities: Furnished private offices, coworking space, meeting space, virtual office (mail service), printing and copying equipment, reception service, coffee, social networking events, notary

FXM Associates
Fairhaven Economic Development Plan 55
Rates: • Private office: Base monthly fees range from $550 for a small one-person office
to $1,450 for a large team room holding four people. • Membership without private office:
o From 10 hours/month $49 to fulltime access $249/month, with options in between
• They also offer hourly, day, and half-day rates.
Clients: Approx. 1/3 large corporates who use the space as a temporary space or because they have clients in the area; 1/3 locals, usually home-based businesses; 1/3 off-Cape businesses who want to have a presence on the Cape Contact: 508-202-1680; [email protected] Notes: • Their private offices sold out almost immediately, and as of June there was still
a waitlist • CapeSpace was founded when Robin Orbison, who moved from New York to the
Cape, wanted to rent a flexible coworking space with Regus, one of the shared workspace giants. Regus didn’t have locations in the area, so Orbison founded CapeSpace.
SOCO2, Fall River SouthCoast Shared Office Collaborative Operation Opened: 2017 Space: The 2nd floor inside the Quequechan Club at 292 North Main Street Amenities: Conference room, networking events, dedicated desks, shared desks, Free Wi-fi, Available Refreshments, Printing, 24/7 access, and off-street and non-metered parking surrounding the building. Rates: • Dedicated desk ($250/month) • Shared desk ($99/month) • Private office (coming soon) Contact: 508-974-3540; [email protected] Groundwork, New Bedford Groundwork is New Bedford's first coworking space. We're a shared office for independent professionals.

FXM Associates
Fairhaven Economic Development Plan 56
Opened: Fall 2014 The Space: 5,000 sq. ft. on the ground floor of a historic mill Amenities: kitchen, printing, copying, faxing, scanning, wifi, events, reception, lounge areas with ping pong, 2 meeting rooms, 1 conference room, comfortable work stations Rates: • Dedicated desk $250/month • Full time access without desk: $200/month • Part time access $100/month Contact: 508-441-4622
Nancy Durant, Quest Center Manager for the NBEDC
at [email protected] or at 508-991-3122 x 119. Notes: • Groundwork is part of Workbar, a network of coworking locations in MA.
Membership includes access to other locations. Additional Coworking Spaces: Amherst Works, Amherst Workspaces @ 45, Canton E for All, Lowell & Lawrence Cambridge Innovation Center
Useful Resources for Developing a Shared Workspace: • Boston Startup Guide’s list of accelerators, incubators, and support
programs: https://bostonstartupsguide.com/guide/every-boston-startup-accelerator-incubator/
• A list of incubators and accelerators in and around Boston: http://www.starthub.org/incubators
• A list of incubators and accelerators in MA, organized by region: http://www.masstech.org/why-massachusetts/technology-resources/incubators-and-accelerators
• Information about the tech industry in Boston:

FXM Associates
Fairhaven Economic Development Plan 57
http://bostontechguide.com/ • The Duxbury Public Library runs a makerspace and keeps a blog about it:
http://librarymakerspace.blogspot.com/ • Info about the FabFoundation, the foundation behind the network of
FabLabs that emerged out of MIT: http://fabfoundation.org/index.php/about-fab-foundation/index.html
• Gallup State of the American Workplace Survey:
http://news.gallup.com/reports/199961/state-american-workplace-report-2017.aspx
• Shared Workspaces Report JLL 2016:
http://www.us.jll.com/united-states/en-us/Research/US-Shared-workspace-2016-JLL.pdf?b7a425f4-e480-43d0-9dac-71058bf8e09a

FXM Associates
Fairhaven Economic Development Plan 58
Appendix B
Highlights of Interviews
Location
Companies consider direct road access in Fairhaven advantageous. (Routes 6, 195, and 24)
Water access: NB/Fairhaven Harbor Strong New Bedford Connection: economic, institutional, physical Midway between RI and Cape Cod Small but growing seasonal rental demand
Improvement Areas
Union Wharf Enhance connection to town center (business, pedestrian, visual) Considered critically underutilized despite documented revenue
potential Route Six Aesthetic improvement from Bridge St. to Stop & Shop
Zoning
Modify zoning to allow reuse/redevelopment of underutilized or vacant spaces to meet contemporary demand
Commercial property owners, brokers, and developers report inquiries that indicate unmet demand for commercial/nonretail, office/flex space, and residential rentals
Taxes
Because of road access, large developers and companies consider Fairhaven in competition with New Bedford, not other communities like Mattapoisett, Dartmouth, Marion
Compared to New Bedford, tax rates are favorable/competitive
Shared Workspaces Shared workspaces have become more popular in recent years in
the GNB area WHALE Co-Creative Center (open house Dec 1),
Quest/Groundwork in NB, Greater New Bedford Workforce Investment Board (proposed FabLab), New Bedford Whaling National Park Makerspace
New Bedford Economic Development Committee encourages that the Town of Fairhaven take steps to promote resident

FXM Associates
Fairhaven Economic Development Plan 59
participation in their workshops, which are cosponsored by Massachusetts Small Business Development Center
Suggestions for Planning Process
Economic development plan should prioritize the needs of existing businesses
Increase the supply of commercial (nonretail) properties Increase the supply of residential rental properties Businesses interviewed gave Town permitting processes high marks
generally, but several expressed frustration when key boards, Planning and Public Works, seemed to reach beyond their own clearance parameters to get involved in, for example, project design issues
Workforce
Local companies report stable workforce and ease of hiring employees with needed skills
Local companies report that most employees are Fairhaven and New Bedford residents
Expectation to increase jobs as businesses expand Mixed Use
High-density, mixed use reuse/redevelopment of vacant or underutilized commercial/retail space as potential benefit for tax revenue
Major retail developer with extensive experience repurposing commercial/retail into mixed use spaces in communities similar to Fairhaven expresses concerns about insufficient market demand, as well as potential lack of town support for scale and density required for such development. Suggests that promoting regional workforce and proximity to downtown New Bedford would be advantageous in pursuing mixed use redevelopment
Longer-term reuse/redevelopment of underutilized property should examine feasibility of relocating municipal faculties in east Fairhaven to accommodate development of mixed-use residential/commercial/retail project.
Public Realm/infrastructure Town of Fairhaven needs to invest in capital improvements directly,
in addition to seeking government and private funding. Areas suggested for specific improvement include Route 6 streetscape from west to east, Main Street, Route 6 ‘Gateway’ and waterfront, Main Street/Coggeshall business district, and Alden Road.

FXM Associates
Fairhaven Economic Development Plan 60
Appendix C
Demand for Rental Housing Demand for Rental Housing Although not a specific area of focus, rental housing is often also an important component of mixed use development. The analysis in this appendix was adapted from work done recently for a private development and public study on the New Bedford waterfront. Because of the waterfront site’s closeness to the Town of Fairhaven, the market area within which rental housing demand is estimated is the same, as is clear from Figure 1 below. Within this market area, FXM’s Housing Demand Model projects over the next five years the average annual demand for rental housing by age, income group, and affordable rental rates. The Housing Demand Model enables planners and developers to target types of rental units, in terms of cost and size and amenities, to various age groups of potential renters. The market study is segmented by age and affordable rents and prices, as the residential potential of this property most likely lends itself to smaller households, which tend to be in the under 35 and 55 to 74 age ranges, with sufficient qualifying incomes to afford units priced at the minimum necessary to support rehabilitation, potentially with historic tax credits. (These minimum rent and price levels would be established once cost estimates are available.) Households within the under 35 and 55 to 74 age groups are the ones frequently targeted by developers for urban and specialty rental housing, such as re-use of formerly commercial and institutional structures, because they are less likely to have school age children and therefore more open to units with fewer bedrooms in locations that are not necessarily ideal environments for children. Households in other age groups, however, may also comprise demand for housing within the market area, and this report also assesses overall potential demand for all age groups. Method For the purposes of this housing demand analysis the market area is defined as the area within a 20-minute drive time. This is consistent with the generally accepted view of the primary geographic area within which communities offer similar economic development attributes and constitute the competitive region for attracting jobs and households. This market area is shown in Figure C-1, FXM obtained proprietary data from A.C. Nielsen Segmentation and Market Solutions, estimating the number of households by age of householder and income ranges in 2016 and projected to 2021.

FXM Associates
Fairhaven Economic Development Plan 61
Next, FXM applied its proprietary Housing Demand Model which incorporates data on mobility rates by age of householder, propensities to own or rent by age of householder, current and projected number of households by age and income, and the qualifying income standards of commercial rental management companies. The results of the model follow Figure C-1. Finally, model results for potential rental demand were compared to asking rents from a CoStar survey of available rentals.
Figure C-1
Area Encompassed by a 20-minute Drive Time
Source: The Nielsen Company, Segmentation and Market Solutions, 2016 data Potential Demand for Rentals within the Market Area Figure C-2 shows the average annual demand for all rentals by all age groups in the Fairhaven market area, taking into consideration affordability, propensity to move in any given year, and propensity to rent.

FXM Associates
Fairhaven Economic Development Plan 62
Figure C-2
Source: FXM Associates, Housing Demand Model, October 2016 For example, according to the above figure, of the total number of households 4,728, expected to move to rental housing each year within the 20-minute market area and able to afford at least $900 per month rent, approximately 2,700 would be able to afford monthly rents of up to $1,800. As shown in Table 1 below, based on the Fairhaven’s current share of rental housing in the market area and estimated absorption rates in comparable projects, an estimated 44 households able to afford up to $1,800 a month rent might be absorbed by additional rental development in a competitive rental property in this location each year. Table 2 presents these estimates for each of the rental points shown in Figure 8. (Note that the figures in the demand columns are not additive. They are cumulative, with the “Rentals @ $900” figure representing total estimated average annual demand in both Figure 2 and Table 1.)
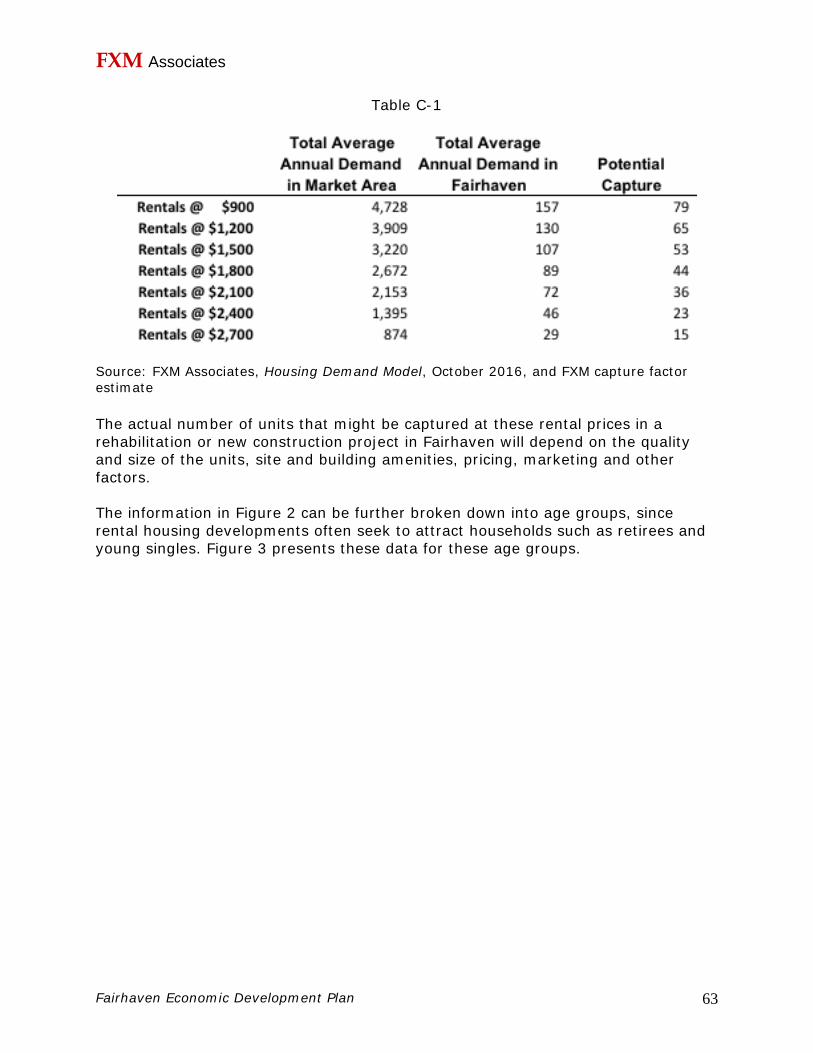
FXM Associates
Fairhaven Economic Development Plan 63
Table C-1
Source: FXM Associates, Housing Demand Model, October 2016, and FXM capture factor estimate The actual number of units that might be captured at these rental prices in a rehabilitation or new construction project in Fairhaven will depend on the quality and size of the units, site and building amenities, pricing, marketing and other factors. The information in Figure 2 can be further broken down into age groups, since rental housing developments often seek to attract households such as retirees and young singles. Figure 3 presents these data for these age groups.
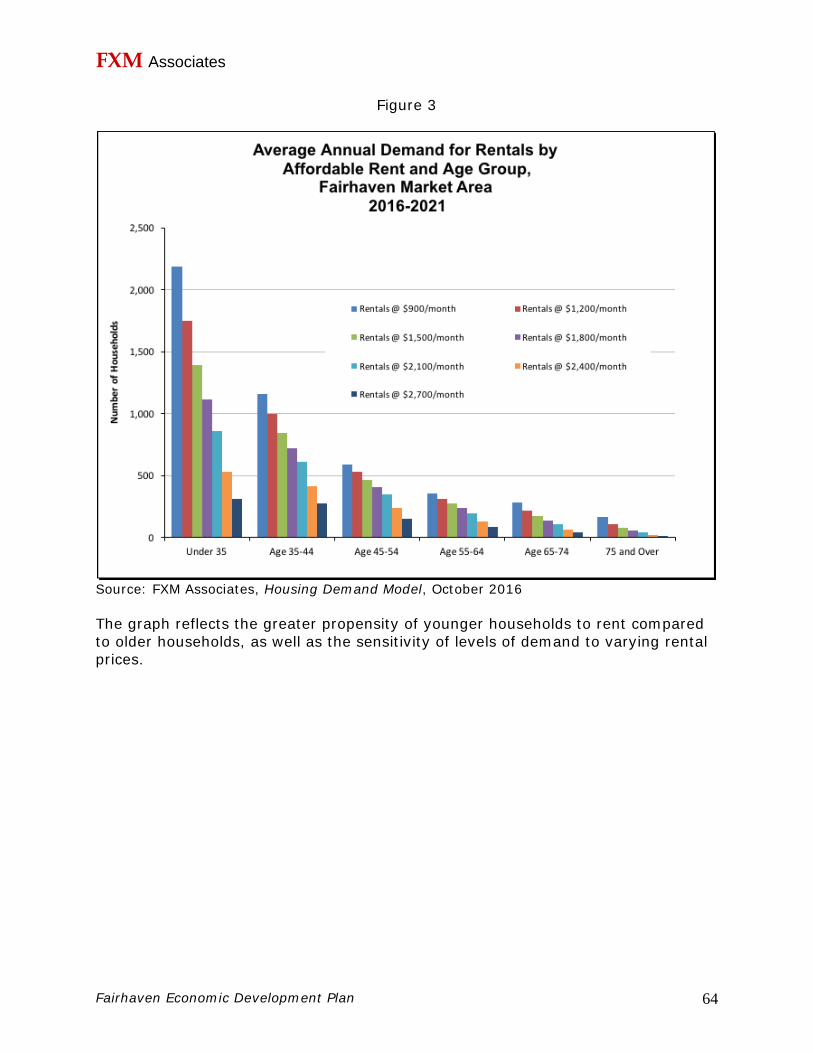
FXM Associates
Fairhaven Economic Development Plan 64
Figure 3
Source: FXM Associates, Housing Demand Model, October 2016
The graph reflects the greater propensity of younger households to rent compared to older households, as well as the sensitivity of levels of demand to varying rental prices.

FXM Associates
Fairhaven Economic Development Plan 65
Figure 4 offers the same kind of analysis, but with the data for rents in the upper ranges only.
Figure C-4
Source: FXM Associates, Housing Demand Model, October 2016

FXM Associates
Fairhaven Economic Development Plan 66
Figure 5 shows another dimension to the estimation of future rental demand: the changes projected over the next five years in numbers of households by age and income. The incomes chosen are in the upper ranges, since these households have the higher affordable rents.
Figure C-5
Source: FXM Associates, Housing Demand Model, October 2016 Particularly striking is the projection of changes in age cohorts in the market area over the next five years: the greatest gains across all four income categories are estimated to be in the age 55 to 74 cohorts, while the age category 45 to 54, typically a population segment at peak earning capacity, would actually lose households in the lowest category of income selected above and make only small gains in the higher income categories. The age cohort 24-34 is projected to make a small increase. Unlike some areas of the state, however, the age category 35-44 will make gains comparable to the 55-64 cohort, a plus for marketing to these income groups over the next five years. Also noteworthy is the indication that households in the income category over $108,000 – who could afford rents up to $2,700 per month -- never lose population, remaining fairly robust even in the age 65-74 cohort, and only dropping off after age 75. Households with incomes of $72,000 can afford $1,800 rents.
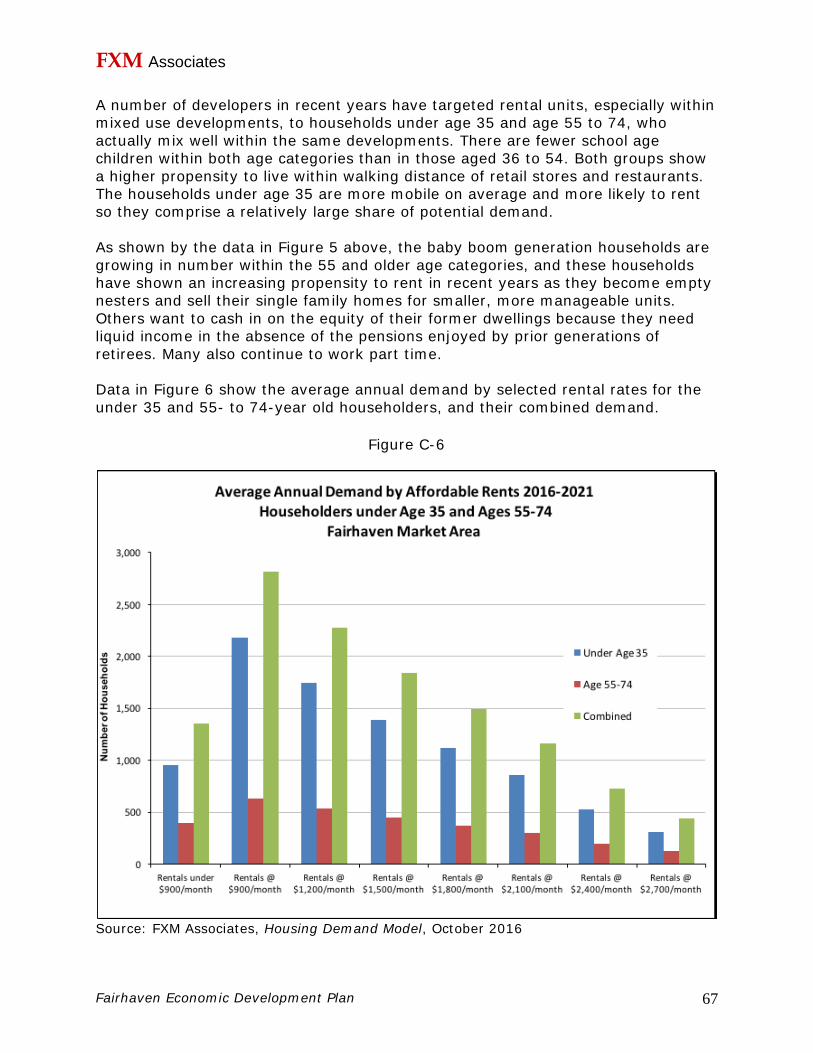
FXM Associates
Fairhaven Economic Development Plan 67
A number of developers in recent years have targeted rental units, especially within mixed use developments, to households under age 35 and age 55 to 74, who actually mix well within the same developments. There are fewer school age children within both age categories than in those aged 36 to 54. Both groups show a higher propensity to live within walking distance of retail stores and restaurants. The households under age 35 are more mobile on average and more likely to rent so they comprise a relatively large share of potential demand. As shown by the data in Figure 5 above, the baby boom generation households are growing in number within the 55 and older age categories, and these households have shown an increasing propensity to rent in recent years as they become empty nesters and sell their single family homes for smaller, more manageable units. Others want to cash in on the equity of their former dwellings because they need liquid income in the absence of the pensions enjoyed by prior generations of retirees. Many also continue to work part time. Data in Figure 6 show the average annual demand by selected rental rates for the under 35 and 55- to 74-year old householders, and their combined demand.
Figure C-6
Source: FXM Associates, Housing Demand Model, October 2016
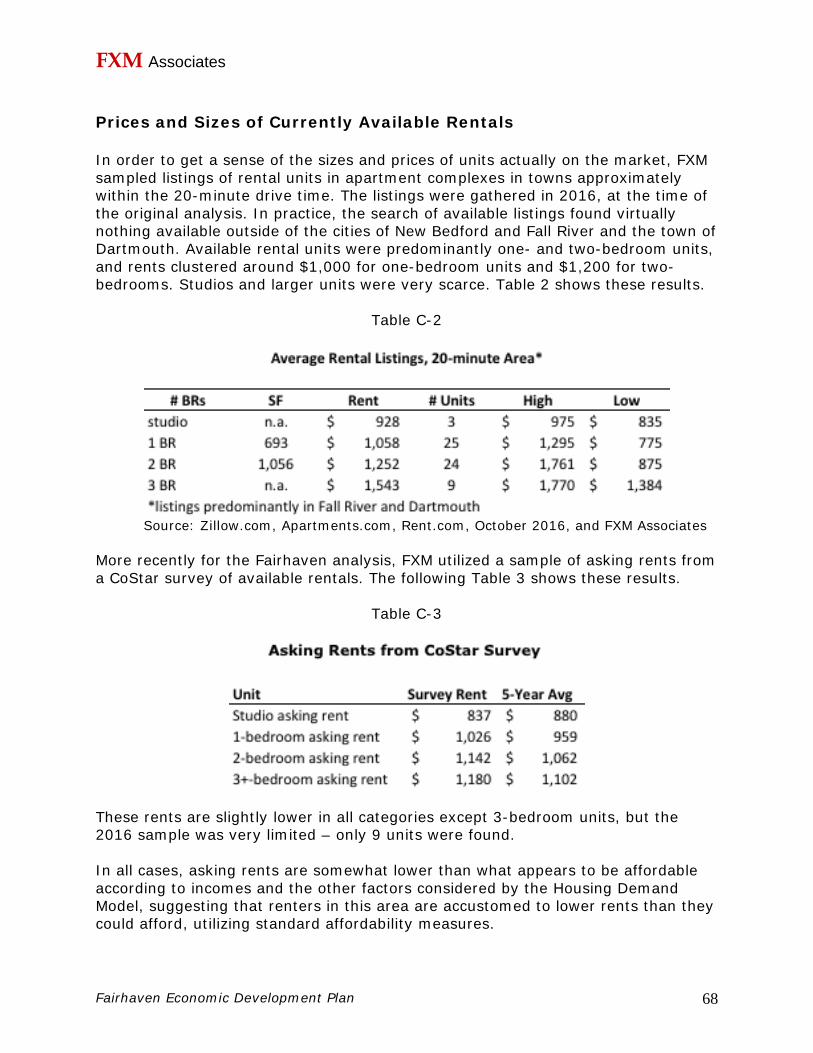
FXM Associates
Fairhaven Economic Development Plan 68
Prices and Sizes of Currently Available Rentals In order to get a sense of the sizes and prices of units actually on the market, FXM sampled listings of rental units in apartment complexes in towns approximately within the 20-minute drive time. The listings were gathered in 2016, at the time of the original analysis. In practice, the search of available listings found virtually nothing available outside of the cities of New Bedford and Fall River and the town of Dartmouth. Available rental units were predominantly one- and two-bedroom units, and rents clustered around $1,000 for one-bedroom units and $1,200 for two-bedrooms. Studios and larger units were very scarce. Table 2 shows these results.
Table C-2
Source: Zillow.com, Apartments.com, Rent.com, October 2016, and FXM Associates
More recently for the Fairhaven analysis, FXM utilized a sample of asking rents from a CoStar survey of available rentals. The following Table 3 shows these results.
Table C-3
These rents are slightly lower in all categories except 3-bedroom units, but the 2016 sample was very limited – only 9 units were found. In all cases, asking rents are somewhat lower than what appears to be affordable according to incomes and the other factors considered by the Housing Demand Model, suggesting that renters in this area are accustomed to lower rents than they could afford, utilizing standard affordability measures.

FXM Associates
Fairhaven Economic Development Plan 69
Appendix D
Goals for Economic Development Adopted by the Economic Development Committee
NOTE: On November 16, 2017 the Economic Development Committee adopted the Goals for Economic Development articulated in the draft Master Plan, with the exception of Goal #1 which was re-worded to place greater emphasis on preserving and enhancing the working waterfront. The recommendations, accompanying the respective Master Plan goals, are shown in italics. These were not formally endorsed by the Economic Development Committee but were considered generally acceptable and are incorporated for reference.
Goal 1: Preserve the commercial viability of the working waterfront. Explore opportunities to make the waterfront more accessible to the community.
Recommendations: Hire a planning firm specializing in waterfronts to create a redevelopment plan for the working waterfront that would preserve key commercial zones, improve vehicular circulation, emphasis pedestrian access, and create a better tourist/public realm experience along the waterfront. [NOTE: Economic Development Committee strongly in favor of preserving working waterfront and expanding the higher paying jobs involved in vessel services, shipbuilding and repair] Evaluate streets along the working waterfront for a possible conversion to one-way to improve traffic movements and reduce conflicts. Track and to the extent possible integrate with the Waterfront Redevelopment Plan being performed in 2017 on behalf of the New Bedford Harbor Development Commission. [NOTE: Superseded by participation in forthcoming update to the new Bedford/Fairhaven Municipal Harbor Plan] Explore the needs of infrastructure upgrades to support the long-term viability of the working waterfront in light of the foreseeable sea level rise, in concert with the recommendation of the Hazard Mitigation Plan effort.

FXM Associates
Fairhaven Economic Development Plan 70
Goal 2: Maintain healthy commercial occupancies along Route 6 and in other commercial nodes and retain service related jobs wherever possible.
Recommendations: Work with major commercial property owners to determine potential large-scale vacancies before they occur to initiate early strategic discussions for maintaining occupancies or redeveloping the site. Work with large employers such as Acushnet and Southcoast Medical Center to identify strategies for retaining/growing employment base and meeting future space needs. Consider introduction of tax credit/tax abatement programs for job creation.
Goal 3: Encourage mixed-use projects on key redevelopment parcels in support of a live, work, play environment.
Recommendations: Consider a joint town/property study to engage a real estate advisory firm to create a redevelopment strategy for a key commercial property with an unhealthy level of vacancy. Explore town related functions occupying spaces in vacant commercial buildings whenever appropriate. Promote mixed-use development through land use, zoning, and development incentives. Develop a detailed revitalization plan to guide redevelopment of commercial nodes in town. The plan should incorporate analysis of appropriate types of redevelopments, scale/dimension/design of such developments, as well as potential zoning changes and infrastructure and services needed to support these redevelopments. Consider creating a Route 6 mixed-use overlay zoning district to stimulate mixed use commercial and residential redevelopment. Making provisions for mid- to high- density residential will be important.

FXM Associates
Fairhaven Economic Development Plan 71
Goal 4: Revise business regulations and enhanced programs to continue to support the incubation and growth of small businesses.
Recommendations: Plan and potentially fund a small-scale, low-cost business incubator to be housed in vacant commercial space along Route 6. Adopt effective permitting procedures for small neighborhood businesses. Review and update zoning to allow more flexibilities that support small business development, such as home-based business, residential commercial mixed use, etc. Revisit signage ordinance to allow for more flexibility for businesses.
Goal 5: Collaborate with New Bedford and other nearby towns on issues of workforce training/regional economic development to elevate the profile of South Coast.
Recommendations: Consider engagement of a market/branding firm to develop a targeted campaign for the South Coast. [NOTE: Economic Development Committee is initially focusing on Town of Fairhaven brand and Economic development website] Partner with New Bedford to develop a joint economic development strategy for the Harbor. Join regional effort to support the South Coast Rail extension. Explore future economic development opportunities in and around the harbors as catalyzed by the upcoming replacement of the Fairhaven-New Bedford bridge.