family composition and off-farm participation decisions in...
TRANSCRIPT
Family Composition and Off-Farm Participation Decisions in
Israeli Farm Households
By
Ayal Kimhi
ABSTRACT
This article studies the relationship between the off-farm participation behavior of farm operators and their spouses and the demographic composition of the household. I focus on farm families without parents, siblings or partners, and examine the effects of the existence of elderly children of the farm couple. I find that both the father and the mother tend to reduce their participation in off-farm work as the number of elderly children rises. This result holds even after controlling for observed characteristics. I also find that the effect of elderly children stems from considerations related to both farm production and household production.
Key Words: Off-Farm Participation; Family Composition; Adult Children; Multivariate Probit; Quasi-Maximum Likelihood.
(Third revision June 2003)
_____________________
* Ayal Kimhi is a senior lecturer at the Department of Agricultural Economics and Management of the Hebrew University. This research was supported in part by Research Grant Award No. IS-2762-96 from BARD - the United States – Israel Binational Agricultural Research and Development Fund. The author acknowledges the helpful comments and suggestions of participants in the annual meetings of the American Economic Association and the European Society for Population Economics, the Second Mediterranean Social and Political Research Meeting, and the Workshop on the Economics of Water and Agriculture. Special thanks to the Central Bureau of Statistics in Israel, and especially Elana Dror and Haim Regev, for providing the data. Eddie Seiler collaborated on an earlier version of this article, and Eliel Rapaport provided valuable research assistance. None of these is responsible for any remaining errors.
1
The time allocation decision of farmers has long attracted researchers because many farmers
divide their labor supply between farm work and off-farm work, a phenomenon that is rarely
observed in other sectors of the economy (Shishko and Rostker). Understanding this
phenomenon is important for the design of agricultural and rural policy. Many policy
instruments aim at improving farm income or reducing its variability. Policy makers often do
not fully appreciate the importance of earnings from off-farm sources that supplement farm
income and serve as a buffer against farm income fluctuations (Lamb; Mishra and Goodwin).
Moreover, any farm-related policy should take into account the ability of farmers to act on the
margin between farming and off-farm activities in addition to their actions on the margin
between different farm activities. Understanding how farmers allocate their time between
farming and off-farm occupations is therefore crucial for designing successful farm policies.
The attempts to analyze farmers’ time allocation decisions have thus far been limited to
husband and wife only because of two main reasons. One is the lack of sufficient data on the
time allocation of other family members. The other is the limitation imposed by available
econometric techniques. This research uses data from a family farm survey conducted in Israel,
which include the time allocation patterns of all adult farm-family members. Modern
econometric techniques enable the joint estimation of a large number of participation and labor
supply equations. Hence one purpose of this research is to extend the time allocation analysis to
other members of the farming family.
The main purpose of this research is to investigate how time allocation decisions depend
on family composition. Farm sectors in developed countries are usually viewed as modern
sectors in which business decisions are independent of consumption decisions. However, market
imperfections that still exist, especially in rural areas, cause these decisions to be interdependent
as in developing countries. The scope of this interdependence is the focus of this study.
2
Previous research (Kimhi, 1996) has found that farm couples are more likely to work off
the farm when the number of other adults in the household increases. This may be explained by
the differential income effects resulting from the household’s joint budget constraint, and by the
time and money costs imposed by different household members. This article builds on the
previous work and modifies it in several directions: (a) we use a more recent data set; (b) we
focus on farm families without parents, siblings or partners, so the only other adults in the
household are children of the farm couple and their spouses; (c) we estimate the off-farm
participation equations of the children jointly with the equations of the farm couple.
We find that the effect of household composition on the off-farm participation behavior
of farm couples is completely different than indicated by previous research. In particular, the
farm couple is less likely to work off the farm as the number of adult children in the household
rises. We explore two possible reasons for this behavior, one related to complementarity of farm
labor inputs of different family members, and another related to the time burden in household
production imposed by adult children. Both explanations are supported by the empirical results.
The following section starts with a survey of previous literature. Then we briefly discuss
the theoretical background and the empirical methods adopted for this analysis. The following
sections present the data, the empirical results, and extensions. The last section provides
conclusions, qualifications, and avenues for future research.
Background and Previous Results
The literature is rich in applications of the agricultural household model to time allocation
problems. The traditional approach has been to estimate off-farm participation equations and
labor supply equations of farm operators (e.g., Sumner). Later, researchers moved to estimating
two-equation models in which the off-farm labor supply equations of husbands and wives are
jointly determined (e.g., Huffman and Lange; Tokle and Huffman; Lass and Gempesaw), and
3
found that off-farm labor supply of husbands and wives are positively correlated. Recently, this
approach has been extended to include farm work participation equations (Kimhi, 1994) and
labor supply equations as well (Kimhi and Lee). Buttel and Gillespie have also found that men's
and women's farm and off-farm labor supply decisions are correlated.
However, farm families do not consist of a husband and a wife only. On the contrary,
farm families are often larger than non-farm families, including multiple generations who
function as an extended family. The importance of within-family succession serves as an
incentive for adult children to work together with their parents on the family farm (Kimhi,
1995). Blanc and Perrier-Cornet found that European successors often work as laborers for their
parents for ten years or more before receiving ownership. Hence, other adult family members
allow the farm operator and spouse to have more flexibility in their time allocation decisions.1
This claim is supported by the results of Kimhi (1996), who studied the effect of family
composition on the labor participation decisions of Israeli farm couples. The number of other
adults (19 to 51 years old) was found to increase off-farm labor participation and decrease farm
labor participation of both spouses. It seems that other adults are net substitutes in farm work.
The model was estimated separately for households with and without other adults, and the
results implied that the time allocation of the farm couple depends significantly on the existence
of other adult household members. Overall, these results indicate that joint estimation of the
labor supplies of different household members is desirable.
Theoretical Background and Empirical Methods
Models of the time-allocation decisions in family farms are derived from maximizing household
utility over household consumption and the leisure of each family member. This is the
framework used by Huffman in his comprehensive theoretical survey of farm-household
models. Kimhi (1994) suggested a slight modification of the theory to allow for zero farm work.

4
The Kuhn-Tucker conditions for maximizing this model include an off-farm participation
equation for each family member. Each participation equation depends on the characteristics of
all household members. It is this dependence that we examine in this paper.
Each off-farm participation equation is modeled as a Probit equation, assuming
normally-distributed additive stochastic terms. Participation is explained by exogenous variables
that affect household utility, farm income, off-farm income, non-labor income, and available
time for all household members. Assuming a general correlation structure between the equations
requires joint estimation in order to exploit all available information and provide efficient
estimators. This correlation structure could result, for example, from unobserved household-
level variables that are common to all equations.
Off-farm participation models with up to two equations were estimated by maximum
likelihood (ML) methods in many studies of joint husband-wife work decisions. Multivariate
probit ML estimation of more than two equations requires more than two levels of numerical
integration, making the task complicated if not impractical. Here, we use the quasi-maximum
likelihood approach described by Kimhi (1994). In this approach, restrictions are imposed on
the parameters in order to simplify the likelihood function. The restrictions are chosen such that
the restricted model satisfies the orthogonality conditions, which are equivalent to the first-order
conditions of the restricted ML model. The resulting estimators are consistent although not as
efficient as ML.
The method is illustrated here for the case of three equations. Write the participation
equations as
(1) αi⋅Xi + νi ≤ 0 (i=1,2,3,4),

5
where strict equality indicates participation. In the first stage, estimate each equation separately
by probit. Denote the probit estimators as α*i (i=1,2,3,4). In the second stage, maximize a
bivariate probit log-likelihood function of the form
(2) £ij = Σ ln B(diα*iXi, djα*
jXj, dijρij),
with respect to ρij, for each possible (i,j) ∈ {(1,2), (1,3), (2,3)}. Summation is over individuals;
B is the bivariate normal probability function; ρij is the correlation between νi and νj; Ik equals
one if participation occurs, zero otherwise; and di=2Ii-1 and dij=didj. Since maximizing £ij for
each possible (i,j) is equivalent to maximizing £ = £12 + £13 + £23, £ can be maximized over all
the parameters in one stage. This is the most efficient QML estimator subject to the condition
that the level of integration is not higher than two. The method is appropriate for any number of
equations. The true covariance matrix of the estimators should be calculated as H -1WH -1 where
H is the matrix of second derivatives of quasi-likelihood function £ and W is its gradient outer-
product matrix.
Data
The data come from a country-wide farm survey that was conducted in Israel in 1995 (State of
Israel, Central Bureau of Statistics). The survey encompassed a representative 10% sample of
farms, and included approximately 3000 family farms. Three separate sectors were surveyed:
Moshavim (cooperative villages), other Jewish localities, and Arab localities. Note that despite
the cooperative structure of Moshavim, these farms can be treated as private family farms for all
practical purposes.2 The survey questionnaire included detailed questions about farm production
activities, as well as personal and family characteristics. Regarding time allocation, each family
member was asked if he/she engaged in agricultural activities on the farm up to 1/4 of a full-

6
time job, up to 1/2, 3/4, full time, or not at all. A similar question was asked about non-
agricultural farm activities, and about off-farm work.
Table 1 includes the definitions of variables used in this study. Among the time
allocation variables, we only use a dummy for working/not working in each sector, and ignore
the level of work. This is because the vast majority of those who work off the farm do it on a
full-time basis. Also, we add together those who work off the farm and those who participate in
non-agricultural activities on the farm, because the latter are a very small group. Other personal
characteristics that we use are age, a dummy for being born in Israel, a dummy for having an
ethnic origin in Asia or Africa (this relates to the respondent or his/her father), and three
educational dummies: one for finishing high school, one for having more than high school
education, and one for having some level of agricultural education.3
A different data set includes off-farm wages for a subset of the survey respondents. That
data set is confidential and we do not have access to it, but we were able to obtain predicted off-
farm wages for that subset of the sample. We use these predicted wages as explanatory
variables, and we also include a dummy for the observations with missing wages although there
is no reason to believe that these observations are systematically selected.4
Family-related variables include two locality-type dummies (private-Jewish and Arab,
excluded group is Moshavim), two location dummies (north and south, excluded location is
center), the numbers of children up to age 14 and adolescents up to age 21, and dummies for the
number of adults (older than 21 years)5 in the household: group=1 is for husband and wife only,
group=2 is for husband, wife, and one adult child, group=3 is for husband, wife, and two adult
children (or an adult child and his/her spouse), and group=4 is for husband, wife, and more than
two adult children or spouses. Other types of households, including single-parent households,
households with elderly parents, and other forms of extended families, were excluded from the
current analysis. There were 1949 families left in the data set comprising of groups 1 to 4.

7
Variables related to the farm operator include tenure (years since the current owner
started operating the farm), and two dummies for method of receiving the farm (succession and
purchase; the excluded group are those who received the farm through the settlement agencies).
Variables related to farm production include level of specialization, land, capital, and types of
products produced. Level of specialization includes two dummy variables, specialized and
diversified.6 Land size includes all the land that is permanently held by the farm.7 Capital stock
is the value of permanent capital and livestock.8 We also include dummy variables indicating
production in each of the following branches: flowers and nurseries, poultry, field crops and
vegetables, and cattle.9 In addition, we include a profitability index in each of these branches.10
Results
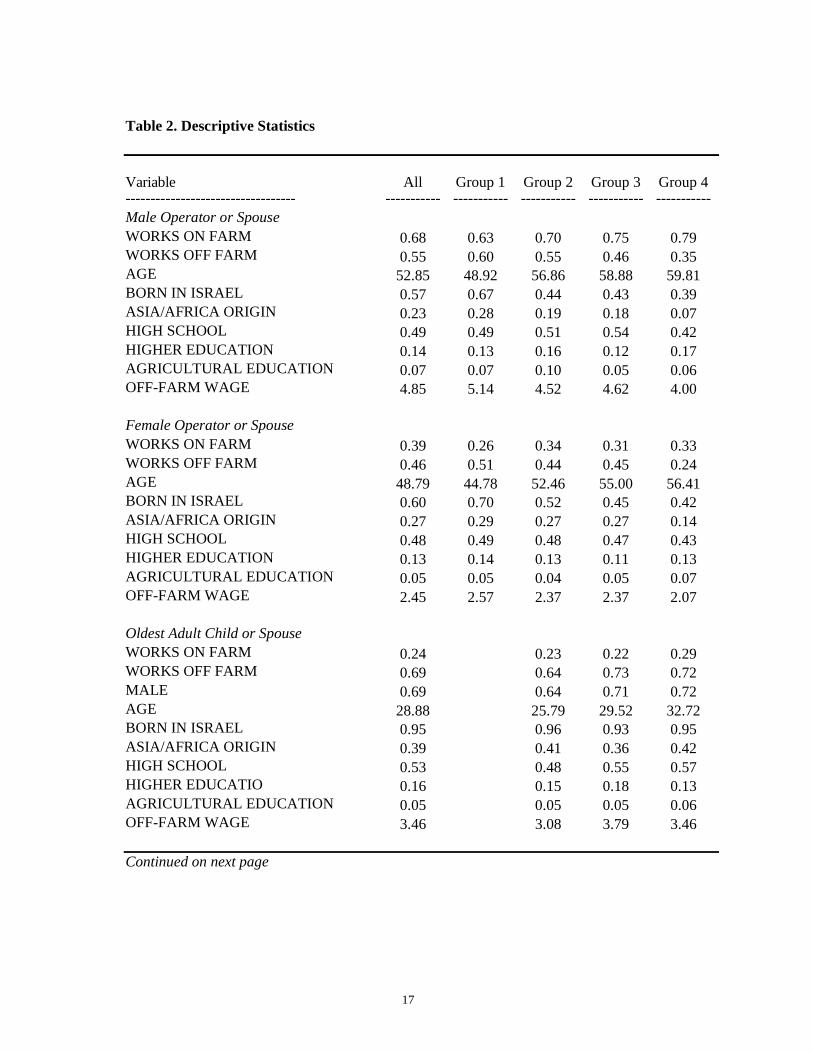
Table 2 includes descriptive statistics of the personal characteristics of the farm couple and theit
oldest adult child, and family and farm attributes.11 We can see that overall, 55% of the
operators and 46% of the spouses work off the farm, while 69% of oldest children do so.
However, the fraction of operators and spouses who work off the farm declines with the number
of adult children in the household, while the fraction of the oldest children who work off the
farm rises. This could simply be an age effect: the ages of operators, spouses, and oldest
children rise with the number of adult children, reflecting life-cycle effects. While the parents
are already in the age range in which the tendency to work off the farm declines with age, the
children are not. Opposite to the results of Kimhi (1996), we do not find that adult children
substitute for their parents’ farm labor. On the contrary, fathers’ farm labor participation rises
with the number of adult children, while that of the mother doesn’t change monotonically. This
could be due to several reasons. First, Kimhi (1996) considered all adult household members,
while here we only count children/spouses. Second, only 24% of oldest children work on the
farm, reflecting the highly diminished role of agriculture in rural Israel in 1995 relative to 1981.

8
Finally, these are only raw results; we have to see whether they still hold after we control for
observed differences among the households, especially age, in a multivariate analysis.
We first apply quasi-maximum likelihood estimation of the off-farm participation
equation to the whole sample, allowing for different intercepts for the different groups of
households.12 The model includes three different equations: for the adult male, for the adult
female, and for the oldest adult child. We tried to add an equation for a second adult child, but
the model did not converge, probably because the number of observations with more than one
adult child was not large enough. Many cases of missing values occurred because respondents
did not answer the work participation questions. While we suspect that a large fraction of those
thought the questions were not relevant for them because they did not work at all, there is no
way to confirm this and, hence, we exclude these individuals from the model by attaching zero
weights. A few additional observations were excluded because of missing schooling data.13
The results are in table 3. We first observe that the three off-farm participation equations
are positively correlated. This could be due to two reasons. First, it could be that unobserved
household-specific components are important determinants of off-farm labor participation, even
after controlling for all the observed attributes. Second, it could be easier for other household
members to work off the farm when one member already does so, for example due to the
advantage of carpooling. The group dummies have negative coefficients in the males’ equation,
but only the coefficient of group 4 is statistically significant. In the females’ equation, two of the
three group dummies have significantly negative coefficients. These results imply that the
tendency of farm couples to work off the farm is smaller when adult children are present. This is
similar to the raw statistics in table 2. The tendency of the oldest adult child to work off the farm
does not depend significantly on the number of adult children.
Age has a typical inverted U effect on participation probability. Ethnic origin has a
significant effect in the children’s equation only: children with Asian or African origin are more

9
likely to work off the farm. Education has a positive effect on males’ participation, as expected,
but does not affect off-farm participation of females or children. Agricultural education is no
different than general education. Off-farm wages have positive effects on participation for the
male and the female but only the female effect is statistically significant. The effect of wage is
negative in the children’s equation, with no good explanation for this result. Participation is
lower in southern regions, but only for the farm couple.
Participation is more likely in farms purchased from a previous owner, except for the
case of females. Perhaps this indicates that some operators purchase farms for residential
purposes. The male's off-farm participation declines with the level of specialization. This
reflects a higher reservation wage on specialized farms for the male, who is in most cases the
farm operator. Landholdings have a significantly positive effect on the female’s probability of
working off the farm and a negative effect on the children’s probability. Capital stock, on the
other hand, has a significantly negative effect on the off-farm participation probabilities of all
household members, as expected. Males’ participation probability was lowest in the presence of
flower cultivation, the second lowest in poultry farms, the third in field crop farms, and the
highest in cattle farms and fruit farms. The same rankings are observed for females, except that
flower farms move to the last category with cattle farms and fruit farms. None of the branch
dummies was significant in the children’s equation. The profitability indexes have negative
effects on off-farm participation in general, although not all of the effects are statistically
significant. In Arab farm families, females and children are less likely to work off the farm. This
may be due to differences in cultural tradition but also to off-farm labor market discrimination.
Next, we allow all the coefficients of the participation equations to vary across the
different groups of households, not only the intercepts. For this, we estimate the model
separately in each of the groups. The model of group 1 includes only two equations, so it is a
bivariate probit model. The model of group 4 did not converge, probably due to the relatively
10
small number of observations. Hence we estimated the model for groups 3 and 4 together,
allowing for a different intercept for each of them. The results are not reported here for the sake
of brevity, but we do find that the coefficient estimates vary considerably across the groups of
households. In table 4, we compare the actual and predicted off-farm participation probabilities
of the different models. The predicted probabilities are derived from each of the two models.
“Joint estimation” is the model with equal coefficients for all groups of households except for
the intercepts (table 3). “Separate estimation” is the model with all the coefficients different. For
each of the models, we also calculate the probabilities at the sample means of the explanatory
variables, where the means are taken over the whole sample. This last calculation allows us to
isolate the genuine effect of the group, neutralizing the different variable means across groups.
For both males and females, the predicted frequencies follow a pattern similar to that of
the actual frequencies, namely a general decline with the number of adult children. This is true
for both the joint estimation and the separate estimation. When using the sample means of the
explanatory variables to generate predicted frequencies, the trend becomes less monotone, but it
is qualitatively similar. The decline in both males’ and females’ predicted participation
frequency with the number of adult children is somewhat more moderate when using the sample
means. This means that the decline in the farm couples’ off-farm work participation with the
number of adult children is due in part to the changes in explanatory variables and in part to
genuine effects of the adult children.
Extensions
We found evidence for the existence of a negative effect of the number of adult children in the
household on the tendency of the parents to work off the farm. As discussed by Kimhi (1996),
this effect could be related to farm production considerations and/or to household production
considerations. As an example for the farm-related considerations, it could be that adult children
11
satisfy the need of the household for additional income and the diversification of income, so that
parents do not have to split their time and can concentrate on their farm work. As an example
for the household-related considerations, it could be that the adult children impose time costs on
the parents in household production so that their tendency to work off the farm is reduced. In the
following paragraphs, we will try to test these possibilities.
To start with the household-related considerations, we examine whether the number of
adult children matters less if they maintain a separate consumption unit. In particular, we
interact the group dummies in the “joint estimation” model with a dummy variable that indicates
whether the household includes more than one consumption unit. The results (table 5) support
the hypothesis that the effect of children is related to household production considerations: the
negative effects of the number of adult children on the parents’ tendency to work off the farm
are statistically significant only when the children live with the parents in the same house and do
not maintain separate consumption units.14
Moving to the farm-related considerations, we examine whether the number of adult
children matters more in active farms. We now interact the group dummies with a dummy
variable for active farms. The results (table 5) show that the negative effects of the number of
adult children on the parents’ tendency to work off the farm are statistically significant only in
active farms. This supports the hypothesis that the effect of children is related to farm
production considerations as well.
Summary and Conclusions
This article demonstrates that family composition matters for the time allocation decisions of
adult members of farm families, even in a developed farm sector such as in Israel. The article
takes a deeper look at the phenomenon observed in previous research, that the off-farm labor
participation behavior of farm operators and their spouses depends on the demographic

12
composition of the household. Using data from a 1995 family farm survey, we estimate jointly
the off-farm participation equations of the farm operator, the spouse, and their eldest adult child.
The number of adult children has a negative effect on the off-farm participation of farm couples,
especially on that of the female. Variation in off-farm labor participation across the groups of
households defined by the number of adult children is due in part to observed differences across
the groups, and in part to genuine effects of the number of adult children. This negative effect
seems to be related to household production as well as farm production considerations.
These conclusions contradict the results of previous research, but only under several
qualifications. First, previous research looked at the effects of the number of all adults in the
household, not only children, and included different forms of extended households, other than
the relatively simple households considered here. Second, the previous research looked at the
joint farm and off-farm labor participation decisions, while here we only examined off-farm
participation. Finally, it could be that the effects of household composition changed dramatically
from 1981 to 1995. All these qualifications could and should be examined in future research.
Another point that should be tackled in future research is the possible endogeneity of the
number of adult children in the household. It could be that adult children's choice to live on the
farm with their parents depends on the parents’ labor decisions. For example, mothers who do
not work off the farm are more available for child care services that are demanded by their
married adult children. Prospects for farm succession could also play a role here. Family history
is not available in this data set, hence it is difficult to account for this possible endogeneity.
However, we expect to be able to match at least part of the sample with the 1981 data, and this
may enable tracing, at least in part, children who left the family farm between the two periods.
13
References
Ahituv, A. and A. Kimhi. “Off-Farm Work and Capital Accumulation over the Farmer’s Life-
Cycle.” Journal of Development Economics 68(2002):329-53.
Blanc, M. and P. Perrier-Cornet. "Farm Transfer and Farm Entry in the EC." Sociologia Ruralis
33(1993):319-35.
Butler, J.S. and A.W. Horowitz. “Labour Supply and Wages Among Nuclear and Extended
Households: The Surinamese Experiment.” Journal of Development Studies 36(2000):1-29.
Buttel, F.H. and G.W. Gillespie. "The Sexual Division of Farm Household Labor: An
Exploratory Study of the Structure of On-Farm and Off-Farm Labor Allocation among Farm
Men and Women." Rural Sociology 49(1984):183-209.
Gong, X. and A. van Soest. “Family Structure and Female Labor Supply in Mexico City.”
Journal of Human Resources 37(2002): 163-91.
Huffman, W.E. "Agricultural Household Models: Survey and Critique." In M.C. Hallberg, J.L
Findeis and D.A. Lass (eds.), Multiple Job-holding among Farm Families. Ames: Iowa State
University Press, 1991, 79-111.
Huffman, W.E. and M.D. Lange. "Off-Farm Work Decisions of Husbands and Wives: Joint
Decision Making." Review of Economics and Statistics 81(1989):471-80.
Hundley, G. “Male/Female Earnings Differences in Self-Employment: The Effects of
Marriage, Children, and the Household Division of Labor.” Industrial and Labor Relations
Review 54(2000):95-114.

14
Kimhi, A. "Quasi Maximum Likelihood Estimation of Multivariate Probit Models: Farm
Couples' Labor Participation." American Journal of Agricultural Economics 76(1994):828-35.
Kimhi, A. "Differential Human Capital Investments and the Choice of Successor in Family
Farms." American Journal of Agricultural Economics 77(1995):719-24.
Kimhi, A. "Demographic Composition of Farm Households and its Effect on Time Allocation."
Journal of Population Economics 9(1996):429-39.
Kimhi, A. “Institutional Environment, Ideological Commitment, and Farmers' Time Allocation:
the Case of Israeli Moshavim.” Economic Development and Cultural Change 47(1998) 27-44.
Kimhi, A. and M-J. Lee. "Joint Farm and Off-Farm Work Decisions of Farm Couples:
Estimating Structural Simultaneous Equations with Ordered Categorical Dependent Variables."
American Journal of Agricultural Economics 78(1996):687-98.
Lamb, R.L. Fertilizer Use, Risk, and Off-Farm Labor Markets in the Semi-Arid Tropics of
India. Department of Agricultural and Resource Economics Report No. 23, North Carolina State
University, July 2001.
Lass, D.A. and C.M. Gempesaw. "The Supply of Off-Farm Labor: A Random Coefficients
Approach." American Journal of Agricultural Economics 74(1992):400-11.
Mishra, A.K. and B.K. Goodwin. “Farm income Variability and the Off-Farm Labor Supply
of Farmers and Their Spouses.” American Journal of Agricultural Economics 79(1997):880-7.
15
Newman, J.L. and P.J. Gertler. “Family Productivity, Labor Supply, and Welfare in a Low
Income Country.” Journal of Human Resources 29(Fall 1994):989-1026.
Shishko, R. and B. Rostker. "The Economics of Multiple Job Holding." American Economic
Review 66(1976):298-308.
State of Israel, Central Bureau of Statistics. Agricultural Survey 1995, Publication No. 1081,
Jerusalem, 1998.
Sumner, D.A. "The Off-Farm Labor Supply of Farmers." American Journal of Agricultural
Economics 64(1982):499-509.
Tokle, J.G. and W.E. Huffman. "Local Economic Conditions and Wage Labor Decisions of
Farm and Rural Nonfarm Couples." American Journal of Agricultural Economics
73(1991):652-70.

16
Table 1. Definitions of Variables
Variable _____________________
Definition __________________________________________________
WORKS OFF FARM Works off the farm or in on-farm non-agricultural activities AGE Age in years BORN IN ISRAEL Dummy for being born in Israel ASIA/AFRICA ORIGIN Respondent or his/her father being born in Asia or Africa HIGH SCHOOL High school graduation being the highest level of education HIGHER EDUCATION Educational levels higher than high school graduation AGRIC. EDUCATION Having some level of agricultural education OFF-FARM WAGE Predicted off-farm monthly income (1000 NIS) PRIVATE Dummy for private-Jewish localities ARAB Dummy for private-Arab localities NORTH Dummy for localities in the north SOUTH Dummy for localities in the south ADOLESCENTS Number of persons 15-21 years of age in the household CHILDREN Number of persons under 15 years of age in the household GROUP 2 The couple has one adult child (at least 22 years of age) GROUP 2 The couple has two adult children (or a child and spouse) GROUP 2 The couple has more than two children or spouses TENURE Years since obtaining the farm SUCCEEDED Operator received the farm by succession PURCHASED Operator received the farm by purchase SPECIALIZED One branch accounts for at least 90% of farm value added DIVERSIFIED An active farm that is not specialized LAND Size of permanently held farm land (dunam=1/4 acre) CAPITAL Value of buildings, machinery, equipment, and livestock FLOWERS Farm engages in cultivation of flowers POULTRY Farm engages in poultry production FIELD CROPS Farm engages in cultivation of field crops or vegetables CATTLE Farm engages in raising beef or dairy cattle CATTLE PROFIT Profitability index in cattle FRUITS PROFIT Profitability index in fruits FLOWERS PROFIT Profitability index in flowers VEGETABLE PROFIT Profitability index in vegetables and field crops POULTRY PROFIT Profitability index in poultry
17
Table 2. Descriptive Statistics
Variable All Group 1 Group 2 Group 3 Group 4 ---------------------------------- ----------- ----------- ----------- ----------- ----------- Male Operator or Spouse WORKS ON FARM 0.68 0.63 0.70 0.75 0.79 WORKS OFF FARM 0.55 0.60 0.55 0.46 0.35 AGE 52.85 48.92 56.86 58.88 59.81 BORN IN ISRAEL 0.57 0.67 0.44 0.43 0.39 ASIA/AFRICA ORIGIN 0.23 0.28 0.19 0.18 0.07 HIGH SCHOOL 0.49 0.49 0.51 0.54 0.42 HIGHER EDUCATION 0.14 0.13 0.16 0.12 0.17 AGRICULTURAL EDUCATION 0.07 0.07 0.10 0.05 0.06 OFF-FARM WAGE 4.85 5.14 4.52 4.62 4.00
Female Operator or Spouse WORKS ON FARM 0.39 0.26 0.34 0.31 0.33 WORKS OFF FARM 0.46 0.51 0.44 0.45 0.24 AGE 48.79 44.78 52.46 55.00 56.41 BORN IN ISRAEL 0.60 0.70 0.52 0.45 0.42 ASIA/AFRICA ORIGIN 0.27 0.29 0.27 0.27 0.14 HIGH SCHOOL 0.48 0.49 0.48 0.47 0.43 HIGHER EDUCATION 0.13 0.14 0.13 0.11 0.13 AGRICULTURAL EDUCATION 0.05 0.05 0.04 0.05 0.07 OFF-FARM WAGE 2.45 2.57 2.37 2.37 2.07
Oldest Adult Child or Spouse WORKS ON FARM 0.24 0.23 0.22 0.29 WORKS OFF FARM 0.69 0.64 0.73 0.72 MALE 0.69 0.64 0.71 0.72 AGE 28.88 25.79 29.52 32.72 BORN IN ISRAEL 0.95 0.96 0.93 0.95 ASIA/AFRICA ORIGIN 0.39 0.41 0.36 0.42 HIGH SCHOOL 0.53 0.48 0.55 0.57 HIGHER EDUCATIO 0.16 0.15 0.18 0.13 AGRICULTURAL EDUCATION 0.05 0.05 0.05 0.06 OFF-FARM WAGE 3.46 3.08 3.79 3.46
Continued on next page

18
Table 2. (continued)
Variable All Group 1 Group 2 Group 3 Group 4 -------------------------- ----------- ----------- ----------- ----------- ----------- Family, Operator, and Farm PRIVATE 0.08 0.09 0.08 0.07 0.03 ARAB 0.20 0.21 0.17 0.16 0.27 NORTH 0.29 0.29 0.36 0.26 0.27 SOUTH 0.24 0.27 0.23 0.16 0.18 ADOLESCENTS 0.80 0.75 1.03 0.90 0.64 CHILDREN 1.50 1.89 0.68 1.05 1.31 TENURE 28.5 26.1 29.0 33.1 34.4 SUCCEEDED 0.31 0.31 0.28 0.29 0.34 PURCHASED 0.28 0.31 0.27 0.22 0.19 SPECIALIZED 0.49 0.50 0.44 0.47 0.54 DIVERSIFIED 0.25 0.21 0.31 0.31 0.27 LAND 29.8 29.3 31.6 29.0 30.6 CAPITAL 100 90 101 123 116 FLOWERS 0.09 0.10 0.08 0.13 0.05 POULTRY 0.16 0.13 0.20 0.23 0.20 FIELD CROPS 0.27 0.24 0.28 0.28 0.39 CATTLE 0.08 0.09 0.06 0.06 0.08 CATTLE PROFITABILITY 0.11 0.11 0.10 0.12 0.14 FRUITS PROFITABILITY 0.46 0.42 0.53 0.52 0.44 FLOWERS PROFITABILITY 0.10 0.10 0.08 0.13 0.04 VEGETABLE PROFITABILITY 0.29 0.27 0.42 0.22 0.28 POULTRY PROFITABILITY 0.13 0.11 0.16 0.16 0.12 OBSERVATIONS 1949 1052 344 328 225
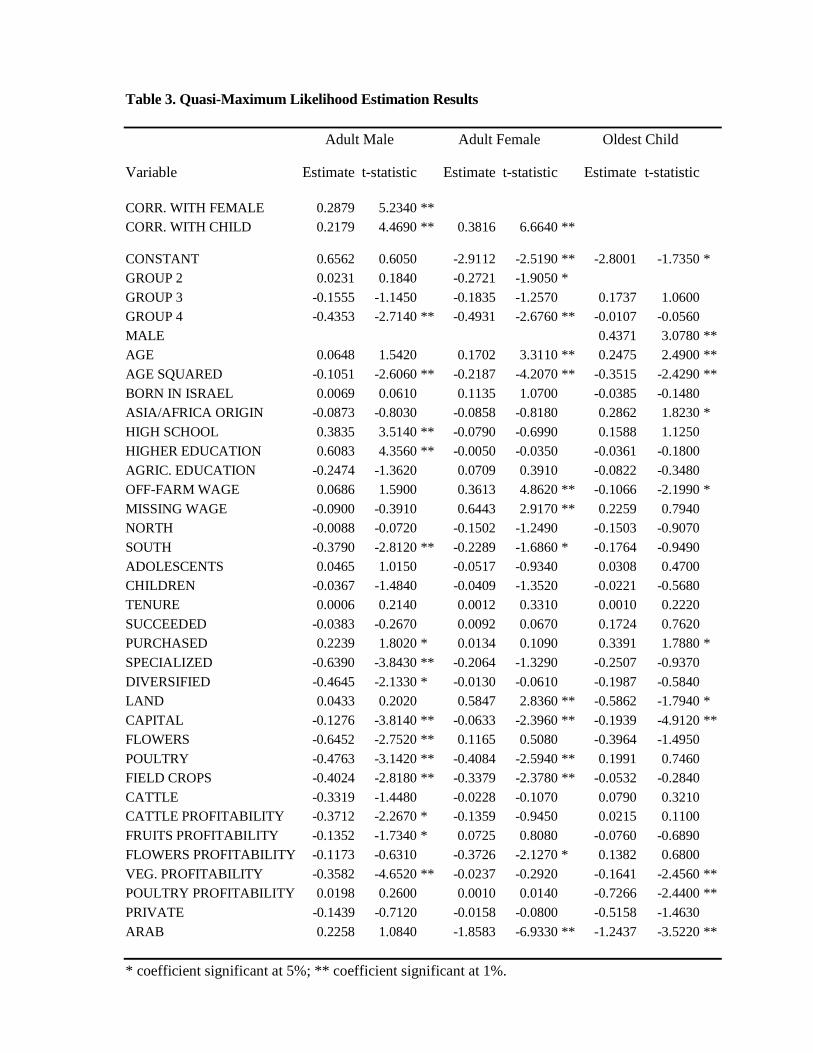
Table 3. Quasi-Maximum Likelihood Estimation Results
Adult Male Adult Female Oldest Child
Variable Estimate t-statistic Estimate t-statistic Estimate t-statistic
CORR. WITH FEMALE 0.2879 5.2340 ** CORR. WITH CHILD 0.2179 4.4690 ** 0.3816 6.6640 ** CONSTANT 0.6562 0.6050 -2.9112 -2.5190 ** -2.8001 -1.7350 * GROUP 2 0.0231 0.1840 -0.2721 -1.9050 * GROUP 3 -0.1555 -1.1450 -0.1835 -1.2570 0.1737 1.0600 GROUP 4 -0.4353 -2.7140 ** -0.4931 -2.6760 ** -0.0107 -0.0560 MALE 0.4371 3.0780 ** AGE 0.0648 1.5420 0.1702 3.3110 ** 0.2475 2.4900 ** AGE SQUARED -0.1051 -2.6060 ** -0.2187 -4.2070 ** -0.3515 -2.4290 ** BORN IN ISRAEL 0.0069 0.0610 0.1135 1.0700 -0.0385 -0.1480 ASIA/AFRICA ORIGIN -0.0873 -0.8030 -0.0858 -0.8180 0.2862 1.8230 * HIGH SCHOOL 0.3835 3.5140 ** -0.0790 -0.6990 0.1588 1.1250 HIGHER EDUCATION 0.6083 4.3560 ** -0.0050 -0.0350 -0.0361 -0.1800 AGRIC. EDUCATION -0.2474 -1.3620 0.0709 0.3910 -0.0822 -0.3480 OFF-FARM WAGE 0.0686 1.5900 0.3613 4.8620 ** -0.1066 -2.1990 * MISSING WAGE -0.0900 -0.3910 0.6443 2.9170 ** 0.2259 0.7940 NORTH -0.0088 -0.0720 -0.1502 -1.2490 -0.1503 -0.9070 SOUTH -0.3790 -2.8120 ** -0.2289 -1.6860 * -0.1764 -0.9490 ADOLESCENTS 0.0465 1.0150 -0.0517 -0.9340 0.0308 0.4700 CHILDREN -0.0367 -1.4840 -0.0409 -1.3520 -0.0221 -0.5680 TENURE 0.0006 0.2140 0.0012 0.3310 0.0010 0.2220 SUCCEEDED -0.0383 -0.2670 0.0092 0.0670 0.1724 0.7620 PURCHASED 0.2239 1.8020 * 0.0134 0.1090 0.3391 1.7880 * SPECIALIZED -0.6390 -3.8430 ** -0.2064 -1.3290 -0.2507 -0.9370 DIVERSIFIED -0.4645 -2.1330 * -0.0130 -0.0610 -0.1987 -0.5840 LAND 0.0433 0.2020 0.5847 2.8360 ** -0.5862 -1.7940 * CAPITAL -0.1276 -3.8140 ** -0.0633 -2.3960 ** -0.1939 -4.9120 ** FLOWERS -0.6452 -2.7520 ** 0.1165 0.5080 -0.3964 -1.4950 POULTRY -0.4763 -3.1420 ** -0.4084 -2.5940 ** 0.1991 0.7460 FIELD CROPS -0.4024 -2.8180 ** -0.3379 -2.3780 ** -0.0532 -0.2840 CATTLE -0.3319 -1.4480 -0.0228 -0.1070 0.0790 0.3210 CATTLE PROFITABILITY -0.3712 -2.2670 * -0.1359 -0.9450 0.0215 0.1100 FRUITS PROFITABILITY -0.1352 -1.7340 * 0.0725 0.8080 -0.0760 -0.6890 FLOWERS PROFITABILITY -0.1173 -0.6310 -0.3726 -2.1270 * 0.1382 0.6800 VEG. PROFITABILITY -0.3582 -4.6520 ** -0.0237 -0.2920 -0.1641 -2.4560 ** POULTRY PROFITABILITY 0.0198 0.2600 0.0010 0.0140 -0.7266 -2.4400 ** PRIVATE -0.1439 -0.7120 -0.0158 -0.0800 -0.5158 -1.4630 ARAB 0.2258 1.0840 -1.8583 -6.9330 ** -1.2437 -3.5220 **
* coefficient significant at 5%; ** coefficient significant at 1%.
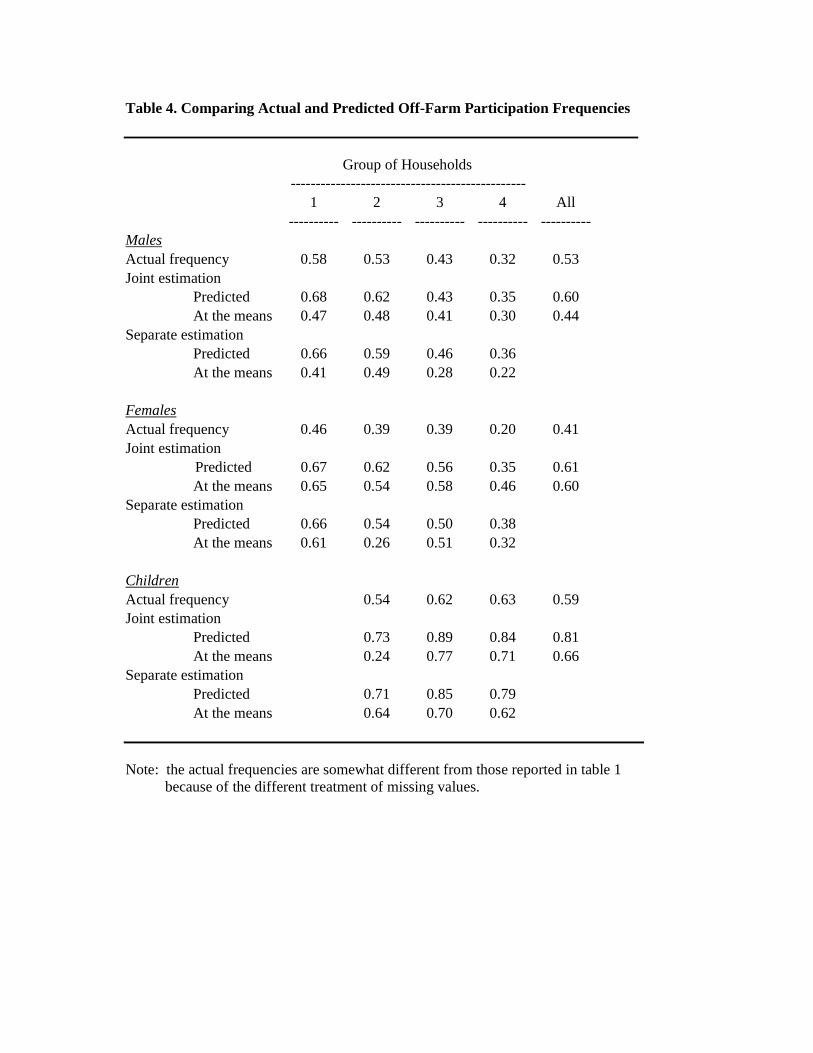
Table 4. Comparing Actual and Predicted Off-Farm Participation Frequencies
Group of Households ----------------------------------------------- 1 2 3 4 All ---------- ---------- ---------- ---------- ----------
Males Actual frequency 0.58 0.53 0.43 0.32 0.53 Joint estimation Predicted 0.68 0.62 0.43 0.35 0.60 At the means 0.47 0.48 0.41 0.30 0.44 Separate estimation Predicted 0.66 0.59 0.46 0.36 At the means 0.41 0.49 0.28 0.22
Females Actual frequency 0.46 0.39 0.39 0.20 0.41 Joint estimation Predicted 0.67 0.62 0.56 0.35 0.61 At the means 0.65 0.54 0.58 0.46 0.60 Separate estimation Predicted 0.66 0.54 0.50 0.38 At the means 0.61 0.26 0.51 0.32
Children Actual frequency 0.54 0.62 0.63 0.59 Joint estimation Predicted 0.73 0.89 0.84 0.81 At the means 0.24 0.77 0.71 0.66 Separate estimation Predicted 0.71 0.85 0.79 At the means 0.64 0.70 0.62
Note: the actual frequencies are somewhat different from those reported in table 1 because of the different treatment of missing values.

21
Table 5. Selected Additional Results
Adult Male Adult Female Oldest Child ----------------------- ----------------------- -----------------------
Variable Estimate t-statistic Estimate t-statistic Estimate t-statistic ----------------------------- ---------- ----------- ---------- ----------- ---------- ----------- Multiple consumption units GROUP 2 0.5449 0.963 -0.0503 -0.089 GROUP 3 -0.1895 -0.859 -0.0097 -0.040 0.2435 1.090 GROUP 4 -0.1185 -0.514 -0.3121 -1.321 0.2760 1.150 Single consumption unit GROUP 2 0.0016 0.013 -0.2825 -1.956 * GROUP 3 -0.1353 -0.870 -0.2559 -1.571 0.1735 0.987 GROUP 4 -0.6363 -3.196 ** -0.6754 -2.579 ** -0.1640 -0.754 Active farm GROUP 2 -0.0360 -0.261 -0.3356 -2.177 * GROUP 3 -0.1609 -1.074 -0.1604 -1.000 0.1770 1.079 GROUP 4 -0.4459 -2.608 ** -0.5876 -3.024 ** -0.0105 -0.055 Inactive farm GROUP 2 0.3513 1.162 -0.0924 -0.316 GROUP 3 -0.1331 -0.452 -0.2777 -0.980 0.1770 1.079 GROUP 4 -0.3852 -0.978 -0.2031 -0.491 -0.0105 -0.055
* coefficient significant at 5%. ** coefficient significant at 1%. Note: The group coefficients in the children’s equations were forced to be independent of farm inactivity, otherwise the model run into convergence problems.

22
Notes 1 Hundley extends this argument to self-employed families in general. Butler and Horowitz found no difference in labor participation rates in nuclear and extended households. Gong and van Soest found that the existence of other adult females increases the labor supply of mothers with young children. The interdependence of labor decisions of different household members is also supported by the results of Newman and Gertler. 2 Kimhi (1998) provides a detailed description of the historical institutional structure of Moshavim. However, by 1995 most Moshavim had very little cooperation left. 3 The agricultural education dummy is independent of the educational level dummies, in the sense that, for example, finishing agricultural high school qualifies for both the first and the third dummies. 4 We also estimated the model excluding the observations with missing wages, and the results did not change qualitatively. 5 It is important to note that the number of adult children include only those who are currently residing on the farm, either as part of the parents’ household or as a separate “succeeding” household, hence it has nothing to do with the number of children the parents ever had. 6 In specialized farms, one branch accounts for at least 90% of total value added. Diversified farms include all other farms with positive production. The excluded group are inactive farms. Value added is “normative”, meaning that it was calculated using weights attached to physical measures of production, such as size of crop areas and number of animals. 7 This could be larger or smaller to the size of land that is actually operated. This variable could easily be thought of as exogenous or at least predetermined (Kimhi, 1998). 8 The use of capital stock as an explanatory variable could be problematic, due to possible endogeneity (Ahituv and Kimhi). We examined the sensitivity of the results to this problem by using the 1981 capital stock instead. The results did not change qualitatively. 9 Although a farm could have production in more than one branch, we exclude the dummy for fruits in order to avoid collinearity with the specialization dummies through the inactive farms. 10 This index measures the value added in this branch relative to the mean value added of all farms in the branch. Since the value added is normative, a higher profitability index basically means that within the branch, this farm is growing crops that have relatively high value added. 11 We do not show the statistics for adult children other than the oldest, since they were not included in the estimated model, as will be explained below. 12 The Gauss code for estimating this model is available from the author upon request. The procedure accounts for the different probability weights attached to different households, and for missing values. 13 It should be emphasized that when data were missing for an individual we excluded that individual only, not the whole household. 14 We only list the coefficients of the group dummies. Full results are available from the author upon request.