f&g 2q 2021 financial supplement ex. 99.2 (1)
TRANSCRIPT

Exhibit 99.2
F&G Annuities & Life, Inc. (“F&G”) - An Operating Segment of Fidelity National Financial, Inc. (NYSE:FNF) Financial Supplement June 30, 2021(Year Ended December 31)
The financial statements and financial exhibits included herein are unaudited. F&G is an operating segment of FNF (the Company) and these financial statements and exhibits should be read in conjunction with the Company's periodic reports on Form 10-K, Form 10-Q and Form 8-K.
F&G (formerly NYSE:FG) was acquired by FNF (the "Business Combination") on June 1, 2020 ("Closing Date"). As a result of the Business Combination, F&G delisted from the NYSE and became a subsidiary of FNF. Our financial statement presentation includes the financial statements of F&G and its subsidiaries as a standalone entity ("Pre-Merger") for the periods prior to the completion of the Business Combination, and F&G and its subsidiaries as an operating segment of FNF ("Post-Merger") for periods from and after the Closing Date.
All dollar amounts are presented in millions.
Non-GAAP Financial Measures
This document contains certain non-GAAP financial measures commonly used in our industry that, together with the relevant GAAP measures, may enhance a user’s ability to analyze the Company's operating performance and capital position for the periods presented. These measures should be considered supplementary to our results in accordance with GAAP and should not be viewed as a substitute for the GAAP measures and are not intended to replace GAAP financial results. Our non-GAAP measures may not be comparable to similarly titled measures of other organizations because other organizations may not calculate such non-GAAP measures in the same manner. Refer to the non-GAAP measures reconciliations and definitions within for further information.
1

PageA. Financial Highlights
Consolidated Financial Highlights . . . . . . . . . . . . . . . . . . . . . . . . . . . . . . . . . . . . . . . . . . . . . . . . . . . . . . . . . . . . . . . . . . . . . . . . . . . . . . . . . . . . . . . . . . . . . . . . 3Sales Results by Product . . . . . . . . . . . . . . . . . . . . . . . . . . . . . . . . . . . . . . . . . . . . . . . . . . . . . . . . . . . . . . . . . . . . . . . . . . . . . . . . . . . . . . . . . . . . . . . . . . . . . . . . 3Appendix to Consolidated Financial Highlights . . . . . . . . . . . . . . . . . . . . . . . . . . . . . . . . . . . . . . . . . . . . . . . . . . . . . . . . . . . . . . . . . . . . . . . . . . . . . . . . . . . . . . 4Condensed Consolidated Balance Sheets . . . . . . . . . . . . . . . . . . . . . . . . . . . . . . . . . . . . . . . . . . . . . . . . . . . . . . . . . . . . . . . . . . . . . . . . . . . . . . . . . . . . . . . . . . . 5Reconciliation of Total Shareholders' Equity to Total Shareholders' Equity Excluding AOCI . . . . . . . . . . . . . . . . . . . . . . . . . . . . . . . . . . . . . . . . . . . . . . . . . . 6Condensed Consolidated Statements of Operations . . . . . . . . . . . . . . . . . . . . . . . . . . . . . . . . . . . . . . . . . . . . . . . . . . . . . . . . . . . . . . . . . . . . . . . . . . . . . . . . . . . 7Reconciliation from Net Earnings (Loss) to Adjusted Net Earnings . . . . . . . . . . . . . . . . . . . . . . . . . . . . . . . . . . . . . . . . . . . . . . . . . . . . . . . . . . . . . . . . . . . . . . 8Notable Items . . . . . . . . . . . . . . . . . . . . . . . . . . . . . . . . . . . . . . . . . . . . . . . . . . . . . . . . . . . . . . . . . . . . . . . . . . . . . . . . . . . . . . . . . . . . . . . . . . . . . . . . . . . . . . . . . 8Adjusted Net Earnings Statement . . . . . . . . . . . . . . . . . . . . . . . . . . . . . . . . . . . . . . . . . . . . . . . . . . . . . . . . . . . . . . . . . . . . . . . . . . . . . . . . . . . . . . . . . . . . . . . . . 9Financial Strength Ratings . . . . . . . . . . . . . . . . . . . . . . . . . . . . . . . . . . . . . . . . . . . . . . . . . . . . . . . . . . . . . . . . . . . . . . . . . . . . . . . . . . . . . . . . . . . . . . . . . . . . . . 10Total Product Net Investment Spread . . . . . . . . . . . . . . . . . . . . . . . . . . . . . . . . . . . . . . . . . . . . . . . . . . . . . . . . . . . . . . . . . . . . . . . . . . . . . . . . . . . . . . . . . . . . . . 11FIA Net Investment Spread . . . . . . . . . . . . . . . . . . . . . . . . . . . . . . . . . . . . . . . . . . . . . . . . . . . . . . . . . . . . . . . . . . . . . . . . . . . . . . . . . . . . . . . . . . . . . . . . . . . . . . 12
B. Product Summary Average Assets Under Management Rollforward . . . . . . . . . . . . . . . . . . . . . . . . . . . . . . . . . . . . . . . . . . . . . . . . . . . . . . . . . . . . . . . . . . . . . . . . . . . . . . . . . . . . . 13Annuity Account Balance Rollforward . . . . . . . . . . . . . . . . . . . . . . . . . . . . . . . . . . . . . . . . . . . . . . . . . . . . . . . . . . . . . . . . . . . . . . . . . . . . . . . . . . . . . . . . . . . . . 13Annuity Liability Characteristics . . . . . . . . . . . . . . . . . . . . . . . . . . . . . . . . . . . . . . . . . . . . . . . . . . . . . . . . . . . . . . . . . . . . . . . . . . . . . . . . . . . . . . . . . . . . . . . . . 14
C. Investment Summary Summary of Invested Assets by Asset Class . . . . . . . . . . . . . . . . . . . . . . . . . . . . . . . . . . . . . . . . . . . . . . . . . . . . . . . . . . . . . . . . . . . . . . . . . . . . . . . . . . . . . . . . . 15Credit Quality of Fixed Maturity Securities . . . . . . . . . . . . . . . . . . . . . . . . . . . . . . . . . . . . . . . . . . . . . . . . . . . . . . . . . . . . . . . . . . . . . . . . . . . . . . . . . . . . . . . . . 16Summary of Residential Mortgage Backed Securities by Collateral Type and NAIC Designation . . . . . . . . . . . . . . . . . . . . . . . . . . . . . . . . . . . . . . . . . . . . . . . 17
D. Counterparty RiskTop 5 Reinsurers . . . . . . . . . . . . . . . . . . . . . . . . . . . . . . . . . . . . . . . . . . . . . . . . . . . . . . . . . . . . . . . . . . . . . . . . . . . . . . . . . . . . . . . . . . . . . . . . . . . . . . . . . . . . . . 17
E. Non-GAAP Financial Measures Definitions 18
F&G - An Operating Segment of FNFFinancial Supplement - June 30, 2021(All periods are unaudited)
2

Consolidated Financial Highlights
Three months endedOne month
endedTwo months
endedSix months
ended
June 30, 2021March 31,
2021December 31, 2020
September 30, 2020 June 30, 2020 May 31, 2020 June 30, 2021
Post-Merger Post-Merger Post-Merger Post-Merger Post-Merger Pre-Merger Post-Merger
Select Income Statement Data:Net earnings (loss) attributable to common shareholders 82 289 137 38 (39) 19 371
Adjusted net earnings from continuing operations attributable to common shareholders (1) 92 78 128 74 33 40 170
Select Metrics:
Average Assets Under Management ("AAUM") (1) 30,423 29,016 27,864 26,990 26,582 29,285 29,722
Net investment spread (1) 2.95 % 2.55 % 2.55 % 2.62 % 3.50 % 1.92 % 2.75 %
(1) Refer to "Non-GAAP Financial Measures Definitions"
Sales Results by Product
The table below provides a summary of sales, which are not affected by the June 1, 2020 Business Combination, and are comparable to prior period data.
Three months ended Six months ended
June 30, 2021March 31,
2021December 31, 2020
September 30, 2020 June 30, 2020 June 30, 2021 June 30, 2020
SalesFixed indexed annuities (FIA) 1,135 1,047 947 815 866 2,182 1,697 Fixed rate annuities (MYGA) 512 467 362 253 47 979 161 Total annuity 1,647 1,514 1,309 1,068 913 3,161 1,858 Index universal life (IUL) 20 15 13 14 12 35 23 Funding agreements (FABN/FHLB) 1,000 125 100 — — 1,125 100 Flow reinsurance — — 37 51 142 — 264 Total Sales $ 2,667 $ 1,654 $ 1,459 $ 1,133 $ 1,067 $ 4,321 $ 2,245
F&G - An Operating Segment of FNFFinancial Supplement - June 30, 2021(All periods are unaudited)
3

Appendix to Consolidated Financial HighlightsEffective June 1, 2020, certain blocks of business were designated as discontinued operations by FNF. Amounts related to these blocks of business are presented herein as adjustments to key financial metrics, solely for comparison between Pre-Merger and Post-Merger periods. See FNF 10-K/ 10-Q for further discussion on discontinued operations.
Three months endedOne month
ended Two months ended
Six months ended
June 30, 2021March 31,
2021December 31, 2020
September 30, 2020 June 30, 2020 May 31, 2020 June 30, 2021
Post-Merger Post-Merger Post-Merger Post-Merger Post-Merger Pre-Merger Post-Merger
Select Income Statement Data:
Net earnings (loss) attributable to common shareholders 82 289 137 38 (39) 19 371 Less: discontinued operations [(earnings)/loss] (6) (5) 2 28 (5) (22) (11)
As adjusted for discontinued operations 76 284 139 66 (44) (3) 360
Adjusted net earnings from continuing operations attributable to common shareholders (1) 92 78 128 74 33 40 170 Less: discontinued operations [(earnings)/loss] — — — — — 8 —
As adjusted for discontinued operations 92 78 128 74 33 48 170
Less: Notable items [(unfavorable)/favorable] (2) 22 12 68 10 8 5 34
As adjusted for discontinued operations and notable items $ 70 $ 66 $ 60 $ 64 $ 25 $ 43 $ 136
Select Metrics:
AAUM (1) 30,423 29,016 27,864 26,990 26,582 29,285 29,722 Less: discontinued operations — — — — — (2,236) —
As adjusted for discontinued operations 30,423 29,016 27,864 26,990 26,582 27,049 29,722
Net investment spread (1) 2.95 % 2.55 % 2.55 % 2.62 % 3.50 % 1.92 % 2.75 %
Less: discontinued operations [(earnings)/loss] (3) — % — % — % — % — % 0.13 % — %As adjusted for discontinued operations 2.95 % 2.55 % 2.55 % 2.62 % 3.50 % 2.05 % 2.75 %(1) Refer to "Non-GAAP Financial Measures Definitions" (2) Notable items from continuing operations. For full list of notable items, refer to page 8 "Notable Items"(3) Subsequent to the release of the Quarterly Financial Supplement dated August 4, 2020, management identified an immaterial adjustment that was needed to reflect the correct amount in the prior period. The period affected was the two months ended May 31, 2020
F&G - An Operating Segment of FNFFinancial Supplement - June 30, 2021(All periods are unaudited)
4

Condensed Consolidated Balance Sheets
June 30, 2021March 31,
2021December 31, 2020
September 30, 2020
June 30, 2020
Post-Merger Post-Merger Post-Merger Post-Merger Post-MergerAssetsInvestments:
Fixed maturity securities available for sale, at fair value, net of allowance for credit losses of $7 at June 30, 2021 $ 27,616 $ 25,768 $ 25,499 $ 24,218 $ 23,014 Preferred securities, at fair value 882 908 965 917 875 Equity securities, at fair value 176 141 82 54 54 Derivative investments 691 542 548 381 333 Mortgage loans, net of allowance for credit losses of $34 at June 30, 2021 2,794 2,374 2,031 1,614 1,749 Investments in unconsolidated affiliates (a) 1,667 1,281 1,156 1,125 1,045 Other long-term investments 448 447 449 438 432 Short-term investments 356 72 456 34 38
Total investments $ 34,630 $ 31,533 $ 31,186 $ 28,781 $ 27,540 Cash and cash equivalents 1,016 995 889 1,014 909 Trade and notes receivables 11 11 10 2 2 Reinsurance recoverable, net of allowance for credit losses of $20 at June 30, 2021 (a) 3,297 3,404 3,174 3,152 3,182 Goodwill (a) 1,756 1,751 1,751 1,731 1,725 Prepaid expenses and other assets 415 470 413 448 381 Lease assets 8 8 8 7 8 Other intangible assets, net (a) 2,060 2,061 1,918 1,956 2,060 Property and equipment, net 13 13 11 7 2 Income taxes receivable — — 15 19 24 Deferred tax asset (a) 51 130 44 107 180 Assets of discontinued operations — 311 327 2,618 2,502
Total assets $ 43,257 $ 40,687 $ 39,746 $ 39,842 $ 38,515
(a) These line items included adjustments that were recorded during the remeasurement period subsequent to the June 1, 2020 acquisition. The following adjustments were recorded as of the opening balance sheet at June 1, 2020 during the quarter ending September 30, 2020: Investment in unconsolidated affiliates, $31, Goodwill, $6, Other intangible assets, net, ($37), and Deferred tax asset, $3. The following adjustments were recorded as of the opening balance sheet at June 1, 2020 during the quarter ending December 31, 2020: Goodwill, $20, Other intangible assets, net, ($56), Reinsurance recoverable, $47, and Deferred tax asset, $10. The following adjustments were recorded as of the opening balance sheet at June 1, 2020 during the quarter ending June 30, 2021: Reinsurance recoverable, ($289), Goodwill, $5, Other intangible assets, net, $61, and Deferred tax asset, $1.
F&G - An Operating Segment of FNFFinancial Supplement - June 30, 2021(All periods are unaudited)
5

Condensed Consolidated Balance Sheets (continued)
June 30, 2021March 31,
2021December 31, 2020
September 30, 2020
June 30, 2020
Post-Merger Post-Merger Post-Merger Post-Merger Post-MergerLiabilities and Shareholders' EquityContractholder funds (a) $ 32,166 $ 29,592 $ 28,718 $ 27,488 $ 26,628 Future policy benefits (a) 3,670 3,959 4,010 4,048 4,092 Accounts payable and accrued liabilities (a) 1,276 1,368 1,174 1,056 983 Income taxes payable 17 5 — — — Notes payable 589 589 589 589 589 Funds withheld for reinsurance liabilities 1,271 1,026 806 814 817 Lease liabilities 14 14 14 12 13 Liabilities of discontinued operations — 339 361 2,462 2,347
Total liabilities $ 39,003 $ 36,892 $ 35,672 $ 36,469 $ 35,469
Shareholders' equity:Additional paid-in-capital 2,746 2,744 2,741 2,739 2,737 Retained earnings (accumulated deficit) 507 425 136 (1) (39) Accumulated other comprehensive income (loss) 1,001 626 1,197 635 348
Total shareholders' equity $ 4,254 $ 3,795 $ 4,074 $ 3,373 $ 3,046 Total liabilities and shareholders' equity $ 43,257 $ 40,687 $ 39,746 $ 39,842 $ 38,515
(a) Contractholder funds included a $3 adjustment that was recorded as of the opening balance sheet at June 1, 2020 during the quarter ending September 30, 2020; Contractholder funds, Future policy benefits, and Accounts payable and accrued liabilities included ($5), ($7), and $33 adjustments as of the opening balance sheet at June 1, 2020, respectively, during the quarter ending December 31, 2020; Additionally, Future policy benefits and Accounts payable and accrued liabilities included ($228) and $6 adjustments as of the opening balance sheet at June 1, 2020, respectively, during the quarter ending June 30, 2021
Reconciliation of Total Shareholders' Equity to Total Shareholders' Equity Excluding AOCI
June 30, 2021March 31,
2021December 31, 2020
September 30, 2020
June 30, 2020
Post-Merger Post-Merger Post-Merger Post-Merger Post-MergerTotal shareholders' equity $ 4,254 $ 3,795 $ 4,074 $ 3,373 $ 3,046 AOCI 1,001 626 1,197 635 348 Total shareholders' equity excluding AOCI (1) $ 3,253 $ 3,169 $ 2,877 $ 2,738 $ 2,698 (1) Refer to "Non-GAAP Financial Measures Definitions"
F&G - An Operating Segment of FNFFinancial Supplement - June 30, 2021(All periods are unaudited)
6

Condensed Consolidated Statements of Operations
Three months ended One month ended
Two months ended
Six months ended
June 30, 2021March 31,
2021December 31, 2020
September 30, 2020 June 30, 2020 May 31, 2020 June 30, 2021
Post-Merger Post-Merger Post-Merger Post-Merger Post-Merger Pre-Merger Post-MergerRevenues:
Life insurance premiums and other fees (a) $ 62 $ 64 $ 58 $ 60 $ 20 $ 52 $ 126 Interest and investment income 487 373 327 305 111 111 860 Recognized gains and losses, net 253 102 282 77 (7) 257 355
Total revenues 802 539 667 442 124 420 1,341 Benefits and expenses:
Benefits and other changes in policy reserves 575 (26) 460 251 155 356 549 Personnel costs 32 29 33 23 9 15 61 Other operating expenses 26 28 30 33 12 40 54 Depreciation and amortization 65 144 64 56 3 1 209 Interest expense 7 8 8 7 3 5 15
Total benefits and expenses 705 183 595 370 182 417 888
Pre-tax earnings (loss) from continuing operations 97 356 72 72 (58) 3 453 Income tax expense (21) (72) 67 (6) 14 16 (93)
Net earnings (loss) from continuing operations 76 284 139 66 (44) 19 360 Earnings from discontinued operations, net of tax 6 5 (2) (28) 5 — 11
Net earnings (loss) attributable to common shareholders $ 82 $ 289 $ 137 $ 38 $ (39) $ 19 $ 371
(a) Included within "Escrow, title-related and other fees" in FNF 10-K/ 10-Q
F&G - An Operating Segment of FNFFinancial Supplement - June 30, 2021(All periods are unaudited)
7

Reconciliation from Net Earnings (Loss) to Adjusted Net Earnings (1)
Three Months EndedOne month
endedTwo months
endedSix months
ended
June 30, 2021March 31,
2021December 31, 2020
September 30, 2020 June 30, 2020 May 31, 2020 June 30, 2021
Post-Merger Post-Merger Post-Merger Post-Merger Post-Merger Pre-Merger Post-MergerNet earnings (loss) from continuing operations $ 76 $ 284 $ 139 $ 66 $ (44) $ 19 $ 360 Non-GAAP adjustments (1):Recognized (gains) and losses, net (63) (82) (76) (15) 46 68 (145) Indexed product related derivatives 75 (185) 54 14 43 (28) (110) Purchase price amortization 6 7 7 7 2 — 13 Transaction costs and other non-recurring items 2 2 4 10 7 4 4 Income taxes on non-GAAP adjustments (4) 52 — (8) (21) (23) 48 Adjusted net earnings from continuing operations attributable to common shareholders (1) $ 92 $ 78 $ 128 $ 74 $ 33 $ 40 $ 170
Notable ItemsEach quarterly reporting period, we identify notable items that help explain the trends in our Net earnings (loss) from continuing operations attributable to common shareholders and Adjusted net earnings (loss) from continuing operations attributable to common shareholders as we believe these items provide further clarity to the financial performance of the business.
Three Months EndedOne month
endedTwo months
endedSix months
ended
June 30, 2021March 31,
2021December 31, 2020
September 30, 2020 June 30, 2020 May 31, 2020 June 30, 2021
Post-Merger Post-Merger Post-Merger Post-Merger Post-Merger Pre-Merger Post-MergerAdjusted net earnings from continuing operations attributable to common shareholders (1) $ 92 $ 78 $ 128 $ 74 $ 33 $ 40 $ 170
Notable items [(unfavorable)/favorable]
Single premium immediate annuities ("SPIA") mortality & other reserve adjustments (a) 3 7 — 10 4 6 10 Assumption review and unlocking (b) 8 — — — — (4) 8 Other notable items (c) 11 5 68 — 4 3 16
(1) Refer to "Non-GAAP Financial Measures Definitions"(a) The release of annuity reserves associated with mortality of annuitants, which varies due to timing, volume and severity of experience, and other reserve adjustments. (b) Reflects unlocking from updating our DAC, VOBA, DSI and cost of reinsurance amortization models for actual experience and equity market fluctuations.(c) Costs incurred during research and exploration of potential merger or acquisition of a business or a group of insurance policies via asset acquisition or (inforce) reinsurance agreement, bond prepayment income, changes in tax valuation, and other net activity.
F&G - An Operating Segment of FNFFinancial Supplement - June 30, 2021(All periods are unaudited)
8

Adjusted Net Earnings Statement (1)
Three Months EndedOne month
endedTwo months
endedSix months
ended
June 30, 2021March 31,
2021December 31, 2020
September 30, 2020 June 30, 2020
May 31, 2020
June 30, 2021
Post-Merger Post-Merger Post-Merger Post-Merger Post-Merger Pre-Merger Post-MergerRevenues:
Life insurance premiums and other fees (a) $ 62 $ 64 $ 61 $ 60 $ 20 $ 42 $ 126 Interest and investment income (b) 377 333 315 314 120 200 710 Recognized gains and losses, net (c) — — — (1) 1 22 —
Total revenues 439 397 376 373 141 264 836 Benefits and expenses:
Benefits and other changes in policy reserves (d) 214 188 202 177 62 131 402 Personnel costs 32 29 33 23 9 15 61 Other operating expenses (e) 24 26 25 23 6 37 50 Depreciation and amortization (f) 46 48 46 56 21 32 94 Interest expense 7 8 8 7 3 5 15
Total benefits and expenses 323 299 314 286 101 220 622
Pre-tax earnings (loss) from continuing operations 116 98 62 87 40 44 214 Income tax expense (24) (20) 66 (13) (7) (4) (44)
Adjusted net earnings from continuing operations attributable to common shareholders (1) $ 92 $ 78 $ 128 $ 74 $ 33 $ 40 $ 170
Notable items included in adjusted net earnings attributable to common shareholders (2) $ 22 $ 12 $ 68 $ 10 $ 8 $ 5 $ 34
(1) Refer to "Non-GAAP Financial Measures Definitions"(2) Refer to page 8 "Notable Items" for further detail of notable items.(a) Life insurance premiums and other fees are included within "Escrow, title-related and other fees" in FNF 10-K/ 10-Q, and have been adjusted here to remove the effect of cost of reinsurance. (b) Interest and investment income has been adjusted to remove the market volatility on the alternative investment portfolio.(c) Recognized gains and losses (net) have been adjusted to remove the effect of recognized (gains) losses including changes in allowance for expected credit losses and OTTI; changes in fair values of indexed product related derivatives and embedded derivatives, net of hedging costs; and the change in fair value of the reinsurance related embedded derivative. (d) Benefits and other changes in policy reserves has been adjusted to remove the effects of the changes in fair values of indexed product embedded derivatives, changes in allowance for expected credit losses on reinsurance recoverables, the fair value impacts of assumed reinsurance, and changes in the SOP 03-1 reserve resulting from the adjustments above, as applicable. (e) Other operating expenses have been adjusted to remove the effects of transaction costs.(f) Depreciation and amortization has been adjusted to remove the impact on DAC, VOBA, and DSI of the adjustments above, as applicable, and purchase price amortization.
F&G - An Operating Segment of FNFFinancial Supplement - June 30, 2021(All periods are unaudited)
9

Financial Strength RatingsA.M. Best S&P Fitch Moody's
Holding Company RatingsF&G Annuities & Life, Inc. (formerly known as FGL Holdings)
Issuer Credit / Default Rating Not Rated BBB- BBB Ba2
Outlook Stable Stable Stable
CF Bermuda Holdings Limited
Issuer Credit / Default Rating Not Rated BBB- BBB Ba1
Outlook Stable Stable Stable
Fidelity & Guaranty Life Holdings, Inc.
Issuer Credit / Default Rating bbb- BBB- BBB Not Rated
Outlook Stable Stable Stable
Senior Unsecured Notes bbb- BBB BBB Baa2
Outlook Stable Stable
Operating Subsidiary RatingsFidelity & Guaranty Life Insurance Company
Financial Strength Rating A- A- A- Baa1
Outlook Stable Stable Stable Stable
Fidelity & Guaranty Life Insurance Company of New York
Financial Strength Rating A- A- A- Not Rated
Outlook Stable Stable Stable
F&G Life Re Ltd
Financial Strength Rating Not Rated A- A- Baa1
Outlook Stable Stable Stable
F&G Cayman Re Ltd
Financial Strength Rating Not Rated Not Rated A- Not Rated
Outlook Stable
F&G - An Operating Segment of FNFFinancial Supplement - June 30, 2021(All periods are unaudited)
10

Total Product Net Investment Spread
Three Months EndedOne month
endedTwo months
endedSix months
ended
June 30, 2021March 31,
2021December 31, 2020
September 30, 2020 June 30, 2020 May 31, 2020 June 30, 2021
Post-Merger Post-Merger Post-Merger Post-Merger Post-Merger Pre-Merger Post-Merger
Net investment income $ 487 $ 373 $ 327 $ 305 $ 111 $ 111 $ 860
AAUM (1) 30,423 29,016 27,864 26,990 26,582 29,285 29,722
Yield on AAUM (1) 6.40 % 5.15 % 4.69 % 4.52 % 5.01 % 2.27 % 5.79 %
Alternative investment yield adjustment (1) (1.43) % (0.56) % (0.17) % 0.13 % 0.41 % 1.83 % (1.01) %
Adjusted Yield on AAUM (1) 4.97 % 4.59 % 4.52 % 4.65 % 5.42 % 4.10 % 4.78 %
Interest credits $ 73 $ 74 $ 67 $ 67 $ 21 $ 53 $ 147
Option & futures costs 70 65 63 64 19 43 135
Total interest credited and option costs $ 143 $ 139 $ 130 $ 131 $ 40 $ 96 $ 282
Average account value 28,273 27,252 26,450 25,688 25,330 26,463 27,762
Interest credited & option cost 2.02 % 2.04 % 1.97 % 2.03 % 1.92 % 2.18 % 2.03 %
Net investment spread (1) 2.95 % 2.55 % 2.55 % 2.62 % 3.50 % 1.92 % 2.75 %
(1) Refer to "Non-GAAP Financial Measures Definitions" for further details.
F&G - An Operating Segment of FNFFinancial Supplement - June 30, 2021(All periods are unaudited)
11

FIA Net Investment Spread
Three Months EndedOne month
endedTwo months
endedSix months
ended
June 30, 2021March 31,
2021December 31, 2020
September 30, 2020 June 30, 2020 May 31, 2020 June 30, 2021
Post-Merger Post-Merger Post-Merger Post-Merger Post-Merger Pre-Merger Post-Merger
Net investment income (1) $ 377 $ 276 $ 235 $ 215 $ 69 $ 51 $ 653
AAUM (2) 20,896 20,217 19,097 18,312 18,267 18,623 20,551
Yield on AAUM (1) (2) 7.22 % 5.46 % 4.92 % 4.70 % 4.53 % 1.64 % 6.35 %
Alternative investment yield adjustment (2) (2.20) % (0.81) % (0.25) % 0.20 % 0.59 % 2.67 % (1.52) %
Adjusted Yield on AAUM (1) (2) 5.02 % 4.65 % 4.67 % 4.90 % 5.12 % 4.31 % 4.83 %
Interest credits $ 13 $ 15 $ 13 $ 14 $ 4 $ 8 $ 28
Option & futures costs 70 65 63 64 19 43 135
Total interest credited and option costs $ 83 $ 80 $ 76 $ 78 $ 23 $ 51 $ 163
Average account value 19,842 19,028 18,442 17,948 17,688 17,501 19,443
Interest credited & option cost 1.67 % 1.67 % 1.65 % 1.73 % 1.59 % 1.76 % 1.68 %
Net investment spread (1) (2) 3.35 % 2.98 % 3.02 % 3.17 % 3.53 % 2.55 % 3.15 %
(1) In December 2020, we restated prior period FIA net investment spread to reflect immaterial updates to FIA net investment income amounts. There was no impact to total product net investment spread amounts.(2) Refer to "Non-GAAP Financial Measures Definitions" for further details.
F&G - An Operating Segment of FNFFinancial Supplement - June 30, 2021(All periods are unaudited)
12

Average Assets Under Management Rollforward
Three Months EndedOne month
endedTwo months
endedSix months
ended
June 30, 2021March 31,
2021December 31, 2020
September 30, 2020 June 30, 2020 May 31, 2020 June 30, 2021
Post-Merger Post-Merger Post-Merger Post-Merger Post-Merger Pre-Merger Post-Merger
AAUM at beginning of period (1) $ 29,016 $ 27,864 $ 26,990 $ 26,582 $ 26,529 $ 28,924 $ 27,322
Net new business sales 1,668 1,197 874 408 53 361 2,553
Net reinsurance transactions and other (261) (45) — — — — (153)
AAUM at end of period $ 30,423 $ 29,016 $ 27,864 $ 26,990 $ 26,582 $ 29,285 $ 29,722 (1) Beginning balance for June 30, 2020 represents assets under management at June 1, 2020 and reflects $2.3 billion decrease from the exclusion of discontinued operations and $0.5 billion decrease from purchase accounting mark-to-market effect as compared to the May 31, 2020 ending balance.
Annuity Account Balance Rollforward (a)
Three Months EndedOne month
endedTwo months
endedSix months
ended
June 30, 2021March 31,
2021December 31, 2020
September 30, 2020 June 30, 2020 May 31, 2020 June 30, 2021
Post-Merger Post-Merger Post-Merger Post-Merger Post-Merger Pre-Merger Post-Merger
Account balances at beginning of period: $ 23,803 $ 22,992 $ 22,106 $ 21,442 $ 21,332 $ 20,999 $ 22,992
Net deposits 1,390 1,265 1,305 1,046 245 675 2,655
Surrenders, withdrawals, deaths, etc. (628) (585) (533) (482) (161) (381) (1,213)
Net flows 762 680 772 564 84 294 1,442
Premium and interest bonuses 21 18 20 17 4 12 39 Fixed interest credited and index credits 225 148 131 114 29 50 373 Guaranteed product rider fees (37) (35) (37) (31) (7) (23) (72)
Account balance at end of period $ 24,774 $ 23,803 $ 22,992 $ 22,106 $ 21,442 $ 21,332 $ 24,774
(a) The rollforward reflects the vested account balance of our fixed index annuities and fixed rate annuities, net of reinsurance.
F&G - An Operating Segment of FNFFinancial Supplement - June 30, 2021(All periods are unaudited)
13

Annuity Liability Characteristics
Fixed Annuities
Account Value
Fixed Index Annuities
Account ValueJune 30, 2021
SURRENDER CHARGE PERCENTAGES:No surrender charge $ 420 $ 2,343 0.0% < 2.0% 6 138 2.0% < 4.0% 25 645 4.0% < 6.0% 488 1,543 6.0% < 8.0% 1,821 2,465 8.0% < 10.0% 1,751 5,648 10.0% or greater 1 7,480
$ 4,512 $ 20,262
Fixed Annuities
Account Value
Fixed Index Annuities
Account ValueJune 30, 2021
CREDITED RATE (INCLUDING BONUS INTEREST) VS. ULTIMATE MINIMUM GUARANTEED RATE DIFFERENTIAL:No differential $ 488 $ 1,366 0.0% - 1.0% 566 1,320 1.0% - 2.0% 1,440 15 2.0% - 3.0% 2,018 — Allocated to index strategies — 17,561
$ 4,512 $ 20,262
F&G - An Operating Segment of FNFFinancial Supplement - June 30, 2021(All periods are unaudited)
14

Summary of Invested Assets by Asset ClassJune 30, 2021 December 31, 2020Post-Merger Post-Merger
Amortized Cost Fair Value Percent Amortized Cost Fair Value PercentFixed maturity securities, available for sale:
United States Government full faith and credit $ 739 $ 739 2 % $ 45 $ 45 — %United States Government sponsored entities 92 93 — % 105 106 — %United States municipalities, states and territories 1,303 1,372 4 % 1,243 1,309 4 %Foreign Governments 132 138 — % 128 140 — %
Corporate securities:Finance, insurance and real estate 4,314 4,567 13 % 4,267 4,572 15 %Manufacturing, construction and mining 808 881 3 % 839 936 3 %Utilities, energy and related sectors 2,560 2,699 8 % 2,532 2,762 9 %Wholesale/retail trade 2,094 2,235 6 % 1,900 2,106 7 %Services, media and other 2,782 2,935 8 % 2,568 2,793 9 %
Hybrid securities 853 932 3 % 888 963 3 %Non-agency residential mortgage-backed securities 670 696 2 % 677 694 2 %Commercial mortgage-backed securities 2,497 2,925 9 % 2,468 2,806 9 %Asset-backed securities 2,848 2,925 9 % 1,920 1,999 6 %CLO securities 4,255 4,479 13 % 4,021 4,268 14 %Alternative investments:
Private equity 808 807 2 % 614 614 2 %Real assets 298 304 1 % 280 288 1 %Credit 556 556 2 % 254 254 1 %
Equity securities 959 1,058 3 % 959 1,047 3 %Commercial mortgage loans 1,585 1,614 5 % 903 926 3 %Residential mortgage loans 1,208 1,180 3 % 1,128 1,123 4 %Other (primarily derivatives and company owned life insurance) 858 1,139 3 % 815 997 4 %Short term investments 356 356 1 % 456 456 1 %Total (a) $ 32,575 $ 34,630 100 % $ 29,010 $ 31,204 100 %
(a) Asset duration of 6.4 years and 6.8 years vs. liability duration of 7.3 years and 6.7 years for the periods ending June 30, 2021 and December 31, 2020, respectively.
F&G - An Operating Segment of FNFFinancial Supplement - June 30, 2021(All periods are unaudited)
15

Credit Quality of Fixed Maturity SecuritiesJune 30, 2021
NAIC Designation Fair Value Percent1 $ 14,152 51 %2 10,823 39 %3 1,740 6 %4 713 3 %5 144 1 %6 44 — %
$ 27,616 100 %
June 30, 2021Rating Agency Rating Fair Value PercentAAA $ 1,228 4 %AA 1,899 7 %A 7,024 25 %BBB 9,701 35 %Not rated 5,224 19 %Total investment grade 25,076 90 %BB 1,519 6 %B and below 601 2 %Not rated 420 2 %Total below investment grade 2,540 10 %
$ 27,616 100 %
F&G - An Operating Segment of FNFFinancial Supplement - June 30, 2021(All periods are unaudited)
16
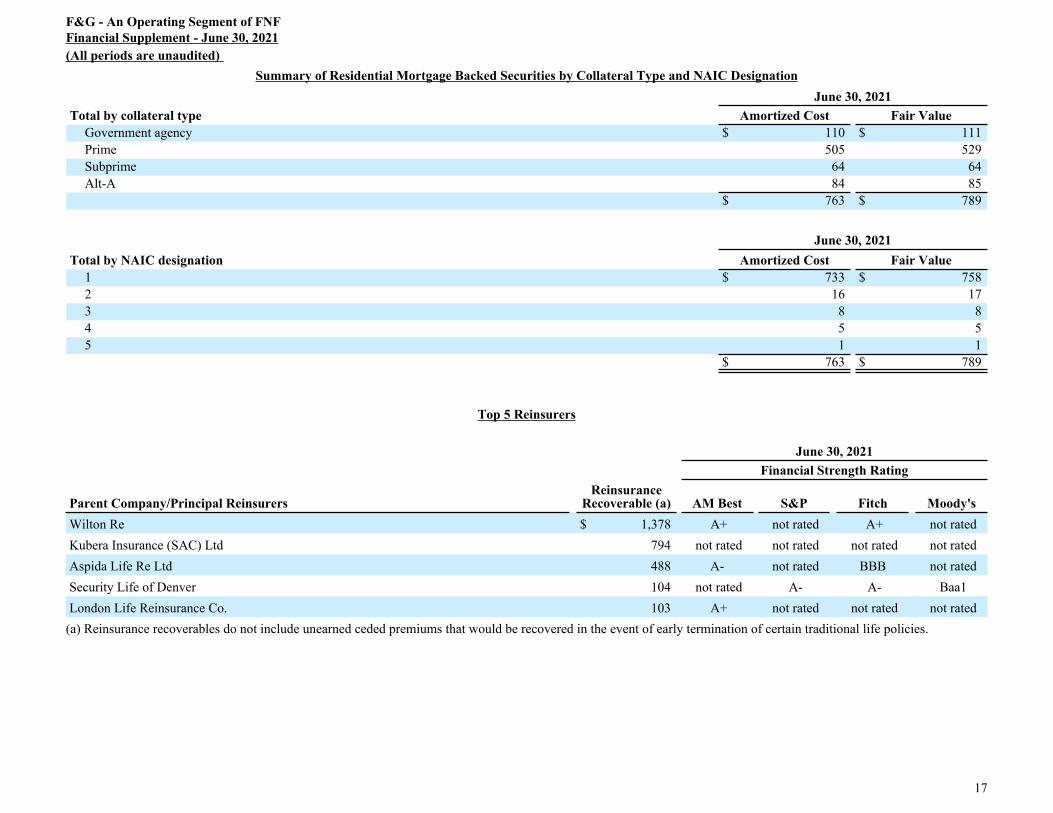
Summary of Residential Mortgage Backed Securities by Collateral Type and NAIC DesignationJune 30, 2021
Total by collateral type Amortized Cost Fair ValueGovernment agency $ 110 $ 111 Prime 505 529 Subprime 64 64 Alt-A 84 85
$ 763 $ 789
June 30, 2021Total by NAIC designation Amortized Cost Fair Value
1 $ 733 $ 758 2 16 17 3 8 8 4 5 5 5 1 1
$ 763 $ 789
Top 5 Reinsurers
June 30, 2021Financial Strength Rating
Parent Company/Principal ReinsurersReinsurance
Recoverable (a) AM Best S&P Fitch Moody'sWilton Re $ 1,378 A+ not rated A+ not rated Kubera Insurance (SAC) Ltd 794 not rated not rated not rated not rated Aspida Life Re Ltd 488 A- not rated BBB not rated Security Life of Denver 104 not rated A- A- Baa1 London Life Reinsurance Co. 103 A+ not rated not rated not rated
(a) Reinsurance recoverables do not include unearned ceded premiums that would be recovered in the event of early termination of certain traditional life policies.
F&G - An Operating Segment of FNFFinancial Supplement - June 30, 2021(All periods are unaudited)
17
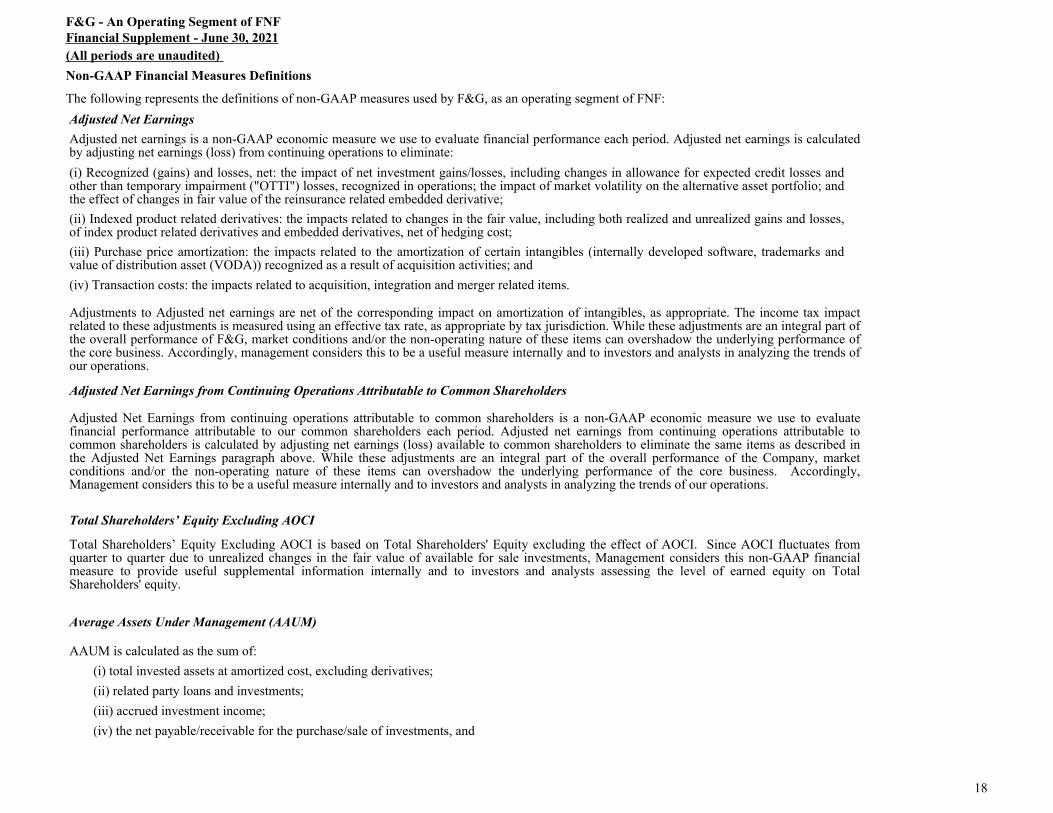
Non-GAAP Financial Measures Definitions
The following represents the definitions of non-GAAP measures used by F&G, as an operating segment of FNF:Adjusted Net EarningsAdjusted net earnings is a non-GAAP economic measure we use to evaluate financial performance each period. Adjusted net earnings is calculated by adjusting net earnings (loss) from continuing operations to eliminate: (i) Recognized (gains) and losses, net: the impact of net investment gains/losses, including changes in allowance for expected credit losses and other than temporary impairment ("OTTI") losses, recognized in operations; the impact of market volatility on the alternative asset portfolio; and the effect of changes in fair value of the reinsurance related embedded derivative;(ii) Indexed product related derivatives: the impacts related to changes in the fair value, including both realized and unrealized gains and losses, of index product related derivatives and embedded derivatives, net of hedging cost;(iii) Purchase price amortization: the impacts related to the amortization of certain intangibles (internally developed software, trademarks and value of distribution asset (VODA)) recognized as a result of acquisition activities; and (iv) Transaction costs: the impacts related to acquisition, integration and merger related items.
Adjustments to Adjusted net earnings are net of the corresponding impact on amortization of intangibles, as appropriate. The income tax impact related to these adjustments is measured using an effective tax rate, as appropriate by tax jurisdiction. While these adjustments are an integral part of the overall performance of F&G, market conditions and/or the non-operating nature of these items can overshadow the underlying performance of the core business. Accordingly, management considers this to be a useful measure internally and to investors and analysts in analyzing the trends of our operations.
Adjusted Net Earnings from Continuing Operations Attributable to Common Shareholders
Adjusted Net Earnings from continuing operations attributable to common shareholders is a non-GAAP economic measure we use to evaluate financial performance attributable to our common shareholders each period. Adjusted net earnings from continuing operations attributable to common shareholders is calculated by adjusting net earnings (loss) available to common shareholders to eliminate the same items as described in the Adjusted Net Earnings paragraph above. While these adjustments are an integral part of the overall performance of the Company, market conditions and/or the non-operating nature of these items can overshadow the underlying performance of the core business. Accordingly, Management considers this to be a useful measure internally and to investors and analysts in analyzing the trends of our operations.
Total Shareholders’ Equity Excluding AOCI
Total Shareholders’ Equity Excluding AOCI is based on Total Shareholders' Equity excluding the effect of AOCI. Since AOCI fluctuates from quarter to quarter due to unrealized changes in the fair value of available for sale investments, Management considers this non-GAAP financial measure to provide useful supplemental information internally and to investors and analysts assessing the level of earned equity on Total Shareholders' equity.
Average Assets Under Management (AAUM)
AAUM is calculated as the sum of:(i) total invested assets at amortized cost, excluding derivatives; (ii) related party loans and investments; (iii) accrued investment income; (iv) the net payable/receivable for the purchase/sale of investments, and
F&G - An Operating Segment of FNFFinancial Supplement - June 30, 2021(All periods are unaudited)
18
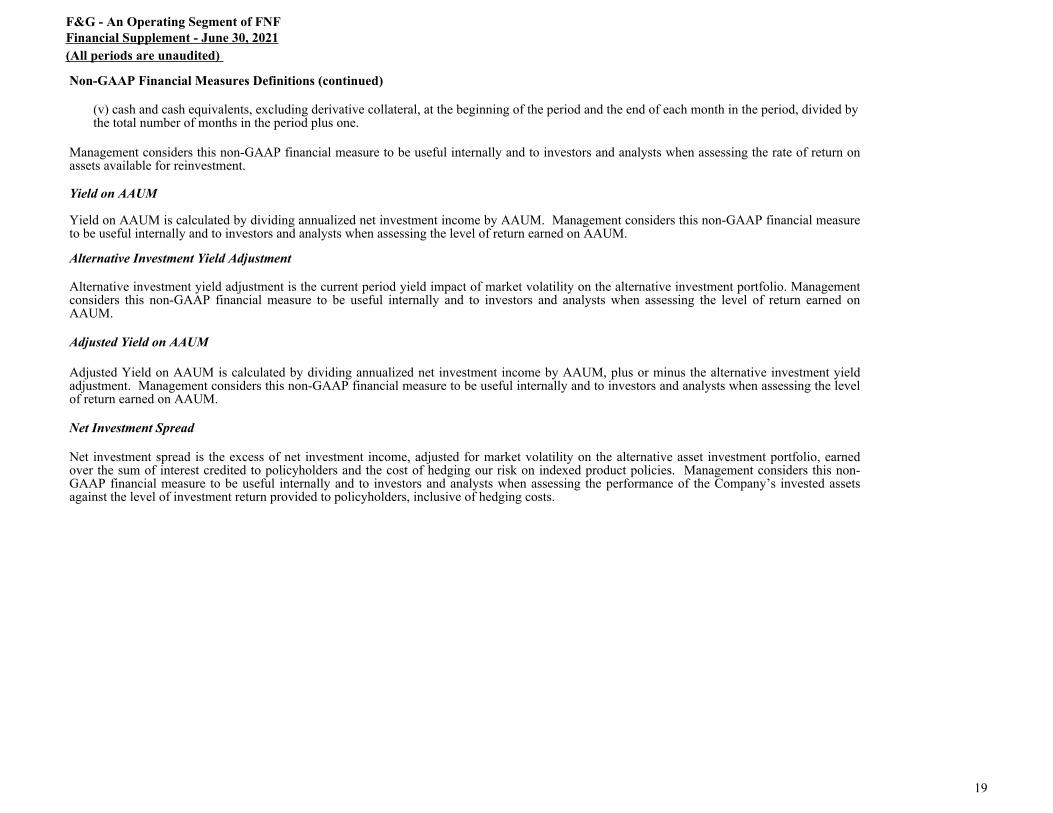
Non-GAAP Financial Measures Definitions (continued)
(v) cash and cash equivalents, excluding derivative collateral, at the beginning of the period and the end of each month in the period, divided by the total number of months in the period plus one.
Management considers this non-GAAP financial measure to be useful internally and to investors and analysts when assessing the rate of return on assets available for reinvestment.
Yield on AAUM
Yield on AAUM is calculated by dividing annualized net investment income by AAUM. Management considers this non-GAAP financial measure to be useful internally and to investors and analysts when assessing the level of return earned on AAUM.
Alternative Investment Yield Adjustment
Alternative investment yield adjustment is the current period yield impact of market volatility on the alternative investment portfolio. Management considers this non-GAAP financial measure to be useful internally and to investors and analysts when assessing the level of return earned on AAUM.
Adjusted Yield on AAUM
Adjusted Yield on AAUM is calculated by dividing annualized net investment income by AAUM, plus or minus the alternative investment yield adjustment. Management considers this non-GAAP financial measure to be useful internally and to investors and analysts when assessing the level of return earned on AAUM.
Net Investment Spread
Net investment spread is the excess of net investment income, adjusted for market volatility on the alternative asset investment portfolio, earned over the sum of interest credited to policyholders and the cost of hedging our risk on indexed product policies. Management considers this non-GAAP financial measure to be useful internally and to investors and analysts when assessing the performance of the Company’s invested assets against the level of investment return provided to policyholders, inclusive of hedging costs.
F&G - An Operating Segment of FNFFinancial Supplement - June 30, 2021(All periods are unaudited)
19