f&v market situation - european commission
TRANSCRIPT

F&V Grex and Cttee – March 2021
F&V market situation
Unit G.2. - Wine, spirits, and horticultural products
DG Agriculture and Rural Development
European Commission
2
This document has been prepared by Unit G.2 of DG AGRI, in order to
stimulate discussion with experts and delegates. It is a mere working
document and does not reflect any official position of the European
Commission. The European Commission does not accept any
responsibility with regards to the accuracy of any given data.

Structure of the presentation
1. Overall F&V market situation
2. Zoom in on main products
3. International
3
1. Overall F&V market situation
4

5
!
• Possible risk of single market fragmentation due to the sanitary crisis
so far avoided. Long queues and delays were registered at the German
borders following the decision by the German government in mid February
to reintroduce border controls (to fight the new variant) with Czech Republic
and Austria’s Tyrol. The sector is very sensitive to all these measures given
the nature of their business (fresh produce going bad in case of significant
delays). Despite some persisting (albeit smaller) queues, business is
reported to be (almost) as usual and that there is no qualitative evidence of
significant reduction in business volume intra-EU so far.
• Good news on trade front with 1) the EU-US agreement to suspend all
retaliatory tariffs (from midnight 11 March) on EU and U.S. exports imposed
in the Airbus and Boeing disputes for a four-month period and 2) UK
government’s decision to delay plans to introduce full border checks with
the EU (pushing the first deadline to January 2022) – more in the
international section

6
!
• According to recently released FAO data, the worldwide production of F&V
in 2019 was 1,837 million T of which 9% from the EU at 166 million T (101
million corresponded to vegetables and 65 million to fruits). The total EU
production in 2019 was 2.5% below 2018. In terms of major EU producers:
• Spain produced 31.1 million T in 2019 (-4% over 2018) followed by Italy
(27.5MT -3%) and France (20.6MT -3%)
• According to recently released Eurostat data, the main fruits produced in the
EU for 2019 are: pome fruit (apples, pears, etc.) at 13.7MT, citrus (oranges,
lemons, etc..) at 10.6MT and stone fruit (peaches, nectarines, etc..) with
7.3MT. With regards to vegetables: tomatoes with 16.5MT, onions 6.1MT
and carrots 4.7MT
• COMMISSION IMPLEMENTING DECISION (EU) 2021/462 of 15 March
2021 fixing the budget for the EU school scheme for the 2020/21 school
year: EUR126M is allocated to the distribution of fruit and vegetables to
schoolchildren.

Inflation
7
!
• Inflation for EU27 picking up at highest level in 12 months (Eurozone out
of deflation experienced from August to December)
• Annual consumer food price inflation at low levels at 0.8% (14
Member States registered food prices below pre-crisis levels)
• To note the corrections in recent months for fruits and constant fall in
prices for potatoes at around -12% since August
EU-27 03/20 04/20 05/20 06/20 07/20 08/20 09/20 10/20 11/20 12/20 01/21 02/21
Inflation 1.1 0.6 0.5 0.7 0.8 0.4 0.2 0.2 0.2 0.3 1.2 1.3
Food 3.3 4.5 4.1 3.7 2.3 1.9 1.9 2.1 1.9 1.1 1.1 0.8
Fruits 7.8 11.8 14.1 13.8 10.8 9.9 9.3 7.7 5.3 4.5 3.3 2.8
Vegetables 1.1 5.9 3.2 1.9 -2.4 -3.5 -1.8 1.8 3.1 -1.2 0.2 -1.0
Potatoes 1.1 1.0 -3.9 -6.6 -10.0 -11.9 -12.7 -11.9 -12.2 -12.7 -12.5 -11.9
Eurostat - Percentage change m/m-12
EXTRA-EU TRADE (up to Nov)
8
!
• Despite the economic crisis sparked by the COVID-19 and uncertainties
related to Brexit, EU27 agri-food trade continued to grow in the first
eleven months of 2020 according to official COMEXT data.
• Between January and November the value of EU27 agri-food exports
totaled €169 billion (+1% YoY), while the value of imports increased to €112
billion (+0,4% YoY). The EU enjoyed an agri-food trade surplus of €57
billion during this period.
• For F&V it’s the opposite: higher increases for imports (in particular fruits
and especially citrus recording double digit increases) than for exports
which remained overall stable. This is explained by an increased
consumption especially of citrus fruits in the EU as a consequence of the
COVID sanitary situation.
EXTRA-EU TRADE (up to Nov)
9
!
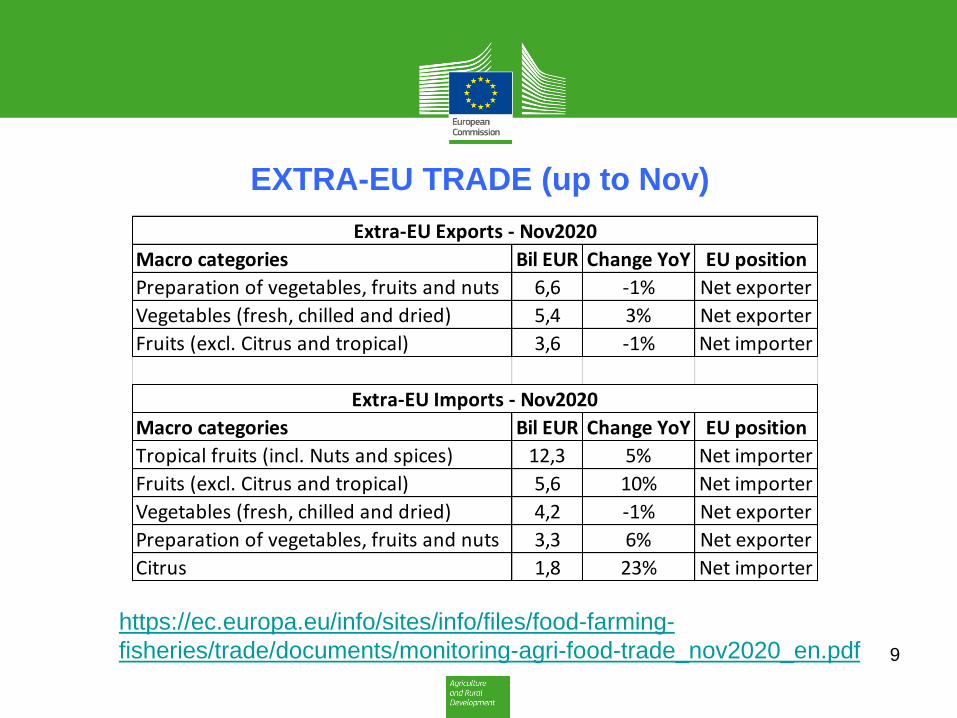
https://ec.europa.eu/info/sites/info/files/food-farming-
fisheries/trade/documents/monitoring-agri-food-trade_nov2020_en.pdf
Macro categories Bil EUR Change YoY EU position
Preparation of vegetables, fruits and nuts 6,6 -1% Net exporter
Vegetables (fresh, chilled and dried) 5,4 3% Net exporter
Fruits (excl. Citrus and tropical) 3,6 -1% Net importer
Macro categories Bil EUR Change YoY EU position
Tropical fruits (incl. Nuts and spices) 12,3 5% Net importer
Fruits (excl. Citrus and tropical) 5,6 10% Net importer
Vegetables (fresh, chilled and dried) 4,2 -1% Net exporter
Preparation of vegetables, fruits and nuts 3,3 6% Net exporter
Citrus 1,8 23% Net importer
Extra-EU Exports - Nov2020
Extra-EU Imports - Nov2020
Intra-EU trade (full year 2020)
10
!
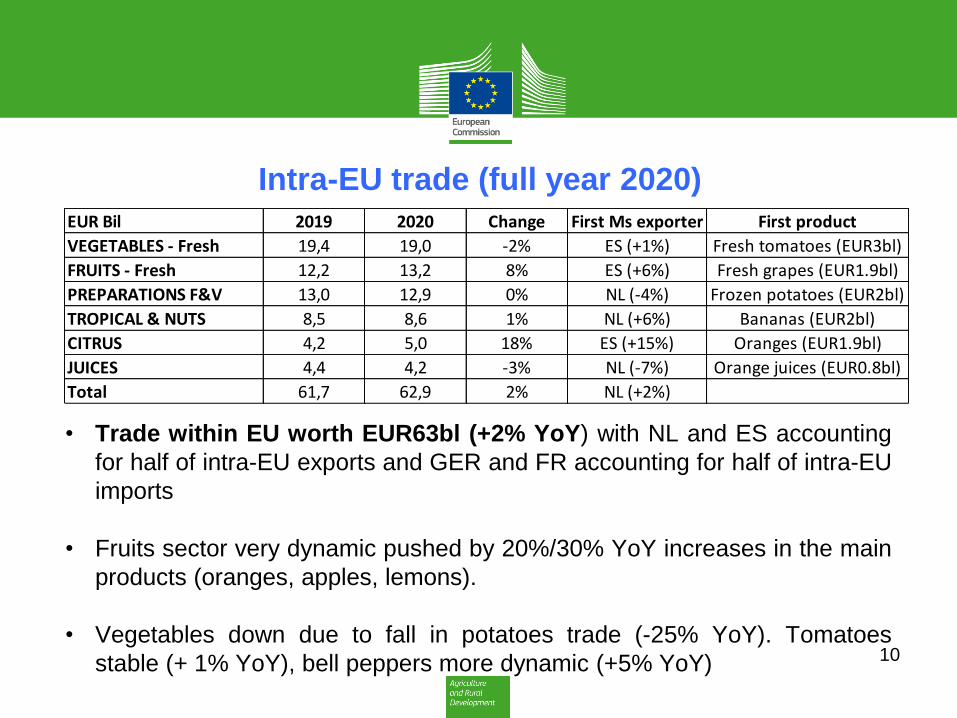
• Trade within EU worth EUR63bl (+2% YoY) with NL and ES accounting
for half of intra-EU exports and GER and FR accounting for half of intra-EU
imports
• Fruits sector very dynamic pushed by 20%/30% YoY increases in the main
products (oranges, apples, lemons).
• Vegetables down due to fall in potatoes trade (-25% YoY). Tomatoes
stable (+ 1% YoY), bell peppers more dynamic (+5% YoY)
EUR Bil 2019 2020 Change First Ms exporter First product
VEGETABLES - Fresh 19,4 19,0 -2% ES (+1%) Fresh tomatoes (EUR3bl)
FRUITS - Fresh 12,2 13,2 8% ES (+6%) Fresh grapes (EUR1.9bl)
PREPARATIONS F&V 13,0 12,9 0% NL (-4%) Frozen potatoes (EUR2bl)
TROPICAL & NUTS 8,5 8,6 1% NL (+6%) Bananas (EUR2bl)
CITRUS 4,2 5,0 18% ES (+15%) Oranges (EUR1.9bl)
JUICES 4,4 4,2 -3% NL (-7%) Orange juices (EUR0.8bl)
Total 61,7 62,9 2% NL (+2%)

2. Zoom in on main products
11
Apples
12
!
• As a reminder, very good previous campaign for the apple with high prices,
lower production and no remaining stocks due to sustained demand
especially during the period of lockdowns
• For the current campaign, prices since August have been at historical
high levels (around 30% higher than average) due to, also this year, low
production of 11,5M tonnes (Eurostat data), stable from last year and -3%
vs. 5 year average). EU potential is estimated at 13M tons
• For the first 5 months of the season (up to December), the exports in terms
of volume have decreased (-14% vs. 5 year average at 461K tonnes)
whereas imports increased (+4% vs. 5 year average at 108K tonnes). The
trend is expected to continue given the strong internal demand coupled with
low production and increased competition on the export market

13
!
87
7677
79 79 7880
82
79
74
7678
77 77
7981
83
8992 92
81
6765 65 64 64 64
6567
69
73
76 76
67
63 6261
60 60 60 6061
63
67 67 67
63
59 5957
55 56 56 56 5657
60
59 5958
52 53 52
50 50 5049
48 4850
4644
49
35
40
45
50
55
60
65
70
75
80
85
90
95
Aug Sep Oct Nov Dec Jan Feb Mar Apr May Jun Jul YEAR
Apple prices in the EU (€/100kg=Euro cents/kg) Simple avg of 4 MSs (the 4 major producers)
Current 2020/21 (Previous) 2019/20Monthly 5 year MAX 66% upper line5 year avg 66% lower lineMonthly 5 year MIN
€/100 kg
Those "producer" prices are ex packaging station, sorted and packaged

Oranges
14
!
• As a reminder previous marketing campain (2019/20) was good with above
average prices and limited overlap between NH and SH due to lower crop in
SH and high demand in the EU (Covid-impact)
• EU production of fresh oranges at 6.6M tonnes (+8% vs. last year and
highest in 10 years) thanks to good weather conditions (Italy + 17% and
Spain +1%)
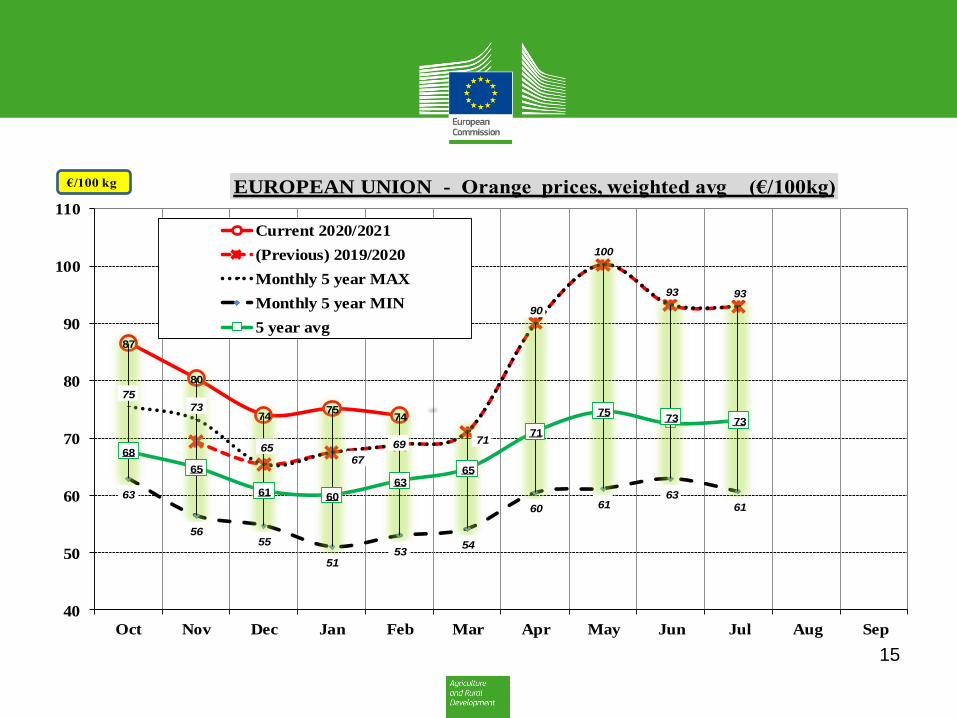
• Record high prices (especially for big sized oranges) in the EU (see next
slide) as retail demand still high. To be seen if prices will remain high in the
next months given high volumes on the market
• High internal production & demand has affected trade flows so far by
lowering imports (-22% vs. 3 year average at 126K tonnes) over the first
three months of the season and increasing exports (+6% vs. 3 year average
at 103K tonnes)
15
!
87
80
74 75
74
75
73
6567
69 71
90
100
93 93
63
5655
5153
54
60 6163
61
68
65
61 60
6365
71
7573 73
40
50
60
70
80
90
100
110
Oct Nov Dec Jan Feb Mar Apr May Jun Jul Aug Sep
EUROPEAN UNION - Orange prices, weighted avg (€/100kg)
Current 2020/2021
(Previous) 2019/2020
Monthly 5 year MAX
Monthly 5 year MIN
5 year avg
€/100 kg
Tomatoes
16
!
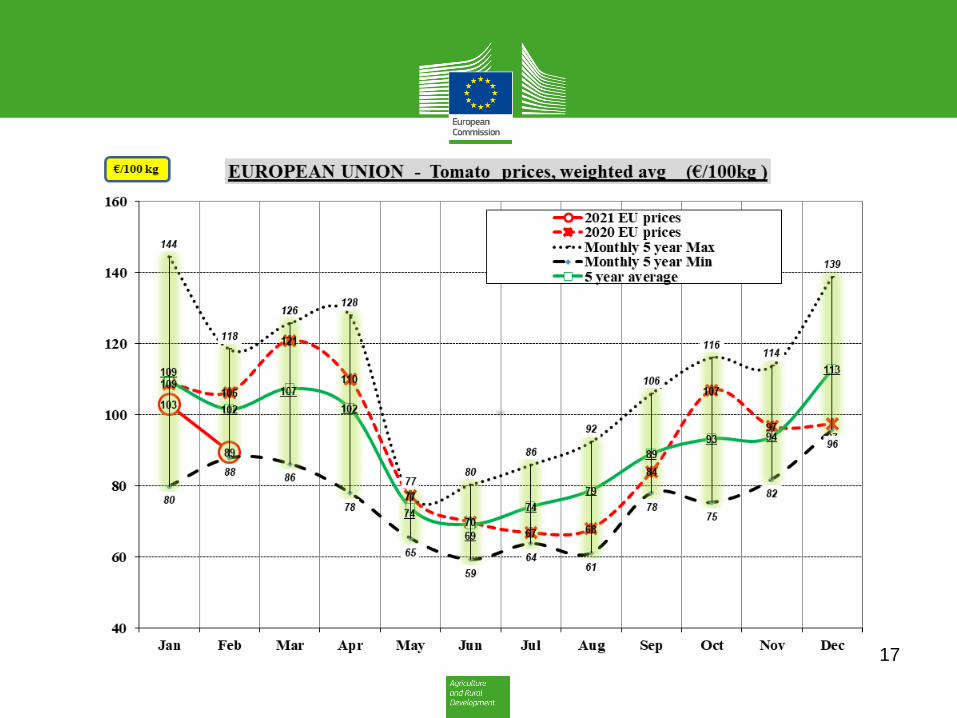
• «Winter» season started in October with EU prices higher than average (high
demand and low supply). Drop in prices in November and December in ES
and IT due to warmer temperatures. Cold snap and Filomena storm hit ES in
January which slowed down the production and caused an over supply in
February putting pressure on prices (low prices for February were
recorded especially for ES and NL).
• Prices for first two weeks of March (up to week#10) on the surge with higher
than average or average 5 year prices for ES, IT and FR.
• Production of fresh tomatoes for 2020 was of around 6M tonnes mainly for
European consumption. EU is net importer: total imports for 2020 stood at
621K tonnes (+19% vs. 5 year average) and exports stood at 438K tonnes (-
13% vs. 5 year average). In terms of value intra-EU trade stable at EUR3bl
(NL: EUR1.3bl, ES: EUR0.8bl) more than 4 times extra-EU imports valued at
EUR0.7bl (Morocco: EUR0.5bl, Turkey: EUR0.1bl).
17
!
3. International
18

19
!
• US/EU truce: the EU and U.S. agreed to suspend all retaliatory tariffs
(from midnight 11 March) on EU and U.S. exports imposed in the
Airbus and Boeing disputes for a four-month period. The suspension
should provide some relief to the F&V sector although trade flows with the
US are somewhat limited by numerous SPS barriers. The EU products
most concerned were FR and GER jams, citrus fruit, cherries and juices
whereas groundnuts and sweet potatoes were the most imported products
by the EU from the US subject to extra tariffs
• BREXIT – UK Government has decided to postpone the introduction
of phytosanitary certification obligations for most fresh produce,
considered low risk plant products, until January 2022 (instead of April
2021), when documentary checks will start to apply. Moreover, physical
checks at Border Control Posts on fresh produce will only be applied from
March 2022 (instead of July 2021).
20
!
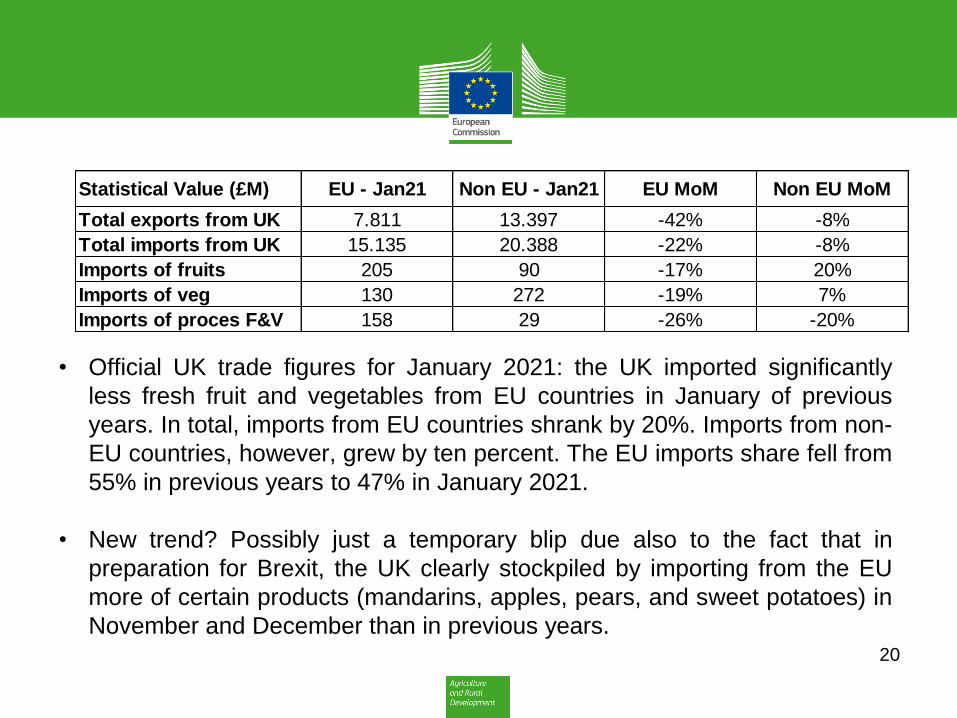
• Official UK trade figures for January 2021: the UK imported significantly
less fresh fruit and vegetables from EU countries in January of previous
years. In total, imports from EU countries shrank by 20%. Imports from non-
EU countries, however, grew by ten percent. The EU imports share fell from
55% in previous years to 47% in January 2021.
• New trend? Possibly just a temporary blip due also to the fact that in
preparation for Brexit, the UK clearly stockpiled by importing from the EU
more of certain products (mandarins, apples, pears, and sweet potatoes) in
November and December than in previous years.
Statistical Value (£M) EU - Jan21 Non EU - Jan21 EU MoM Non EU MoM
Total exports from UK 7.811 13.397 -42% -8%
Total imports from UK 15.135 20.388 -22% -8%
Imports of fruits 205 90 -17% 20%
Imports of veg 130 272 -19% 7%
Imports of proces F&V 158 29 -26% -20%

21
Thank you for your attention!