farm assets and nonfarm activities characteristic and
TRANSCRIPT
i
Farm assets and nonfarm activities characteristic and
determinants of nonfarm activities in small holder farmers:
The case of North east Ethiopia, Tehuledere District.
Prepared by: Theodros G. Abebe
Submitted in Partial Fulfillment of the Requirements for the Degree of Master’s
in Management, Economics and Consumer Studies
Supervisor: Dr. ir. Marrit Van den Berg
Development Economics Chair Group
Wageningen University
The Netherlands
July, 2012
ii
Farm assets and nonfarm activities characteristic and
determinants of nonfarm activities in small holder farmers:
The case of North east Ethiopia, Tehuledere District.
Thesis submitted to the Wageningen University and Research Centre in
Partial Fulfilment of the Requirements for the Master of Science Degree of
Master’s in Management, Economics and Consumer Studies
By:
Theodros Girma Abebe
Reg. Nr. 751023003120
MSC Thesis Development Economics Chair Group – DEC-80433
Supervisor:
Dr. ir. Marrit Van den Berg
Development Economics Chair Group
Wageningen University
Web: http://www.dec.wur.nl/uk
July, 2012

iii
Acknowledgment
Above all, I am glad my innumerable praise to the Almighty GOD for giving me the opportunity,
capacity and guidance throughout my life.
I am grateful to my supervisor Dr. ir.Marrit Van den Berg for her valuable and constructive comment,
suggestions and overall assistance from the early stage to the completion of the study. Without her
support and guidance this paper wouldn't have materialized.
My experience of the Netherlands is massive for my future career and I would like to thank NUFFIC
for offering a scholarship to study MSc Development Economics at Wageningen University. The skills
and knowledge acquired from Wageningen help me to plan my future and many thanks to all the
teachers who taught me.
I would like to acknowledge my heart-felt thanks to my lovely wife Almaz Mekonnen for her moral
support, constructive comments, encouragement and being with me in the completion of this study.
Without her taking responsibility in all activities at home on behalf of me in all aspects especially,
taking care of our Children Ruth and Yafet Theodros this study would not be completed. I am grateful
to my parents, who were always with me in all aspects throughout my life. Further, my sincere thanks
goes to my sister Meseret Girma, her husband Asrat Alemayehu and my brothers Tesfaye Yohannes
for those moral support and help during data collection.
I also benefited from brotherly help of Jonny Girma, who provided me with pertinent information of
the econometric model and Alemayehu, who devoted their valuable time and energy to comment on
the research.
I am indebted to Office of agriculture and Rural Development workers at each level; especially I
highly appreciate Tesfaye, Birihanu, Molla and shimelis for their assistance during the data collection
time. Without their cooperation the data would not have been collected in time.
Sample respondents also deserve special thanks for their cooperation, warm hospitability and because
they generously shared their views and made this work possible. Moreover I would like to thank the
Ethiopian community and friends at Wageningen for making my stay in the Netherlands pleasant.
iv
Table of content
Acknowledgment..................................................................................................................................... iii
List of tables ............................................................................................................................................ vi
List of figures ......................................................................................................................................... vii
Abstract ................................................................................................................................................... ix
I. Introduction ..................................................................................................................................... 1
1.1. Statement of the problem......................................................................................................... 2
1.2. Objective of the study .............................................................................................................. 3
1.3. Research questions .................................................................................................................. 3
1.4. Organization of the study ........................................................................................................ 4
II. Background ..................................................................................................................................... 5
2.1. Background of Ethiopia Economy .......................................................................................... 5
2.2. The nonfarm Economy in Ethiopia ......................................................................................... 5
2.3. The Rural Nonfarm Enterprise Sector in Amhara ................................................................... 6
III. Litrature Review ................................................................................................................................ 8
3.1. Concepts and Definitions of nonfarm activities ...................................................................... 8
3.2. The nonfarm economy in the rural development debate ....................................................... 10
3.3. Different studies of nonfarm in many countries .................................................................... 11
IV. Data and Methodology .................................................................................................................... 16
4.1. Description of the Study Area ............................................................................................... 16
4.2. Data source and method of data collection ............................................................................ 20
4.3. Sampling techniques and procedures .................................................................................... 21
4.4. Empirical model .................................................................................................................... 21
4.5. Estimation Methods ............................................................................................................... 26
4.6. Multicollinearity tests ............................................................................................................ 27
V. Result and Discussion ....................................................................................................................... 28
5.1. Household characteristics description of statistical result ..................................................... 28
v
5.2. Farm characteristics ............................................................................................................... 32
5.2.1. Land ............................................................................................................................... 32
5.2.2. Cropping pattern and Crop production .......................................................................... 34
5.2.3. Livestock ....................................................................................................................... 34
5.3. Characteristics of non-farm activities .................................................................................... 36
5.3.1. Trade .............................................................................................................................. 37
5.3.2. Handicraft activities....................................................................................................... 38
5.3.3. Sale of food and local drinks ......................................................................................... 39
5.4. Econometric estimates of non-farm participation ................................................................. 39
VI. Summary and conclusion ................................................................................................................ 44
Reference ............................................................................................................................................... 47
Appendix: .............................................................................................................................................. 52
vi
List of tables
Table 1: Non-farm share of rural income..............................................................................12
Table 2: Location map of the study area...............................................................................18
Table 3: Traditional Classification of Agro-ecological Zones in Ethiopia..........................19
Table 4: The Agro-ecological condition of the studied area.................................................20
Table 5: Sampled Kebeles and respondents...........................................................................21
Table 6: General characteristics of sample individual data..................................................29
Table 7: Land ownership........................................................................................................33
Table 8: The average size of livestock ownership of respondents........................................35
Table 9: Rate of participation and average income of nonfarm activities............................37
Table 10: Multivariate probit estimates for participation in non-farm activities................40
vii
List of figures
Figure 1: Coverage of the Rural Investment Climate Surveys, 2006/2007....................7
Figure 2: Location map of the study area.......................................................................17
Figure 3: Sex of nonfarm nonparticipant individuals.....................................................30
Figure 4: Sex of nonfarm participant individuals ..........................................................30
Figure 5: Marital status of nonfarm not participant individuals.....................................31
Figure 6: Marital statuses of nonfarm participant individuals........................................31
Figure 7: Educational Dummy of nonparticipant individuals........................................31
Figure 8: Educational Dummy nonfarm participant individuals....................................31
viii
Acronyms
ANRS Amhara National Regional State
Birr Ethiopian currency with the current exchange rate 1 Euro = 22 Birr
CSA Central Statistics Agency
GDP Gross Domestic product
m.a.s.l meter above sea level.
MoFED Ministry of Finance and Economic Development
MVP Multivariate Probit Model
PA Peasant Association
PASDEP Plan for Accelerated and Sustainable Development to end Poverty
RICS Rural Investment climate survey
RNFE Rural non-farm economy
TDOARDO Tehuledere District Office of Agriculture and Rural Development
TLU Tropical Livestock Unit
WB World Bank
ix
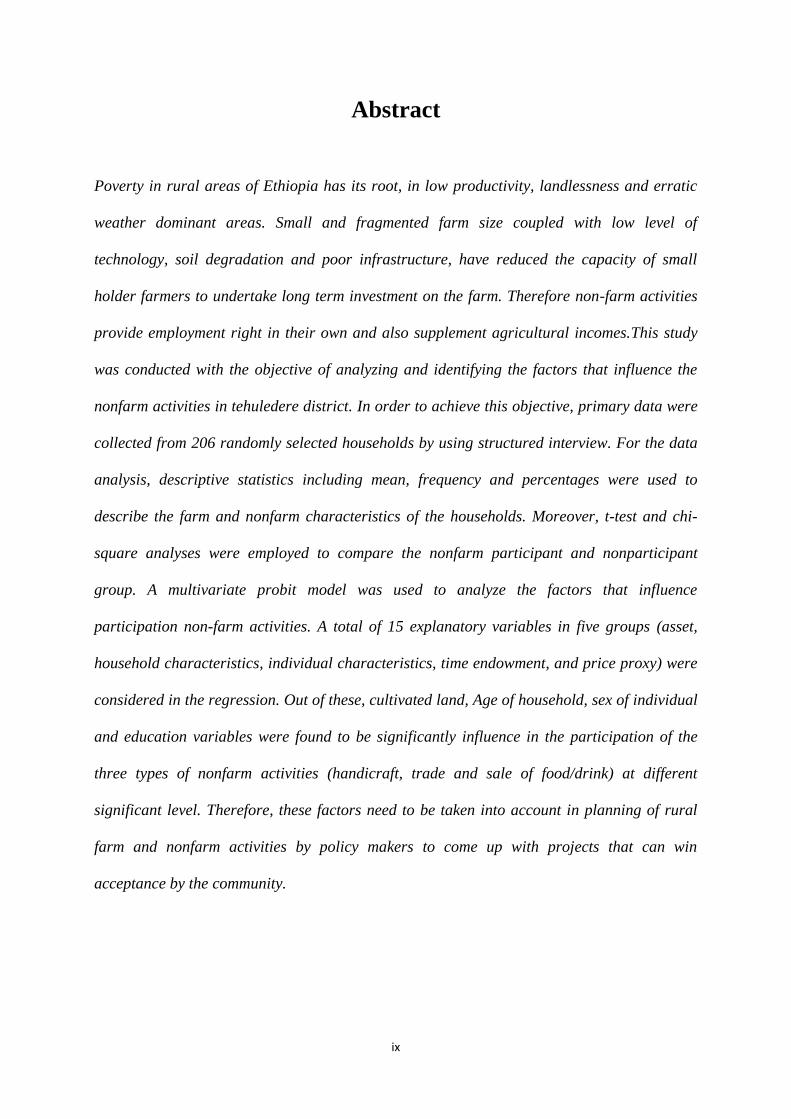
Abstract
Poverty in rural areas of Ethiopia has its root, in low productivity, landlessness and erratic
weather dominant areas. Small and fragmented farm size coupled with low level of
technology, soil degradation and poor infrastructure, have reduced the capacity of small
holder farmers to undertake long term investment on the farm. Therefore non-farm activities
provide employment right in their own and also supplement agricultural incomes.This study
was conducted with the objective of analyzing and identifying the factors that influence the
nonfarm activities in tehuledere district. In order to achieve this objective, primary data were
collected from 206 randomly selected households by using structured interview. For the data
analysis, descriptive statistics including mean, frequency and percentages were used to
describe the farm and nonfarm characteristics of the households. Moreover, t-test and chi-
square analyses were employed to compare the nonfarm participant and nonparticipant
group. A multivariate probit model was used to analyze the factors that influence
participation non-farm activities. A total of 15 explanatory variables in five groups (asset,
household characteristics, individual characteristics, time endowment, and price proxy) were
considered in the regression. Out of these, cultivated land, Age of household, sex of individual
and education variables were found to be significantly influence in the participation of the
three types of nonfarm activities (handicraft, trade and sale of food/drink) at different
significant level. Therefore, these factors need to be taken into account in planning of rural
farm and nonfarm activities by policy makers to come up with projects that can win
acceptance by the community.
1
CHAPTER ONE
I. Introduction
In most developing countries, agriculture is the back bone and the main sector for both its
contribution to the GDP and generation of employment. In most African countries, agriculture
is the major economic activity accounting the highest share of the GDP. For about two-thirds
of the Sub-Saharan population who live in rural areas, the main income comes from
agriculture (Csaki and de Haan, 2003).
Although agriculture is the major source of income and employment in most rural areas of
population in developing countries, rural households are increasingly earning their livelihoods
from non-farm activities. The rural non-farm economy (RNFE) is growing in the last decades.
As Haggblade et al. (2002) indicated, at the beginning of the new millennium, around 25 per
cent of rural areas full time employment and 35-40 per cent of rural area incomes were
accredited to the rural nonfarm economy in the developing countries. Effective development
of the RNFE can make major contributions to economic growth and poverty reduction, often
by helping multiply and spread the benefits from growth in sectors such as agriculture
(Wiggins and Hazell, 2011). This approach has several advantages, especially for poorer
households. Their agricultural resources are often too limited to allow for efficient use of all
household labour, and nonfarm activities can offer an alternative remunerative allocation,
especially during the lean season. Besides, income from agriculture is subjected to high risk
due to climatic factors, price fluctuations, pests and diseases. Earnings from nonfarm
employment may help to buffer the resulting income fluctuations and improving household
security (Lanjouw and Lanjouw, 1995).
Many researchers indicated , nonagricultural activities implemented in rural area are crucial in
bringing rural economy progress. For example, over the last three decades the nonfarm
economy has got an acceptance in rural developmental issues because of its positive influence
on poverty and food security. Participation in rural nonfarm activities is one of the livelihood
strategies among poor rural households in many developing countries (Mduma and Wobst,
2005). There is an argument that Africa economies want to be less dependent on agriculture to
reduce poverty. Nonfarm enterprises by small holder farmers play an important role in the
early stages of diversifying beyond agriculture (Loening et al., 2008). However, very little is
2
known about the characteristics, constraints and opportunities of nonfarm enterprises
(Lanjouw and Lanjouw, 2001); which makes it difficult to assess how this class of enterprises
might contribute to poverty reduction. One view is that nonfarm activities provide a way for
out of poverty (Loening et al., 2008).
1.1. Statement of the problem
There is a rapid population growth in Ethiopia which resulted in small and fragmented land
holding reducing labour productivity and leading to a widespread underdevelopment over the
country. The rapid growth rate of youth population, especially, led to youth dependency
burden which in turn increases the consumption of basic goods and services and decreases the
capacity of domestic savings affecting investment and economic growth (Hailemariam et al.,
2011).
As MoFED (2008) indicates, the current high population growth rate brings burden on natural
resources, especially on land. The population density of Ethiopia increased from 49 person
per Km2
in 1993 to 71 in 2009 (CSA, 2009) and agricultural density (a ratio of rural
population to cultivated land area per hectare) increased from 5.2 person per hectare in
1995/1996 to 7.1 person in 1999/2000 (CSA 1996; 2002). Thus, Scarcity of land is a critical
bottleneck nationally in general and in the study area in particular. Farm households are
endowed more with labour than with capital and land.
In addition to land scarcity, agricultural production seasonal and, therefore, rural labour
cannot be employed throughout the year which needs to widely develop nonfarm activities
(Woldehanna, 2000). These non-farm activities diversify the economy and it could be a
crucial strategy for the government to fight against poverty, as it absorbs labor thereby
minimizing unemployment. But, the existing development conditions give less attention to
nonfarm activities and their linkages to agriculture. This is partly due to the fact that the role
of the rural non-farm sector in the rural economy is underestimated. The rural non-farm
activities and their linkage with farm activities are not as such recognized and this knowledge
gap is reflected in policies of most developing countries (Lanjouw and Lanjouw 1997).
3
Many rural households are not undertaking nonfarm activities due to lack of asset to start the
business. Others are confined with less important activities that cannot allow them to grow out
of poverty. Thus, identification of the factors determining access and income from nonfarm
activities is crucial for policy makers to inform and adjust policies in the rural domain
(Reardon et al., 2007).
Most households in the district rely on rain fed agriculture for their livelihood, but population
growth has led to fragmentation of available arable land, and average farm size has dropped
below one hectare. The traditional development approach of providing technology and
infrastructure to increase agricultural production has not succeeded in curbing the trend of
increasing poverty, and alternative sources of productive employment must be sought in order
to support the additional workforce created by population growth (van den Berg and Kumbi,
2006). Traditionally the rural economy was considered as purely agriculture. Hence policy
makers at national levels equate improving the rural economy with promoting and supporting
agriculture (Csaki and de Haan, 2003). Therefore this Research was done to contribute to
understanding on the determinants of nonfarm participation and describes the characteristics
of farm and non-farm activities to the area in particular and for the Amhara region in general.
1.2. Objective of the study
The general objective of the study is to analyze and identify farm and nonfarm activity
characteristics and determinants of nonfarm activities participation in small holder farmers.
1.3. Research questions
This study answers the following basic questions:
What are the farm characteristics of smallholder farmers in the area?
What are the characteristics nonfarm activities of smallholder farmers?
What are the determinants of nonfarm activities in smallholder farmers in the study
area?
4
1.4. Organization of the study
The remaining parts of the thesis are organized as follows. The second chapter presents an
overview of nonfarm activities in Ethiopia. The third chapter deals with the reviews of related
theoretical and empirical literatures about nonfarm employment, the fourth chapter includes
data collection and methodology of the study. In the fifth chapter, the data are analyzed and
the descriptive and regression results are discussed. The sixth chapter consists of the summary
and conclusions.
5
CHAPTER TWO
II. Background
2.1. Background of Ethiopia Economy
Agriculture is a backbone of Ethiopia’s economy. The sector constitutes 51% of the national
GDP, a means of employment for 80% of the total labor force in the country, and a source of
income, food and foreign currency. About 90% of this agricultural production comes from
smallholder system which is a dominant farming system (Alemu et al., 2008).
The performance of agricultural sector in Ethiopia is weak. It is traditional and subsistence
oriented (Alemu et al., 2008). Factors which resulted in low productivity of agricultural sector
include degradation of natural resources, lack of access to agricultural inputs and markets
(Jayne et al., 2003). As there is a rapid population growth, it needs income diversification
approaches so that promotion of non-farm enterprise activities is being considered as a
promising facilitator of development by Ethiopian government, as manifested in the Plan for
Accelerated and Sustainable Development to end Poverty (PASDEP) (Loening et al., 2008).
2.2. The nonfarm Economy in Ethiopia
Size of nonfarm economy
There are variations across studies in the size of rural nonfarm employment and income
reported. The proportion of rural households who participate in nonfarm employment is
reported to be 81% in Tigray (woldenhanna and Oskam, 2001), 60% in Harerge (Tefera et al.,
2005) and 25% in Oromia (Van den and Kumbi, 2006). In welayita, 19% all adults participate
in nonfarm employment (Carswell, 2002). Likewise, the share of nonfarm income in total
income is 35% in Tigray, 20% in Harerghe, 13% in central and southern regions of Ethiopia
(Mutssumoto et al., 2006) and 8% in Oromia. Moreover, nonfarm income account for 44% of
cash income in south part of Ethiopia, Wolayita. The differences in the share may be a
reflection of the varied agroecological, market and infrastructural conditions in the different
part of the country. Differences in survey dates and methodology may also contribute to
different nonfarm activity visibility. Most of the nonfarm participants are self-employed
except in Tigray where majority (72%) was in wage employment (woldenhanna and Oskam,
6
2001). This is probably because of the huge food-for-work-programme in Tigray. In fact, 58%
of sampled households in the above study were engaged in food for work.
Central statistical Agency of Ethiopia, in collaboration with the World Bank, conducted a
unique survey of nonfarm enterprises that covered four major regions of Ethiopia (where 90%
of the population lives) in 2006/2007 collecting data on households and enterprise in rural
areas. The survey covered 14,646 households and provided information on enterprises start-
up, constraints and other operational characteristics. A quarter of all rural households
engaged in nonfarm enterprise sector in Ethiopia, either as primary occupation or as part-time
employment. There was non-negligible difference in the participation rate across regions with
the lowest in Amhara and the highest in southern region. Most enterprises were in trade sector
(52%) and most common trade activities were retail sale via stall (shop) and markets (26%).
Of female headed households, 41% of them were engaged in nonfarm enterprises whereas
only 15% of male headed households (CSA 2007).
Although the proportion of households engaged in nonfarm enterprises was significant, most
of the businesses were small and informal and seem to have income smoothening as the main
objectives. Almost half of the households reported supporting agricultural income as the main
motive for starting business while only 3% reported market opportunities as a motive. The
average number of employee in the enterprises was 1.3 and only 3% of the enterprises were
registered (CSA 2007).
2.3. The Rural Nonfarm Enterprise Sector in Amhara
Amhara national regional state is the second largest state of Ethiopia next to Oromia region.
Participation of nonfarm enterprise is lower in Amhara region compared to other regions as
indicated in earlier parts of this report.
After having an overview of the nonfarm enterprise sector in Ethiopia’s four major regions,
now turn to a more detailed investigation of the nonfarm enterprise sector in Amhara region.
Based on evidence from rural investment climate survey (RICS) by CSA and World Bank
studies, only 4 % of the Amhara working population was primarily participated in nonfarm
activities. In general 277,000 individuals or 6.4% of the working population in the regions
were participated in nonfarm activities as primary or secondary occupation, the other 91% of
7
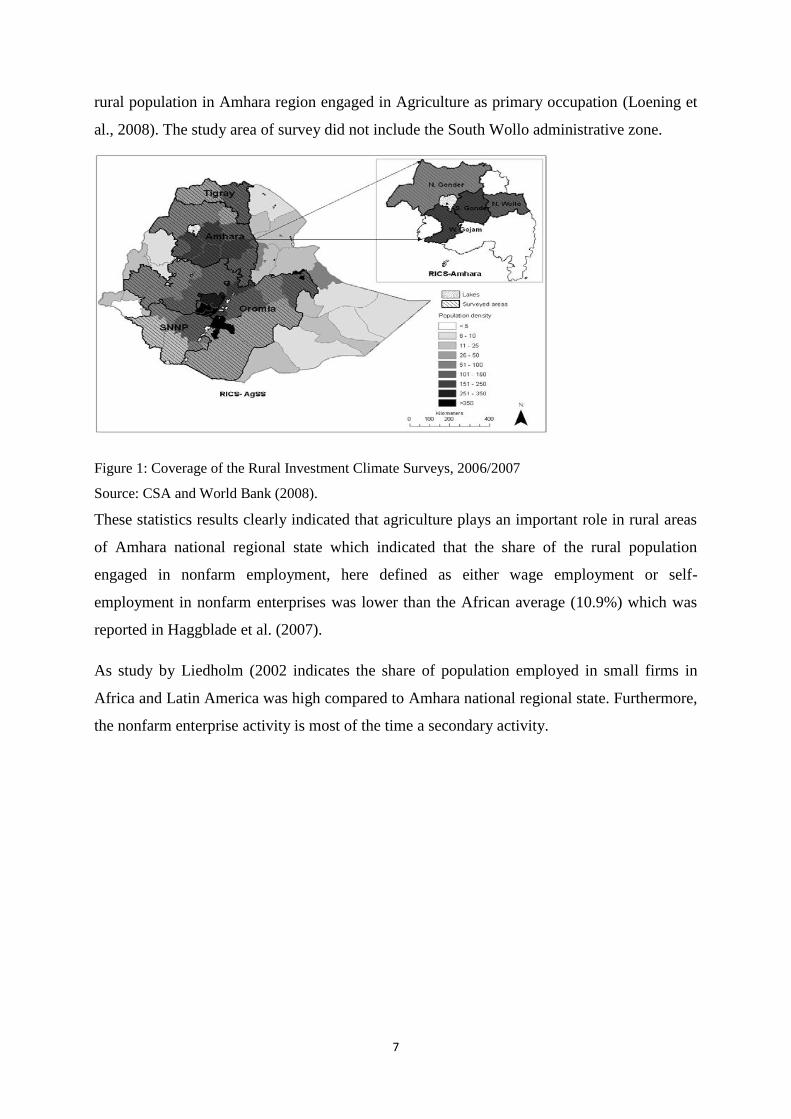
rural population in Amhara region engaged in Agriculture as primary occupation (Loening et
al., 2008). The study area of survey did not include the South Wollo administrative zone.
Figure 1: Coverage of the Rural Investment Climate Surveys, 2006/2007
Source: CSA and World Bank (2008).
These statistics results clearly indicated that agriculture plays an important role in rural areas
of Amhara national regional state which indicated that the share of the rural population
engaged in nonfarm employment, here defined as either wage employment or self-
employment in nonfarm enterprises was lower than the African average (10.9%) which was
reported in Haggblade et al. (2007).
As study by Liedholm (2002 indicates the share of population employed in small firms in
Africa and Latin America was high compared to Amhara national regional state. Furthermore,
the nonfarm enterprise activity is most of the time a secondary activity.
8
CHAPTER THREE
III. Litrature Review
3.1. Concepts and Definitions of nonfarm activities
Rural households are increasingly earning for their livelihoods from different activities other
than farming: the rural non-farm economy (RNFE) is growing through times. Effective
development of the RNFE can make important contributions for the economic growth and
poverty reduction in rural area, often by supporting multiply and spread the benefits from growth
in sectors such as agriculture, and by linking urban to rural areas (Wiggins and Hazell, 2011).
Different literatures have shown that agriculture is not the only important sector in the rural
economy. Studies in different developing countries have shown that the nonfarm sector plays a
significant role in contribution of employment and income in the rural areas (Lanjouw and
Lanjouw, 2001; Haggblade et al., 2007). Apparently Wiggins and Hazell (2011) indicated that
nonfarm activities are increasingly important in rural areas: a growing share of households
participate in them, while they provide increasing proportions of rural household income.
The scale of individual rural nonfarm activities varies enormously from part-time self-
employment in household based cottage industries to large scale agro-processing and
warehousing facilities operated by large multinational firms. Often highly seasonal, rural
nonfarm activity fluctuates with the availability of agricultural raw materials and in rhythm with
household labor and financial flows between farm and non-farm activities (Wiggins and Hazell,
2011).
Poor people dominate many of the low return activities such as cottage industries, small-scale
trading and unskilled wage labour used in construction, and many personal services. Wage
labour, in both agriculture and nonfarm business, also accrues primarily to the poor. In contrast,
white collar jobs such as medicine, teaching, accounting and administration figure most
prominently among higher income households. Poor households tend to dominate those types of
9
non-farm businesses that are labour intensive and can be conducted competitively on small
scales and with limited capital. For this reason, many policy makers view the rural non-farm
economy as a potentially important contributor for poverty reduction. Others, however, fear that
an abundance of labor-intensive, low-return rural non-farm activities may signal distress
diversification and an absence of more productive opportunities given that low capital frequently
translates into low productivity and low returns to labour (Shand, 1986 and Islam, 1987).
Definitions of Non-farm activities
There are broadly two categories of non-farm activities being pursued by the households. One
form is the non-farm proper, which includes the livelihood sources namely, artisans/service,
trade and white-collar jobs. These are either activities which are being pursued by households on
a regular or seasonal basis within the village to meet the local demand or government jobs
pursued regularly within or outside the village, or manufacturing or service sector jobs
undertaken in the village regularly. The second form of non-farm activities is what may be called
non-farm migratory. This activity is classified under wage labor in activities like construction,
earthwork, factory work and loading (Shylendra and Thomas, 1995).
According to Woldenhanna (2000), non-farm activities in which farm household participates can
be categorized into wage employment and self-employment activities. Three types of wage
employment can be distinguished, namely paid development work, manual non-farm work, and
non-manual (skilled) non-farm work. Paid development work involves jobs in community micro
dam construction, community soil and water conservation works such as construction of terraces
and afforestation, and other community works done under the food-for-work program. Manual
non-farm work is an activity in which farm households work for private and public construction
companies in urban and peri-urban areas. Non-manual (skilled) non-farm work involves
masonry, carpentry and cementing in public and private construction sites. Non-farm self-
employment comprises mainly petty trade, transporting by animals on their back, stone mining,
pottery and handicrafts, selling of wood and charcoal, local brewery and selling of fruits.
10
Defined in another way, non-farm activities include all secondary and tertiary sector employment
of both permanent and casual nature. Since these activities are quite diverse, a number of
different terms are used in the literature to refer to non-farm employment. Broadly speaking,
non-farm activities in the rural areas can be divided into the following categories (Meyer, R. L,
1991):
a. Small-scale industrial activities such as food processing (flour milling, oil processing, soap
making and food processing)
b. Cottage industries (handicrafts, spinning of cotton or wool, cloth weaving and dying, pottery,
leather tanning and distilling local brews)
c. Artisan activities (blacksmiths, masonry, wood work/carpentry, house construction, repair
services and fabrication of farm tools)
d. Commercial activities (trade and transportation)
e. Infrastructure development activities (special public works, feeder roads and irrigation works,
and food-for-work programs) and
f. Formal employment including professional and administrative jobs.
3.2. The nonfarm economy in the rural development debate
The rural development thinking has passed through several shifts, from the dual economy view
of the modernization paradigm to that of the agricultural-led growth paradigm (Ellis and Biggs,
2001). In the dual economy view, the contribution of the agricultural sector to growth is to
transfer resources, particularly labor, to the manufacturing sector (Fei and Ranis, 1964) while the
agricultural-led growth paradigm sees agriculture playing an active role in driving growth
through production and consumption linkages (Johnston and kilby, 1975). In the different
version of debates in these two major paradigms the central point of discussion was the role of
agriculture in rural development. The nonfarm economy came into the discussion in reference to
its relation with agriculture. With the sustainable livelihood approach, the nonfarm economy
comes more explicitly and frequently in to rural development thinking .The livelihood approach
recognize and emphasizes the diversified nature of rural household’ assets and livelihood
strategy(Ellis, 2000). Because nonfarm activities have become an important component of rural
households’ livelihood, much of this literature focuses on diversification into rural nonfarm
11
activities (Haggblade, 2007). Diversification is explained by the ‘Push factors’ such as limited
risk bearing capacity, constraints in labor and markets and climate uncertainty or the ‘pull factor’
such as presence of local engines of growth including commercial agriculture or proximity to an
urban area ( Barrett et al., 2001).
3.3. Different studies of nonfarm in many countries
Different evidences document showed that nonfarm activities in rural areas have surfaced much
earlier than the theoretical and policy recognition of the nonfarm economy. The data collected to
investigate the surplus labor assumption of the dual economy model in the 1970s showed large
size of nonfarm labor use in developing countries initiating interest in small scale and rural
nonfarm business activities (Haggblade, 2007). The studies on micro and small scale industries
on income diversification give some insight in to the rural nonfarm economy in developing
countries.
Size and importance of rural nonfarm economy
Nonfarm activities account for 30 % of full-time rural employment in Asia and Latin America,
20% in west Asia and North Africa and 10% in Africa (Haggblade et al., 2007). These figures
are from national censuses and typically include only primary occupation. The real extent of
nonfarm participation is likely to be higher than what the national statistics suggest since many
farmers engage in nonfarm activities as part-time employment or during agricultural slack
seasons (Anderson and leiserson, 1980). A recent multi-country study that uses data from 15
countries found nonfarm participation rate, including both primary and secondary employment,
in range of 67-94%(Winters et al., 2009).
When these are considered, the participation rates are 83% for Asia, 82% for Latine America and
78% for Africa (Winters et al., 2009). The size of nonfarm employment is reflected in the level
of income rural households earn from it.
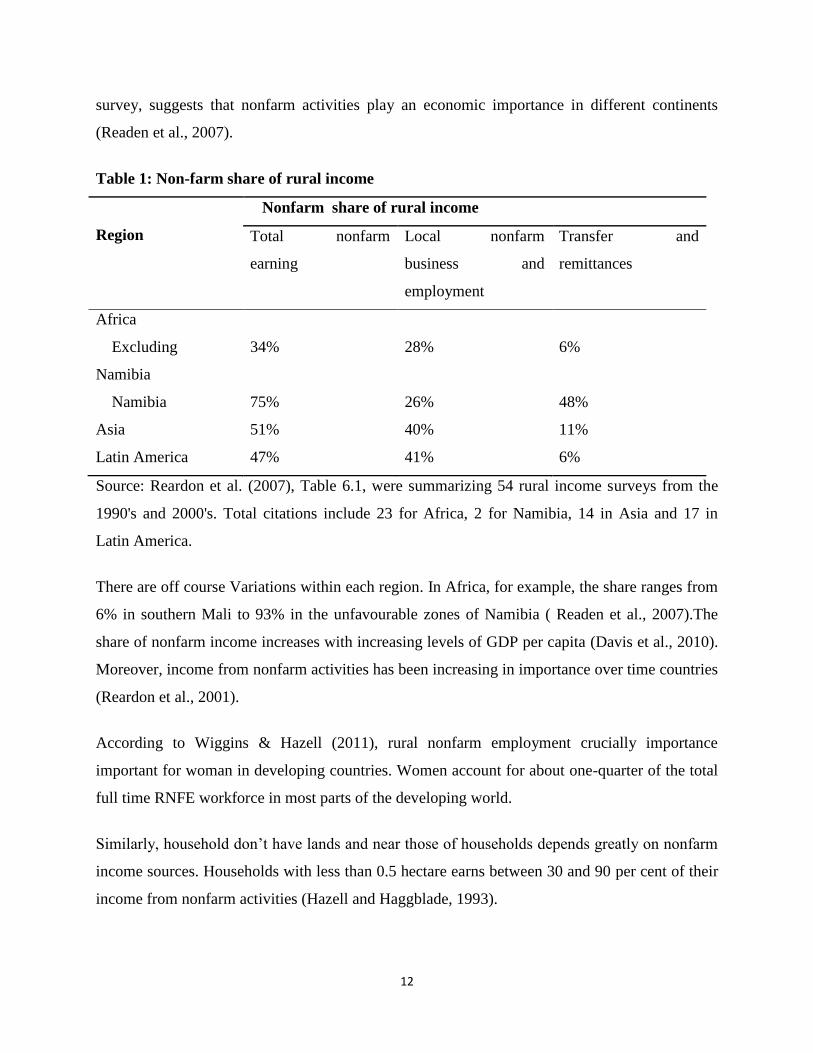
The following table 1 household Survey result showed that non-farm income accounts for about
35% of rural income in Africa and approximately 50% in Asia and Latin America. Based on the
12
survey, suggests that nonfarm activities play an economic importance in different continents
(Readen et al., 2007).
Table 1: Non-farm share of rural income
Region
Nonfarm share of rural income
Total nonfarm
earning
Local nonfarm
business and
employment
Transfer and
remittances
Africa
Excluding
Namibia
34% 28% 6%
Namibia 75% 26% 48%
Asia 51% 40% 11%
Latin America 47% 41% 6%
Source: Reardon et al. (2007), Table 6.1, were summarizing 54 rural income surveys from the
1990's and 2000's. Total citations include 23 for Africa, 2 for Namibia, 14 in Asia and 17 in
Latin America.
There are off course Variations within each region. In Africa, for example, the share ranges from
6% in southern Mali to 93% in the unfavourable zones of Namibia ( Readen et al., 2007).The
share of nonfarm income increases with increasing levels of GDP per capita (Davis et al., 2010).
Moreover, income from nonfarm activities has been increasing in importance over time countries
(Reardon et al., 2001).
According to Wiggins & Hazell (2011), rural nonfarm employment crucially importance
important for woman in developing countries. Women account for about one-quarter of the total
full time RNFE workforce in most parts of the developing world.
Similarly, household don’t have lands and near those of households depends greatly on nonfarm
income sources. Households with less than 0.5 hectare earns between 30 and 90 per cent of their
income from nonfarm activities (Hazell and Haggblade, 1993).
13
Composition
The composition of rural nonfarm employment for developing countries is 20-30% in
manufacturing sectors; 20-30% in commerce; 5-15% in construction; 5% in transport and the rest
in utilities and other activities (Anderson leiserson, 1980). Within each category there are
differences across countries and between regions within the same country with regard to the
details of the nonfarm activities (Reardon et al., 2007). For example, in Africa the rural
metalwork sector is largely confined to blacksmithing and welding while in irrigation region in
Pakistan it includes small-scale manufacturing of diesel and electric well pump sets (Anderson
leiserson, 1980).
Studies also indicated that rural nonfarm wage employment is often more important than rural
nonfarm self-employment and income from the service sector is more important than income
from the manufacturing sector (Reardon et al., 2007). The importance of wage income versus
self-employment income tends to be corrected with higher incomes and denser infrastructure
(Reardon et al., 2007).
Impact of rural nonfarm economy
Several cross-sectional studies in Africa and Latin America show a positive correlation between
nonfarm participation and total income (Reardon et al., 2001). Some studies also found nonfarm
employment contributing to increase in agricultural investment (Ruben and Van den Berg, 2001;
Bezu and holden, 2008).These findings suggests that, expansion of nonfarm economy may play a
positive role in reducing poverty.
Nonfarm Expansion can play a significant role in reducing poverty if most of the poor have
access to employment in the sector. But it is not always the case that the nonfarm sectors are
more inclusive of poor. In east Africa household members from low-agricultural potential are
found to be more likely to be engaged in the nonfarm sector than those in high-agricultural
potential (Matsumoto et al., 2006).
While there is evidence of positive correlation between nonfarm participation and total income
across several countries, the relationship between the share of nonfarm income and total income
14
or wealth is not so uniform. In some cases the poor get a higher share of their income from
nonfarm activities (De Janvry and Sadoulet, 2001) thereby expansion of the nonfarm sector
contributes to greater equality while in others, as shown for most of African studies (Rearden,
1997), the rich and wealthy get a higher share of their income from nonfarm activities implying
an inequality increasing nonfarm economy.
Determinants of participation in Rural Nonfarm Employment (RNFE) in Ethiopia
The studies that examine the factors that influencing participation in nonfarm employment used
different methodologies and different units of analysis, due to this condition comparison of
results difficult. Still some common features arise such as negative effect of agricultural
production or income and positive effect of family size and being male (or male headed
household)
Tefera et al., (2005) using logit model, analysed nonfarm participation decision of households.
They found that nonfarm participation to be negatively correlated with agricultural income and
Self-sufficiency and positively correlated with adult male labor. In their participation analysis,
Matsumoto et al., (2006) set out to estimate multinomial probit model of occupational choice for
individuals in farm, local nonfarm, and migration activities in Ethiopia, Uganda and Kenya.
However, because of the number of migrants in the Ethiopia sample was very low (only 15
individuals in the members of 420 household), they combine local nonfarm and migration
activities in the Ethiopia data which effectively makes the regression a binary model. The result
shows that men are more likely to participate in nonfarm employment. Participation increases
with age and the number of local language the respondent can speak and decreases with years of
schooling. I find the later result counter intrusive and contrary to what is found in other studies
and the result they themselves report for Uganda. None of the household level characteristics
were significant but they found that individuals from community with good land productivity are
less likely to participate in nonfarm employment. They also estimated households’ income from
farm and nonfarm activities separately. The result indicates that nonfarm income increases with
total assets owned and average years of schooling for adults in the household. Nonfarm income
decreases with the number of children in the household.
15
Woldenhanna and Oskam (2001) estimated tobit modes for household labor supply to nonfarm
employment, separately for wage and self-employment. They found upward sloping labor supply
curve for both types of activities. Moreover, they found that labor is negatively correlated with
agricultural land, livestock and non-labor income. They also estimated a multinomial logit model
to analyze the choice between the two types of nonfarm employment. They found that nonfarm
wage employment increases with family size and decreases with agricultural production and the
number of dependents. On the other hand, self-employment increases with agricultural
production and is not affected by demographic factors. They argue that the results imply that
households engage in self-employment to gain attractive returns while they engage in wage
employment because of push factors. Their study does not find significant effect of education.
Van den Berg and Kumbi (2006) estimated tobit models for income from handicraft, food/drink
and trade separately. They found that own cultivated land is positively correlated. This is similar
to the result from woldenhanna and Oskam (2001). Moreover, they also found that households
with heads who are married and literate are more likely to engage in food/drink production and
trade.
16
CHAPTER FOUR
IV. Data and Methodology
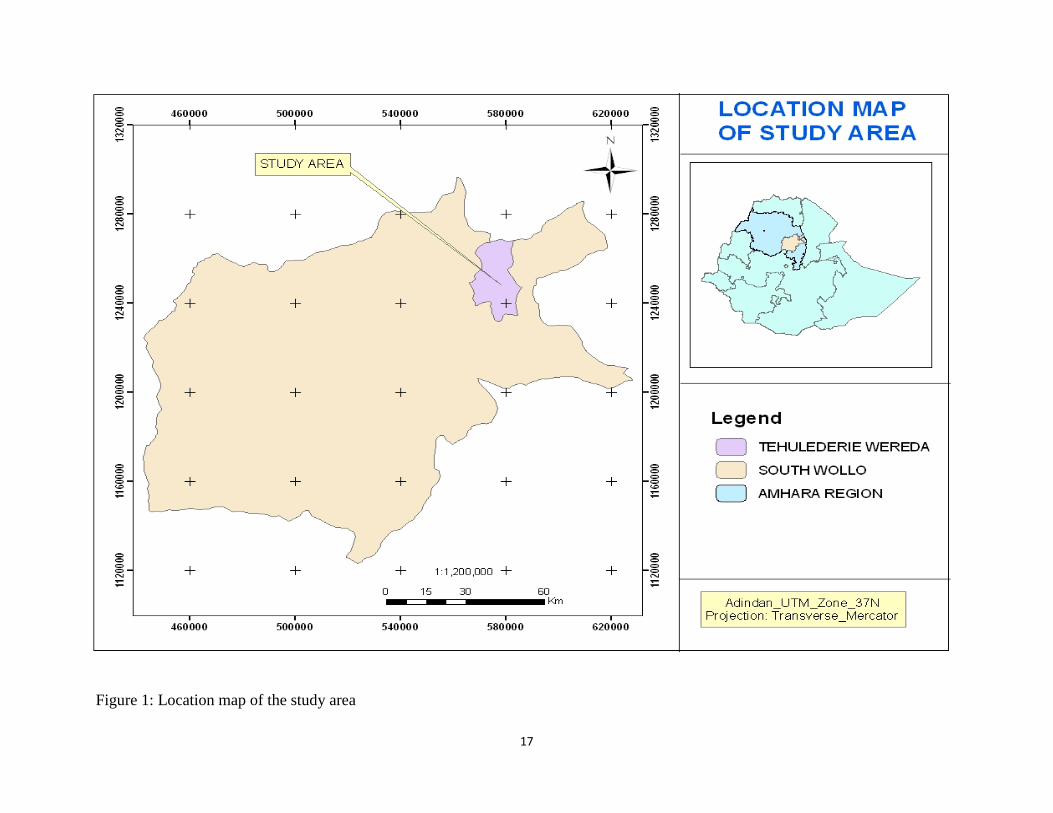
4.1. Description of the Study Area
Ethiopia is divided into nine regional states which are further structured into Zones and Districts.
The Districts are further classified into peasant associations/kebeles. The study was conducted in
Tehuledere District, South Wollo zone of the Amhara National Regional State (ANRS) which is
located in the northern east part of Ethiopia. It is one of the 22 Administrative Districts of the
South Wollo administrative zone of the Amhara National Regional State (ANRS). It shares
borders with Dessie Zuria Destrict in the south, Harbu District in the north, Worebabo and Kallu
district in the east, and Ambassel and Kutaber District in the west. It is one of the easily
accessible places because the Addis Ababa to Mekele highway passes through the district
crossing Haik town which is situated 430 Km away from capital city of Ethiopia.
Tehuledere is 45, 800 hectares wide. The topography of the District can be described as rugged
and broken. Elevation ranges from 1400 m.a.s.l up to 2928 m.a.s.l. The average annual
precipitation and the average monthly temperature were estimated to be 1030 mm and 21 degree
Celsius respectively (TDOARDO, 2010).
17
Figure 1: Location map of the study area
18
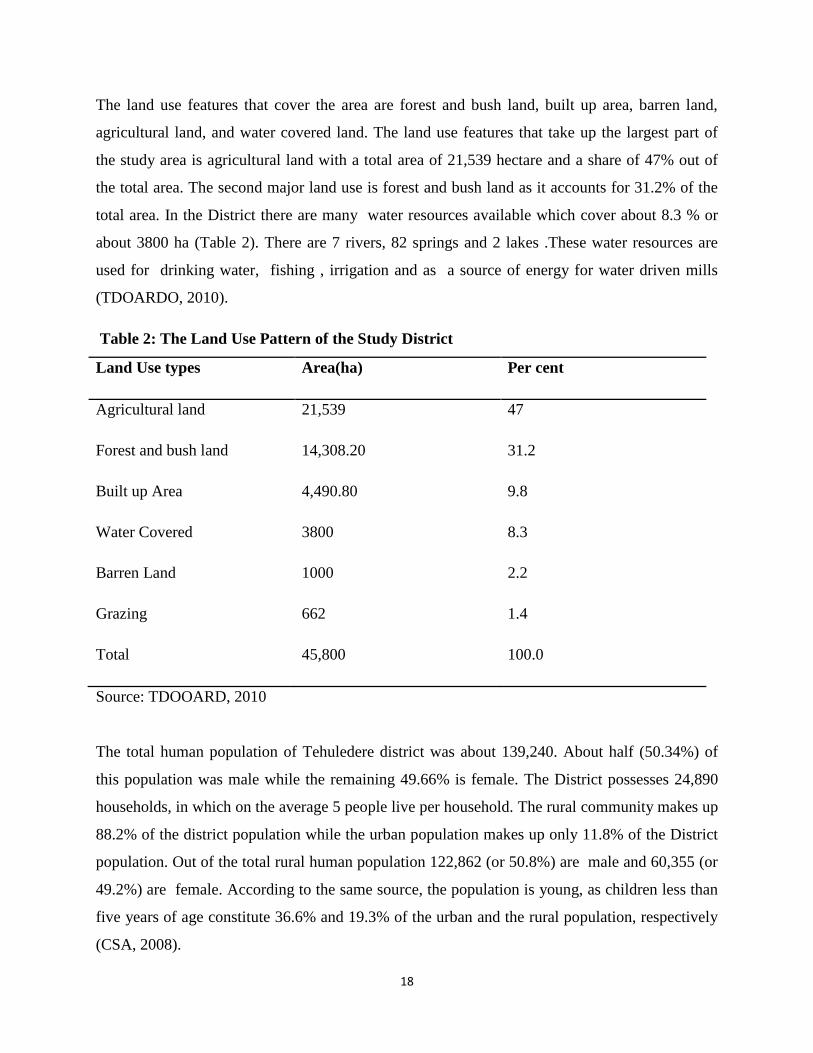
The land use features that cover the area are forest and bush land, built up area, barren land,
agricultural land, and water covered land. The land use features that take up the largest part of
the study area is agricultural land with a total area of 21,539 hectare and a share of 47% out of
the total area. The second major land use is forest and bush land as it accounts for 31.2% of the
total area. In the District there are many water resources available which cover about 8.3 % or
about 3800 ha (Table 2). There are 7 rivers, 82 springs and 2 lakes .These water resources are
used for drinking water, fishing , irrigation and as a source of energy for water driven mills
(TDOARDO, 2010).
Table 2: The Land Use Pattern of the Study District
Land Use types Area(ha) Per cent
Agricultural land 21,539 47
Forest and bush land 14,308.20 31.2
Built up Area 4,490.80 9.8
Water Covered 3800 8.3
Barren Land 1000 2.2
Grazing 662 1.4
Total 45,800 100.0
Source: TDOOARD, 2010
The total human population of Tehuledere district was about 139,240. About half (50.34%) of
this population was male while the remaining 49.66% is female. The District possesses 24,890
households, in which on the average 5 people live per household. The rural community makes up
88.2% of the district population while the urban population makes up only 11.8% of the District
population. Out of the total rural human population 122,862 (or 50.8%) are male and 60,355 (or
49.2%) are female. According to the same source, the population is young, as children less than
five years of age constitute 36.6% and 19.3% of the urban and the rural population, respectively
(CSA, 2008).
19
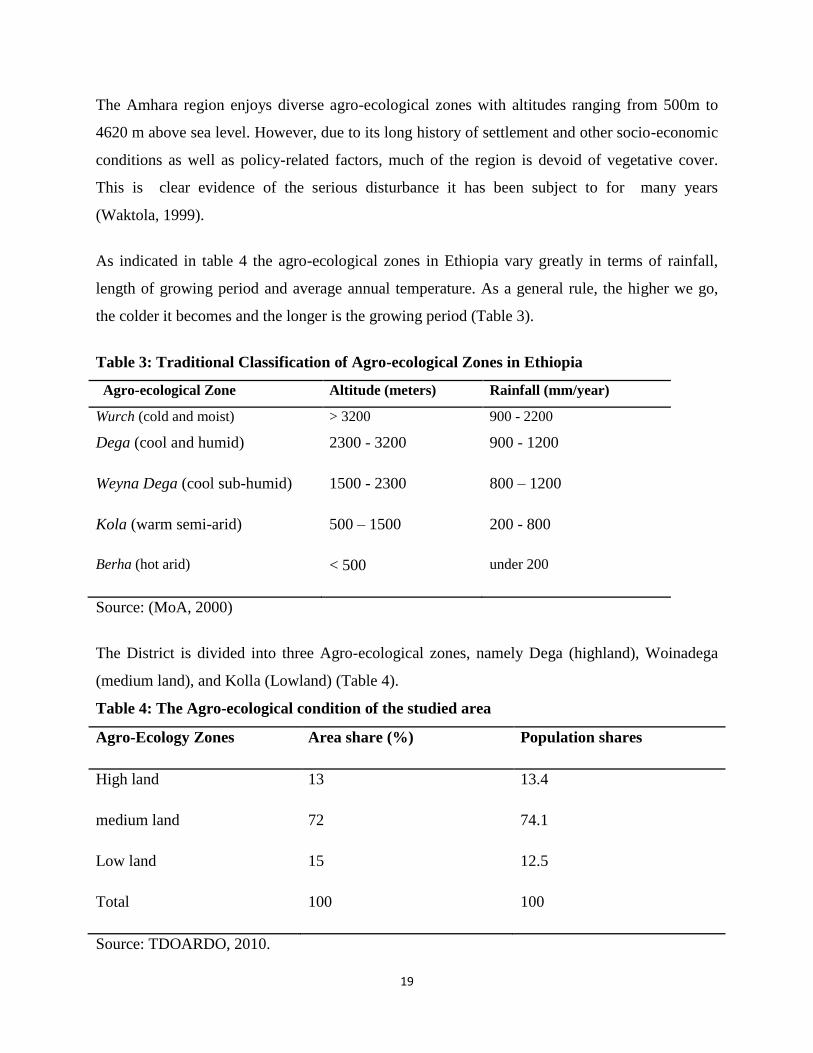
The Amhara region enjoys diverse agro-ecological zones with altitudes ranging from 500m to
4620 m above sea level. However, due to its long history of settlement and other socio-economic
conditions as well as policy-related factors, much of the region is devoid of vegetative cover.
This is clear evidence of the serious disturbance it has been subject to for many years
(Waktola, 1999).
As indicated in table 4 the agro-ecological zones in Ethiopia vary greatly in terms of rainfall,
length of growing period and average annual temperature. As a general rule, the higher we go,
the colder it becomes and the longer is the growing period (Table 3).
Table 3: Traditional Classification of Agro-ecological Zones in Ethiopia
Agro-ecological Zone
Altitude (meters) Rainfall (mm/year)
Wurch (cold and moist)
> 3200 900 - 2200
Dega (cool and humid) 2300 - 3200 900 - 1200
Weyna Dega (cool sub-humid) 1500 - 2300 800 – 1200
Kola (warm semi-arid) 500 – 1500 200 - 800
Berha (hot arid)
< 500 under 200
Source: (MoA, 2000)
The District is divided into three Agro-ecological zones, namely Dega (highland), Woinadega
(medium land), and Kolla (Lowland) (Table 4).
Table 4: The Agro-ecological condition of the studied area
Agro-Ecology Zones Area share (%) Population shares
High land 13 13.4
medium land 72 74.1
Low land 15 12.5
Total 100 100
Source: TDOARDO, 2010.
20
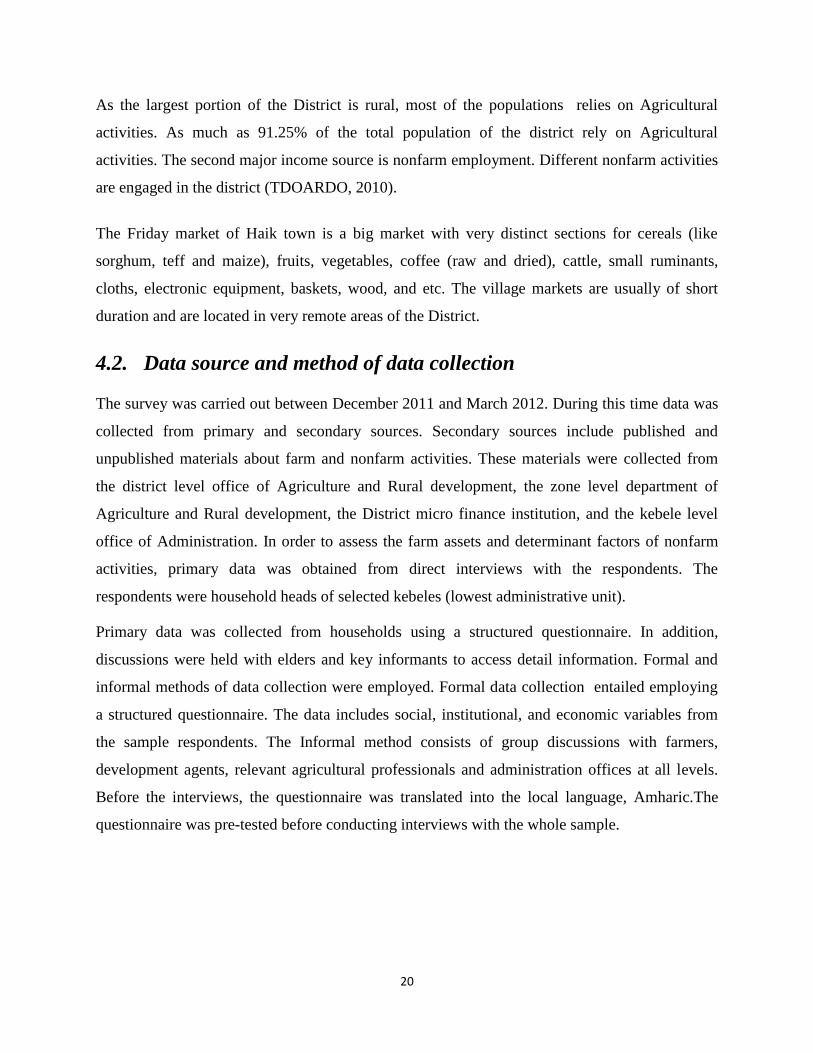
As the largest portion of the District is rural, most of the populations relies on Agricultural
activities. As much as 91.25% of the total population of the district rely on Agricultural
activities. The second major income source is nonfarm employment. Different nonfarm activities
are engaged in the district (TDOARDO, 2010).
The Friday market of Haik town is a big market with very distinct sections for cereals (like
sorghum, teff and maize), fruits, vegetables, coffee (raw and dried), cattle, small ruminants,
cloths, electronic equipment, baskets, wood, and etc. The village markets are usually of short
duration and are located in very remote areas of the District.
4.2. Data source and method of data collection
The survey was carried out between December 2011 and March 2012. During this time data was
collected from primary and secondary sources. Secondary sources include published and
unpublished materials about farm and nonfarm activities. These materials were collected from
the district level office of Agriculture and Rural development, the zone level department of
Agriculture and Rural development, the District micro finance institution, and the kebele level
office of Administration. In order to assess the farm assets and determinant factors of nonfarm
activities, primary data was obtained from direct interviews with the respondents. The
respondents were household heads of selected kebeles (lowest administrative unit).
Primary data was collected from households using a structured questionnaire. In addition,
discussions were held with elders and key informants to access detail information. Formal and
informal methods of data collection were employed. Formal data collection entailed employing
a structured questionnaire. The data includes social, institutional, and economic variables from
the sample respondents. The Informal method consists of group discussions with farmers,
development agents, relevant agricultural professionals and administration offices at all levels.
Before the interviews, the questionnaire was translated into the local language, Amharic.The
questionnaire was pre-tested before conducting interviews with the whole sample.
21
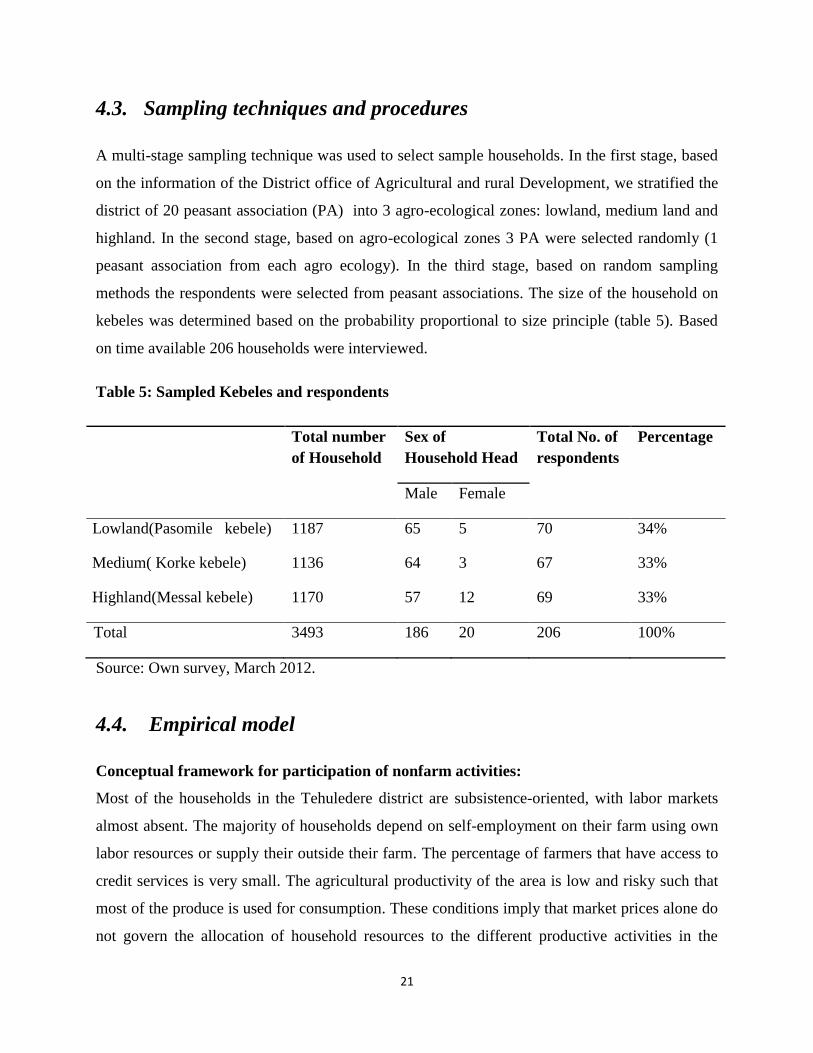
4.3. Sampling techniques and procedures
A multi-stage sampling technique was used to select sample households. In the first stage, based
on the information of the District office of Agricultural and rural Development, we stratified the
district of 20 peasant association (PA) into 3 agro-ecological zones: lowland, medium land and
highland. In the second stage, based on agro-ecological zones 3 PA were selected randomly (1
peasant association from each agro ecology). In the third stage, based on random sampling
methods the respondents were selected from peasant associations. The size of the household on
kebeles was determined based on the probability proportional to size principle (table 5). Based
on time available 206 households were interviewed.
Table 5: Sampled Kebeles and respondents
Total number
of Household
Sex of
Household Head
Total No. of
respondents
Percentage
Male Female
Lowland(Pasomile kebele) 1187 65 5 70 34%
Medium( Korke kebele) 1136 64 3 67 33%
Highland(Messal kebele) 1170 57 12 69 33%
Total 3493 186 20 206 100%
Source: Own survey, March 2012.
4.4. Empirical model
Conceptual framework for participation of nonfarm activities:
Most of the households in the Tehuledere district are subsistence-oriented, with labor markets
almost absent. The majority of households depend on self-employment on their farm using own
labor resources or supply their outside their farm. The percentage of farmers that have access to
credit services is very small. The agricultural productivity of the area is low and risky such that
most of the produce is used for consumption. These conditions imply that market prices alone do
not govern the allocation of household resources to the different productive activities in the
22
absence of insurance markets. That is, the household does not simply maximize profits, and
production and consumption decisions are non-separable. The household approach is justified
when both production and consumption decisions are interrelated (Caillavet, 1994), and when
household characteristics play an important role in determining household behaviour, as is the
case in imperfect markets (Lofgren and Robinson, 1999).
What do these ideas imply for the determinants of nonfarm activities in this study? Poor
households are those with low asset endowments. Most of the capital in the study area is
agricultural capital such as land and other agricultural assets, as this is the dominant productive
sector and most nonfarm activities are capital extensive.
As Reardon et al. (2006) indicated that agricultural capital has two functions. First, an increase in
agricultural capital leads to a higher productivity of both labour and liquid capital in agriculture
thereby leading a lower use of these resources in the non-farm sector. The Second function is
that it facilitates engagement in the nonfarm sector in that more agricultural capital implies
higher liquidity. Thus, there are two contrasting factors at work.
On one hand, the poor may want to diversify for risk reasons. Low asset levels which
characterize the poor may impede the poor households from participating in the nonfarm sector,
while the rich households which have adequate access to liquidity are not only able to fulfill the
requirements of agriculture, but also of nonfarm production. The rich households are in a better
position to self-finance for diversification. On the other hand, poverty may push households into
the low-wage nonfarm section, as they cannot profitably employ all family labor in agricultural
production. Rural poor households in a risk environment have an incentive to diversify income
sources especially when agriculture is affected by income risk (more risk-averse behavior than
the rich) Reardon et al (2000). If farm and nonfarm activities are not perfectly positively
correlated, diversification to nonfarm activities may decrease income variability. This in turn
makes it more attractive for the poor, depending on whether the liquidity constraint or the labor
surplus in combination with risk aversion is more important.
Either the poor or the rich will engage more in the nonfarm sector. It is the poor who participate
more because they are pushed out of agriculture. As Reardon (2000) indicates, some farm
23
households are motivated to carry out rural nonfarm activities by "push" factors, such as an
absence of or incomplete crop insurance and consumption credit markets; the risks of farming,
which induce households to manage income and consumption uncertainties by diversifying and
undertaking activities with returns that have a low or negative correlation with those of farming.
The rich who participate more because they have the means to earn more income (Marrit van
berg, 2006). Apparently, Reardon (2000) indicates, some farm households are motivated to carry
out rural nonfarm activities by "pull" factors, such as better returns in the nonfarm activities
relative to the farm sector. In the same vein, Lanjouw and Lanjouw (2001) explain that,
households which are “pulled” into nonfarm activities participate as a means of earning more
income and improving their current living conditions. In comparison, factors such as risk to the
farm production and lack of access to insurance tend to “push” households into non-agricultural
activities. Hence households that are “pushed” into nonfarm activities resort to diversification as
a safety net.
The reduced form equations for labor supply to nonfarm production are:
Lnf = Lnf (p, T, A, K, Z, I)
Where: Lnf is labor supply to nonfarm production
P is a vector of input and output prices for farm and nonfarm production
T is the number of adults in working age time of labor endowment
A is Land area
K is other fixed capital
Z is a vector household characteristic (such as, sex of household, age of household)
I is individual characteristics (such as sex, education)
The sign and magnitude of the estimated coefficients for land and (agricultural) capital gives
direct information on the participation of in the nonfarm sector (Marrit van berg, 2006).
Proximity to a rural market facilitates access to new market information and is thus likely to
increase the profitability of nonfarm production and services. Hence the distance or proximity of
a household market was used as proxies for prices. Access to infrastructure and nearness to
towns and cities: there seems to be a consensus that participation increases with nearness to
towns and with better infrastructure. Reardon et al. (2007) argues that sometimes access to urban
24
centers compensates for a lack of private assets such as education. Those individuals’ closer to
urban centers have a higher probability of getting nonfarm employment and earn more even if
they are not educated.
Household characteristics include sex of household head, age of household head, family size etc.
Individual characteristics include age, marital status, etc. Three education dummies literacy
obtained through informal education, Grade1-4, and Grade > 4 serve a dual purpose as household
individual characteristics affecting consumptive preferences and as indicators of human capital
available for both farm and nonfarm production.
An important component of individuals’ human capital is education. The impact of education on
nonfarm employment is consistent across the regions of Africa. Several of the studies document
that education increases participation in nonfarm employment and income from it (Reardon
1997). Apparently Matsumota et al (2006) in their research in Kenya, Uganda and Ethiopia
found a positive impact of education on non-farm employment which strengthened the earlier
finding of Readon (1997).
The age of the participant is another component of human capital indicating work and life
experience. Studies in Ghana (Abdulai and Delgado, 1999; lanjouw et al., 2001) discussed that at
a younger age, participation increases with age of the individual or the household head (until 30-
40 years), after which increase in age is associated with a decline in probability and level of
participation. The same trend holds for India with the negative relation starting only after age 50
while in china age is found to have a negative impact.
Gender of the individual or the household head may also affect participation. Women were found
to be less likely to participate in rural nonfarm employment in Tanzania (Lanjouw et al.,
2001).However the findings in Latin America were not conclusive. In the studies reviewed by
Reardon et al. (2001), the effect of gender is either not significant or is very different across
studies.
Physical capital is assumed to play a role for nonfarm production, except for a situation where
pack animals are included, as these are frequently used by traders. Physical capital for farm
production is operationalized as the number of cattle owned, cultivated land ownership. As was
explained above, the coefficients for these variables are ambiguous: a larger endowment of farm
25
assets may facilitate participation through access to cash for nonfarm activities, whereas more
agricultural assets mean a higher productivity of labor and variable inputs in agriculture and thus
a lower incentive to engage in the nonfarm sector.
Evidence from across studies in Africa suggest that households who experience a decline in farm
income, either temporarily or as a long-term trend, adopt nonfarm employment as an alternative
strategy (Reardon, 1997). Land holding, which indicates farming potential, is negatively
correlated with the share of nonfarm income in Latin America, as those with more land have
better farm income (Reardon et al, 2001).However, some of the same studies also found that the
level of income from Rural nonfarm employment increases with land holdings. This is because
land holdings affect not only the incentives but also the capacity to engage in nonfarm
employment. Land holdings can increase access to credit, social capital and own liquidity which
are instrumental to access productive activities (Reardon et al., 2007). In India, individuals
coming from higher land holding households are more likely to participate in nonfarm
employment compared to farm wage employment (Lanjouw and sheriff 2002). Apparently in the
Oromia region of Ethiopia, individual landholdings, by far the most important productive asset is
negative and significant, which indicates that poorer households earn more income from the
nonfarm sector (Van den Berg and Kumbi 2006).
Three location dummy variables, for lowland, medium land and high land, are also included as
independent variables.
Agro-climatic conditions and the state of agriculture in the region: In Africa, local non-farm
income is higher in more favorable agro-climatic areas. Local nonfarm income also increases
with the year’s rainfall (Reardon 1997). In Latin America, zones with dynamic agriculture were
found to have a higher level of nonfarm income per capita (Reardon et al., 2007). A dynamic
agricultural sector has production and expenditure linkages with the nonfarm sector that expand
the demand for nonfarm goods and services. A village that has some kind of growth motor,
whether agricultural or not, is most likely to see an increase in demand for nonfarm goods and
services, thereby increasing the earnings in the nonfarm sector (Reardon. 2007).
The survey data differentiates among three types of nonfarm activities: handicrafts, trade and
food & drinks. As a liquidity requirement, risk and labour productivity may differ between
26
activities, these leads to estimate separate equations for each activity. The data gives information
on the participation of non-farm activities, therefore, dummies of participation as the dependent
variable used for analysis. Assuming linearity of the labour supply functions and a multivariate
normal distribution of the error terms in the labour supply equations, we estimated a multivariate
probit model.
4.5. Estimation Methods
Descriptive statistics are important tools to present research results clearly and concisely. They
help one to have a clear picture of the characteristics of farm and nonfarm for sample units. By
applying descriptive statistics such as mean, standard deviation, percentages, frequency, charts,
and graphs, one can compare and contrast different categories of sample units with respect to the
desired characteristics so as to draw some important conclusions. In this study, descriptive
statistics were computed, along with the econometric models, and arranged in a way that allows
one to quickly comprehend their meanings.
An econometric estimate model of participation in the non-farm sector indicated as follows.
Based on the above analytical model we directly derive the reduced form equations for labour
supply nonfarm production:
Lnf = Lnf (p, T, A, K, Z, I)
After estimation, the sign of the coefficients for land and (agricultural) capital gives direct
information on the participation in the nonfarm sector. Hence, dummies of participation as
dependent variable used for analysis. Assuming linear combination of the labour supply
functions and a multivariate normal distribution of the errors terms in the labour supply
equations, this gives the following multivariate probit model: The multivariate probit is an
appealing model of choice behaviour because it allows a flexible correlation structure for the
unobservable variables (Huguenin et al., 2009). MVP is used to fit the distribution of different
alternative (claim) types.
27
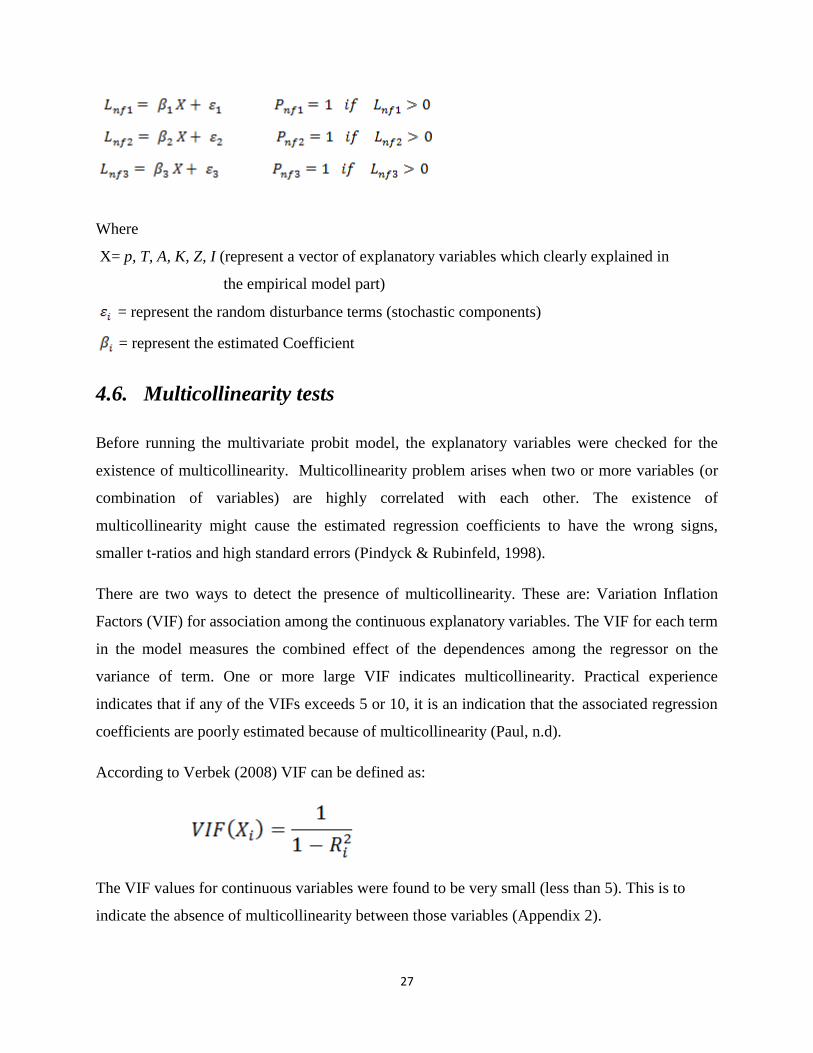
Where
X= p, T, A, K, Z, I (represent a vector of explanatory variables which clearly explained in
the empirical model part)
= represent the random disturbance terms (stochastic components)
= represent the estimated Coefficient
4.6. Multicollinearity tests
Before running the multivariate probit model, the explanatory variables were checked for the
existence of multicollinearity. Multicollinearity problem arises when two or more variables (or
combination of variables) are highly correlated with each other. The existence of
multicollinearity might cause the estimated regression coefficients to have the wrong signs,
smaller t-ratios and high standard errors (Pindyck & Rubinfeld, 1998).
There are two ways to detect the presence of multicollinearity. These are: Variation Inflation
Factors (VIF) for association among the continuous explanatory variables. The VIF for each term
in the model measures the combined effect of the dependences among the regressor on the
variance of term. One or more large VIF indicates multicollinearity. Practical experience
indicates that if any of the VIFs exceeds 5 or 10, it is an indication that the associated regression
coefficients are poorly estimated because of multicollinearity (Paul, n.d).
According to Verbek (2008) VIF can be defined as:
The VIF values for continuous variables were found to be very small (less than 5). This is to
indicate the absence of multicollinearity between those variables (Appendix 2).
28
CHAPTER FIVE
V. Result and Discussion
This chapter deals with the analysis of the survey data and interpretation of the results of data
analysis. Specifically the characteristics of the farm and nonfarm activities of the sample
households are analysed and discussed using descriptive statistics. Moreover, an econometric
result of multivariate probit is discussed.
5.1. Household characteristics description of statistical result
The study was based on cross-sectional data collected from a total of 206 farm households
selected from Tehuledere districts of north eastern part of Ethiopia. Of the total 206 sample
households, 51 % reported that they were participating in nonfarm and farm activities. Data
included the family members whose age reached for nonfarm participation (greater than 15
years). Based on the survey data 631 individual data were collected from the area. Out of the
total individuals, 28% of them were participating in nonfarm activities.
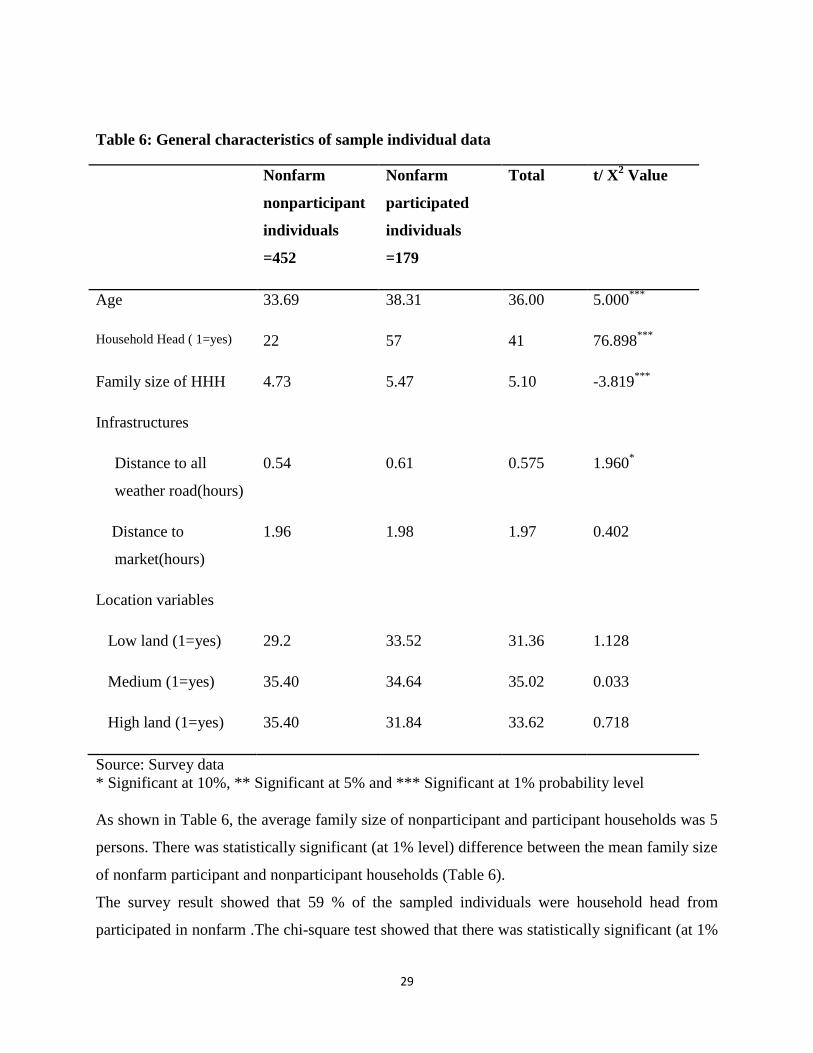
The average age of the whole individuals was 36 years, ranging between 15 and 70 years old.
There was statistically significant (at 1% level) difference between the mean age of nonfarm
participant and nonparticipant individuals. The survey data shows, the average age of individuals
in the participation of nonfarm activities was a little bit less than that of the non-participants
(Table 6).
29
Table 6: General characteristics of sample individual data
Nonfarm
nonparticipant
individuals
=452
Nonfarm
participated
individuals
=179
Total
t/ X2 Value
Age 33.69 38.31 36.00 5.000***
Household Head ( 1=yes) 22 57 41 76.898***
Family size of HHH 4.73 5.47 5.10 -3.819***
Infrastructures
Distance to all
weather road(hours)
0.54 0.61 0.575 1.960*
Distance to
market(hours)
1.96 1.98 1.97 0.402
Location variables
Low land (1=yes) 29.2 33.52 31.36 1.128
Medium (1=yes) 35.40 34.64 35.02 0.033
High land (1=yes) 35.40 31.84 33.62 0.718
Source: Survey data
* Significant at 10%, ** Significant at 5% and *** Significant at 1% probability level
As shown in Table 6, the average family size of nonparticipant and participant households was 5
persons. There was statistically significant (at 1% level) difference between the mean family size
of nonfarm participant and nonparticipant households (Table 6).
The survey result showed that 59 % of the sampled individuals were household head from
participated in nonfarm .The chi-square test showed that there was statistically significant (at 1%
30
level). The proportion of household head in nonfarm participant was higher than the
nonparticipant (Table 6).
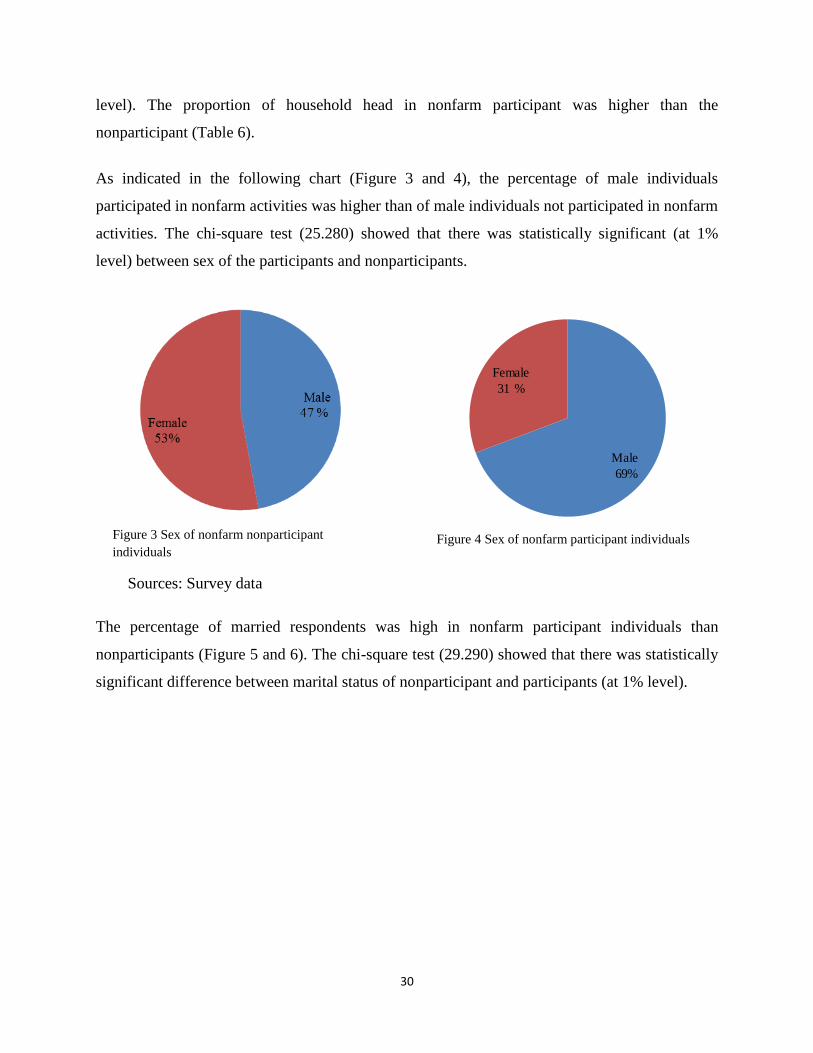
As indicated in the following chart (Figure 3 and 4), the percentage of male individuals
participated in nonfarm activities was higher than of male individuals not participated in nonfarm
activities. The chi-square test (25.280) showed that there was statistically significant (at 1%
level) between sex of the participants and nonparticipants.
Sources: Survey data
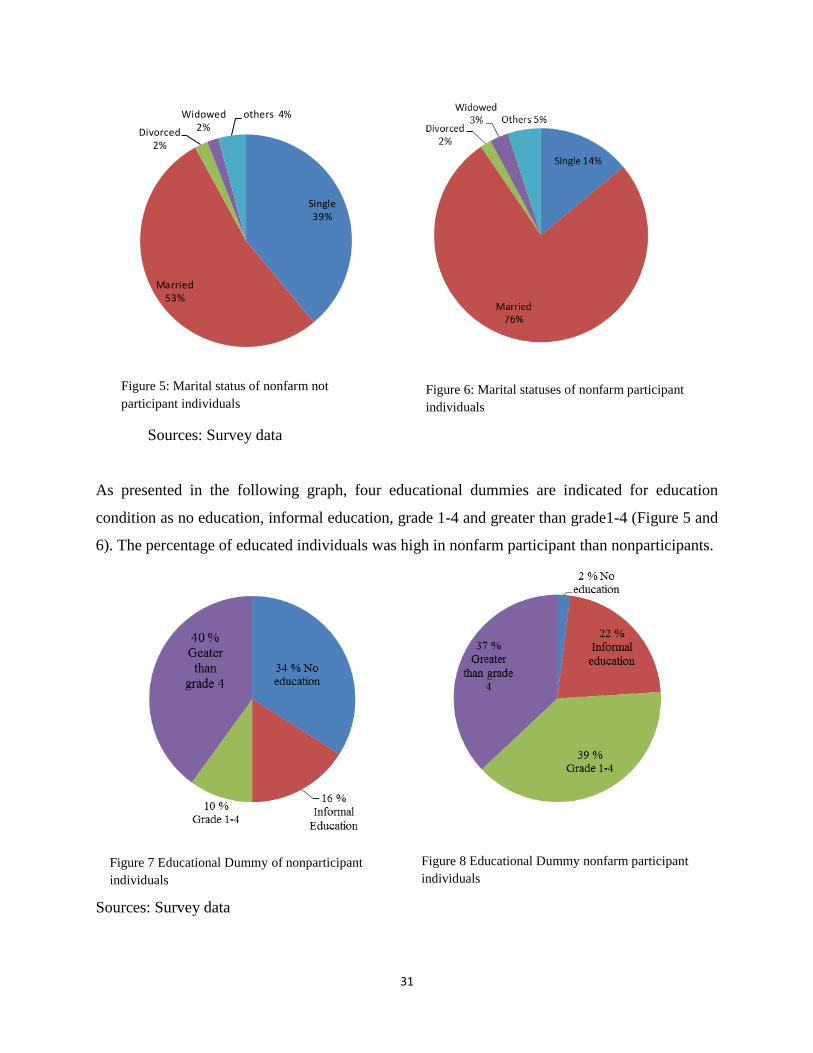
The percentage of married respondents was high in nonfarm participant individuals than
nonparticipants (Figure 5 and 6). The chi-square test (29.290) showed that there was statistically
significant difference between marital status of nonparticipant and participants (at 1% level).
Male
69%
Female
31 %
Figure 3 Sex of nonfarm nonparticipant
individuals Figure 4 Sex of nonfarm participant individuals
31
Sources: Survey data
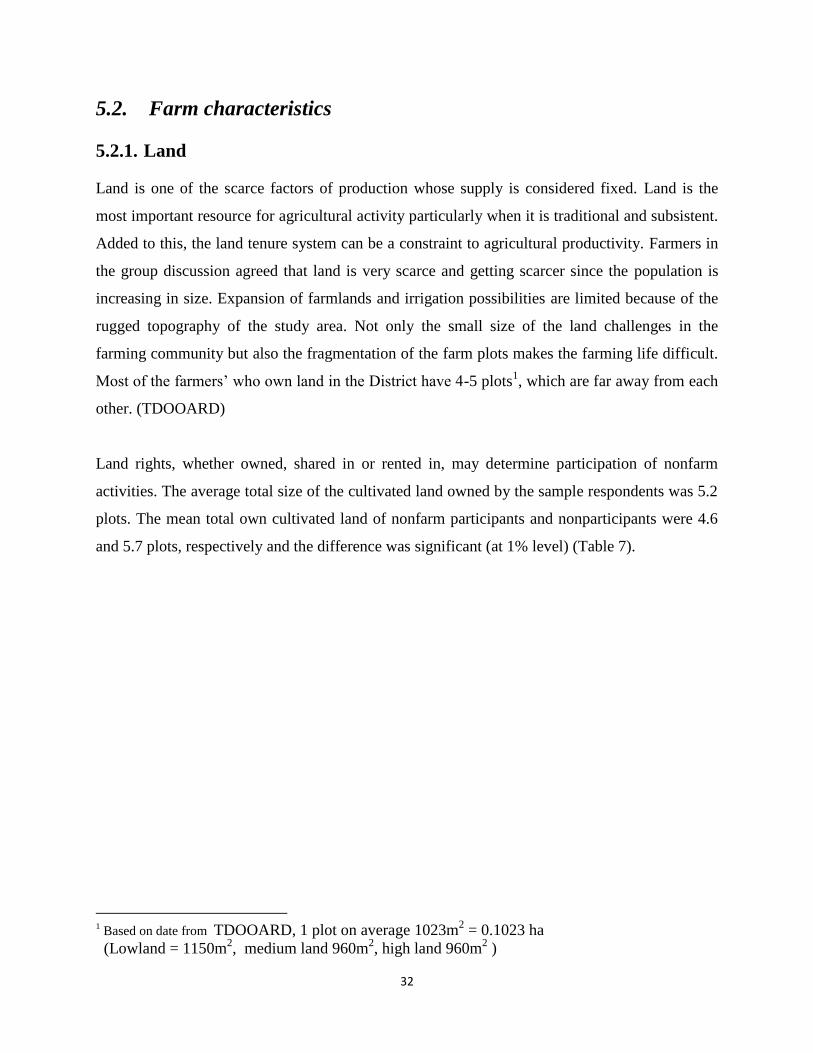
As presented in the following graph, four educational dummies are indicated for education
condition as no education, informal education, grade 1-4 and greater than grade1-4 (Figure 5 and
6). The percentage of educated individuals was high in nonfarm participant than nonparticipants.
Sources: Survey data
Single39%
Married53%
Divorced2%
Widowed2%
others 4%
Figure 5: Marital status of nonfarm not
participant individuals Figure 6: Marital statuses of nonfarm participant
individuals
Figure 7 Educational Dummy of nonparticipant
individuals
Figure 8 Educational Dummy nonfarm participant
individuals
32
5.2. Farm characteristics
5.2.1. Land
Land is one of the scarce factors of production whose supply is considered fixed. Land is the
most important resource for agricultural activity particularly when it is traditional and subsistent.
Added to this, the land tenure system can be a constraint to agricultural productivity. Farmers in
the group discussion agreed that land is very scarce and getting scarcer since the population is
increasing in size. Expansion of farmlands and irrigation possibilities are limited because of the
rugged topography of the study area. Not only the small size of the land challenges in the
farming community but also the fragmentation of the farm plots makes the farming life difficult.
Most of the farmers’ who own land in the District have 4-5 plots1, which are far away from each
other. (TDOOARD)
Land rights, whether owned, shared in or rented in, may determine participation of nonfarm
activities. The average total size of the cultivated land owned by the sample respondents was 5.2
plots. The mean total own cultivated land of nonfarm participants and nonparticipants were 4.6
and 5.7 plots, respectively and the difference was significant (at 1% level) (Table 7).
1 Based on date from TDOOARD, 1 plot on average 1023m
2 = 0.1023 ha
(Lowland = 1150m2, medium land 960m
2, high land 960m
2 )
33
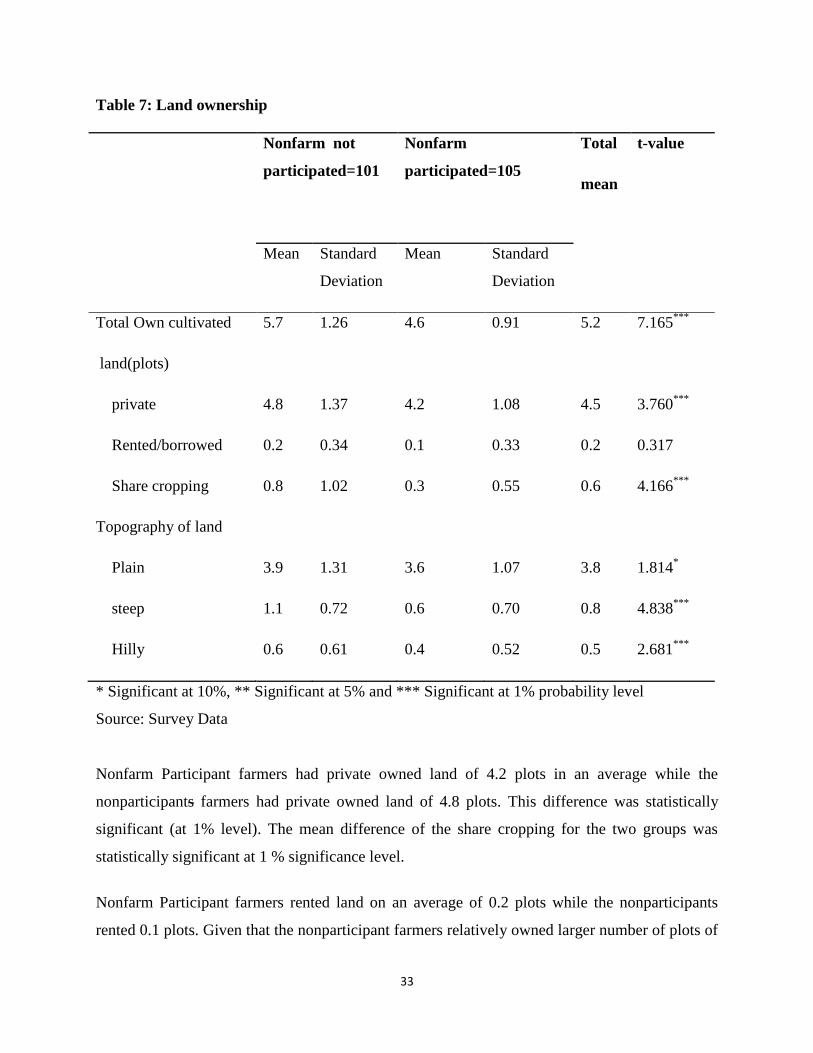
Table 7: Land ownership
Nonfarm not
participated=101
Nonfarm
participated=105
Total
mean
t-value
Mean Standard
Deviation
Mean Standard
Deviation
Total Own cultivated
land(plots)
5.7 1.26 4.6 0.91 5.2 7.165***
private 4.8 1.37 4.2 1.08 4.5 3.760***
Rented/borrowed 0.2 0.34 0.1 0.33 0.2 0.317
Share cropping 0.8 1.02 0.3 0.55 0.6 4.166***
Topography of land
Plain 3.9 1.31 3.6 1.07 3.8 1.814*
steep 1.1 0.72 0.6 0.70 0.8 4.838***
Hilly 0.6 0.61 0.4 0.52 0.5 2.681***
* Significant at 10%, ** Significant at 5% and *** Significant at 1% probability level
Source: Survey Data
Nonfarm Participant farmers had private owned land of 4.2 plots in an average while the
nonparticipants farmers had private owned land of 4.8 plots. This difference was statistically
significant (at 1% level). The mean difference of the share cropping for the two groups was
statistically significant at 1 % significance level.
Nonfarm Participant farmers rented land on an average of 0.2 plots while the nonparticipants
rented 0.1 plots. Given that the nonparticipant farmers relatively owned larger number of plots of
34
cultivated land than the nonfarm participants, it can be said that land ownership has an influence
on nonfarm participation.
Apart from its size, quality of land is an important attribute of production and productivity. The
sample respondents were asked about topography of their land. The average total size of the land
owned by the sample respondents, 3.8 plots were Plain topography (Table7).
5.2.2. Cropping pattern and Crop production
The farming system of the district is predominantly mixed farming, consisting of both crop
production and livestock rearing. Crop production is the major activity by which life mainly
depends upon. In the district both annual and perennial crops are grown on all altitudinal
variations. The diverse altitudinal variations and socio-economic conditions have allowed the
production of different cereals, pulses, fruits and oil crops. Generally the district is part a teff-
sorghum production belt area. There are also some horticultural crops like orange, papaya, chat
and some vegetables produced in around the lakes and riverbanks (TDOOARD). Based on the
discussion with farmers and agricultural experts, the productivity of the crops is very low and
most farmers had the experience of failure of crop production. Environmental problems taking
the primary cause for the failure of the crop production while crop diseases and pest have also a
significant share for the loss of production and productivity.
5.2.3. Livestock
According to the data from the district office of agriculture and rural development, out of the
total agricultural production in the study area, livestock contributed to 30 % of household
income. Farmers use livestock as a coping up strategy at the time of food shortage. In the study
area livestock are used for different purposes which include draught power (cultivation,
transport, packing, threshing) milk and meat production, for hides and skin, for fuel, manure, etc.
Cattle provide draft power for crop cultivation, manure for household fuel and organic fertilizer,
meat and milk for consumption, and other products like hides and skins. Pack animals such as
donkeys, horses, and mules are used for transporting loads and human beings. Small ruminants
are needed to meet immediate cash demand of the households and also for meat production for
household consumption, especially during holidays. Poultry are kept for egg and meat production
35
both for cash and home consumption. The slaughtering of animals in greater numbers for
religious festivals (“Arefa, Mowlid, and fasika”) resulted in depletion of the drought power for
farming.
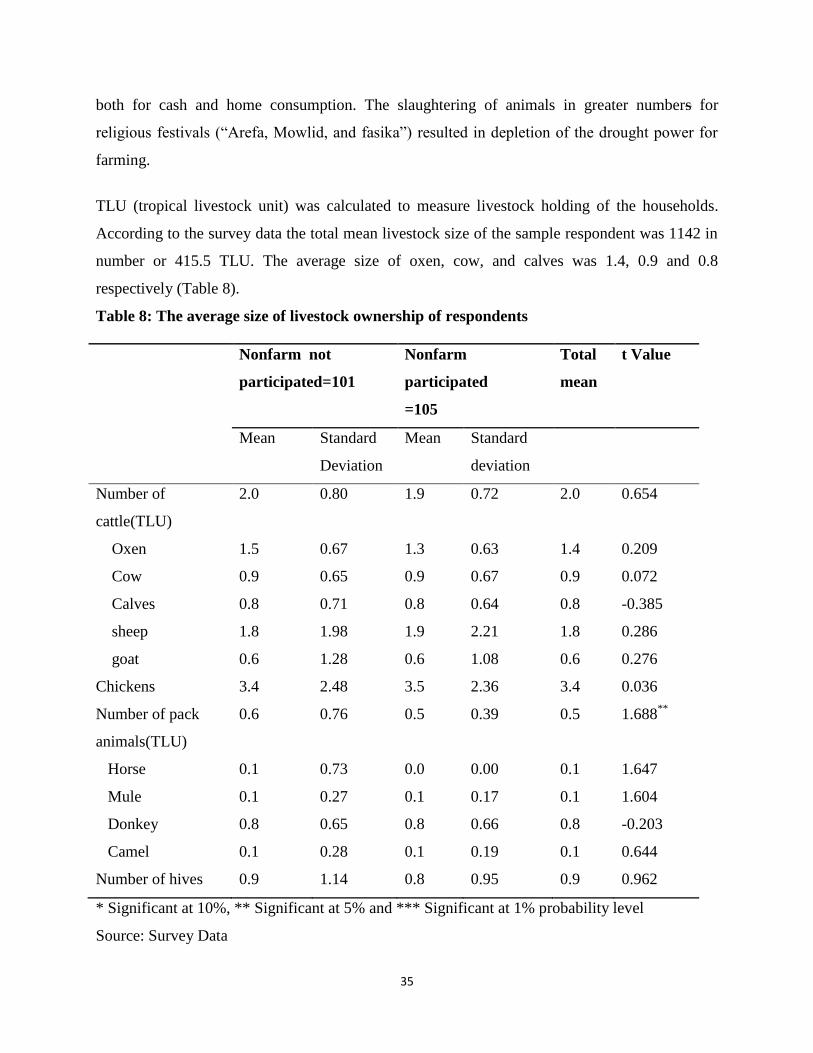
TLU (tropical livestock unit) was calculated to measure livestock holding of the households.
According to the survey data the total mean livestock size of the sample respondent was 1142 in
number or 415.5 TLU. The average size of oxen, cow, and calves was 1.4, 0.9 and 0.8
respectively (Table 8).
Table 8: The average size of livestock ownership of respondents
Nonfarm not
participated=101
Nonfarm
participated
=105
Total
mean
t Value
Mean Standard
Deviation
Mean Standard
deviation
Number of
cattle(TLU)
2.0 0.80 1.9 0.72 2.0 0.654
Oxen 1.5 0.67 1.3 0.63 1.4 0.209
Cow 0.9 0.65 0.9 0.67 0.9 0.072
Calves 0.8 0.71 0.8 0.64 0.8 -0.385
sheep 1.8 1.98 1.9 2.21 1.8 0.286
goat 0.6 1.28 0.6 1.08 0.6 0.276
Chickens 3.4 2.48 3.5 2.36 3.4 0.036
Number of pack
animals(TLU)
0.6 0.76 0.5 0.39 0.5 1.688**
Horse 0.1 0.73 0.0 0.00 0.1 1.647
Mule 0.1 0.27 0.1 0.17 0.1 1.604
Donkey 0.8 0.65 0.8 0.66 0.8 -0.203
Camel 0.1 0.28 0.1 0.19 0.1 0.644
Number of hives 0.9 1.14 0.8 0.95 0.9 0.962
* Significant at 10%, ** Significant at 5% and *** Significant at 1% probability level
Source: Survey Data
36
The mean size of cattle for the nonfarm participant was a less than nonparticipant which was 1.9
and 2.0 respectively with the standard deviation of 0.72 and 0.80. The mean size of Pack animals
for participants was 0.5 and for nonparticipants it was 0.6. There was statistically significant (at
5% level) difference between the mean size of pack animals in nonfarm participant and
nonparticipant households. Given that the nonparticipant farmers relatively owned larger number
of pack animals than the nonfarm participant (Table 8).
The mean size of number of chickens for participants was 3.5 and for nonparticipants it was 3.4.
There was not statistically significant difference between the mean sizes of chickens. The mean
size of number of hives for participants was 0.8 and for nonparticipants it was 0.9. There was not
statistically significant difference between the mean sizes of number of hives (Table 8).
The major livestock problem in the study area was lack of grazing land. Besides this, prevalence
of pest and diseases, lack of water, wild animals attack and poor breed were the other problems
reported by the sample farmers.
In general, the agricultural sector of the district is characterized by small farms, scarcity of land
for expansion, low yield, and shortage of draught animals and lack of adequate grazing land. To
this affect, the farming economy is not in a position to feed and sustain the increasing population
of the area. Therefore, farmer’s engagement in nonfarm activities is of paramount importance to
supplement the farm income and improve the living conditions of the community.
5.3. Characteristics of non-farm activities
Nonfarm activities have an important role in household economy. Under credit constraint and
risky environment, nonfarm income can increase household’s farm productivity by mitigating
risk and promoting farm investment (Evans and Ngau 1991) and finance consumption. Nonfarm
income provides farm households with insurance against the risk of farming and thereby
enabling them to adopt new technologies. More importantly, nonfarm activities offer cyclical
and seasonal employment to supplement meager farm incomes in many drought prone areas of
Africa. Therefore this section explores the characteristics of nonfarm employment in the study
area.
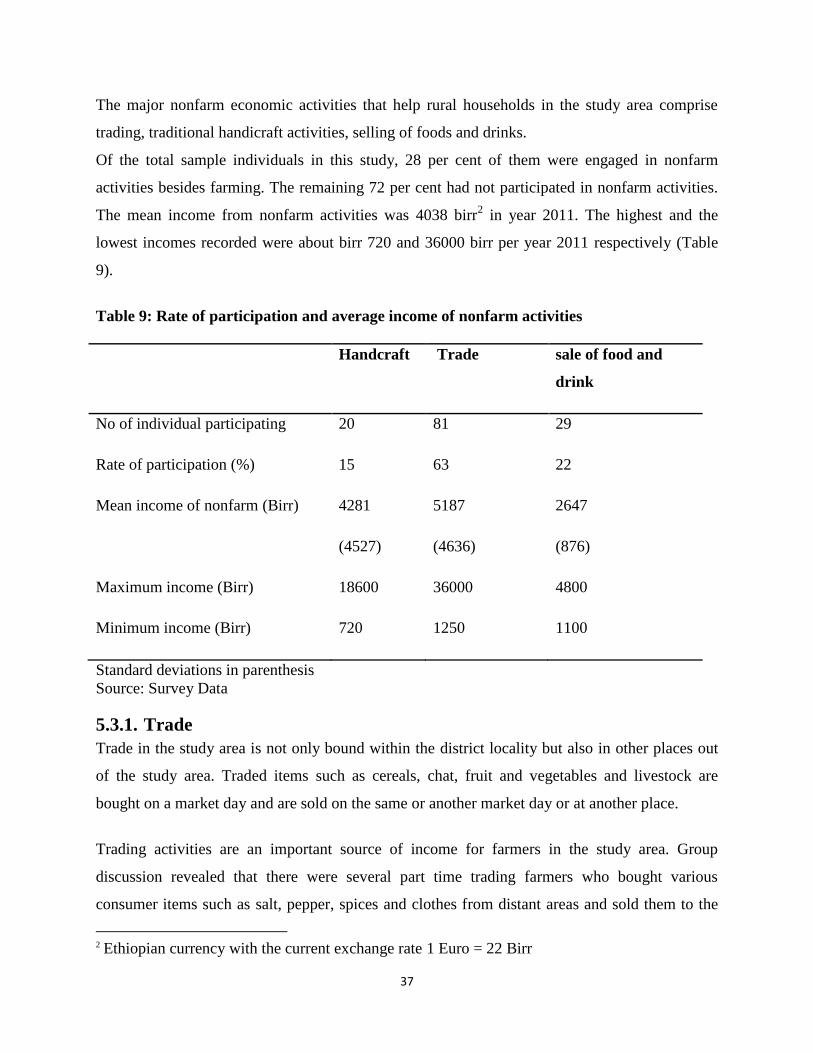
37
The major nonfarm economic activities that help rural households in the study area comprise
trading, traditional handicraft activities, selling of foods and drinks.
Of the total sample individuals in this study, 28 per cent of them were engaged in nonfarm
activities besides farming. The remaining 72 per cent had not participated in nonfarm activities.
The mean income from nonfarm activities was 4038 birr2 in year 2011. The highest and the
lowest incomes recorded were about birr 720 and 36000 birr per year 2011 respectively (Table
9).
Table 9: Rate of participation and average income of nonfarm activities
Handcraft Trade sale of food and
drink
No of individual participating 20 81 29
Rate of participation (%) 15 63 22
Mean income of nonfarm (Birr) 4281 5187 2647
(4527) (4636) (876)
Maximum income (Birr) 18600 36000 4800
Minimum income (Birr) 720 1250 1100
Standard deviations in parenthesis
Source: Survey Data
5.3.1. Trade
Trade in the study area is not only bound within the district locality but also in other places out
of the study area. Traded items such as cereals, chat, fruit and vegetables and livestock are
bought on a market day and are sold on the same or another market day or at another place.
Trading activities are an important source of income for farmers in the study area. Group
discussion revealed that there were several part time trading farmers who bought various
consumer items such as salt, pepper, spices and clothes from distant areas and sold them to the
2 Ethiopian currency with the current exchange rate 1 Euro = 22 Birr
38
local community. The long distance trade involves visit to places like Dessie, woldya which is
about 40 km and 90 km respectively from the study area, and the traded goods include chat,
cereals, fruit and vegetable, small ruminant animal trade, skins and retailer’s commodity trade.
The survey result shows that 63 per cent of the individuals participating in nonfarm activity were
engaged in trade. The mean annual income from trade was about 5187 birr with a minimum and
a maximum of 1250 birr and 36000 birr, respectively (table 9). The dominant forms of trade
items include cash crop trade, grain trade, cattle trade, livestock trade and animal bi-product,
retailer’s commodity trades. In transporting traded items, vehicles transportation, self-carried,
transportation animals such horses, mules and donkey, and hired labour are play an important
role.
Trade as a source of income for the farmers was hindered by certain constraints. According to
farmers, the main bottlenecks for trade activity in the study area were lack of initial capital, lack
of skill and access to market, and lack of back animals.
5.3.2. Handicraft activities
There are a number of crafting activities in which farmers can potentially participate in the study
area. Among the non-farm participant farmers 15 per cent were engaged in crafting activities.
These include pottery, carpentry, masonry, cementing, blacksmiths, tannery and weaving. Craft
workers produce clothes, iron-tips, knives, simple chisels, axes, water and cooking pots for the
community.
Group discussion indicated that most of individuals undertake handicraft activity as supporting
of agricultural income. The survey result indicates, the mean annual income from handicraft
activities of sample respondent was 4281 birr, the highest and the minimum income reported
were 18600 birr and 720 birr respectively (table 9).
As the respondents engaged in the handicraft activities reported, they learnt the skill of the work
from family, neighbours or friends and training/ education.
39
5.3.3. Sale of food and local drinks
Sale of food and local drinks is mostly practiced in most villages and rural towns. About 22 per
cent of those who participated in nonfarm activities were engaged in sale of food and local
drinks. When compared with other nonfarm activities, females dominate in the sale of food and
local drinks than males. The mean annual income reported from sale of food and local drinks
was 2647 birr with a minimum of 1100 and a maximum of 4800 birr (table 9).
The major problems reported by the respondents regarding of this activity included lack of initial
capital to undertake the activity , lack of market for the produce, and lack of skills. Group
discussion with the farmers revealed that most of them were engaged in the sale of food and
local drinks to supplement the agricultural income. The respondents undertake this activity
integrating it with the farming activity.
The foregoing discussion has revealed that nonfarm activity which includes trade, handicraft,
sale of food and local drinks and other sources of income is widely undertaken in the study area.
These activities are localized and highly agriculture based. Households engaged in these
activities could benefit more if they get favourable environment for the sector. The main
bottlenecks that hamper the development of nonfarm activities reported by the farmers include
capital, transportation, and access to market.
5.4. Econometric estimates of non-farm participation
The dependent variables measure participation for each non-farm activity. These activities are
handcraft activities, trade activities and sale of food and drink. The independent variables show
assets, household characteristics, individual characteristics, time endowment and price proxy.
The description is presented in the table 10.
Econometric results
The estimation of the multivariate probit model is shown below in table 10. A total of 15
explanatory variables in five groups (asset, household characteristics, individual characteristics,
time endowment and price proxy) were considered in the economic model. Out of these, 7, 8 and
8 variables were found to have a significant influence on the participation of handicraft, trade
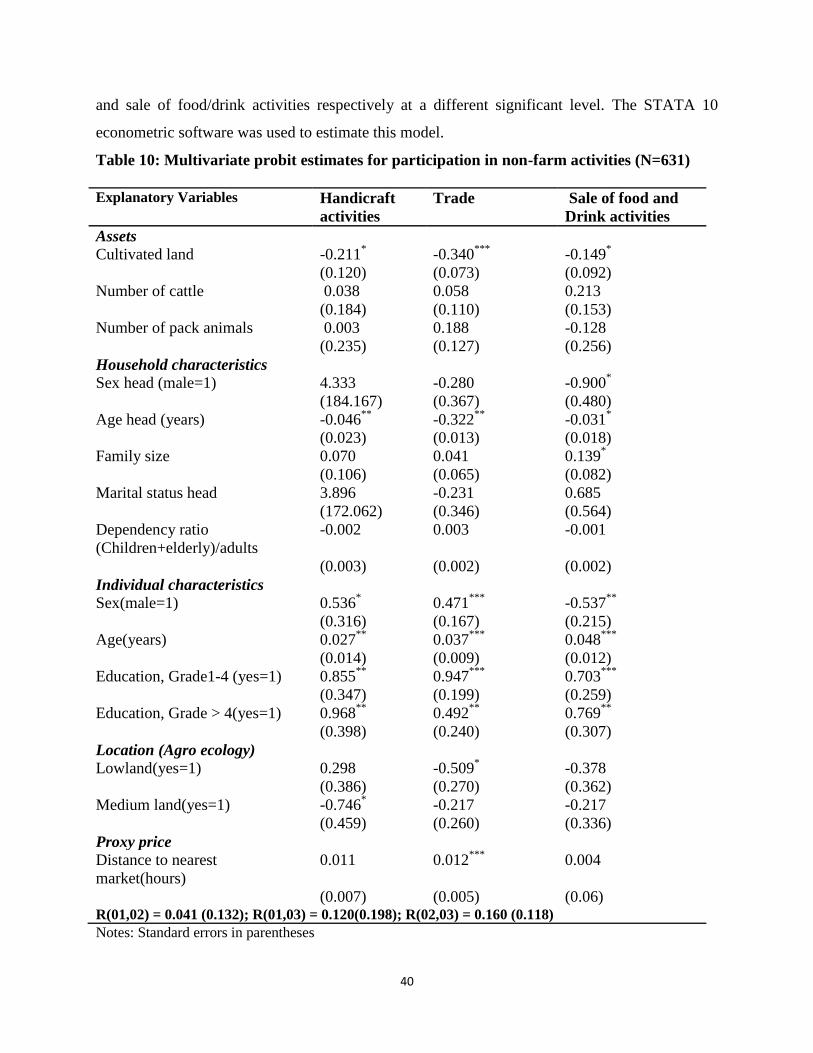
40
and sale of food/drink activities respectively at a different significant level. The STATA 10
econometric software was used to estimate this model.
Table 10: Multivariate probit estimates for participation in non-farm activities (N=631)
Explanatory Variables Handicraft
activities
Trade Sale of food and
Drink activities
Assets
Cultivated land -0.211*
-0.340***
-0.149*
(0.120) (0.073) (0.092)
Number of cattle 0.038 0.058 0.213
(0.184) (0.110) (0.153)
Number of pack animals 0.003 0.188 -0.128
(0.235) (0.127) (0.256)
Household characteristics
Sex head (male=1) 4.333 -0.280 -0.900*
(184.167) (0.367) (0.480)
Age head (years) -0.046**
-0.322**
-0.031*
(0.023) (0.013) (0.018)
Family size 0.070 0.041 0.139*
(0.106) (0.065) (0.082)
Marital status head 3.896 -0.231 0.685
(172.062) (0.346) (0.564)
Dependency ratio
(Children+elderly)/adults
-0.002 0.003 -0.001
(0.003) (0.002) (0.002)
Individual characteristics
Sex(male=1) 0.536*
0.471***
-0.537**
(0.316) (0.167) (0.215)
Age(years) 0.027**
0.037***
0.048***
(0.014)
(0.009) (0.012)
Education, Grade1-4 (yes=1) 0.855**
0.947***
0.703***
(0.347) (0.199) (0.259)
Education, Grade > 4(yes=1) 0.968**
0.492**
0.769**
(0.398) (0.240) (0.307)
Location (Agro ecology)
Lowland(yes=1) 0.298
-0.509* -0.378
(0.386) (0.270) (0.362)
Medium land(yes=1) -0.746*
-0.217 -0.217
(0.459) (0.260) (0.336)
Proxy price
Distance to nearest
market(hours)
0.011
0.012***
0.004
(0.007) (0.005) (0.06) R(01,02) = 0.041 (0.132); R(01,03) = 0.120(0.198); R(02,03) = 0.160 (0.118)
Notes: Standard errors in parentheses
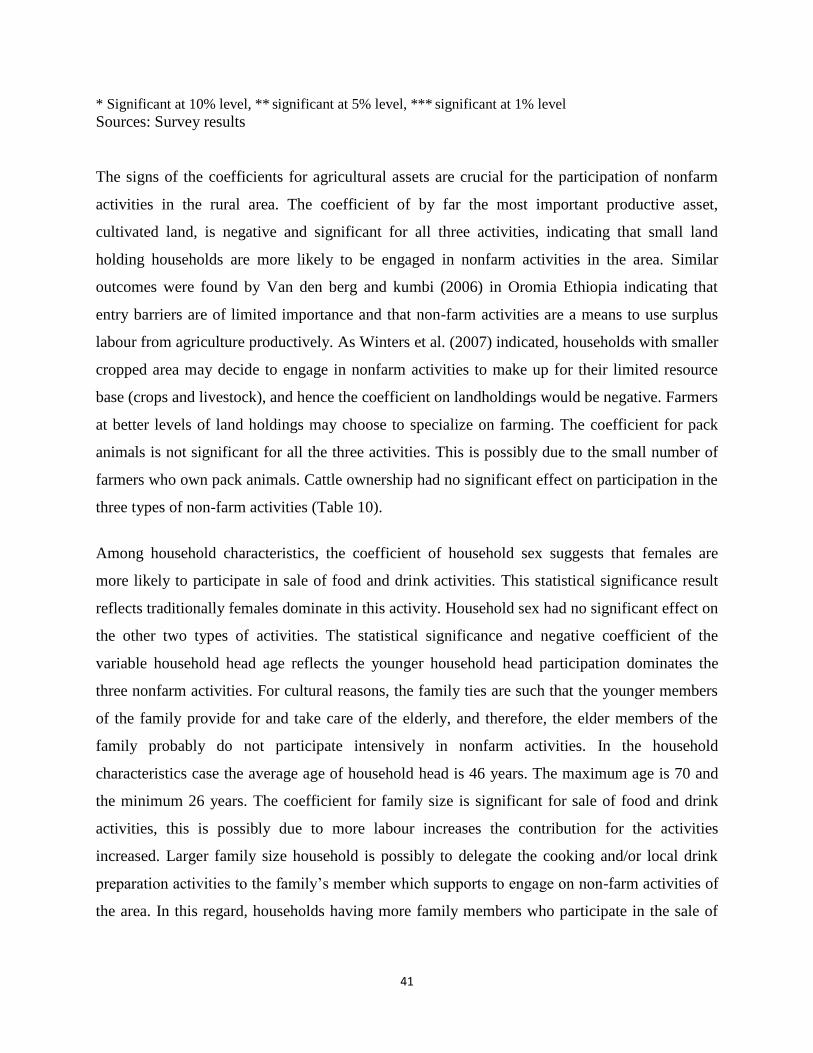
41
* Significant at 10% level, ** significant at 5% level, *** significant at 1% level
Sources: Survey results
The signs of the coefficients for agricultural assets are crucial for the participation of nonfarm
activities in the rural area. The coefficient of by far the most important productive asset,
cultivated land, is negative and significant for all three activities, indicating that small land
holding households are more likely to be engaged in nonfarm activities in the area. Similar
outcomes were found by Van den berg and kumbi (2006) in Oromia Ethiopia indicating that
entry barriers are of limited importance and that non-farm activities are a means to use surplus
labour from agriculture productively. As Winters et al. (2007) indicated, households with smaller
cropped area may decide to engage in nonfarm activities to make up for their limited resource
base (crops and livestock), and hence the coefficient on landholdings would be negative. Farmers
at better levels of land holdings may choose to specialize on farming. The coefficient for pack
animals is not significant for all the three activities. This is possibly due to the small number of
farmers who own pack animals. Cattle ownership had no significant effect on participation in the
three types of non-farm activities (Table 10).
Among household characteristics, the coefficient of household sex suggests that females are
more likely to participate in sale of food and drink activities. This statistical significance result
reflects traditionally females dominate in this activity. Household sex had no significant effect on
the other two types of activities. The statistical significance and negative coefficient of the
variable household head age reflects the younger household head participation dominates the
three nonfarm activities. For cultural reasons, the family ties are such that the younger members
of the family provide for and take care of the elderly, and therefore, the elder members of the
family probably do not participate intensively in nonfarm activities. In the household
characteristics case the average age of household head is 46 years. The maximum age is 70 and
the minimum 26 years. The coefficient for family size is significant for sale of food and drink
activities, this is possibly due to more labour increases the contribution for the activities
increased. Larger family size household is possibly to delegate the cooking and/or local drink
preparation activities to the family’s member which supports to engage on non-farm activities of
the area. In this regard, households having more family members who participate in the sale of
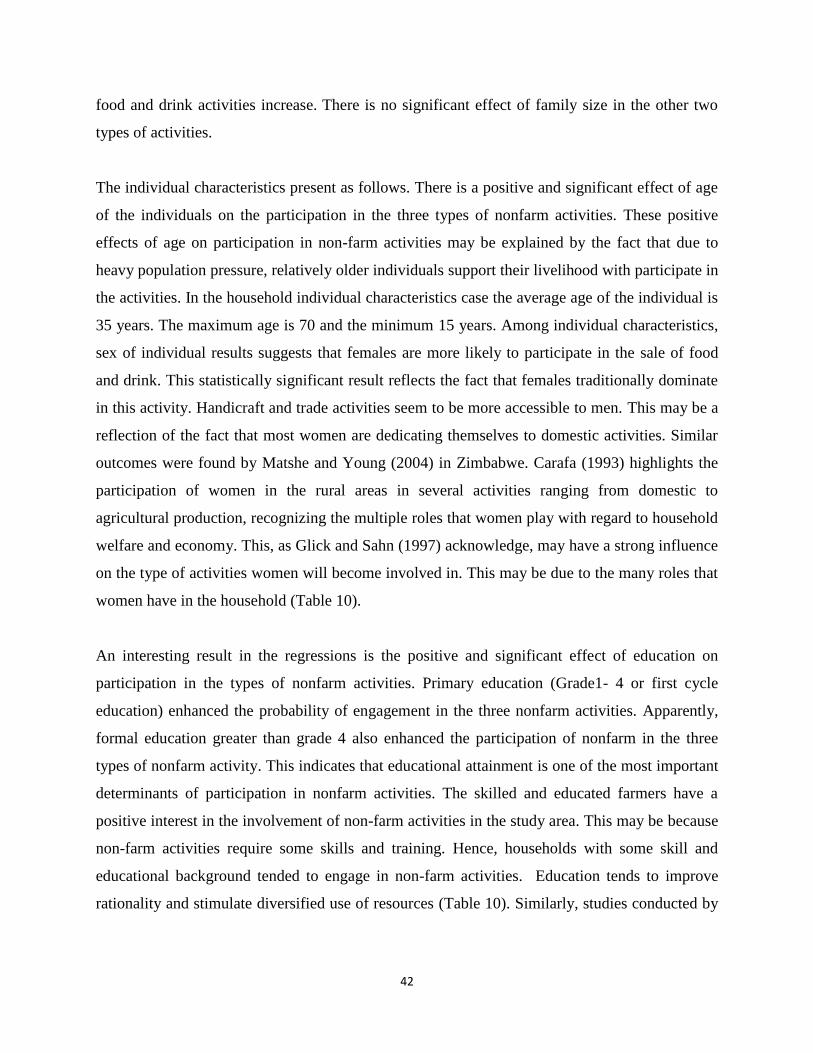
42
food and drink activities increase. There is no significant effect of family size in the other two
types of activities.
The individual characteristics present as follows. There is a positive and significant effect of age
of the individuals on the participation in the three types of nonfarm activities. These positive
effects of age on participation in non-farm activities may be explained by the fact that due to
heavy population pressure, relatively older individuals support their livelihood with participate in
the activities. In the household individual characteristics case the average age of the individual is
35 years. The maximum age is 70 and the minimum 15 years. Among individual characteristics,
sex of individual results suggests that females are more likely to participate in the sale of food
and drink. This statistically significant result reflects the fact that females traditionally dominate
in this activity. Handicraft and trade activities seem to be more accessible to men. This may be a
reflection of the fact that most women are dedicating themselves to domestic activities. Similar
outcomes were found by Matshe and Young (2004) in Zimbabwe. Carafa (1993) highlights the
participation of women in the rural areas in several activities ranging from domestic to
agricultural production, recognizing the multiple roles that women play with regard to household
welfare and economy. This, as Glick and Sahn (1997) acknowledge, may have a strong influence
on the type of activities women will become involved in. This may be due to the many roles that
women have in the household (Table 10).
An interesting result in the regressions is the positive and significant effect of education on
participation in the types of nonfarm activities. Primary education (Grade1- 4 or first cycle
education) enhanced the probability of engagement in the three nonfarm activities. Apparently,
formal education greater than grade 4 also enhanced the participation of nonfarm in the three
types of nonfarm activity. This indicates that educational attainment is one of the most important
determinants of participation in nonfarm activities. The skilled and educated farmers have a
positive interest in the involvement of non-farm activities in the study area. This may be because
non-farm activities require some skills and training. Hence, households with some skill and
educational background tended to engage in non-farm activities. Education tends to improve
rationality and stimulate diversified use of resources (Table 10). Similarly, studies conducted by
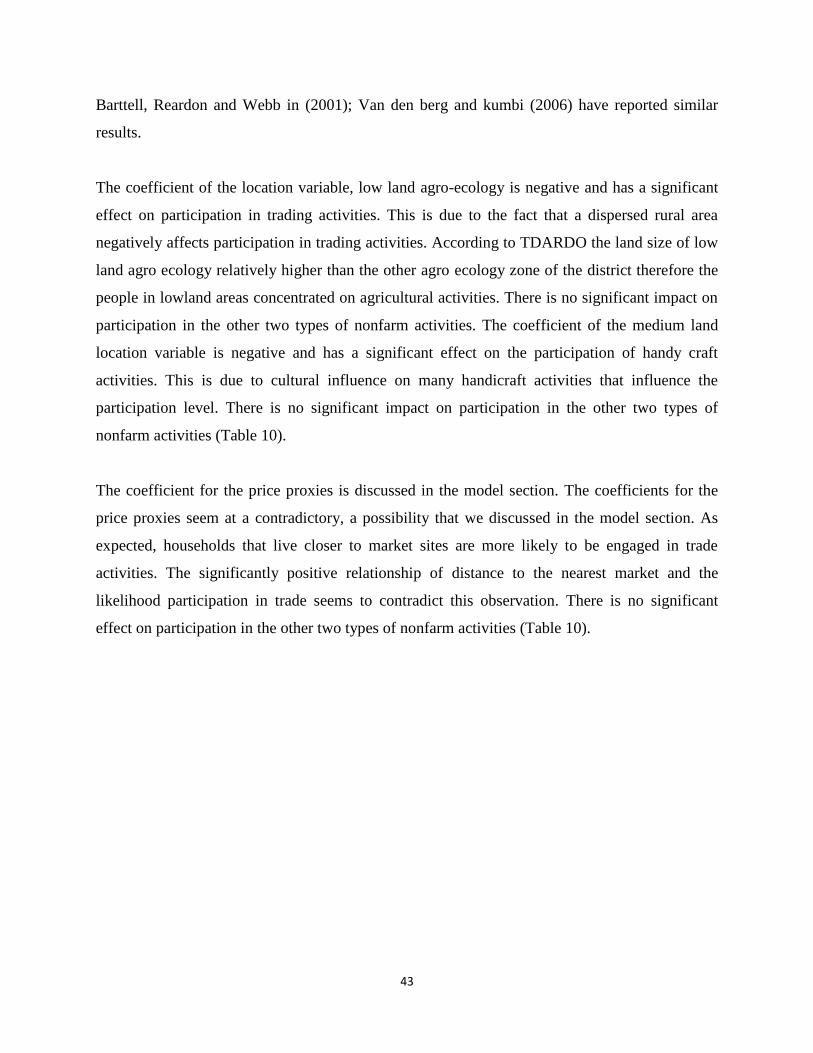
43
Barttell, Reardon and Webb in (2001); Van den berg and kumbi (2006) have reported similar
results.
The coefficient of the location variable, low land agro-ecology is negative and has a significant
effect on participation in trading activities. This is due to the fact that a dispersed rural area
negatively affects participation in trading activities. According to TDARDO the land size of low
land agro ecology relatively higher than the other agro ecology zone of the district therefore the
people in lowland areas concentrated on agricultural activities. There is no significant impact on
participation in the other two types of nonfarm activities. The coefficient of the medium land
location variable is negative and has a significant effect on the participation of handy craft
activities. This is due to cultural influence on many handicraft activities that influence the
participation level. There is no significant impact on participation in the other two types of
nonfarm activities (Table 10).
The coefficient for the price proxies is discussed in the model section. The coefficients for the
price proxies seem at a contradictory, a possibility that we discussed in the model section. As
expected, households that live closer to market sites are more likely to be engaged in trade
activities. The significantly positive relationship of distance to the nearest market and the
likelihood participation in trade seems to contradict this observation. There is no significant
effect on participation in the other two types of nonfarm activities (Table 10).
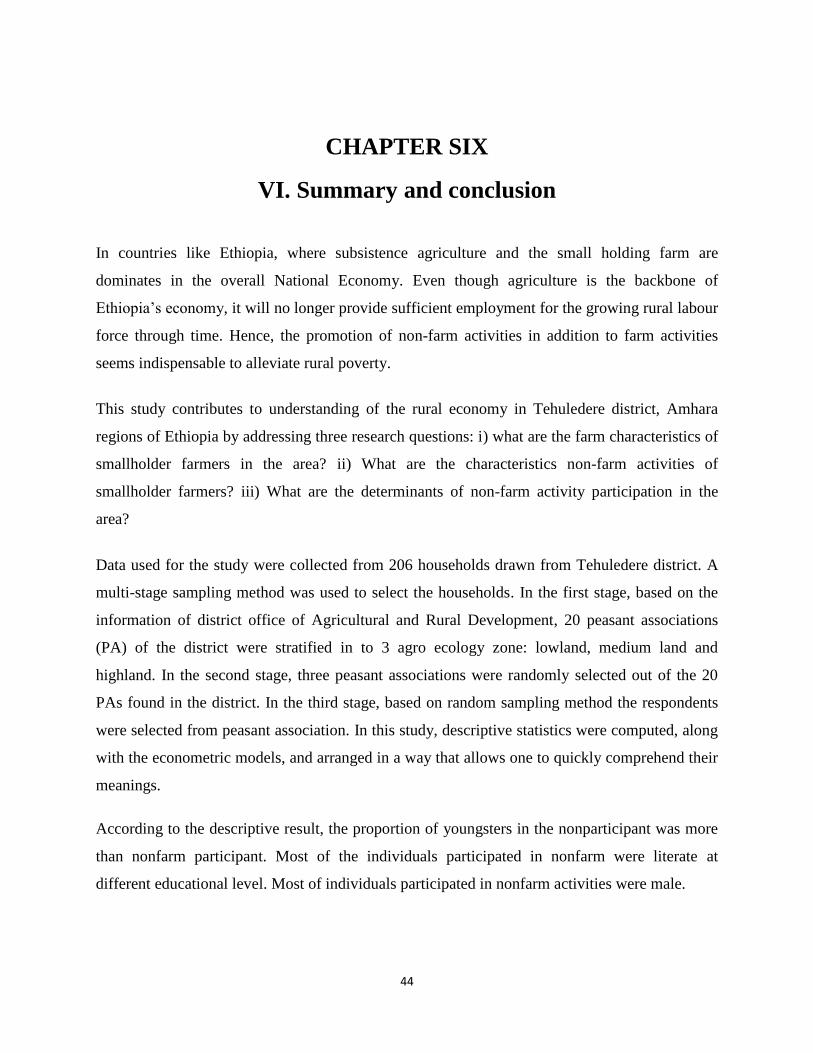
44
CHAPTER SIX
VI. Summary and conclusion
In countries like Ethiopia, where subsistence agriculture and the small holding farm are
dominates in the overall National Economy. Even though agriculture is the backbone of
Ethiopia’s economy, it will no longer provide sufficient employment for the growing rural labour
force through time. Hence, the promotion of non-farm activities in addition to farm activities
seems indispensable to alleviate rural poverty.
This study contributes to understanding of the rural economy in Tehuledere district, Amhara
regions of Ethiopia by addressing three research questions: i) what are the farm characteristics of
smallholder farmers in the area? ii) What are the characteristics non-farm activities of
smallholder farmers? iii) What are the determinants of non-farm activity participation in the
area?
Data used for the study were collected from 206 households drawn from Tehuledere district. A
multi-stage sampling method was used to select the households. In the first stage, based on the
information of district office of Agricultural and Rural Development, 20 peasant associations
(PA) of the district were stratified in to 3 agro ecology zone: lowland, medium land and
highland. In the second stage, three peasant associations were randomly selected out of the 20
PAs found in the district. In the third stage, based on random sampling method the respondents
were selected from peasant association. In this study, descriptive statistics were computed, along
with the econometric models, and arranged in a way that allows one to quickly comprehend their
meanings.
According to the descriptive result, the proportion of youngsters in the nonparticipant was more
than nonfarm participant. Most of the individuals participated in nonfarm were literate at
different educational level. Most of individuals participated in nonfarm activities were male.
45
Land is one of the scarce factors of production whose supply is considered fixed. Land is the
most important resource for agricultural activity particularly when it is traditional and subsistent.
Added to this, the land tenure system can be a constraint to agricultural productivity. Farmers in
the group discussion agreed that land is very scarce and getting scarcer since the population is
increasing in size. Expansion of farmlands and irrigation possibilities to increase production
were difficult because of the rugged topography. Not only the small size of the land challenges
in the farming community but also the fragmentation of the farm plots makes the farming life
difficult. Most of the farmers who own land in the district have 4-5 plots, which are far away
from each other. (TDOOARD)
The farming system of the district is predominantly mixed farming, consisting of both crop
production and livestock rearing. Crop production is the major activity by which life mainly
depends upon.
The major nonfarm economic activities that help rural households in the study area comprise
trading, traditional handicraft activities, and selling of foods and drinks. According to the
descriptive result, 28 per cent individuals reported that they were engaged in nonfarm activities
besides the farming. The mean income from nonfarm activities was found to be 4038 birr in year
2011. The highest and the lowest incomes recorded were about birr 720 and 36000 birr per year
2011 respectively.
Regarding the determinants of participation in nonfarm activities, a total of 15 explanatory
variables in five groups (asset, household characteristics, individual characteristics, time
endowment, and price proxy) were considered in the economic model. The results of the
multivariate probit model revealed that 7, 8 and 8 variables were found to be significant effect on
the participation of handicraft, trade and sale of food/drink activities respectively at different
significant level.
According to regression result cultivated land, Education, age of household head and sex of
individual characteristics were significant in the three types of activities. The conclusions were
given based on core significant variables.
46
The coefficient of cultivated land is negative and significant for all three activities, indicating
that small land holding households are more likely to be engaged in the non-farm activities in the
area. The growth in population has resulted in a smaller farm size. The coefficient of household
age was negatively related with participation in nonfarm activities. This is because, younger farm
household heads cannot get enough land to support their livelihood compared to the older farm
households. Therefore the younger households head have to rely more on nonfarm employment
than the older ones to support their livelihood. The variable education also had a positive and
significant influence on participation in nonfarm activities. Nonfarm activities require some skill
and training hence households with some skills and education tend to engage in non-farm
activities.
Understanding the determinants of nonfarm activities and the characteristics of the farm and
nonfarm activities would help policy makers to design and implement more effective policies
and programs for non-farm enterprises.
Based on the findings of the study, the following points need to be considered as possible
poverty alleviates strategy. The rural development strategy should not only emphasis in
increasing agricultural production but concomitant attention should be given in promoting non-
farm activities in the rural areas. The promotion of non-farm activities in addition to farm
activities seems indispensable to alleviate rural poverty.
The second findings of the study also revealed that educated farmers are more likely to involve
in non-farm activities. Thus education could be an effective instrument in increasing
participation in non-farm activities. Therefore the task of upgrading the skills and production
techniques of local farmers should be given a special attention. Development programs to
promote non-agricultural employment should focus on the establishment of skill training centres
at local level.
47
Reference
ABDULAI, A. & DELGADO, C. L. (1999) Determinants of nonfarm earnings of farm-based
husbands and wives in Northern Ghana. American Journal of Agricultural Economics,
81, 117-130.
ALEMU, B. A., NUPPENAU, E. & BOLAND, H. (2008) Technical Efficiency of Farming
Systems across Agro-ecological Zones in Ethiopia: An Application of Stochastic Frontier
Analysis.
ANDERSEN, D & LEISERSO, M. W. (1980) Rural Non-farm Employment in Developing
Countries. Economic Development and cultural change, 28, 227-248.
BARRET, C. B., REARDON, T. & WEBB, P. (2001) Nonfarm income diversification and
household livelihood strategies in rural Africa: concepts, dynamics, and policy
implications. Food policy, 26, 315-331.
BEZU, S. & HOLDEN, S. (2008) Can food-for-work encourage agricultural production? Food
policy, 33, 541-549.
CAILLAVET, F., GUYOMARD, H. & Lifran R. (1994). Agricultural Household Modelling and
Family Economics. Developments in Agricultural Economics, Elsevier.
CARSWELL, G. (2002) Livelihood diversification: increasing in importance or increasingly
recognized? Evidence from southern Ethiopia. Journal of International Development, 14,
789-804.
CSA (2007) Household Income, Consumption & Expenditure (HICE) Survey 2004/5: Analytical
Report. Statistical Bulletin. Central Statistical Agency of Ethiopia.
CSA (2009). National Strategy for the Development of Statistics. Addis Ababa.
CSA (Central Statistics Agency), (2008) ‘Summary and Statistical report of the 2007 population
and housing census’, Addis Ababa, Ethiopia.
CSA & WB (2008). The 2006/2007 Rural Investment Climate Survey: Basic Information
Document. Addis Ababa: processed.
CSAKI, C. & DE HAAN, C. (2003) Reaching the Rural Poor: A Renewed Strategy for Rural
Development, World Bank Publications.
48
DAVIS, B., WINTERS, P., CARLETTO, G., COVARRUBIAS, K., QUINONES, E., ZEZAA,
A., STAMOULIS, K., K. AZZARRI, C. & DIGIUSEPPE, S. (2010) A Cross-Country
Comparison of Rural Income Generating Activities. World Development, 38, 48-63.
ELBERTS, C., &LANJOUW, P. (2001) Intersectoral Transfer, Growth, and Inequality in Rural
Ecuador. World Development, 29, 481-496.
ELLIS, F. (2000) rural livelihoods and diversity in developing countries, Oxford, Oxford
University Press.
ELLIS, F. & BIGGS, S. (2001) Evolving Themes in Rural Development 1950s‐2000s.
Development policy review, 19, 437-448.
EVANS, H. E. & NGAU, P. 1991. Rural‐Urban Relations, Household Income Diversification
and Agricultural Productivity. Development and Change, 22, 519-545.
FEI, J. C. H., RANIS, G. & CENTER, Y. U. E. G. (1964) Development of the labor surplus
economy: Theory and policy, Irwin Homewood, IL.
GLICK, P., SAHN, E. (1997) Gender and Education Impacts on Employment and Earnings in
West Africa: Evidence from Guinea. Economic Development and Cultural Change, 794-
823.
HAGGBLADE, S., HAZELL, P. B. R. & REARDON, T. (2007) Transforming the Rural
Nonfarm Economy. Baltimore: Johns Hopkins University Press and International Food
Policy Research Institute.
HAGGBLADE, S., HAZELL, P. B. R., REARDON, T. A., ENVIRONMENT, I. F. P. R. I. &
DIVISION, P. T. 2002. Strategies for stimulating poverty-alleviating growth in the rural
nonfarm economy in developing countries, International Food Policy Research Institute,
Environmental and Production Technology Division.
HAILEMARIAM, A., ALAYU, S. & TELLER, C. (2011) The National Population Policy (NPP)
of Ethiopia: Achievements, Challenges and Lessons Learned, 1993–2010. The
Demographic Transition and Development in Africa, 303-321.
HAZELL, P. & HAGGBLADE, S. (1993) Farm-nonfarm growth linkages and the welfare of the
poor. Including the poor, 190-204.
HUGUENIN, J., PELGRIN, F. & HOLLY, A. 2009. Estimation of multivariate probit models by
exact maximum likelihood. Working Papers.
ISLAM, R. (1987) Editor. Rural Industrialisation and Employment in Asia. New Delhi:
ILO.
49
JANVRY, A. & SADOULET, E. (2001) Income strategies among rural households in Mexico:
The role of off-farm activities. World Development, 29, 467-480.
JAYNE, T. S., YAMANO, T., WEBER, M. T., TSCHIRLEY, D., BENFICA, R., CHAPOTO,
A. & ZULU, B. (2003) Smallholder income and land distribution in Africa: implications
for poverty reduction strategies. Food policy, 28, 253-275.
JOHNSTON, B. F. & KILBY, P. (1975) Agriculture and structural transformation: Economic
strategies in late-developing countries, Oxford University Press New York.
LANJOUW, J. O. & LANJOUW, P. (1995) Rural Nonfarm Employment. Background paper for
World Development Report 1995 Washington: The World Bank.
LANJOUW, J. O. & LANJOUW, P. (1997) The Rural Non-Farm Employment: A survey .policy
Research working paper No.1463, The World Bank.
LANJOUW, J. O. & LANJOUW, P. (2001) The rural non‐farm sector: issues and evidence from
developing countries. Agricultural economics, 26, 1-23.
LANJOUW, P. & SHARIFF, A. (2002) Rural Non-farm Employment in India: Access, Income
and Poverty Impact. Working Paper series No.81.
LIEDHOLM, C. (2002) Small firm dynamics: evidence from Africa and Latin America. Small
Business Economics, 18, 225-240.
LOENING, J., RIJKERS, B. & SODERBOM, M. (2008) Nonfarm microenterprise performance
and the investment climate: evidence from rural Ethiopia.
LOFGREN, H. & ROBINSON, S. (1999). To Trade or Not to Trade: Non-Separable Farm
Household Models in Partial and General Equilibrium. IFPRI, TMD Discussion Paper ,
37. Washinton, D.C.
MATSHE, I. & Young, T. (2004). Off-farm labour allocation decisions in small-scale rural
households in Zimbabwe. Agricultural Economics, 30, 175-186.
MATSUMOTO, T., KIJIMA, Y. & YAMANO, T. (2006) the role of local nonfarm activities and
migration in reducing poverty: evidence from Ethiopia, Kenya, and Uganda. Agricultural
economics, 35, 449-458.
MDUMA, J. K. & WOBST, P. (2005) Determinants of rural labor market participation in
Tanzania. African Studies Quarterly, 8, 32-47.
MEYER, R. L. (1991) Supporting rural non-farm enterprises: what can be learned from donor
programs? Philippine institute for development studies.
MOFED (2008). Ethiopian Progress towards achieving the MDGs, 2007/8. Federal Democratic
Republic of Ethiopia. Ministry of Finance and Economic Development (2008a).
50
PAWLAK, K. & MATUL, M. (2004) Realizing mission objectives: a promising approach to
measuring the social performance of microfinance institutions. Journal of
Microfinance/ESR Review, 6, 1-26.
PAUL, K. (N.D.) ‘Multicollinearity: Causes, Effects and Remedies’, M. Sc. (Agricultural
Statistics), Roll No. 4405I.A.S.R.I, Library Avenue, New Delhi-110012.
http://www.scribd.com/doc/52198487/Multicollinearity-Causes-Effects-Remedies.
REARDON, T., BERDEGUÉ, J., BARRETT, C. B. & STAMOULIS, K. (2007) Household
income diversification into rural nonfarm activities. Transforming the Rural Nonfarm
Economy. Opportunities and Threats in the Developing World. Johns Hopkins
University Press, Baltimore.
REARDON, T., BERDAGUE, J., & ESCOBAR, G. (2001) Rural Nonfarm employment and
Incomes in Latin America: Overview and Policy Implications. World development 29,
395-409.
REARDON, T. (1997) Using evidence of household income diversification to inform study of
the rural nonfarm labor market in Africa. World Development, 25, 735-747.
RUBEN, R & VAN DEN BERG, M. (2001) Nonfarm Employment and Poverty Alleviation of
Rural Farm Households in Honduras. World development 29, 549-560.
SHAND, R. T. (1986) Off-farm employment in the development in rural Asia. Canberra:
Australian National University.
SHYLENDRA, H. & THOMAS, P. 1995. Non-Farm Employment: nature, magnitude and
determinants in a semi-arid village of Western India. Indian Journal of Agricultural
Economics, 50, 410-416.
TEFERA, T. L., PERRET, S. & KIRSTEN, J. F. (2005) Diversity in Livelihoods and Farmers
Strategies in the Hararghe Hilands, Eastern Ethiopia. International Journal of
Agricultural Sustainability, 2, 133-146.
VAN DEN BERG, M. & KUMBI, G.E. (2006) Poverty and The Rural nonfarm economy in
Oromia, Ethiopia. Agricultural Economics 35, no, supplement 3, 469-475.
VERBEEK, M. (2008) A guide to modern econometrics, Wiley.
WAKTOLA, A. (1999) Exploratory Study of two regions in Ethiopia to Identify target areas and
partners for intervention, DCG.
WIGGINS, S. & HAZELL, P. (2011) Access to rural non-farm employment and enterprise
development. Background Paper for the IFAD Rural Poverty Report.
51
WINTERS, P., DAVIDS, B., CARLETTO, G., COVARRUBIAS, K., QUINONES, E. J.,
ZEZZA, A., AZZARRI, C. & STAMOULIS, K. (2009) Assets, Activities and Rural
Income Generation: Evidence from a Multicounty Analysis. World Development, 37,
1435-1452.
WOLDEHANNA, T (2000) Economic Analysis and Policy Implications of Farm and
Off-Farm Employment. A Case Study in the Tigray Region of Northern Ethiopia.
PhD thesis. Wageningen: Wageningen University, the Netherlands.
WOLDENHANNA, T. & OSKAM, A. (2001) Income diversification and entry barriers:
evidence from the Tigray region of northern Ethiopia. Food policy, 26, 351-365.
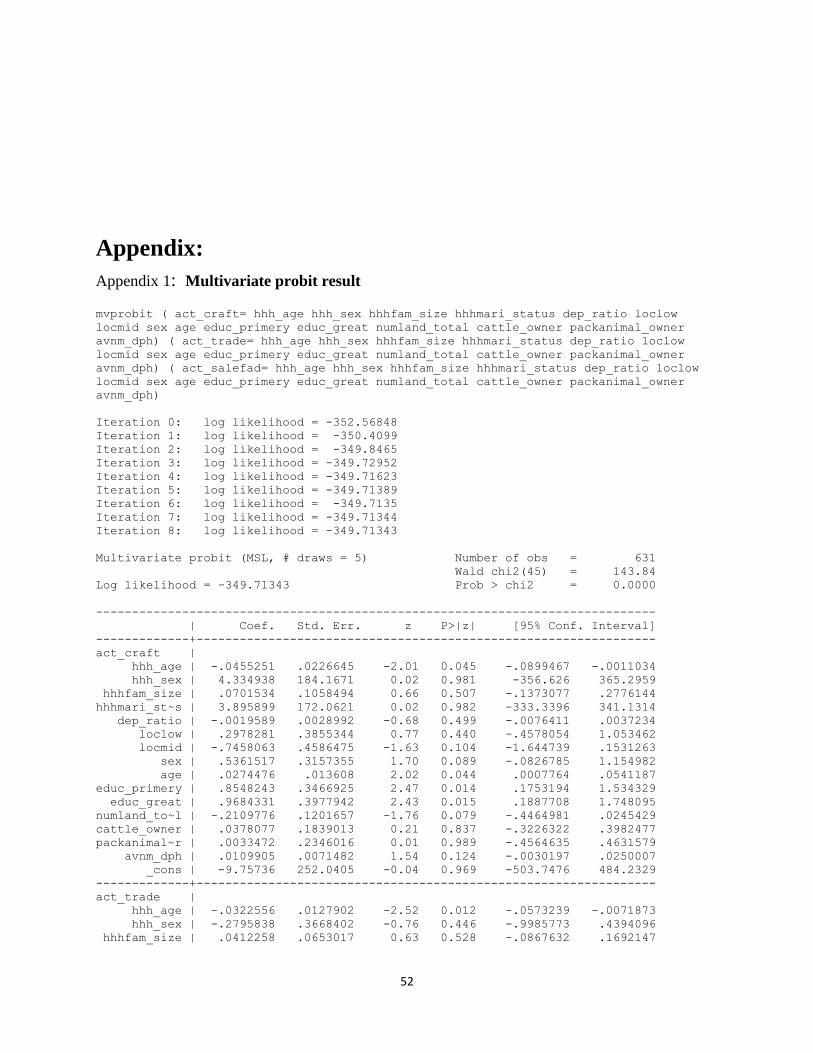
52
Appendix:
Appendix 1: Multivariate probit result
mvprobit ( act_craft= hhh_age hhh_sex hhhfam_size hhhmari_status dep_ratio loclow
locmid sex age educ_primery educ_great numland_total cattle_owner packanimal_owner
avnm_dph) ( act_trade= hhh_age hhh_sex hhhfam_size hhhmari_status dep_ratio loclow
locmid sex age educ_primery educ_great numland_total cattle_owner packanimal_owner
avnm_dph) ( act_salefad= hhh_age hhh_sex hhhfam_size hhhmari_status dep_ratio loclow
locmid sex age educ_primery educ_great numland_total cattle_owner packanimal_owner
avnm_dph)
Iteration 0: log likelihood = -352.56848
Iteration 1: log likelihood = -350.4099
Iteration 2: log likelihood = -349.8465
Iteration 3: log likelihood = -349.72952
Iteration 4: log likelihood = -349.71623
Iteration 5: log likelihood = -349.71389
Iteration 6: log likelihood = -349.7135
Iteration 7: log likelihood = -349.71344
Iteration 8: log likelihood = -349.71343
Multivariate probit (MSL, # draws = 5) Number of obs = 631
Wald chi2(45) = 143.84
Log likelihood = -349.71343 Prob > chi2 = 0.0000
------------------------------------------------------------------------------
| Coef. Std. Err. z P>|z| [95% Conf. Interval]
-------------+----------------------------------------------------------------
act_craft |
hhh_age | -.0455251 .0226645 -2.01 0.045 -.0899467 -.0011034
hhh_sex | 4.334938 184.1671 0.02 0.981 -356.626 365.2959
hhhfam_size | .0701534 .1058494 0.66 0.507 -.1373077 .2776144
hhhmari_st~s | 3.895899 172.0621 0.02 0.982 -333.3396 341.1314
dep_ratio | -.0019589 .0028992 -0.68 0.499 -.0076411 .0037234
loclow | .2978281 .3855344 0.77 0.440 -.4578054 1.053462
locmid | -.7458063 .4586475 -1.63 0.104 -1.644739 .1531263
sex | .5361517 .3157355 1.70 0.089 -.0826785 1.154982
age | .0274476 .013608 2.02 0.044 .0007764 .0541187
educ_primery | .8548243 .3466925 2.47 0.014 .1753194 1.534329
educ_great | .9684331 .3977942 2.43 0.015 .1887708 1.748095
numland_to~l | -.2109776 .1201657 -1.76 0.079 -.4464981 .0245429
cattle_owner | .0378077 .1839013 0.21 0.837 -.3226322 .3982477
packanimal~r | .0033472 .2346016 0.01 0.989 -.4564635 .4631579
avnm_dph | .0109905 .0071482 1.54 0.124 -.0030197 .0250007
_cons | -9.75736 252.0405 -0.04 0.969 -503.7476 484.2329
-------------+----------------------------------------------------------------
act_trade |
hhh_age | -.0322556 .0127902 -2.52 0.012 -.0573239 -.0071873
hhh_sex | -.2795838 .3668402 -0.76 0.446 -.9985773 .4394096
hhhfam_size | .0412258 .0653017 0.63 0.528 -.0867632 .1692147
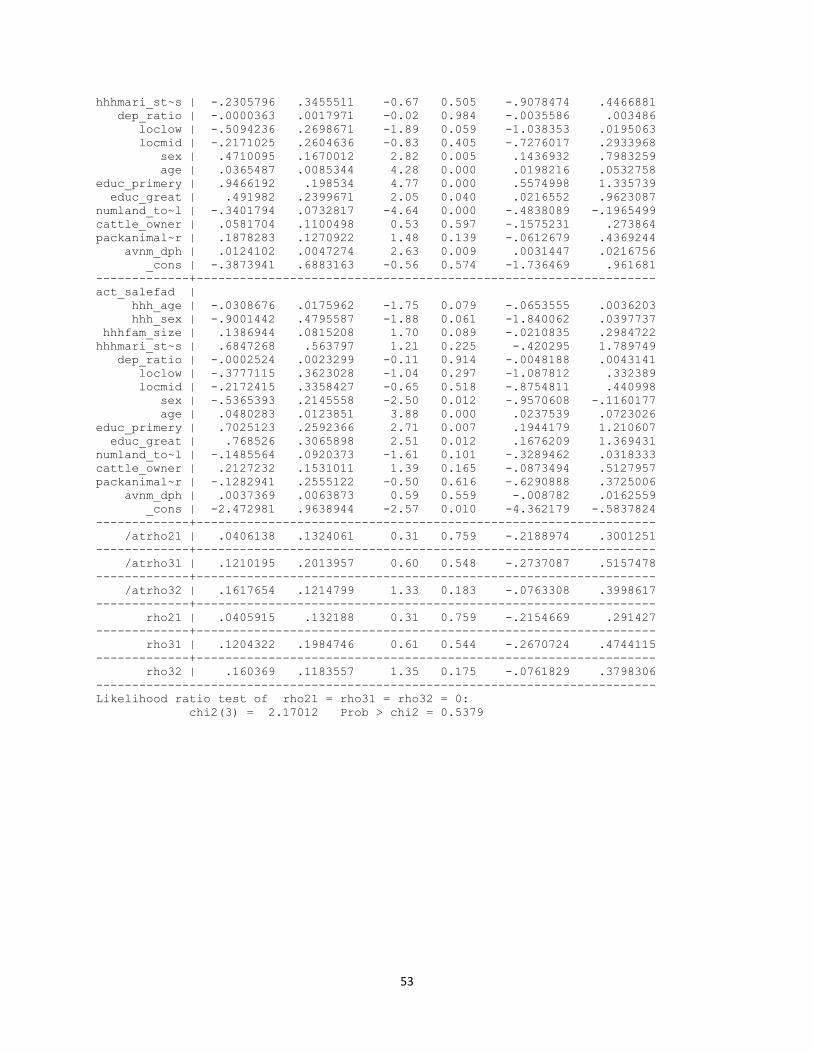
53
hhhmari_st~s | -.2305796 .3455511 -0.67 0.505 -.9078474 .4466881
dep_ratio | -.0000363 .0017971 -0.02 0.984 -.0035586 .003486
loclow | -.5094236 .2698671 -1.89 0.059 -1.038353 .0195063
locmid | -.2171025 .2604636 -0.83 0.405 -.7276017 .2933968
sex | .4710095 .1670012 2.82 0.005 .1436932 .7983259
age | .0365487 .0085344 4.28 0.000 .0198216 .0532758
educ_primery | .9466192 .198534 4.77 0.000 .5574998 1.335739
educ_great | .491982 .2399671 2.05 0.040 .0216552 .9623087
numland_to~l | -.3401794 .0732817 -4.64 0.000 -.4838089 -.1965499
cattle_owner | .0581704 .1100498 0.53 0.597 -.1575231 .273864
packanimal~r | .1878283 .1270922 1.48 0.139 -.0612679 .4369244
avnm_dph | .0124102 .0047274 2.63 0.009 .0031447 .0216756
_cons | -.3873941 .6883163 -0.56 0.574 -1.736469 .961681
-------------+----------------------------------------------------------------
act_salefad |
hhh_age | -.0308676 .0175962 -1.75 0.079 -.0653555 .0036203
hhh_sex | -.9001442 .4795587 -1.88 0.061 -1.840062 .0397737
hhhfam_size | .1386944 .0815208 1.70 0.089 -.0210835 .2984722
hhhmari_st~s | .6847268 .563797 1.21 0.225 -.420295 1.789749
dep_ratio | -.0002524 .0023299 -0.11 0.914 -.0048188 .0043141
loclow | -.3777115 .3623028 -1.04 0.297 -1.087812 .332389
locmid | -.2172415 .3358427 -0.65 0.518 -.8754811 .440998
sex | -.5365393 .2145558 -2.50 0.012 -.9570608 -.1160177
age | .0480283 .0123851 3.88 0.000 .0237539 .0723026
educ_primery | .7025123 .2592366 2.71 0.007 .1944179 1.210607
educ_great | .768526 .3065898 2.51 0.012 .1676209 1.369431
numland_to~l | -.1485564 .0920373 -1.61 0.101 -.3289462 .0318333
cattle_owner | .2127232 .1531011 1.39 0.165 -.0873494 .5127957
packanimal~r | -.1282941 .2555122 -0.50 0.616 -.6290888 .3725006
avnm_dph | .0037369 .0063873 0.59 0.559 -.008782 .0162559
_cons | -2.472981 .9638944 -2.57 0.010 -4.362179 -.5837824
-------------+----------------------------------------------------------------
/atrho21 | .0406138 .1324061 0.31 0.759 -.2188974 .3001251
-------------+----------------------------------------------------------------
/atrho31 | .1210195 .2013957 0.60 0.548 -.2737087 .5157478
-------------+----------------------------------------------------------------
/atrho32 | .1617654 .1214799 1.33 0.183 -.0763308 .3998617
-------------+----------------------------------------------------------------
rho21 | .0405915 .132188 0.31 0.759 -.2154669 .291427
-------------+----------------------------------------------------------------
rho31 | .1204322 .1984746 0.61 0.544 -.2670724 .4744115
-------------+----------------------------------------------------------------
rho32 | .160369 .1183557 1.35 0.175 -.0761829 .3798306
------------------------------------------------------------------------------
Likelihood ratio test of rho21 = rho31 = rho32 = 0:
chi2(3) = 2.17012 Prob > chi2 = 0.5379

54
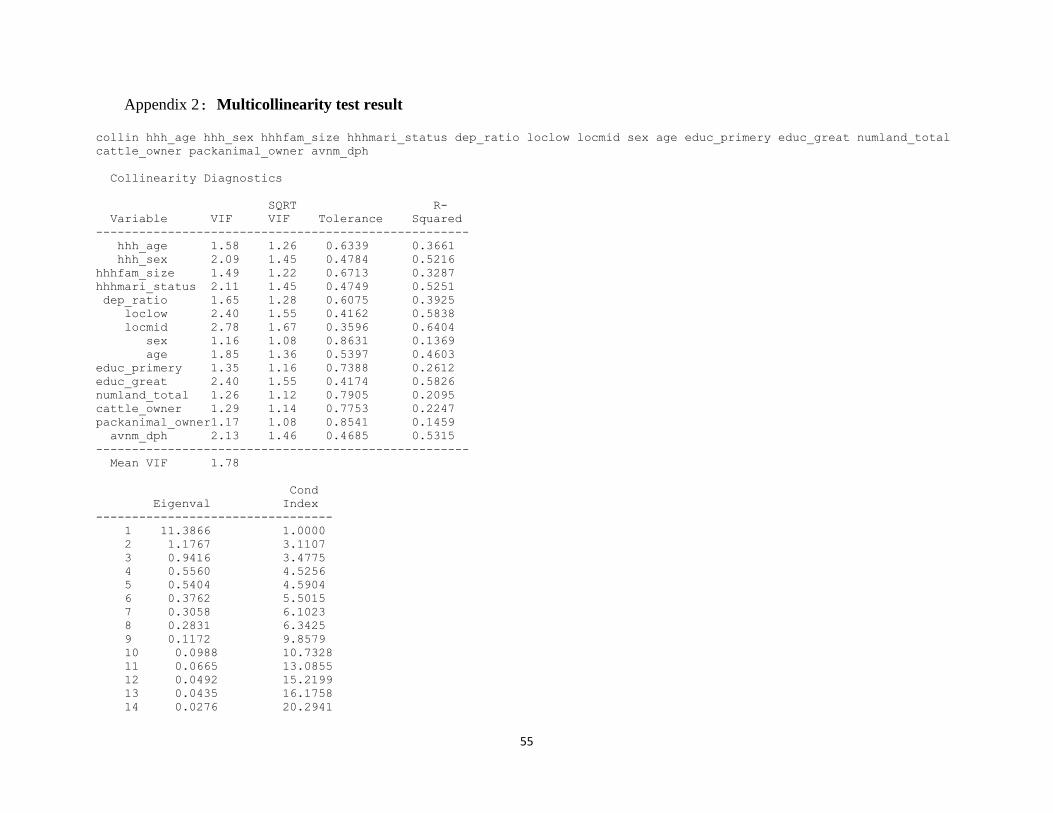
55
Appendix 2: Multicollinearity test result collin hhh_age hhh_sex hhhfam_size hhhmari_status dep_ratio loclow locmid sex age educ_primery educ_great numland_total
cattle_owner packanimal_owner avnm_dph
Collinearity Diagnostics
SQRT R-
Variable VIF VIF Tolerance Squared
----------------------------------------------------
hhh_age 1.58 1.26 0.6339 0.3661
hhh_sex 2.09 1.45 0.4784 0.5216
hhhfam_size 1.49 1.22 0.6713 0.3287
hhhmari_status 2.11 1.45 0.4749 0.5251
dep_ratio 1.65 1.28 0.6075 0.3925
loclow 2.40 1.55 0.4162 0.5838
locmid 2.78 1.67 0.3596 0.6404
sex 1.16 1.08 0.8631 0.1369
age 1.85 1.36 0.5397 0.4603
educ_primery 1.35 1.16 0.7388 0.2612
educ_great 2.40 1.55 0.4174 0.5826
numland_total 1.26 1.12 0.7905 0.2095
cattle_owner 1.29 1.14 0.7753 0.2247
packanimal_owner1.17 1.08 0.8541 0.1459
avnm_dph 2.13 1.46 0.4685 0.5315
----------------------------------------------------
Mean VIF 1.78
Cond
Eigenval Index
---------------------------------
1 11.3866 1.0000
2 1.1767 3.1107
3 0.9416 3.4775
4 0.5560 4.5256
5 0.5404 4.5904
6 0.3762 5.5015
7 0.3058 6.1023
8 0.2831 6.3425
9 0.1172 9.8579
10 0.0988 10.7328
11 0.0665 13.0855
12 0.0492 15.2199
13 0.0435 16.1758
14 0.0276 20.2941
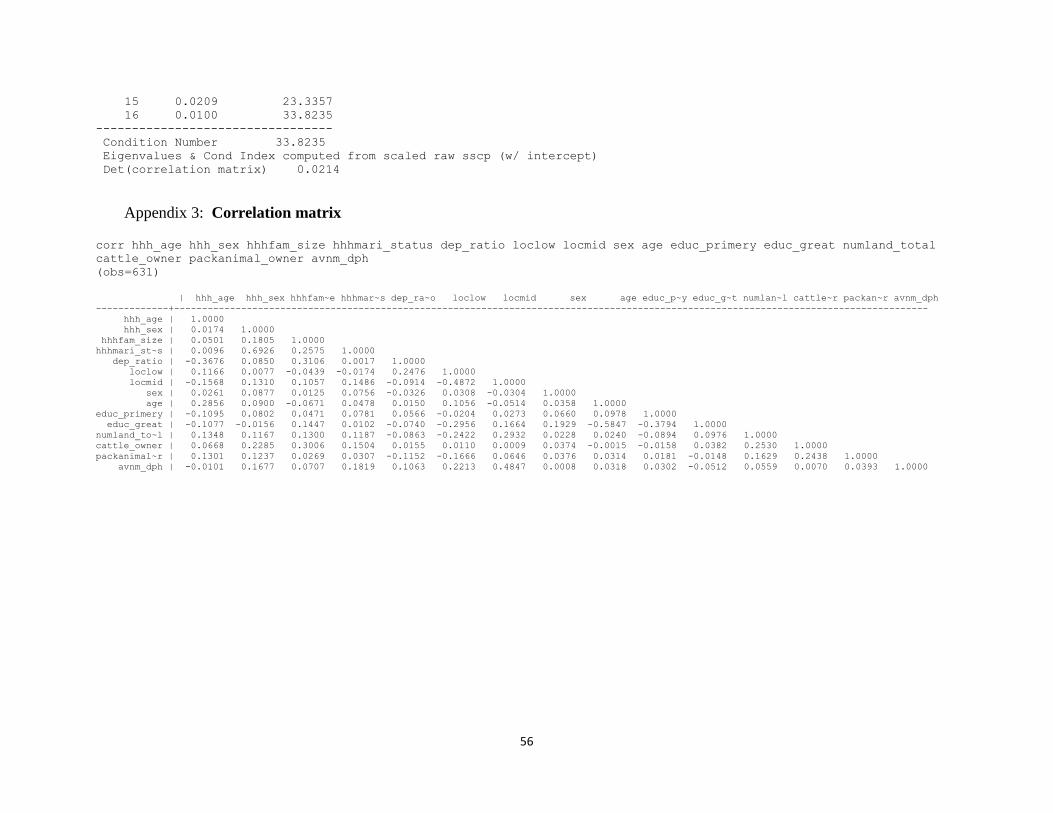
56
15 0.0209 23.3357
16 0.0100 33.8235
---------------------------------
Condition Number 33.8235
Eigenvalues & Cond Index computed from scaled raw sscp (w/ intercept)
Det(correlation matrix) 0.0214
Appendix 3: Correlation matrix corr hhh_age hhh_sex hhhfam_size hhhmari_status dep_ratio loclow locmid sex age educ_primery educ_great numland_total
cattle_owner packanimal_owner avnm_dph
(obs=631)
| hhh_age hhh_sex hhhfam~e hhhmar~s dep_ra~o loclow locmid sex age educ_p~y educ_g~t numlan~l cattle~r packan~r avnm_dph -------------+---------------------------------------------------------------------------------------------------------------------------------------
hhh_age | 1.0000
hhh_sex | 0.0174 1.0000
hhhfam_size | 0.0501 0.1805 1.0000
hhhmari_st~s | 0.0096 0.6926 0.2575 1.0000
dep_ratio | -0.3676 0.0850 0.3106 0.0017 1.0000
loclow | 0.1166 0.0077 -0.0439 -0.0174 0.2476 1.0000
locmid | -0.1568 0.1310 0.1057 0.1486 -0.0914 -0.4872 1.0000
sex | 0.0261 0.0877 0.0125 0.0756 -0.0326 0.0308 -0.0304 1.0000
age | 0.2856 0.0900 -0.0671 0.0478 0.0150 0.1056 -0.0514 0.0358 1.0000
educ_primery | -0.1095 0.0802 0.0471 0.0781 0.0566 -0.0204 0.0273 0.0660 0.0978 1.0000
educ_great | -0.1077 -0.0156 0.1447 0.0102 -0.0740 -0.2956 0.1664 0.1929 -0.5847 -0.3794 1.0000
numland_to~l | 0.1348 0.1167 0.1300 0.1187 -0.0863 -0.2422 0.2932 0.0228 0.0240 -0.0894 0.0976 1.0000
cattle_owner | 0.0668 0.2285 0.3006 0.1504 0.0155 0.0110 0.0009 0.0374 -0.0015 -0.0158 0.0382 0.2530 1.0000
packanimal~r | 0.1301 0.1237 0.0269 0.0307 -0.1152 -0.1666 0.0646 0.0376 0.0314 0.0181 -0.0148 0.1629 0.2438 1.0000
avnm_dph | -0.0101 0.1677 0.0707 0.1819 0.1063 0.2213 0.4847 0.0008 0.0318 0.0302 -0.0512 0.0559 0.0070 0.0393 1.0000
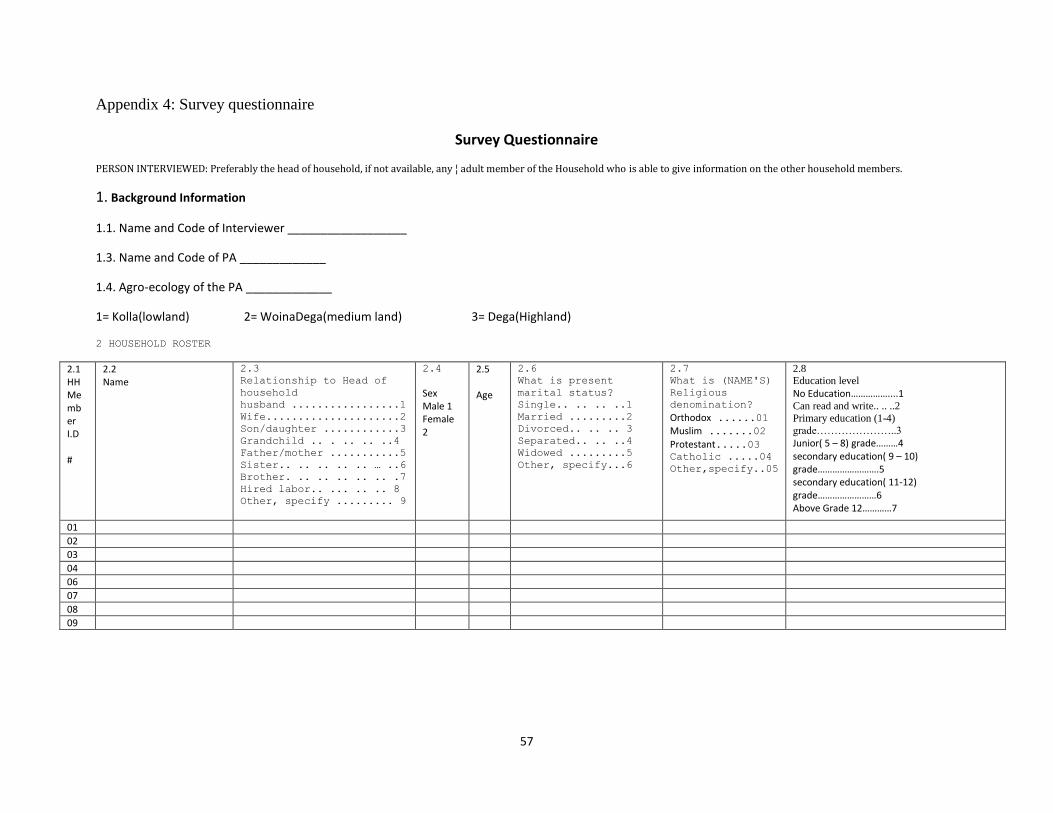
57
Appendix 4: Survey questionnaire
Survey Questionnaire
PERSON INTERVIEWED: Preferably the head of household, if not available, any ¦ adult member of the Household who is able to give information on the other household members.
1. Background Information
1.1. Name and Code of Interviewer __________________
1.3. Name and Code of PA _____________
1.4. Agro-ecology of the PA _____________
1= Kolla(lowland) 2= WoinaDega(medium land) 3= Dega(Highland)
2 HOUSEHOLD ROSTER
2.1 HH Me mb er I.D #
2.2 Name
2.3
Relationship to Head of
household
husband .................1
Wife.....................2
Son/daughter ............3
Grandchild .. . .. .. ..4
Father/mother ...........5
Sister.. .. .. .. .. … ..6
Brother. .. .. .. .. .. .7
Hired labor.. ... .. .. 8
Other, specify ......... 9
2.4
Sex Male 1 Female 2
2.5 Age
2.6
What is present
marital status?
Single.. .. .. ..1
Married .........2
Divorced.. .. .. 3
Separated.. .. ..4
Widowed .........5
Other, specify...6
2.7
What is (NAME'S)
Religious
denomination?
Orthodox ......01 Muslim .......02
Protestant.....03 Catholic .....04
Other,specify..05
2.8 Education level
No Education……………....1
Can read and write.. .. ..2
Primary education (1-4)
grade…………………..3
Junior( 5 – 8) grade………4 secondary education( 9 – 10) grade…………………….5 secondary education( 11-12) grade……………………6 Above Grade 12…………7
01
02
03
04
06
07
08
09
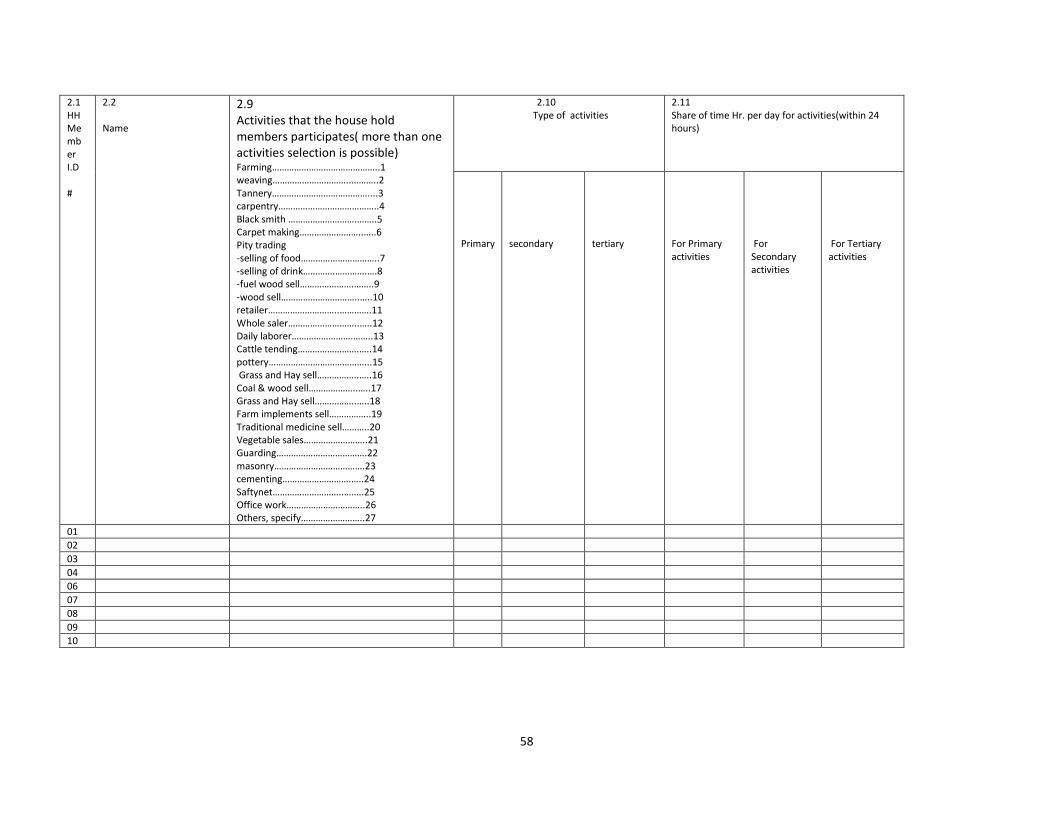
58
2.1 HH Me mb er I.D #
2.2 Name
2.9 Activities that the house hold members participates( more than one activities selection is possible) Farming……………………………………..1 weaving…………………………..………..2 Tannery…………………………………....3 carpentry…………………………………..4 Black smith ……………………….……..5 Carpet making……………………..…..6 Pity trading -selling of food…………………………..7 -selling of drink………….………….….8 -fuel wood sell………………….……..9 -wood sell…………………………..…..10 retailer………………………..………….11 Whole saler………………………..…..12 Daily laborer…………………….……..13 Cattle tending…………………….…..14 pottery…………………………………...15 Grass and Hay sell……………..…..16 Coal & wood sell………………..…..17 Grass and Hay sell……………..…..18 Farm implements sell……………..19 Traditional medicine sell………..20 Vegetable sales……………………..21 Guarding……………………………….22 masonry……………………………….23 cementing……………………….…..24 Saftynet………………………..……..25 Office work…………………………..26 Others, specify……………………..27
2.10 Type of activities
2.11 Share of time Hr. per day for activities(within 24 hours)
Primary
secondary
tertiary
For Primary activities
For Secondary activities
For Tertiary activities
01
02
03
04
06
07
08
09
10
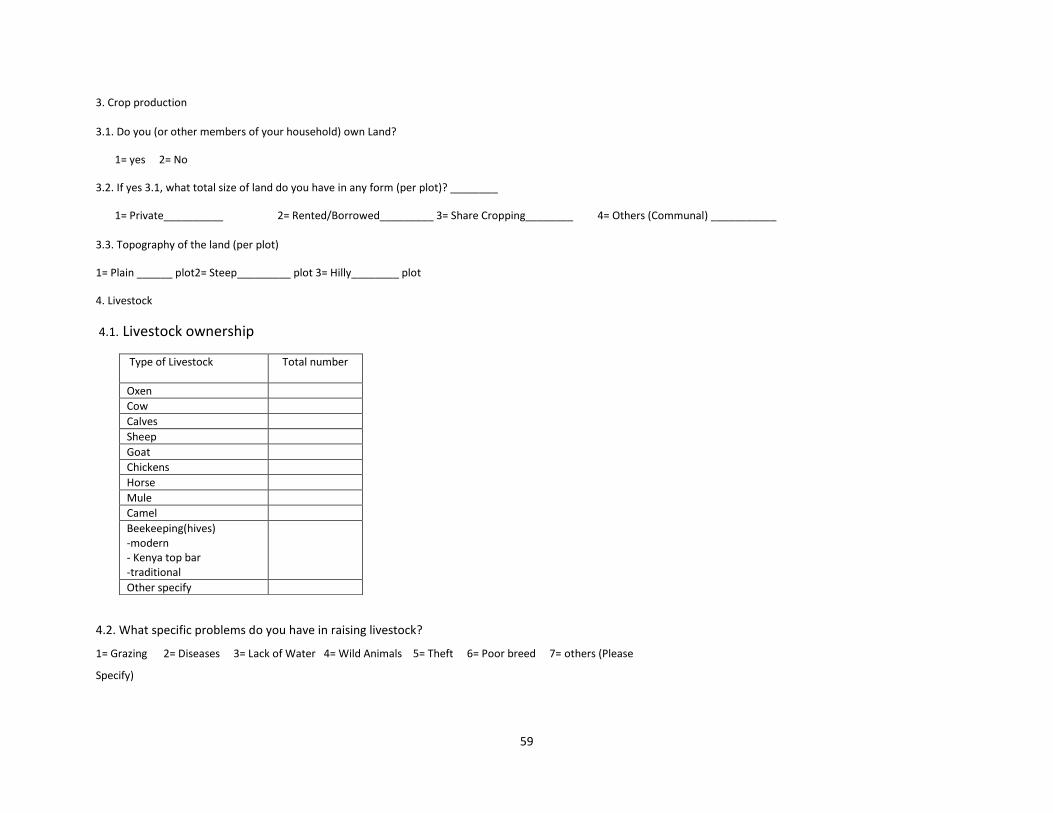
59
3. Crop production 3.1. Do you (or other members of your household) own Land?
1= yes 2= No
3.2. If yes 3.1, what total size of land do you have in any form (per plot)? ________
1= Private__________ 2= Rented/Borrowed_________ 3= Share Cropping________ 4= Others (Communal) ___________ 3.3. Topography of the land (per plot)
1= Plain ______ plot2= Steep_________ plot 3= Hilly________ plot
4. Livestock
4.1. Livestock ownership
4.2. What specific problems do you have in raising livestock?
1= Grazing 2= Diseases 3= Lack of Water 4= Wild Animals 5= Theft 6= Poor breed 7= others (Please
Specify)
Type of Livestock Total number
Oxen
Cow
Calves
Sheep
Goat
Chickens
Horse
Mule
Camel
Beekeeping(hives) -modern - Kenya top bar -traditional
Other specify
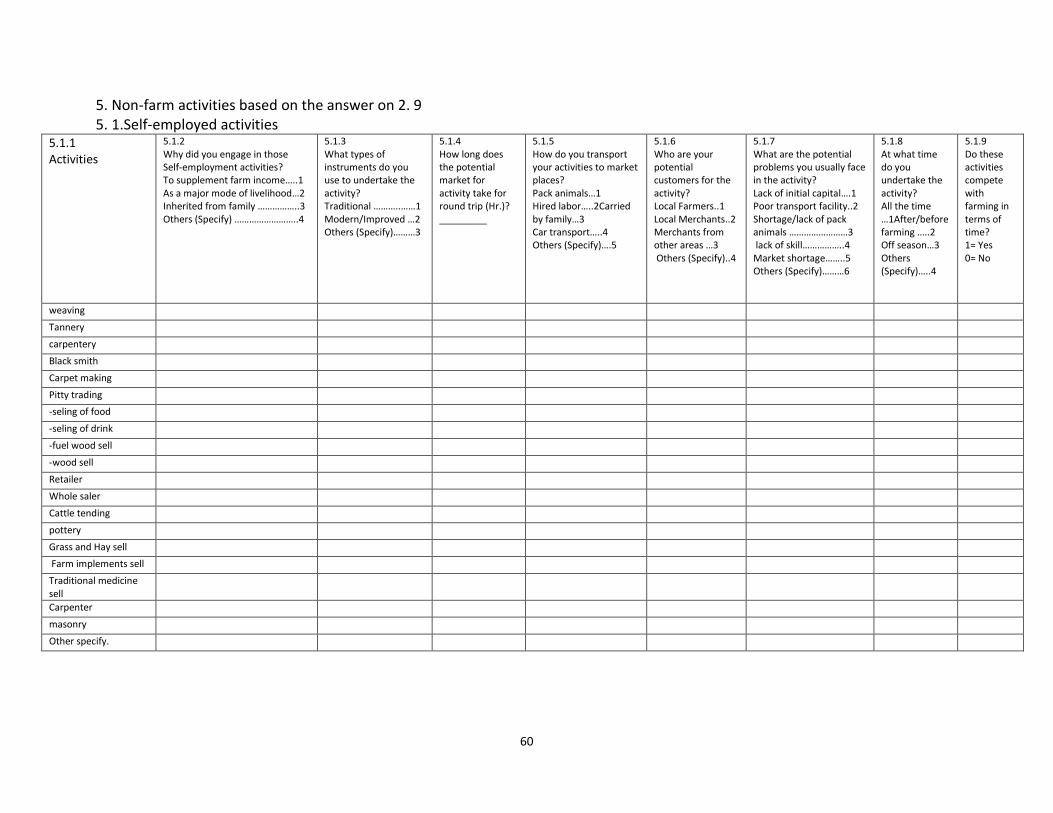
60
5. Non-farm activities based on the answer on 2. 9 5. 1.Self-employed activities
5.1.1 Activities
5.1.2 Why did you engage in those Self-employment activities? To supplement farm income…..1 As a major mode of livelihood…2 Inherited from family ……………..3 Others (Specify) ……………………..4
5.1.3 What types of instruments do you use to undertake the activity? Traditional ………..……1 Modern/Improved …2 Others (Specify)………3
5.1.4 How long does the potential market for activity take for round trip (Hr.)? _________
5.1.5 How do you transport your activities to market places? Pack animals…1 Hired labor…..2Carried by family…3 Car transport…..4 Others (Specify)….5
5.1.6 Who are your potential customers for the activity? Local Farmers..1 Local Merchants..2 Merchants from other areas …3 Others (Specify)..4
5.1.7 What are the potential problems you usually face in the activity? Lack of initial capital….1 Poor transport facility..2 Shortage/lack of pack animals ……………………3 lack of skill……………..4 Market shortage……..5 Others (Specify)………6
5.1.8 At what time do you undertake the activity? All the time …1After/before farming …..2 Off season…3 Others (Specify)…..4
5.1.9 Do these activities compete with farming in terms of time? 1= Yes 0= No
weaving Tannery carpentery Black smith Carpet making Pitty trading -seling of food -seling of drink -fuel wood sell -wood sell Retailer Whole saler Cattle tending pottery Grass and Hay sell Farm implements sell Traditional medicine sell
Carpenter masonry Other specify.
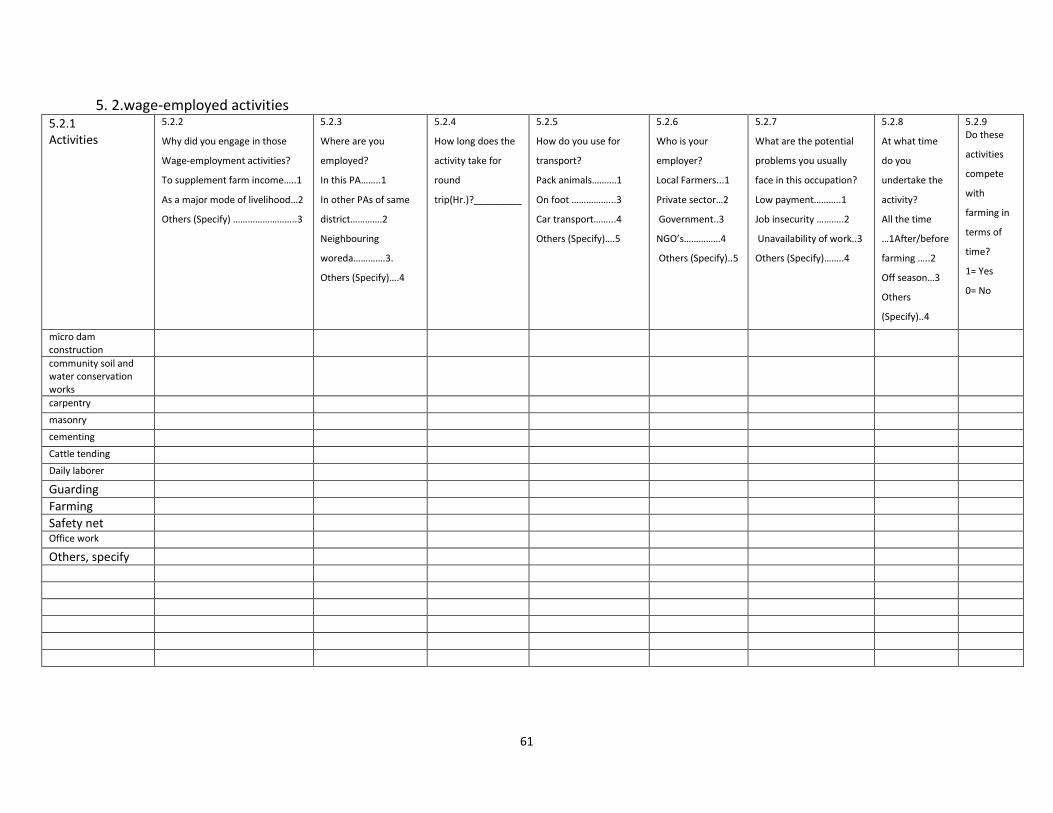
61
5. 2.wage-employed activities 5.2.1 Activities
5.2.2
Why did you engage in those
Wage-employment activities?
To supplement farm income…..1
As a major mode of livelihood…2
Others (Specify) ……………………..3
5.2.3
Where are you
employed?
In this PA……..1
In other PAs of same
district………….2
Neighbouring
woreda………….3.
Others (Specify)….4
5.2.4
How long does the
activity take for
round
trip(Hr.)?_________
5.2.5
How do you use for
transport?
Pack animals…….…1
On foot ……………...3
Car transport……...4
Others (Specify)….5
5.2.6
Who is your
employer?
Local Farmers...1
Private sector…2
Government..3
NGO’s……………4
Others (Specify)..5
5.2.7
What are the potential
problems you usually
face in this occupation?
Low payment………..1
Job insecurity ………..2
Unavailability of work..3
Others (Specify)……..4
5.2.8
At what time
do you
undertake the
activity?
All the time
…1After/before
farming …..2
Off season…3
Others
(Specify)..4
5.2.9 Do these
activities
compete
with
farming in
terms of
time?
1= Yes
0= No
micro dam construction
community soil and water conservation works
carpentry masonry cementing Cattle tending Daily laborer
Guarding
Farming
Safety net Office work
Others, specify
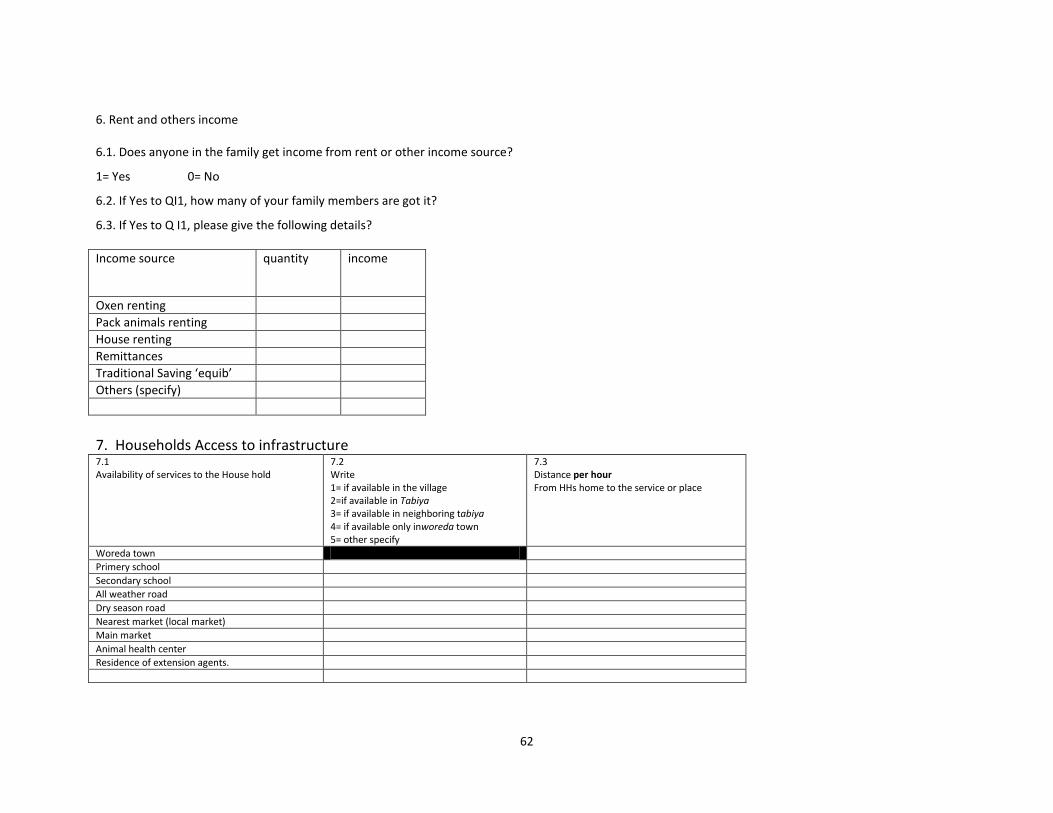
62
6. Rent and others income 6.1. Does anyone in the family get income from rent or other income source?
1= Yes 0= No
6.2. If Yes to QI1, how many of your family members are got it?
6.3. If Yes to Q I1, please give the following details?
Income source quantity income
Oxen renting
Pack animals renting
House renting
Remittances
Traditional Saving ‘equib’
Others (specify)
7. Households Access to infrastructure 7.1 Availability of services to the House hold
7.2 Write 1= if available in the village 2=if available in Tabiya 3= if available in neighboring tabiya 4= if available only inworeda town 5= other specify
7.3 Distance per hour From HHs home to the service or place
Woreda town
Primery school
Secondary school
All weather road
Dry season road
Nearest market (local market)
Main market
Animal health center
Residence of extension agents.
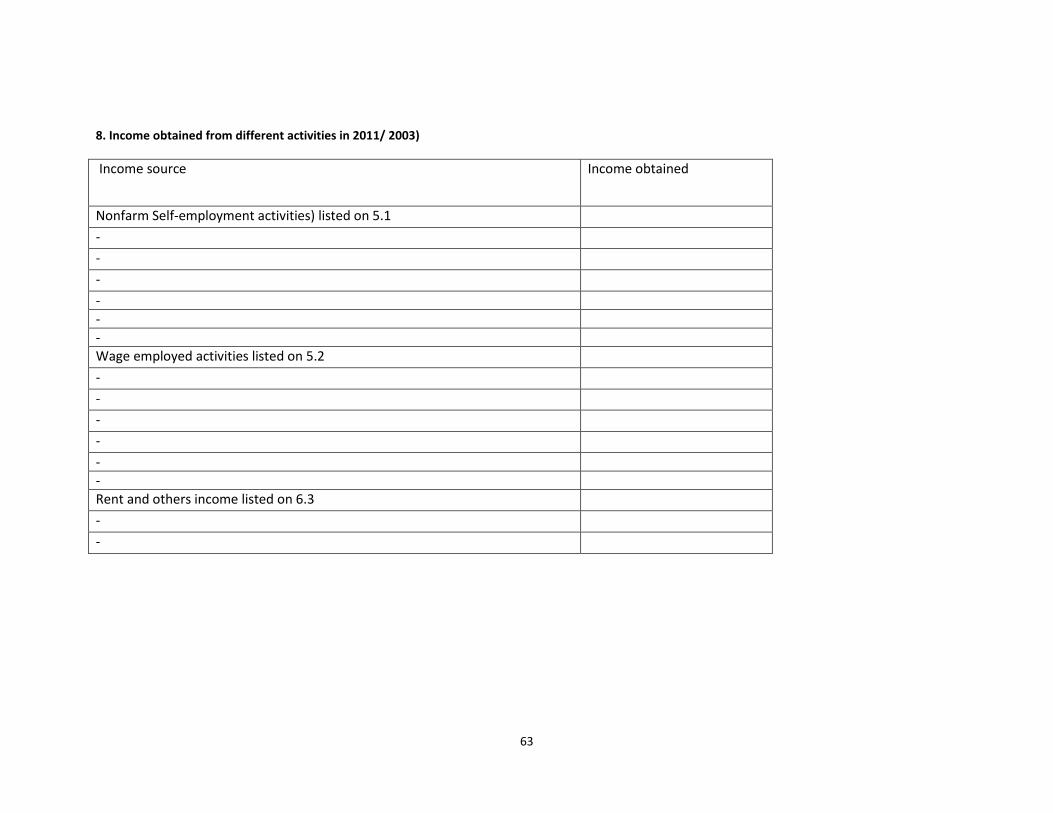
63
8. Income obtained from different activities in 2011/ 2003)
Income source
Income obtained
Nonfarm Self-employment activities) listed on 5.1
-
-
-
-
-
-
Wage employed activities listed on 5.2
-
-
-
-
-
-
Rent and others income listed on 6.3
-
-