nonfarm employment and household income among ethnic
TRANSCRIPT
Full Terms & Conditions of access and use can be found athttp://www.tandfonline.com/action/journalInformation?journalCode=rero20
Download by: [95.168.107.53] Date: 27 December 2016, At: 07:33
Economic Research-Ekonomska Istraživanja
ISSN: 1331-677X (Print) 1848-9664 (Online) Journal homepage: http://www.tandfonline.com/loi/rero20
Nonfarm employment and household incomeamong ethnic minorities in Vietnam
Tuyen Quang Tran
To cite this article: Tuyen Quang Tran (2015) Nonfarm employment and household incomeamong ethnic minorities in Vietnam, Economic Research-Ekonomska Istraživanja, 28:1,703-716, DOI: 10.1080/1331677X.2015.1087872
To link to this article: http://dx.doi.org/10.1080/1331677X.2015.1087872
© 2015 The Author(s). Published by Taylor &Francis
Published online: 09 Oct 2015.
Submit your article to this journal
Article views: 506
View related articles
View Crossmark data
Citing articles: 2 View citing articles
Nonfarm employment and household income among ethnic minoritiesin Vietnam
Tuyen Quang Tran*
Faculty of Political Economy, VNU University of Economics and Business, Vietnam NationalUniversity, Hanoi, Room 100, Building E4, No 144, Xuan Thuy Street, Cau Giay District, Hanoi,Vietnam
(Received 22 February 2015; accepted 25 August 2015)
This study examines the determinants of nonfarm participation and the effect ofnonfarm employment on household income among ethnic minorities in the NorthwestMountains, Vietnam. The logistic regression analysis shows that education and theavailability of local enterprises or trade villages, notably among other factors, have asignificantly increasing impact on the likelihood of taking up wage employment,while the presence of paved roads gives households more chance to engage in non-farm self-employment. Using a propensity score matching analysis, the study foundthat households that participated in wage or nonfarm self-employment have higherlevels of per capita income than those without nonfarm employment. The findingsimply that nonfarm employment offers a pathway out of poverty for ethnicminorities.
Keywords: ethnic minorities; nonfarm participation; propensity score matching;North-West; Vietnam
JEL classification: I32; O12; J15
1. Introduction
Vietnam has 54 distinct ethnic groups; each with its own language, lifestyle and culturalheritage. The most populous group is ‘Viet’ or ‘Kinh’, which accounts for 86% of thecountry’s population (Tung & Trang, 2014). The majority of this group lives in inlanddeltas and coastal areas and enjoys higher living standards than ethnic minority groups.‘Hoa’ or the Chinese group is a relative rich group that also resides in inland deltas andcoastal areas (Imai, Gaiha, & Kang, 2011). The other 52 ethnic minority groups residein upland and mountainous areas, ranging from the South to the North (Tung & Trang,2014). These groups have a very limited access to infrastructure or health and educa-tional facilities and they are much poorer than the ethnic majority group (Kinh/Hoagroups)1(Imai et al., 2011).
Although ethnic minority groups make up less than 15% of Vietnam’s total popula-tion, they contribute 47% of the poor in 2010, compared with 29% in 1998. It was esti-mated that 66.3% of ethnic minorities still lived below the poverty line compared withonly 12.9% of the Kinh majority population in 2010 (World Bank [WB], 2012).2 Ethnicminorities depend heavily on agriculture in association with land for subsistence andtheir ability to switch to nonfarm employment is very limited. The change in economic
*Email: [email protected]
© 2015 The Author(s). Published by Taylor & Francis.This is an Open Access article distributed under the terms of the Creative Commons Attribution License (http://creativecommons.org/licenses/by/4.0/), which permits unrestricted use, distribution, and reproduction in any medium, provided the originalwork is properly cited.
Economic Research-Ekonomska Istraživanja, 2015Vol. 28, No. 1, 703–716, http://dx.doi.org/10.1080/1331677X.2015.1087872
and employment structure from agriculture to other sectors in ethnic minority areas hastaken place slowly, and not yet met with the trend of regional development and thedevelopment pace of the country (United Nations Development Programme [UNDP],2012).
A growing body of empirical evidence has confirmed that nonfarm employment is apositive determinant of poverty alleviation and household welfare for both rural andperi-urban households in Vietnam (Tuyen, 2014). For instance, van de Walle and Cratty(2004) found that although access to land tends to considerably increase householdwellbeing, the probability of falling into poverty is substantially lower among house-holds who participate in nonfarm self-employment in rural Vietnam. As calculated byPham, Bui, and Dao (2010), on average and ceteris paribus, the shift of a householdfrom pure agriculture to pure non-agriculture raises expenditure per capita, and this out-come tends to steadily increase over time. In addition, participation in any types of non-farm activities increases both income and expenditure per adult equivalent forhouseholds in Vietnam’s peri-urban areas (Tuyen, Lim, Cameron, & Huong, 2014a).
Nevertheless, to the best of my knowledge, limited evidence exists for the determi-nants of nonfarm participation and impact of nonfarm employment on householdwelfare among ethnic minorities in Vietnam. Hence, the current study was conducted tofill in this gap in the literature. The main objective of this study is to examine thedeterminants of nonfarm participation and the impact of nonfarm employment onincome among ethnic minority households in North West Mountains. The North WestMountainous region was selected for this study because it is the poorest region ofVietnam with a significant proportion of ethnic minorities living in mountainous areas,with very limited access to non-farm activities and other social and physicalinfrastructure (Cuong, 2012).
Using a micro-econometric approach combined with a propensity score matchinganalysis, the current study added to the extant literature by offering new empirical evi-dence of key factors affecting the participation in nonfarm activities and significantlypositive impacts of nonfarm participation on household income among ethnic minoritiesin the Northwest Mountains area. These findings are very informative and usefulbecause they provide Vietnam policy makers with evidence that nonfarm employmentoffers a pathway out of poverty for ethnic minorities in the sense that nonfarm activitieshave a strongly positive association with household income. This study improves ourunderstanding about the role of nonfarm employment in the livelihood of ethnicminority households in the study area.
The paper is structured into four sections. The next section describes data source,measurements of poverty, econometric models and a propensity score matching (PSM)analysis used in this study. The third section presents estimation results and discussion.Finally, conclusion and policy implications are presented in the fourth section.
2. Data and methods
2.1. Data source
The data from the Northern Mountains Baseline Survey (NMBS) 2010 were used forthis study. The survey was conducted by the General Statistical Office (GSO) ofVietnam from July to September in 2010 to collect the baseline data for the SecondNorthern Mountains Poverty Reduction Project. The main objective of the project is toreduce poverty in the Northern Mountains area. The project has invested in social and
704 T.Q. Tran
physical infrastructure in poor areas and also has helped the poor expand agriculturaland non-agricultural production. Six provinces in the North West region (see Appendix1) were covered in the project, including Hoa Binh, Lai Chau, Lao Cai, Son La, DienBien and Yen Bai (Cuong, 2012).
The survey covered 120 communes that were randomly selected from six aforemen-tioned provinces. The sample size included 1800 households from various ethnicities,such as Tay, Thai, Muong, H’Mong and Dao. Both commune and household data werecollected for the survey. The household data include characteristics of household mem-bers, education and employment, healthcare, income, housing, fixed assets and participa-tion of households into targeted programmes. The commune data consist of informationabout the characteristics of communities such as demography, population, infrastructure,nonfarm job opportunities and targeted programmes in the communes. The communedata can be merged with the household data.
2.2. Poverty measurements
Foster, Greer, and Thorbecke (FGT) decomposable poverty measures were used to com-pute the incidence, depth and severity of poverty (Foster, Greer, & Thorbecke, 1984).These measures were most widely used for measuring poverty (Coudouel, Hentschel, &Wodon, 2002). The FGT class of poverty measures is calculated as:P/ ¼ 1
N
Pqi¼1ðW�Yi
W Þ/, where N represents the size of the total population (or sample); Yidenotes income per capita of the ith household; W is the poverty line; q is the numberof poor households (those with per capita income below W); ∝ is Poverty AversionParameter Index which has the values of 0, 1 and 2 representing the incidence ofpoverty, depth of poverty and severity of poverty (Foster et al., 1984).
When ∝ = 0, then FGT is reduced to P0 ¼ qN, which is the headcount index (inci-
dence of poverty) measuring the proportion of the population with per capita incomebelow the poverty line. By far, this measure is most commonly used because of itsstraightforwardness and simple calculation (WB, 2005).
If ∝ = 1, then the FGT class of poverty measure ðP1Þ is computed as:P1 ¼ 1
N
Pqi¼1ðW�Yi
W Þ1, which is the poverty gap index or the depth of poverty. This mea-sures the extent to which individuals fall below the poverty line (the poverty gap) as apercentage of the poverty line. It should be noted that this measure is the mean propor-tionate poverty gap in the population (where the non-poor have zero poverty gap). Thisprovides information about how far off the poor are from the poverty line. Hence, thepoverty gap index has a virtue as it indicates the level of poverty (WB, 2005).
When ∝ = 2, the FGT class of poverty measure ðP2Þ becomes: P2 ¼ 1N
Pqi¼1ðW�Yi
W Þ2,which is the squared poverty gap or the poverty severity index. This averages thesquares of the poverty gaps relative to the poverty line. This measures the variation inincome distribution among households below the poverty line (Ravallion, 1992). Thepoverty severity index takes into account not only the distance separating the poor fromthe poverty line (the poverty gap), but also the inequality among them. That is, a largerweight is placed on poor households who are further away from the poverty line(Coudouel et al., 2002).
2.3. Modelling determinants of nonfarm participation
First, households were split into three groups, namely those with wage employment,those with nonfarm self-employment and those without nonfarm employment.3 The first
Economic Research-Ekonomska Istraživanja 705
group includes households that received income from wage work and other sources butnot nonfarm self-employment. The second group is represented by those with incomeearned from nonfarm self-employment and other sources except for wage employment.The third group consists of households that did not take up wage work or nonfarm self-employment. Once households were divided into three different groups, statistical analy-ses were then used to compare the means of household characteristics and assetsbetween the groups. As noted by Gujarati and Porter (2009), there are distinct statisticaltechniques for investigating the differences in two or more mean values, which com-monly have the name of analysis of variance. However, a similar objective can beobtained by using the framework of regression analysis. Therefore, regression analysisusing an Analysis of Variance (ANOVA) model was applied to compare the mean ofhousehold characteristics and assets between the two groups. In addition, a chi-squaretest was applied to discover whether a statistically significant association existedbetween two categorical variables such as the type of households and their participationin credit markets.
To model the determinants of participation in a given nonfarm activity (wageemployment or nonfarm self-employment), we used a logit model with the dependentvariable being a binary variable that has a value of one if a household engaged in somesort of nonfarm activity and a value of zero otherwise. The logit model takes the form(Gujarati & Porter, 2009):
PrðY ¼ 1jX Þ ¼ Expðb0sX 0sÞ
1þ Expðb0sX 0sÞ
where the coefficients b0s are the parameters that need be estimated in the model and X 0s
are the explanatory variables. This model estimates the probability that some eventoccurs, which is in this case the probability of a household participating in a nonfarmactivity (self-employment or wage employment). Since the maximum likelihood estima-tion (MLE) of the Logit model is based on the distribution of Y given X , theheteroscedasticity in VarðY jX Þ is automatically accounted for (Wooldridge, 2013).
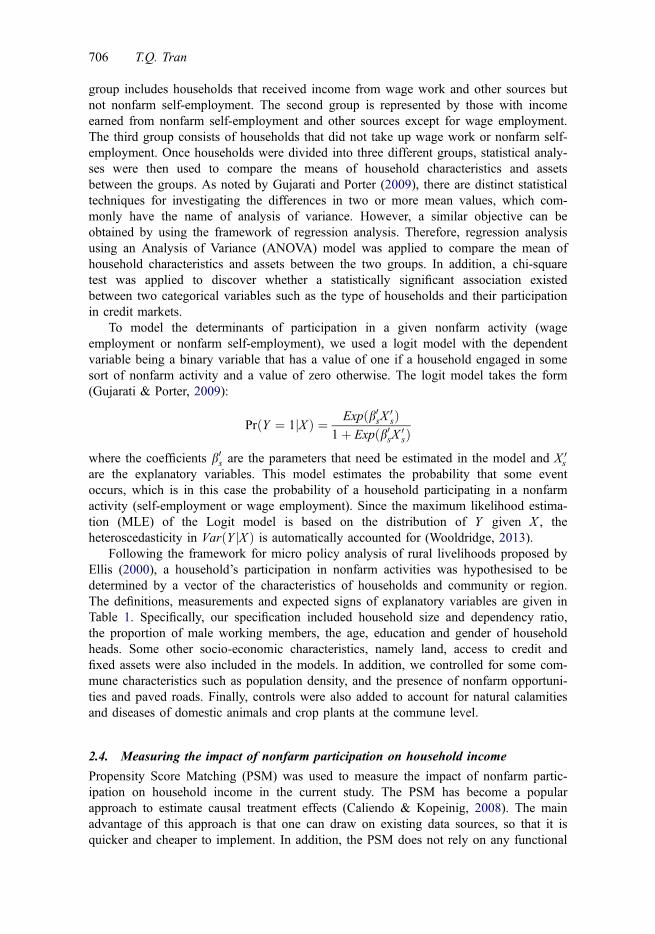
Following the framework for micro policy analysis of rural livelihoods proposed byEllis (2000), a household’s participation in nonfarm activities was hypothesised to bedetermined by a vector of the characteristics of households and community or region.The definitions, measurements and expected signs of explanatory variables are given inTable 1. Specifically, our specification included household size and dependency ratio,the proportion of male working members, the age, education and gender of householdheads. Some other socio-economic characteristics, namely land, access to credit andfixed assets were also included in the models. In addition, we controlled for some com-mune characteristics such as population density, and the presence of nonfarm opportuni-ties and paved roads. Finally, controls were also added to account for natural calamitiesand diseases of domestic animals and crop plants at the commune level.
2.4. Measuring the impact of nonfarm participation on household income
Propensity Score Matching (PSM) was used to measure the impact of nonfarm partic-ipation on household income in the current study. The PSM has become a popularapproach to estimate causal treatment effects (Caliendo & Kopeinig, 2008). The mainadvantage of this approach is that one can draw on existing data sources, so that it isquicker and cheaper to implement. In addition, the PSM does not rely on any functional
706 T.Q. Tran
forms linking the outcome to nonfarm participation. This method allows controlling forpotential bias such as self-selection on observed characteristics into nonfarm participa-tion (Caliendo & Kopeinig, 2008).
The first step in PSM analysis is to estimate the propensity score for each householdwith nonfarm participation (participant) and household without nonfarm participation(non-participant) on the basis of observed characteristics. Normally, a logit or probitfunction is used for this purpose and there is no strong advantage in using the logit overthe probit model (Heinrich, Maffioli, & Vazquez, 2010). The second step is to comparethe mean income of participants with that of the matched (similar) non-participants. Inother words, the purpose of the PSM is to search for comparable non-participationhouseholds among all non-participation households to form a control group, and thencompare the mean income of the treatment and control groups. The underlying point ofthis PSM is that control and treatment units with the same propensity score have thesame probability of assignment to the treatment as in randomised experiments (Dehejia& Wahba, 2002).
Table 1. Definition and measurement of variables included in the models.
Explanatoryvariables Definition and measurement
Expectedsigns
Household size Total household members (persons) +/−Dependency ratiob Proportion of dependents in the households +/−Age Age of household head (years). +/−Ratio of maleworking members
Proportion of male members who worked in the last12 months
+
Gendera Whether or not the household head is male (male=1;female=0).
+/−
Primary educationa Whether or not the household head completed the primaryschool
+
Lower secondarya Whether or not the household head completed the lowersecondary school
+
Upper secondaryand highera
Whether or not the household head completed the uppersecondary school or higher level
+
Agricultural land The size of farmland per capita (1000 m2 per person) −Residential land The size of residential land per capita (10 m2 per person) +/−Fixed assets Total value of all fixed assets (log of VND 1000). +Credita Whether or not the household received any loan during the
last 24 months before the time of the survey+
Paved roada Whether or not there is any paved road to the commune inwhich the household lived.
+
Nonfarm jobopportunitiesa
Whether or not there is any production/services unit or tradevillage located within such a distance that the people in thecommune can go there to work and then go home every day.
+
Population density Number of people per one square kilometre +Natural calamitiesa Whether or not there is any natural calamity such as fires,
floods, storm landslides, earthquakes that occurred in thecommune in which the household lived in the last 3 years
+/−
Diseasesa Whether or not there is any disease of domestic animals orcrop plants that occurred in the commune in which thehousehold lived in the last 3 years
+/−
Note: ameans dummy variables.bthis ratio is calculated by the number of female members aged under 15 and over 59, and male members agedunder 15 and over 65, divided by the number of female members aged 15–59 and male members aged 15–64.Source: Author’s analysis
Economic Research-Ekonomska Istraživanja 707
Let NF be an indicator variable equal to 1 if a household participates in a nonfarmactivity (wage employment or self-employment) and zero otherwise. In the treatmentliterature, NF is an indicator that receives the ‘treatment’. The propensity score PðT1Þ isdefined as the conditional probability of receiving the treatment given pre-treatmentcharacteristics.
PðT 1Þ � ProbðD1 ¼ 1=T1 ¼ EðD1=T 1;PðT1 ¼ FðT1Þ (1)
where T1 includes a vector of the characteristics of a household i; E is the expectationoperator; and FðT1Þ represents normal or logistic cumulative distribution frequency. Theassumption of the conditional independence of the score result expands the use of thepropensity scores for the estimation of the conditional treatment effect. The predictedpropensity scores are employed to quantify the treatment effect.
The average treatment effect on the treated (ATT) is a parameter of interest in theanalysis of propensity score matching. Hence, we use the ATT to evaluate the impact ofnonfarm participation on household income. The ATT is calculated through matchingparticipants and non-participants that are closest in terms of propensity scores. In thispaper, the treated group is referred to as households with nonfarm employment and theATT is computed as follows:
ATT ¼ E½Y 1i � YoijDi ¼ 1� ¼ E½Y 1ijDi ¼ 1� � E½YoijDi ¼ 1� (2)
where EðY=1Þ=D ¼ 1 represents the expected income of households with nonfarmemployment and EðY=0Þ expresses the counterfactual income of households withoutnonfarm participation. The counterfactual estimates represent what the income ofhouseholds with nonfarm employment would be, if they have not engaged in nonfarmactivities.
Several matching algorithms have been proposed in the literature to match partici-pants and nonparticipants with the same propensity scores. Following Smith and Todd(2005) and Morgan, Frisco, Farkas, and Hibel (2008), we used Kernel matching tomatch treatment and comparison observations in this study.4
3. Results and discussion
3.1. Background on household characteristics and assets
The data in Table 2 reveal that income from crops contributed the largest share of totalhousehold income for the whole sample. Combined, the income from crops, livestock,forestry, and aquaculture accounted for about 80% of total income. This suggests that agri-culture plays an important role in the livelihood of the ethnic minorities in NorthwestMountains. Income from nonfarm employment (wage and self-employment) contributed13.3% of the total income, while 9.4% was contributed by other sources. Looking at theincome structure of each group, the crop income share of the poor is, on average, muchlarger than that of the non-poor. However, the non-poor derived more income from for-estry, livestock and aquaculture than the poor. The non-poor had much more income fromnonfarm activities, including both wage and nonfarm self-employment than the poor.Also, the non-poor earned more income from other sources than the poor. These figuressuggest that the poor tend to rely much more on crop production than the non-poor. Asshown in Table 2, households without nonfarm employment are much poorer than those
708 T.Q. Tran
with nonfarm employment by any measure of poverty. The above findings suggest that thedifferences in poverty between the two groups might come from the differences in incomesources.
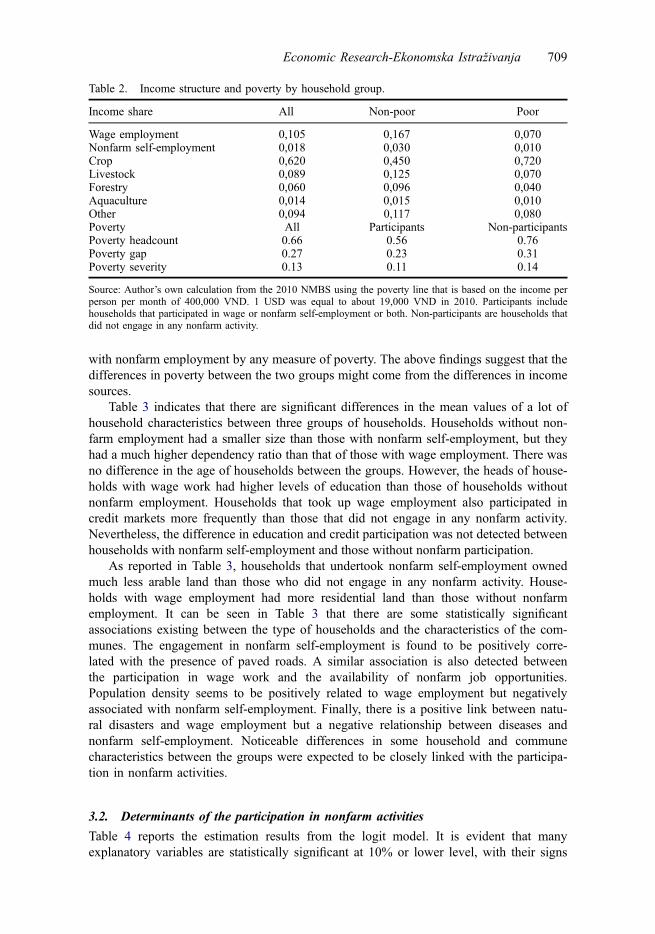
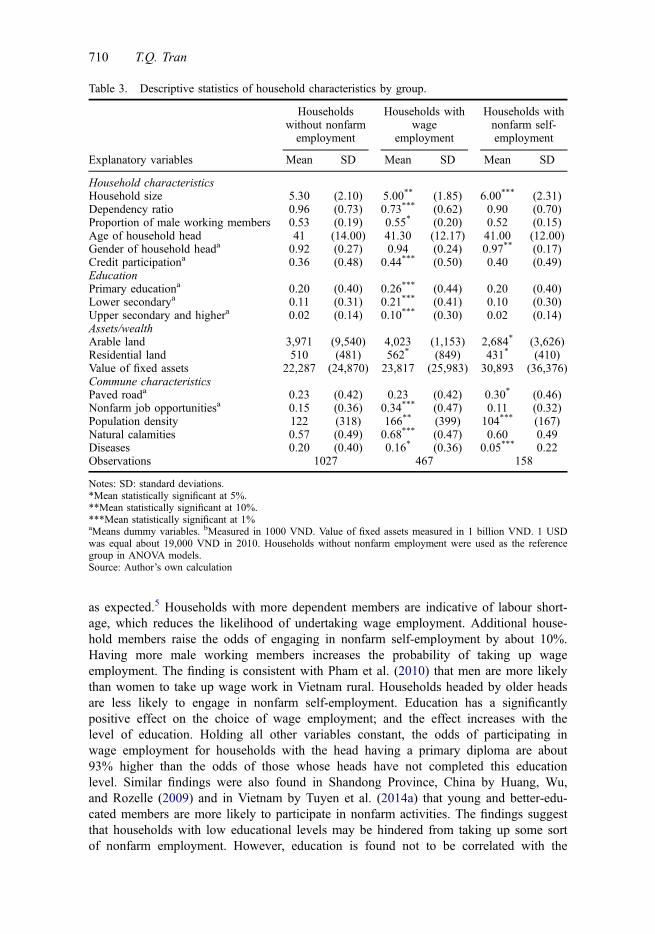
Table 3 indicates that there are significant differences in the mean values of a lot ofhousehold characteristics between three groups of households. Households without non-farm employment had a smaller size than those with nonfarm self-employment, but theyhad a much higher dependency ratio than that of those with wage employment. There wasno difference in the age of households between the groups. However, the heads of house-holds with wage work had higher levels of education than those of households withoutnonfarm employment. Households that took up wage employment also participated incredit markets more frequently than those that did not engage in any nonfarm activity.Nevertheless, the difference in education and credit participation was not detected betweenhouseholds with nonfarm self-employment and those without nonfarm participation.
As reported in Table 3, households that undertook nonfarm self-employment ownedmuch less arable land than those who did not engage in any nonfarm activity. House-holds with wage employment had more residential land than those without nonfarmemployment. It can be seen in Table 3 that there are some statistically significantassociations existing between the type of households and the characteristics of the com-munes. The engagement in nonfarm self-employment is found to be positively corre-lated with the presence of paved roads. A similar association is also detected betweenthe participation in wage work and the availability of nonfarm job opportunities.Population density seems to be positively related to wage employment but negativelyassociated with nonfarm self-employment. Finally, there is a positive link between natu-ral disasters and wage employment but a negative relationship between diseases andnonfarm self-employment. Noticeable differences in some household and communecharacteristics between the groups were expected to be closely linked with the participa-tion in nonfarm activities.
3.2. Determinants of the participation in nonfarm activities
Table 4 reports the estimation results from the logit model. It is evident that manyexplanatory variables are statistically significant at 10% or lower level, with their signs
Table 2. Income structure and poverty by household group.
Income share All Non-poor Poor
Wage employment 0,105 0,167 0,070Nonfarm self-employment 0,018 0,030 0,010Crop 0,620 0,450 0,720Livestock 0,089 0,125 0,070Forestry 0,060 0,096 0,040Aquaculture 0,014 0,015 0,010Other 0,094 0,117 0,080Poverty All Participants Non-participantsPoverty headcount 0.66 0.56 0.76Poverty gap 0.27 0.23 0.31Poverty severity 0.13 0.11 0.14
Source: Author’s own calculation from the 2010 NMBS using the poverty line that is based on the income perperson per month of 400,000 VND. 1 USD was equal to about 19,000 VND in 2010. Participants includehouseholds that participated in wage or nonfarm self-employment or both. Non-participants are households thatdid not engage in any nonfarm activity.
Economic Research-Ekonomska Istraživanja 709
as expected.5 Households with more dependent members are indicative of labour short-age, which reduces the likelihood of undertaking wage employment. Additional house-hold members raise the odds of engaging in nonfarm self-employment by about 10%.Having more male working members increases the probability of taking up wageemployment. The finding is consistent with Pham et al. (2010) that men are more likelythan women to take up wage work in Vietnam rural. Households headed by older headsare less likely to engage in nonfarm self-employment. Education has a significantlypositive effect on the choice of wage employment; and the effect increases with thelevel of education. Holding all other variables constant, the odds of participating inwage employment for households with the head having a primary diploma are about93% higher than the odds of those whose heads have not completed this educationlevel. Similar findings were also found in Shandong Province, China by Huang, Wu,and Rozelle (2009) and in Vietnam by Tuyen et al. (2014a) that young and better-edu-cated members are more likely to participate in nonfarm activities. The findings suggestthat households with low educational levels may be hindered from taking up some sortof nonfarm employment. However, education is found not to be correlated with the
Table 3. Descriptive statistics of household characteristics by group.
Explanatory variables
Householdswithout nonfarmemployment
Households withwage
employment
Households withnonfarm self-employment
Mean SD Mean SD Mean SD
Household characteristicsHousehold size 5.30 (2.10) 5.00** (1.85) 6.00*** (2.31)Dependency ratio 0.96 (0.73) 0.73*** (0.62) 0.90 (0.70)Proportion of male working members 0.53 (0.19) 0.55* (0.20) 0.52 (0.15)Age of household head 41 (14.00) 41.30 (12.17) 41.00 (12.00)Gender of household heada 0.92 (0.27) 0.94 (0.24) 0.97** (0.17)Credit participationa 0.36 (0.48) 0.44*** (0.50) 0.40 (0.49)EducationPrimary educationa 0.20 (0.40) 0.26*** (0.44) 0.20 (0.40)Lower secondarya 0.11 (0.31) 0.21*** (0.41) 0.10 (0.30)Upper secondary and highera 0.02 (0.14) 0.10*** (0.30) 0.02 (0.14)Assets/wealthArable land 3,971 (9,540) 4,023 (1,153) 2,684* (3,626)Residential land 510 (481) 562* (849) 431* (410)Value of fixed assets 22,287 (24,870) 23,817 (25,983) 30,893 (36,376)Commune characteristicsPaved roada 0.23 (0.42) 0.23 (0.42) 0.30* (0.46)Nonfarm job opportunitiesa 0.15 (0.36) 0.34*** (0.47) 0.11 (0.32)Population density 122 (318) 166** (399) 104*** (167)Natural calamities 0.57 (0.49) 0.68*** (0.47) 0.60 0.49Diseases 0.20 (0.40) 0.16* (0.36) 0.05*** 0.22Observations 1027 467 158
Notes: SD: standard deviations.*Mean statistically significant at 5%.**Mean statistically significant at 10%.***Mean statistically significant at 1%aMeans dummy variables. bMeasured in 1000 VND. Value of fixed assets measured in 1 billion VND. 1 USDwas equal about 19,000 VND in 2010. Households without nonfarm employment were used as the referencegroup in ANOVA models.Source: Author’s own calculation
710 T.Q. Tran
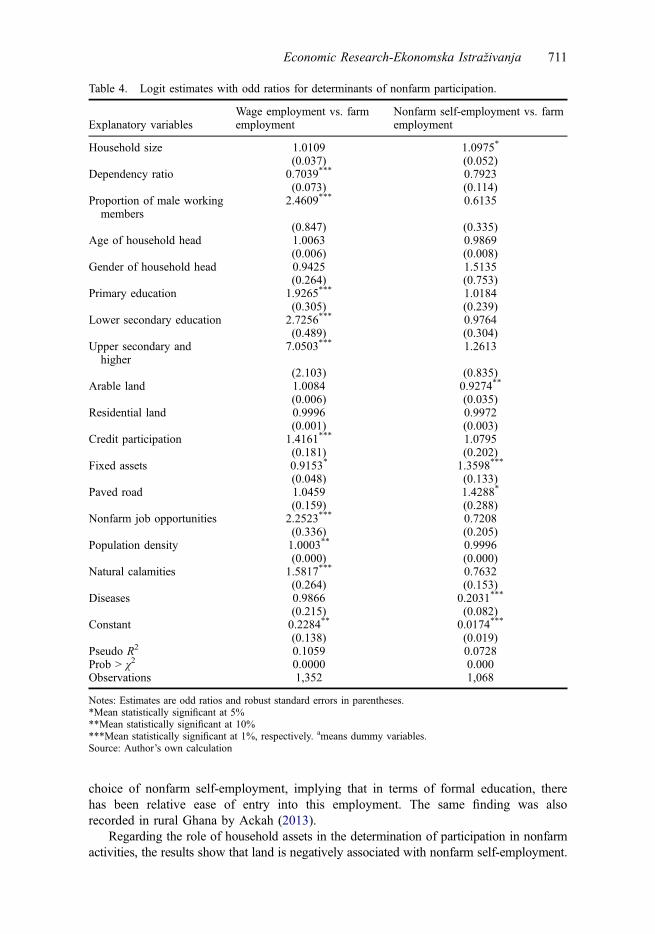
choice of nonfarm self-employment, implying that in terms of formal education, therehas been relative ease of entry into this employment. The same finding was alsorecorded in rural Ghana by Ackah (2013).
Regarding the role of household assets in the determination of participation in nonfarmactivities, the results show that land is negatively associated with nonfarm self-employment.
Table 4. Logit estimates with odd ratios for determinants of nonfarm participation.
Explanatory variablesWage employment vs. farmemployment
Nonfarm self-employment vs. farmemployment
Household size 1.0109 1.0975*
(0.037) (0.052)Dependency ratio 0.7039*** 0.7923
(0.073) (0.114)Proportion of male workingmembers
2.4609*** 0.6135
(0.847) (0.335)Age of household head 1.0063 0.9869
(0.006) (0.008)Gender of household head 0.9425 1.5135
(0.264) (0.753)Primary education 1.9265*** 1.0184
(0.305) (0.239)Lower secondary education 2.7256*** 0.9764
(0.489) (0.304)Upper secondary andhigher
7.0503*** 1.2613
(2.103) (0.835)Arable land 1.0084 0.9274**
(0.006) (0.035)Residential land 0.9996 0.9972
(0.001) (0.003)Credit participation 1.4161*** 1.0795
(0.181) (0.202)Fixed assets 0.9153* 1.3598***
(0.048) (0.133)Paved road 1.0459 1.4288*
(0.159) (0.288)Nonfarm job opportunities 2.2523*** 0.7208
(0.336) (0.205)Population density 1.0003** 0.9996
(0.000) (0.000)Natural calamities 1.5817*** 0.7632
(0.264) (0.153)Diseases 0.9866 0.2031***
(0.215) (0.082)Constant 0.2284** 0.0174***
(0.138) (0.019)Pseudo R2 0.1059 0.0728Prob > χ2 0.0000 0.000Observations 1,352 1,068
Notes: Estimates are odd ratios and robust standard errors in parentheses.*Mean statistically significant at 5%**Mean statistically significant at 10%***Mean statistically significant at 1%, respectively. ameans dummy variables.Source: Author’s own calculation
Economic Research-Ekonomska Istraživanja 711
This implies that households with less land are more likely to take up nonfarm self-employ-ment as a way to supplement farm income. This finding is in line with that in severalprevious studies in Vietnam’s rural and peri-urban areas (e.g., Minot, Epprecht, Anh, &Trung, 2006; Tuyen, Lim, Cameron, & Huong, 2014b; van de Walle & Cratty, 2004).Surprisingly, access to credit is not statistically correlated with nonfarm self-employment.We found evidence that fixed assets are positively associated with participating in nonfarmself-employment, but negatively linked with engaging in wage employment.
In accordance with previous literature on nonfarm participation, the finding of thepaper shows that nonfarm participation by households is significantly affected by somecommunity characteristics (Escobal, 2001). For example, holding all else constant, livingin a commune with the presence of nonfarm job opportunities would raise the odds of ahousehold taking up wage employment by about 125%. Also, the availability of pavedroads increases the odds of engaging in nonfarm self-employment by around 43%. Theoccurrences of different shocks have different effects on the engagement in wageemployment and nonfarm self-employment. While the presence of natural calamitiesincreases the odds of adopting wage work by about 58%, the occurrence of diseases ofdomestic animals or crop plants reduces the odds of undertaking nonfarm self-employ-ment by around 80%. This might be explained by the fact that households that sufferedfrom natural disasters were compelled to take up wage employment as a way of supple-menting their income.
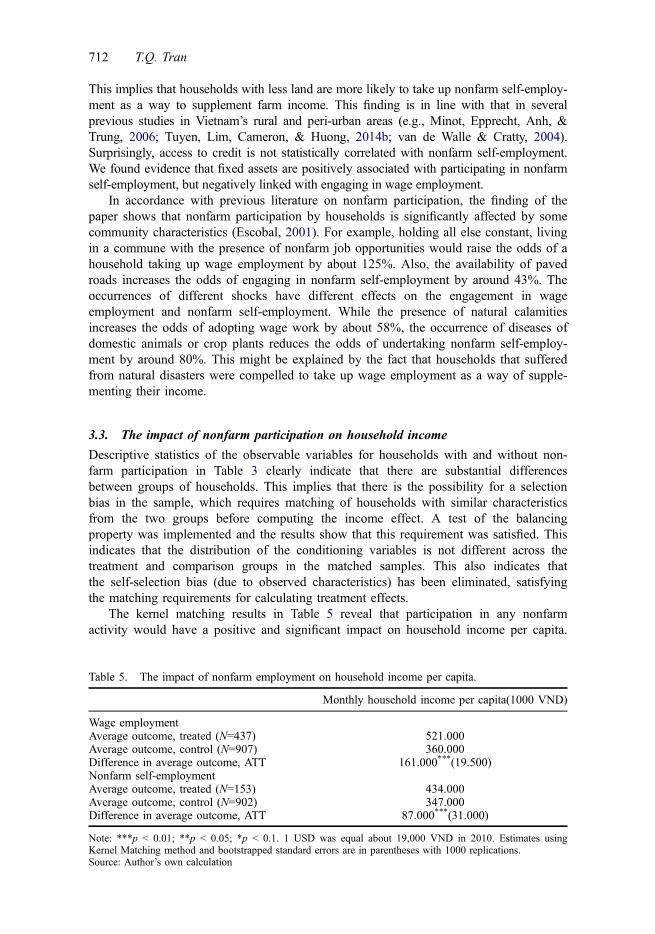
3.3. The impact of nonfarm participation on household income
Descriptive statistics of the observable variables for households with and without non-farm participation in Table 3 clearly indicate that there are substantial differencesbetween groups of households. This implies that there is the possibility for a selectionbias in the sample, which requires matching of households with similar characteristicsfrom the two groups before computing the income effect. A test of the balancingproperty was implemented and the results show that this requirement was satisfied. Thisindicates that the distribution of the conditioning variables is not different across thetreatment and comparison groups in the matched samples. This also indicates thatthe self-selection bias (due to observed characteristics) has been eliminated, satisfyingthe matching requirements for calculating treatment effects.
The kernel matching results in Table 5 reveal that participation in any nonfarmactivity would have a positive and significant impact on household income per capita.
Table 5. The impact of nonfarm employment on household income per capita.
Monthly household income per capita(1000 VND)
Wage employmentAverage outcome, treated (N=437) 521.000Average outcome, control (N=907) 360.000Difference in average outcome, ATT 161.000***(19.500)Nonfarm self-employmentAverage outcome, treated (N=153) 434.000Average outcome, control (N=902) 347.000Difference in average outcome, ATT 87.000***(31.000)
Note: ***p < 0.01; **p < 0.05; *p < 0.1. 1 USD was equal about 19,000 VND in 2010. Estimates usingKernel Matching method and bootstrapped standard errors are in parentheses with 1000 replications.Source: Author’s own calculation
712 T.Q. Tran
Specifically, the estimates of the average treatment effect indicate that households thattook up wage work would have, on average, more monthly income per capita than161,000 VND (8.5 USD) than those who did not undertake any nonfarm employment.Similarly, the average treatment effect on the treated (ATT) suggests that households withnonfarm self-employment would earn, on average, a higher monthly income per capita of87,000 VND (4.6 USD) than those without nonfarm participation. Overall, the result isconsistent with previous studies using the same method in rural Vietnam and otherdeveloping countries. For example, Pham et al. (2010) found that controlling for other fac-tors, households that participated in nonfarm activities (either wage or nonfarm self-em-ployment) had higher expenditure per capita than those without nonfarm participation inrural Vietnam. Similar findings were also found in rural Ghana by Ackah (2013), ruralNigeria by Shehu and Sidique (2014) and rural Ethiopia by Ali and Peerlings (2012).
4. Conclusion and policy implication
Previous empirical information about nonfarm employment and its effects on householdwelfare in Vietnam’s ethnic minority areas has been limited. This study has attempted todiscover the determinants of participation in nonfarm activities and the impact ofnonfarm employment on household income among ethnic minorities in NorthwestMountains, Vietnam. The main finding of the study is that households who participatedin wage work or nonfarm self-employment had much higher income per capita thansimilar households who did not take up any nonfarm employment, even after controllingfor the fact that households that had income from nonfarm sources are a nonrandomsample of ethnic minority households. In general, the findings of the paper are consis-tent with those of the extant literature on the role of nonfarm employment in householdwelfare in both Vietnam and other developing countries.
The current study found evidence that some household characteristics are stronglyassociated with nonfarm participation. Having more members increases the chance oftaking up nonfarm self-employment. The likelihood of undertaking wage employmentincreases with the ratio of male working members. A key determinant of participationin higher return activities is education. Households with heads that have completed pri-mary education have a higher probability of adopting wage work than those with headsnot having completing this education level. Similar but much stronger impacts were alsorecorded for the case of having a lower secondary diploma and an upper secondarydiploma or higher. Participation in nonfarm self-employment is not correlated with anylevel of education but it is negatively associated with land endowment and positivelyrelated to the value of fixed assets.
Similar to previous findings, the current study found evidence that some communecharacteristics play an important role in determining the participation in nonfarm activi-ties. Controlling for other factors, a commune with the presence of local enterprises ortrade villages would give households living in that commune a higher chance of takingup wage employment. A commune having paved roads would increase the likelihood ofparticipation in nonfarm self-employment. Shocks have different effects on nonfarm par-ticipation. While the occurrence of natural disasters increases the probability of adoptingwage employment, the presence of diseases of domestic animals or crop plants reducesthe chance of participating in nonfarm self-employment.
The findings of the current study lead directly to a discussion about what policymakers can do to reduce poverty in the study area. By providing a better understandingabout what are the key determinants of nonfarm participation and the significantly
Economic Research-Ekonomska Istraživanja 713
positive impact of nonfarm employment on household income, the study offers usefulinformation as to what sorts of policy interventions might be effective in combatingpoverty and improving welfare for ethnic minorities. The empirical evidence here sug-gests that promoting rural nonfarm activities, coupled with support for improving theaccess of poor households to these, are expected to be an effective way of reducingpoverty in the Northwest Mountainous region. Increasing the chance for households totake up nonfarm employment could be obtained by improving the access of the poor toeducation, expanding nonfarm job opportunities and investing in local physical (hard)infrastructure in the form of building up paved roads in communes.
However, there are also a caveat in this study. While propensity score matching (PSM)can eliminate selection bias from observable characteristics, it fails to address the endo-geneity problem resulting from unobservable household characteristics that may affect theparticipation in nonfarm activities and outcomes given that the current paper uses onlycross-sectional data. Hence, this suggests a potential topic for future research, that post-intervention data should be collected from the same pool of households who participatedin the pre-intervention data collection. With panel data, future studies can further examinethe effect of changed occupation on the change of income using similar methodology.
Disclosure statementNo potential conflict of interest was reported by the author.
AcknowledgmentsThe author thanks Vietnam National University and VNU University of Economics and Businessfor funding the publication of this research. The author also thanks colleagues for helpful com-ments on earlier versions of this paper.
Notes1. Following previous studies (Cuong, 2012; van de Walle & Gunewardena, 2001), we defined
Kinh/Hoa groups as the ethnic majority group in the current study.2. This poverty rate was calculated based on the updated poverty line proposed by the General
Statistical Office – World Bank (GSO-WB) in 2010 (expenditure per person per month of653,000 VND).
3. However, there is another group including 66 households that participated in both wage andnonfarm self-employment. This group is excluded from the study because the propensityscore matching analysis does not satisfy the requirement of balancing property.
4. Other matching algorithms have been also used to check the robustness and the results con-firm that households with wage or nonfarm self-employment earned a significantly higherincome than those without nonfarm employment.
5. Odd ratios (ORs) being larger than 1 and smaller than 0 indicate that the association betweenthe dependent and explanatory variables are positive and negative, respectively.
ReferencesAckah, C. (2013). Nonfarm employment and incomes in rural Ghana. Journal of International
Development, 25, 325–339.Ali, M., & Peerlings, J. (2012). Farm households and nonfarm activities in Ethiopia: Does cluster-
ing influence entry and exit? Agricultural Economics, 43, 253–266.Caliendo, M., & Kopeinig, S. (2008). Some practical guidance for the implementation of
propensity score matching. Journal of Economic Surveys, 22, 31–72.
714 T.Q. Tran
Coudouel, A., Hentschel, J. S., & Wodon, Q. T. (2002). Chapter 1: Poverty measurement andanalysis. In J. Klugman (Ed.), A source book for poverty reduction strategies (pp. 29–76).Washington, DC: The World Bank.
Cuong, N. V. (2012). Ethnic minorities in Northern Mountains of Vietnam: Poverty, income andassets. MPRA (Working Paper No. 40769).
Dehejia, R. H., & Wahba, S. (2002). Propensity score-matching methods for nonexperimental cau-sal studies. Review of Economics and Statistics, 84, 151–161.
Ellis, F. (2000). Rural livelihoods and diversity in developing countries. New York, NY: OxfordUniversity Press.
Escobal, J. (2001). The determinants of nonfarm income diversification in rural Peru. WorldDevelopment, 29, 497–508.
Foster, J., Greer, J., & Thorbecke, E. (1984). A class of decomposable poverty measures.Econometrica: Journal of the Econometric Society, 52, 761–766.
Gujarati, D. N., & Porter, D. C. (2009). Basis Econometrics. New York, NY: Mc Graw-Hill.Heinrich, C., Maffioli, A., & Vázquez, G. (2010). A primer for applying propensity-score match-
ing: Impact-evaluation guidelines. Washington, D.C: Inter-American Development Bank.Huang, J., Wu, Y., & Rozelle, S. (2009). Moving off the farm and intensifying agricultural
production in Shandong: A case study of rural labor market linkages in China. AgriculturalEconomics, 40, 203–218.
Imai, K. S., Gaiha, R., & Kang, W. (2011). Poverty, inequality and ethnic minorities in Vietnam.International Review of Applied Economics, 25, 249–282.
Minot, N., Epprecht, M., Anh, T. T. T., & Trung, L. Q. (2006). Income diversification and povertyin the Northern Uplands of Vietnam (Vol. 145). Washington, D.C: International Food PolicyResearch Institute.
Morgan, P. L., Frisco, M. L., Farkas, G., & Hibel, J. (2008). A propensity score matching analysisof the effects of special education services. The Journal of special education, 43, 236–254.
Pham, T. H., Bui, A. T., & Dao, L. T. (2010). Is nonfarm diversification a way out of poverty forrural households? Evidence from Vietnam in 1993-2006. (PMMAWorking Paper No. 2010-17).
Ravallion, M. (1992). Poverty comparisons: A guide to concepts and methods. Living standardsmeasurement study (Working Paper No. 88). Washington, DC: World Bank.
Shehu, A., & Sidique, S. F. (2014). A propensity score matching analysis of the impact ofparticipation in non-farm enterprise activities on household wellbeing in rural Nigeria. UMKProcedia, 1, 26–32.
Smith, J. A., & Todd, P. E. (2005). Does matching overcome LaLonde’s critique of nonexperi-mental estimators? Journal of Econometrics, 125, 305–353.
Tung, P. D., & Trang, D. T. (2014). 54 ethnic groups: Why different?. Hanoi, Vietnam: MekongDevelopment Research Institute.
Tuyen, T. Q. (2014). A review on the link between nonfarm employment, land and rural liveli-hoods in developing countries and Vietnam. Ekonomski horizonti, 16, 113–123.
Tuyen, T. Q., Lim, S., Cameron, M. P., & Huong, V. V. (2014a). Farmland loss and livelihoodoutcomes: A microeconometric analysis of household surveys in Vietnam. Journal of the AsiaPacific Economy, 19, 423–444.
Tuyen, T. Q., Lim, S., Cameron, M. P., & Huong, V. V. (2014b). Farmland loss, nonfarm diversi-fiction and inequality among households in Hanoi’s peri-urban areas, Vietnam. InternationalDevelopment Planning Review, 36, 356–379.
UNDP (2012). Strengthening capacity in ethnic minority policy formulation, implementation andmonitoring – EMPCD. Hanoi, Vietnam: United National Development Program.
van de Walle, D., & Cratty, D. (2004). Is the emerging non-farm market economy the route out ofpoverty in Vietnam? Economics of Transition, 12, 237–274.
van de Walle, D., & Gunewardena, D. (2001). Sources of ethnic inequality in Viet Nam. Journalof Development Economics, 65, 177–207.
WB (2005). Chapter 4: Measures of poverty. In WB (Ed.), Introduction to poverty analysis (pp.69-82). Washington, DC: World Bank Institute.
WB (2012). 2012 Vietnam poverty assessment - Well begun, not yet done: Vietnam’s remarkableprogress on poverty reduction and the emerging challenges Washington DC: The WorldBank.
Wooldridge, J. M. (2013). Introductory econometrics: A modern approach (5th ed.). Mason, OH:South-Western Cengage Learning.
Economic Research-Ekonomska Istraživanja 715
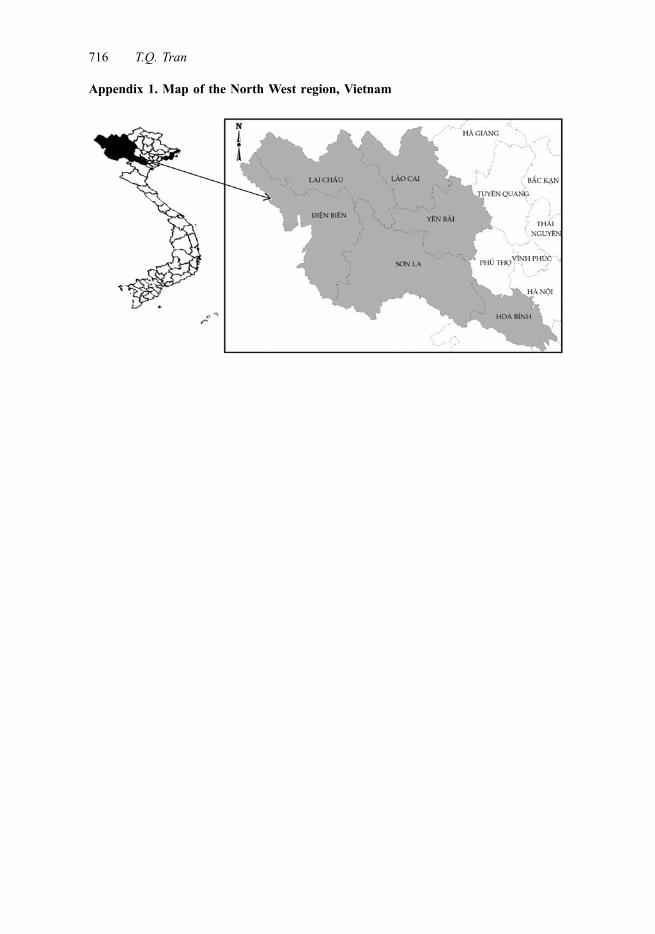
Appendix 1. Map of the North West region, Vietnam
716 T.Q. Tran