farming and technology: a dairyman s perspective · changing dairy landscape ... milk color •...
TRANSCRIPT

2/21/2014
1
FARMING AND TECHNOLOGY: A DAIRYMAN’S PERSPECTIVE
Jeffrey Bewley, Amanda Sterrett, Randi Black, Barbara Wadsworth, Di Liang, Karmella Dolecheck,
Matthew Borchers, Lauren Mayo, Nicky Tsai, Maegan Weatherly, Melissa Cornett, Samantha
Smith, Megan Hardy, and Jenna Klefot
Technological Marvels
• Tremendous technological progress in dairy farming (i.e. genetics, nutrition, reproduction, disease control, cow comfort)
• Modern dairy farms have been described as “technological marvels” (Philpot, 2003)
• The next “technological marvel” in the dairy industry may be in Precision Dairy Farming
1. Changing Dairy Landscape
• Fewer, larger dairy operations
• Narrow profit margins
• Increased feed and labor costs
• Cows are managed by fewer skilled workers
2014 Virginia State Feed Association & Nutritional Management "Cow" College
Bewley | University of Kentucky
2/21/2014
2
2. Consumer Focus
• Continuous quality assurance
• “Natural” or “organic” foods
G h d ti• Greenhouse gas reductions
• Zoonotic disease transmission
• Reducing the use of medical treatments
• Increased emphasis on animal well-being
3. Information Era
• Unlimited on-farm data storage
• Faster computers allow for more sophisticatedfor more sophisticated on-farm data mining
• Technologies adopted in larger industries have applications in smaller industries
4. Cow Challenges1. Finding cows in heat
2. Finding and treating lame cows
3. Finding and treating cows with mastitis
4 C t hi i k i l l t ti4. Catching sick cows in early lactation
5. Understanding nutritional status of cows
a. Feed intake
b. Body condition (fat or thin)
c. Rumen health (pH/rumination time)
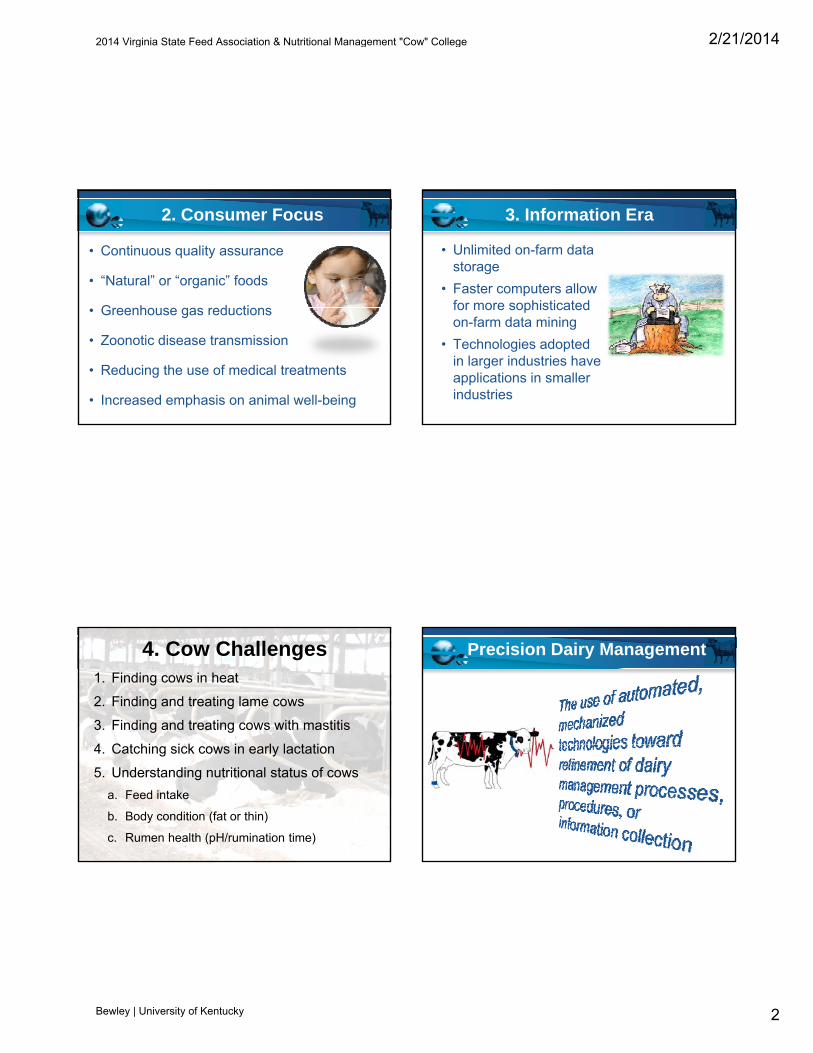
Precision Dairy Management
2014 Virginia State Feed Association & Nutritional Management "Cow" College
Bewley | University of Kentucky
2/21/2014
3
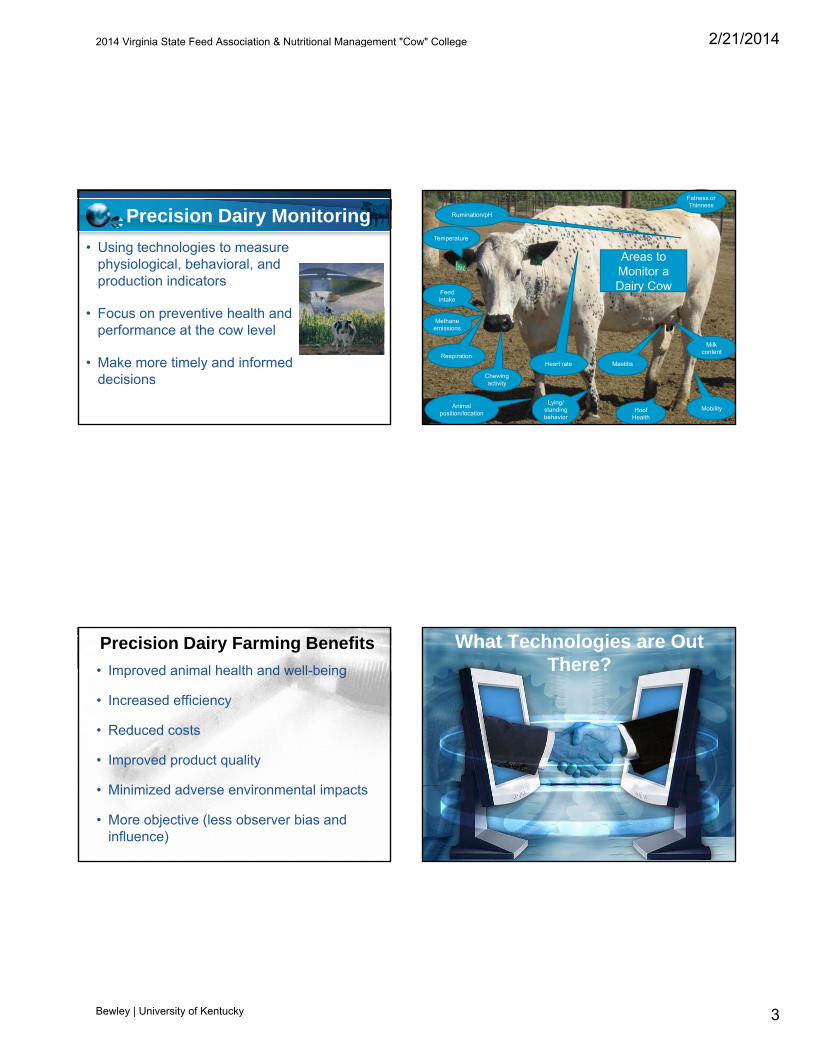
Precision Dairy Monitoring
• Using technologies to measure physiological, behavioral, and production indicators
• Focus on preventive health and performance at the cow level
• Make more timely and informed decisions
Fatness or Thinness
Rumination/pH
Temperature
Feed intake
Areas to Monitor a Dairy Cow
MobilityHoof Health
MastitisRespiration
Milk content
Heart rate
Animal position/location
Chewing activity
Lying/standing behavior
Methane emissions
Precision Dairy Farming Benefits
• Improved animal health and well-being
• Increased efficiency
• Reduced costs
• Improved product quality
• Minimized adverse environmental impacts
• More objective (less observer bias and influence)
What Technologies are Out There?
2014 Virginia State Feed Association & Nutritional Management "Cow" College
Bewley | University of Kentucky

2/21/2014
4
Electrical Conductivity
• Ion concentration of milk changes, increasing electrical conductivity
• Inexpensive and simple equipment
• Wide range of sensitivity and specificity• Wide range of sensitivity and specificity reported
• Results improve with quarter level sensors
• Improved results with recent algorithms
• Most useful when combined with other metrics
Brandt et al., 2010; Hogeveen et al., 2011
Milk Color
• Color variation (red, blue, and green) sensors in some automatic milking systems
• Reddish color indicates bloodReddish color indicates blood (Ordolff, 2003)
• Clinical mastitis may change color patterns for three colors (red, green and blue)
• Specificity may be limitedwww.lely.com
Temperature
• Not all cases of mastitis result in a temperature response
• Best location to collect temperature?
• Noise from other physiological impacts• Noise from other physiological impacts
2014 Virginia State Feed Association & Nutritional Management "Cow" College
Bewley | University of Kentucky
2/21/2014
5
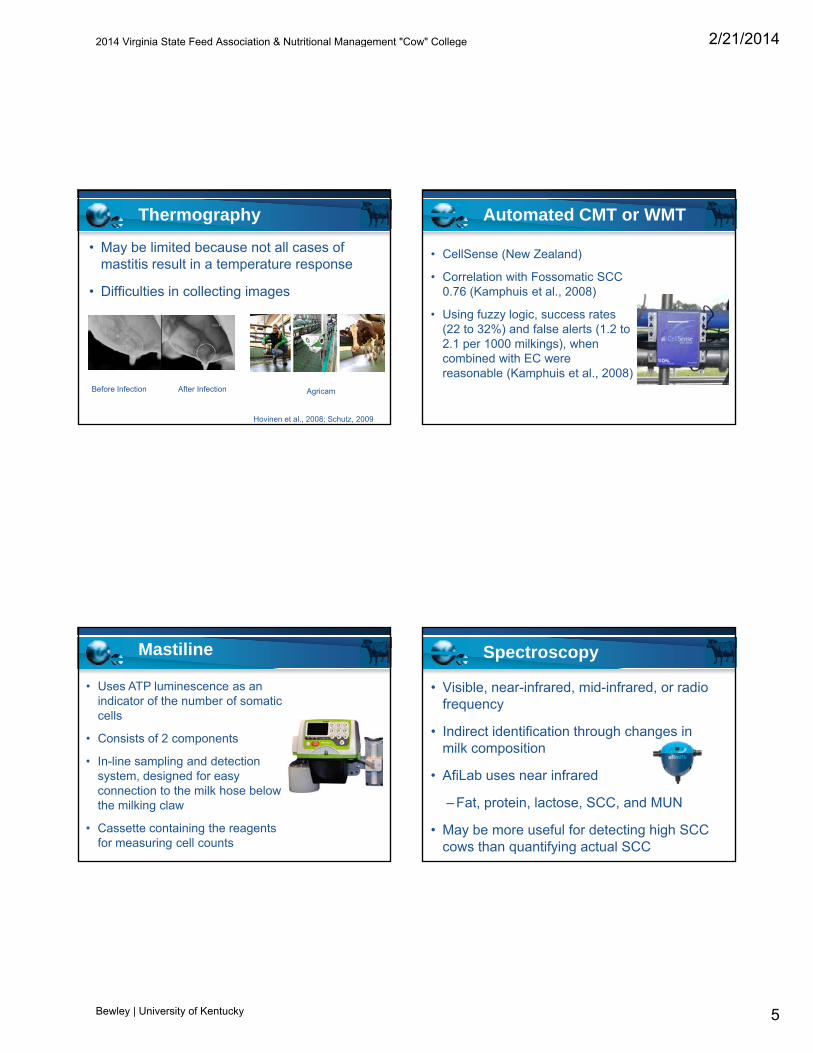
Thermography
• May be limited because not all cases of mastitis result in a temperature response
• Difficulties in collecting images
Hovinen et al., 2008; Schutz, 2009
Before Infection After Infection Agricam
Automated CMT or WMT
• CellSense (New Zealand)
• Correlation with Fossomatic SCC 0.76 (Kamphuis et al., 2008)
• Using fuzzy logic, success rates (22 to 32%) and false alerts (1.2 to 2.1 per 1000 milkings), when combined with EC were reasonable (Kamphuis et al., 2008)
Mastiline
• Uses ATP luminescence as an indicator of the number of somatic cells
• Consists of 2 componentsp
• In-line sampling and detection system, designed for easy connection to the milk hose below the milking claw
• Cassette containing the reagents for measuring cell counts
Spectroscopy
• Visible, near-infrared, mid-infrared, or radio frequency
• Indirect identification through changes in ilk itimilk composition
• AfiLab uses near infrared
– Fat, protein, lactose, SCC, and MUN
• May be more useful for detecting high SCC cows than quantifying actual SCC
2014 Virginia State Feed Association & Nutritional Management "Cow" College
Bewley | University of Kentucky
2/21/2014
6
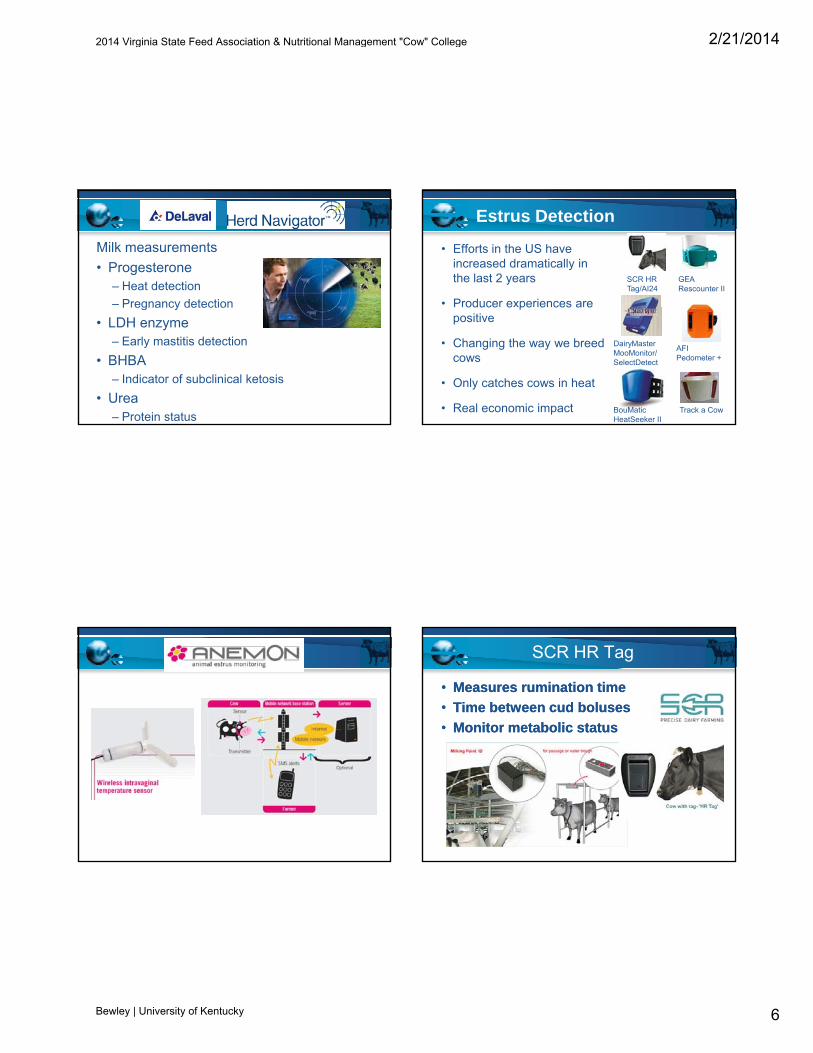
Milk measurements
• Progesterone– Heat detection
– Pregnancy detectionPregnancy detection
• LDH enzyme– Early mastitis detection
• BHBA– Indicator of subclinical ketosis
• Urea– Protein status
Estrus Detection
• Efforts in the US have increased dramatically in the last 2 years
• Producer experiences are
GEA Rescounter II
SCR HR Tag/AI24
oduce e pe e ces a epositive
• Changing the way we breed cows
• Only catches cows in heat
• Real economic impact
AFI Pedometer +
DairyMaster MooMonitor/SelectDetect
Track a CowBouMatic HeatSeeker II
SCR HR Tag
•• Measures rumination timeMeasures rumination time
•• Time between cud bolusesTime between cud boluses
•• Monitor metabolic statusMonitor metabolic status
2014 Virginia State Feed Association & Nutritional Management "Cow" College
Bewley | University of Kentucky

2/21/2014
7
SCR Rumination Time
Amanda Sterrett et al.
SCR HR Tag for Milk Fever Detection
Sterrett et al. Amanda Sterrett et al. , Unpublished Data
Lying Behavior Monitors
• On-farm evaluation of lying time:• Identification of cows requiring
attention (lameness, illness, ( , ,estrus)
• Assessment of facility functionality/cow comfort
• Potential metric to assess animal well-being
Rumen pH
• Illness
• Feeding/drinking behavior
• Acidosis
2014 Virginia State Feed Association & Nutritional Management "Cow" College
Bewley | University of Kentucky

2/21/2014
8
Vel’Phone Calving Detection CowManager Sensoor
•• TemperatureTemperature
•• ActivityActivity
•• RuminationRumination
•• Feeding TimeFeeding Time
Alanya Animal Health
• Behavioral changes
• Temperature
• Lying/Standing Time
• Grazing Time
• Lameness
• Estrus Detection (multiple metrics)
• Locomotion Scoring
ENGS Track a Cow: Feeding Time
Cable
2014 Virginia State Feed Association & Nutritional Management "Cow" College
Bewley | University of Kentucky
2/21/2014
9
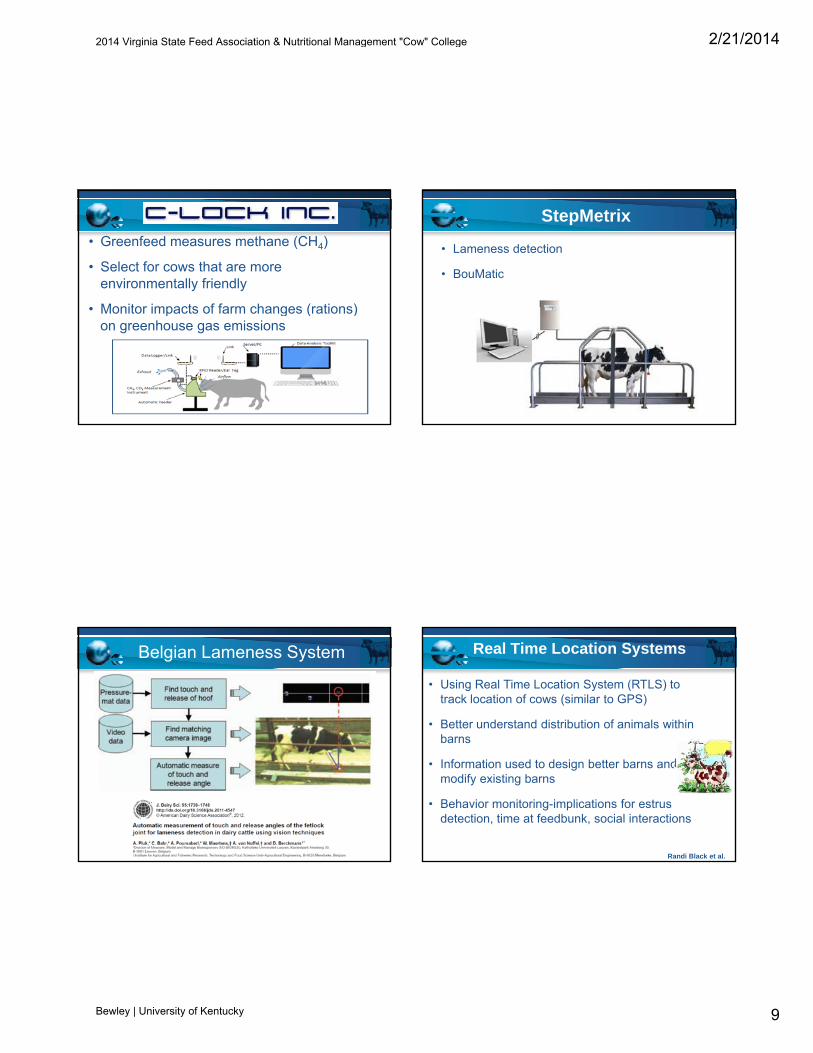
• Greenfeed measures methane (CH4)
• Select for cows that are more environmentally friendly
• Monitor impacts of farm changes (rations)• Monitor impacts of farm changes (rations) on greenhouse gas emissions
StepMetrix
• Lameness detection
• BouMatic
Belgian Lameness System Real Time Location Systems
• Using Real Time Location System (RTLS) to track location of cows (similar to GPS)
• Better understand distribution of animals within barns
• Information used to design better barns and modify existing barns
• Behavior monitoring-implications for estrus detection, time at feedbunk, social interactions
Randi Black et al.
2014 Virginia State Feed Association & Nutritional Management "Cow" College
Bewley | University of Kentucky

2/21/2014
10
GEA CowView
• Feeding time
• Waiting time
Resting time• Resting time
• Mounting
• Distance Covered
SmartBow
UK Coldstream Dairy Monitoring Capabilities
Technology Parameter(s) Measured
SmartBow Position, Movement
VelPhone Calving Time, Vaginal Temperature
Alanya Temperature, Lying Time, Activity,
Locomotion, BehaviorAfiLab Fat, Protein, Lactose, ,
Pedometer Plus Lying Time, StepsHR Tag Rumination Time, Neck Activity
Track-a-Cow Lying Time, Time at FeedbunkMastiline Somatic Cell Count
CowManager SensoorRumination Time, Feeding Time, Ear Skin
Temperature, Activity
IceQube Lying Time, Steps, LocomotionAnemon Vaginal Temperature, Estrus
TempTrack Reticulorumen TemperatureFeverTag Tympanic Temperature
AccuBreed Mounting ActivityCowScout Leg Activity
Thank You to All our
Consortium Sponsors!
Automated Body Condition Scoring
• Reduced labor requirements
• Less stressful on animal
• More objective, consistent measure
• Increased observation frequency
• Early identification of sick animals
• Tracking BCS trends of individual animals and management cohorts
2014 Virginia State Feed Association & Nutritional Management "Cow" College
Bewley | University of Kentucky
2/21/2014
11
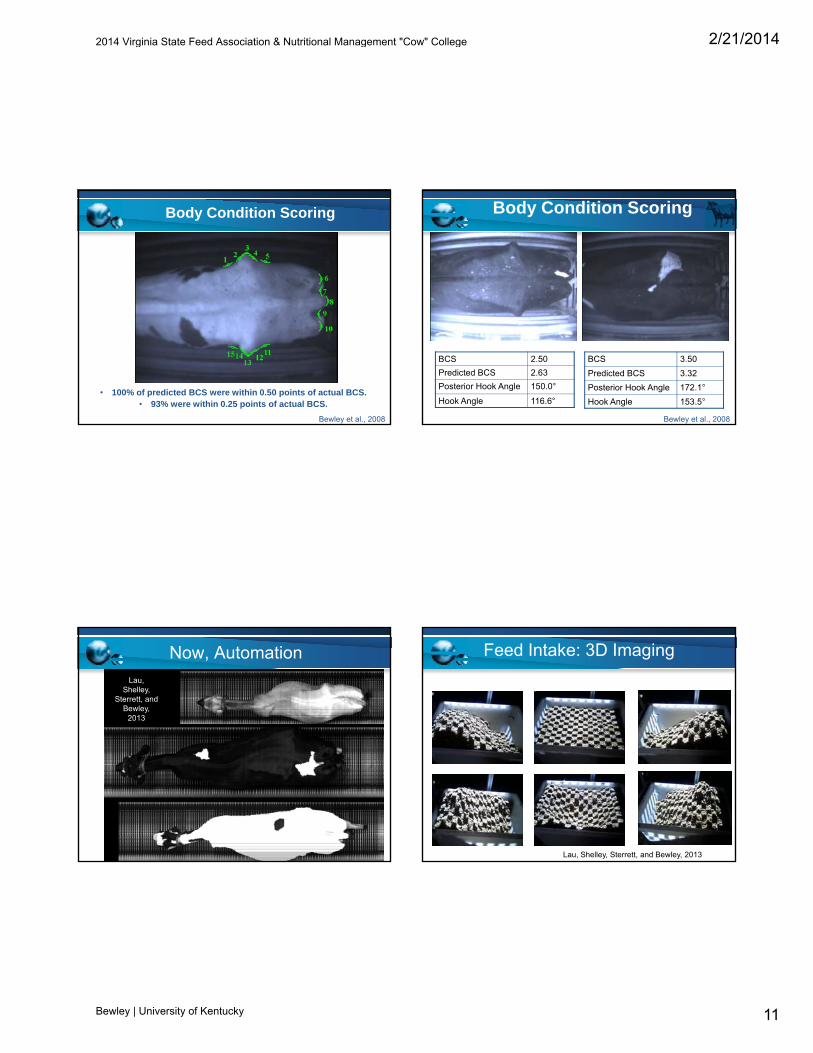
Body Condition Scoring
• 100% of predicted BCS were within 0.50 points of actual BCS.• 93% were within 0.25 points of actual BCS.
Bewley et al., 2008
Body Condition Scoring
BCS 2.50
Predicted BCS 2.63
Posterior Hook Angle 150.0°
Hook Angle 116.6°
BCS 3.50
Predicted BCS 3.32
Posterior Hook Angle 172.1°
Hook Angle 153.5°
Bewley et al., 2008
Now, AutomationLau,
Shelley, Sterrett, and
Bewley, 2013
Feed Intake: 3D Imaging
Lau, Shelley, Sterrett, and Bewley, 2013
2014 Virginia State Feed Association & Nutritional Management "Cow" College
Bewley | University of Kentucky
2/21/2014
12
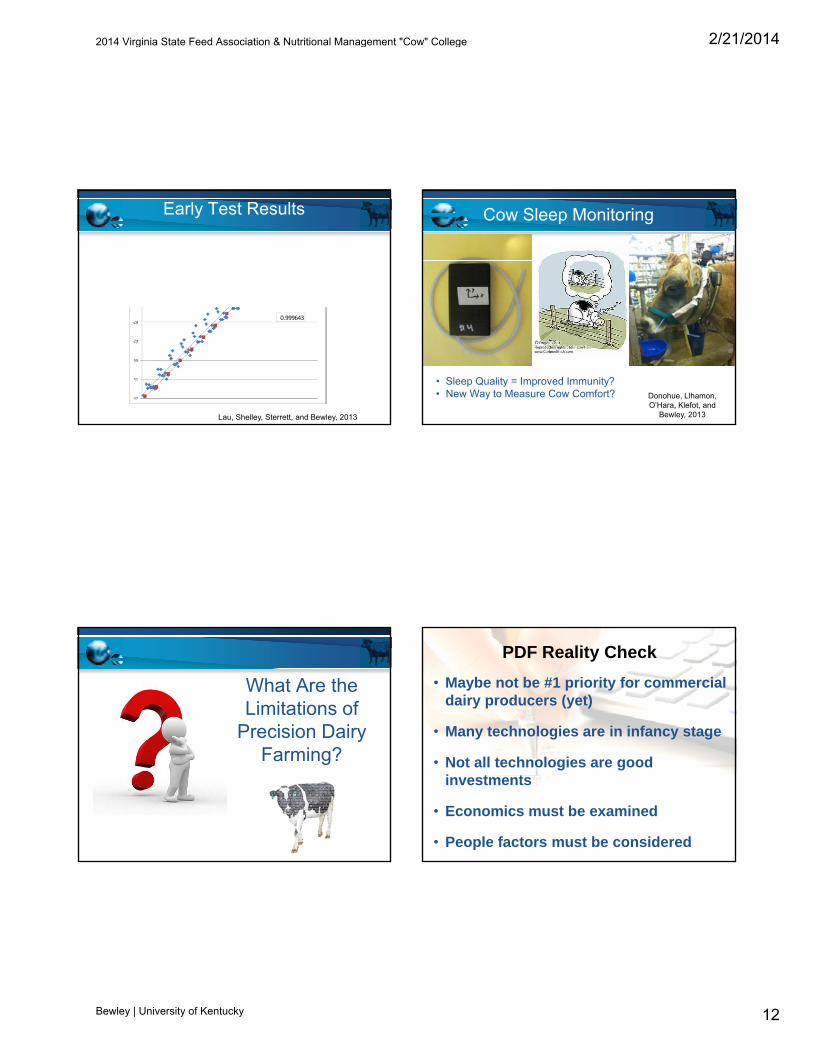
Early Test Results
0.999643
Lau, Shelley, Sterrett, and Bewley, 2013
Cow Sleep Monitoring
• Sleep Quality = Improved Immunity?• New Way to Measure Cow Comfort? Donohue, Llhamon,
O’Hara, Klefot, and Bewley, 2013
What Are the Limitations of
Precision Dairy Farming?
PDF Reality Check
• Maybe not be #1 priority for commercial dairy producers (yet)
• Many technologies are in infancy stage
• Not all technologies are good investments
• Economics must be examined
• People factors must be considered
2014 Virginia State Feed Association & Nutritional Management "Cow" College
Bewley | University of Kentucky
2/21/2014
13
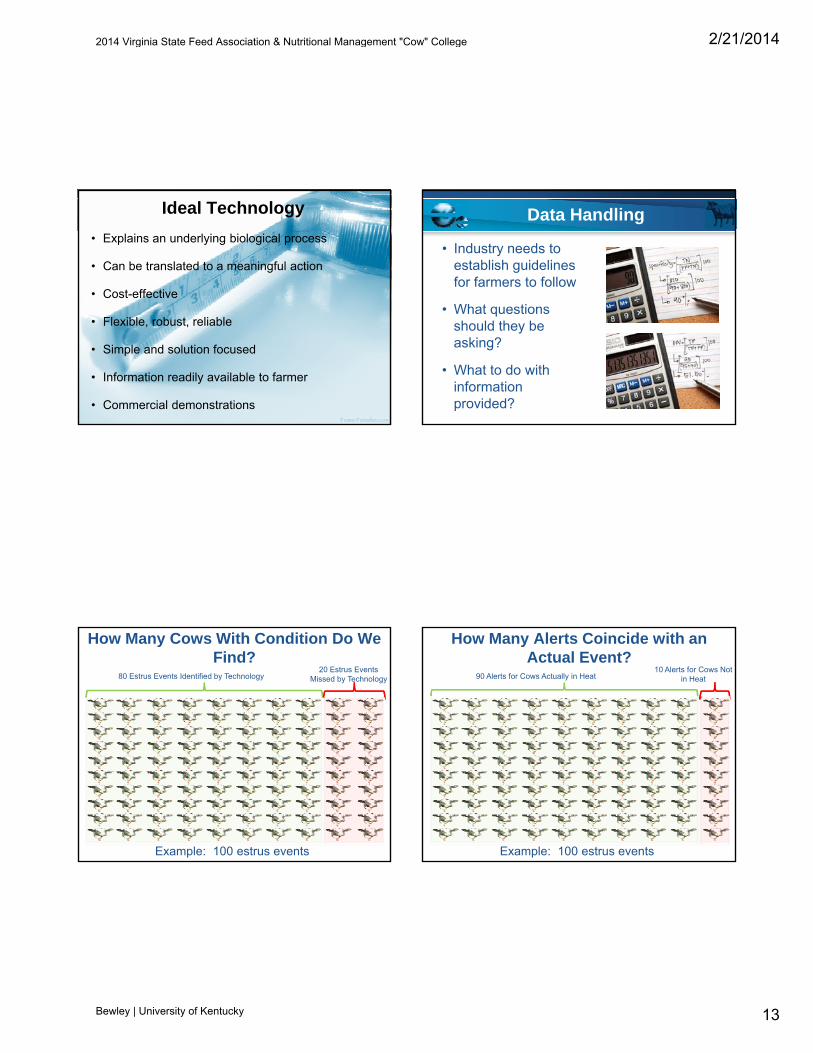
Ideal Technology
• Explains an underlying biological process
• Can be translated to a meaningful action
• Cost-effective
• Flexible, robust, reliable
• Simple and solution focused
• Information readily available to farmer
• Commercial demonstrations
Data Handling
• Industry needs to establish guidelines for farmers to follow
• What questions• What questions should they be asking?
• What to do with information provided?
How Many Cows With Condition Do We Find?
80 Estrus Events Identified by Technology20 Estrus Events
Missed by Technology
Example: 100 estrus events
How Many Alerts Coincide with an Actual Event?
90 Alerts for Cows Actually in Heat10 Alerts for Cows Not
in Heat
Example: 100 estrus events
2014 Virginia State Feed Association & Nutritional Management "Cow" College
Bewley | University of Kentucky

2/21/2014
14
Sensitivity/Specificity Battle
• ↑ Sensitivity by lowering threshold, BUT…
↓ Specificity (more false positives)
↑ Specificity by raising threshold BUT• ↑ Specificity by raising threshold, BUT…
↓ Sensitivity (more missed events)
• Trade off between the two
What’s the Sweet Spot?
• Cost of missed event
– High for estrus
– Lower for diseases?
• Cost of false positive
– Low for estrus
– High for mastitis
• Farm dependent
Economic Considerations
• Need to do investment analysis
• Not one size fits all
• Economic benefits observed quickest for heat detection/reproduction
• If you don’t do anything with the information, it was useless
• Systems that measure multiple parameters make most sense
• Systems with low fixed costs work best for small farms
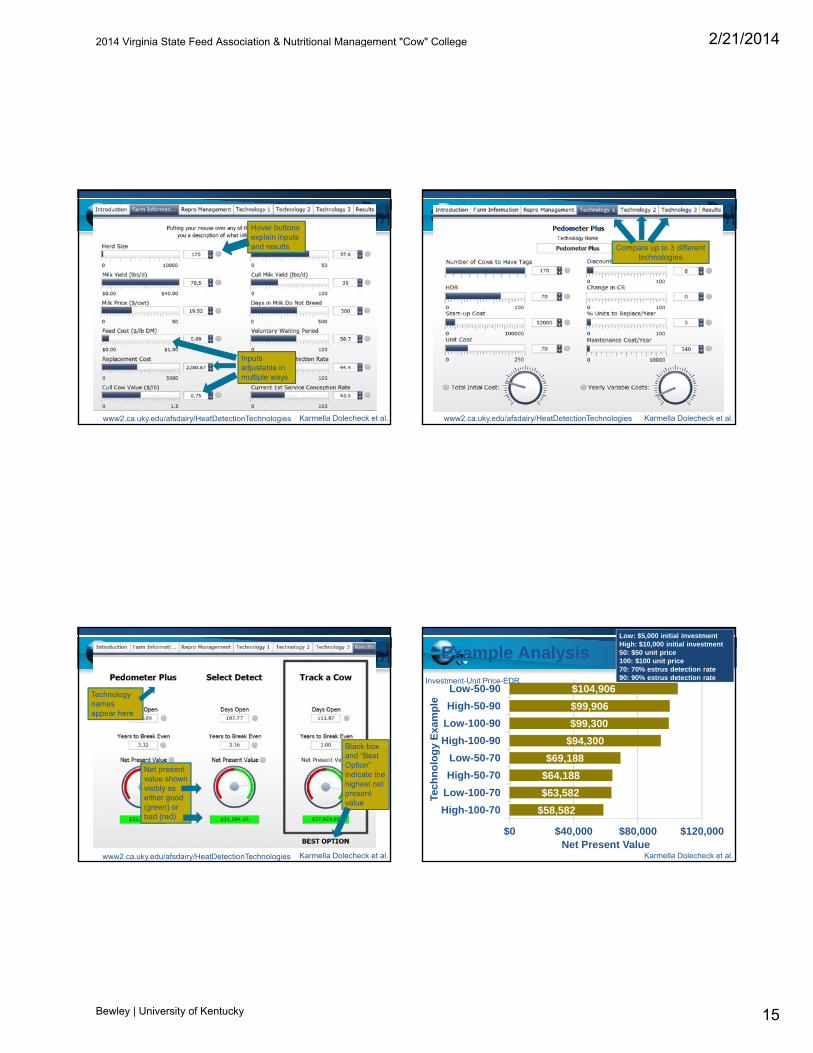
Tabs organize information
Description and instructions for userfor user
www2.ca.uky.edu/afsdairy/HeatDetectionTechnologies Karmella Dolecheck et al.
2014 Virginia State Feed Association & Nutritional Management "Cow" College
Bewley | University of Kentucky
2/21/2014
15
Hover buttons explain inputs and results
Inputs adjustable in multiple ways
www2.ca.uky.edu/afsdairy/HeatDetectionTechnologies Karmella Dolecheck et al.
Compare up to 3 different technologies
www2.ca.uky.edu/afsdairy/HeatDetectionTechnologies Karmella Dolecheck et al.
Technology names appear here
Black box
Net present value shown visibly as either good (green) or bad (red)
Black box and “Best Option” indicate the highest net present value
www2.ca.uky.edu/afsdairy/HeatDetectionTechnologies Karmella Dolecheck et al.
Example Analysis
$94,300
$99,300
$99,906
$104,906
High-100-90
Low-100-90
High-50-90
Low-50-90
y E
xam
ple
Low: $5,000 initial investmentHigh: $10,000 initial investment50: $50 unit price100: $100 unit price70: 70% estrus detection rate90: 90% estrus detection rate Investment-Unit Price-EDR
$58,582
$63,582
$64,188
$69,188
$ ,
$0 $40,000 $80,000 $120,000
High-100-70
Low-100-70
High-50-70
Low-50-70
g
Net Present Value
Tech
no
log
y
Karmella Dolecheck et al.
2014 Virginia State Feed Association & Nutritional Management "Cow" College
Bewley | University of Kentucky

2/21/2014
16
Technology Pitfalls
• “Plug and play,” “Plug and pray,” or “Plug and pay”
• Technologies go to market too quickly
• Not fully-developed
• Software not user-friendly
• Developed independently without consideration of integration with other technologies and farmer work patterns
Technology Pitfalls
• Too many single measurement systems
• Lack of large-scale commercial field trials and demonstrations
• Technology marketed without adequate interpretation of biological significance of data
• Information provided with no clear action plan
• Be prepared for little things to go wrong
• Be careful with early stage technologiesBe careful with early stage technologies
• Need a few months to learn how to use data
• Data integration is challenging
UK Herdsman Office
2014 Virginia State Feed Association & Nutritional Management "Cow" College
Bewley | University of Kentucky

2/21/2014
17
From Purdue to Poor Due
Did I get the wrong
PhD?
The Book of David:Cow People Benefit Most
Why Have Adoption RatesAdoption Rates
Been Slow?
Rebecca Russell
Reason #1. Not familiar with technologies that are available
(N =101, 55%)
2014 Virginia State Feed Association & Nutritional Management "Cow" College
Bewley | University of Kentucky

2/21/2014
18
Reason #2. Undesirable cost to benefit ratio
(N =77, 42%)
Reason #3. Too much information provided without knowing what to do
with it(N =66, 36%)
Reason #4. Not enough time to spend on technology
(N =56, 30%)
Reason #5. Lack of perceived economic value(N =55, 30%)
2014 Virginia State Feed Association & Nutritional Management "Cow" College
Bewley | University of Kentucky
2/21/2014
19
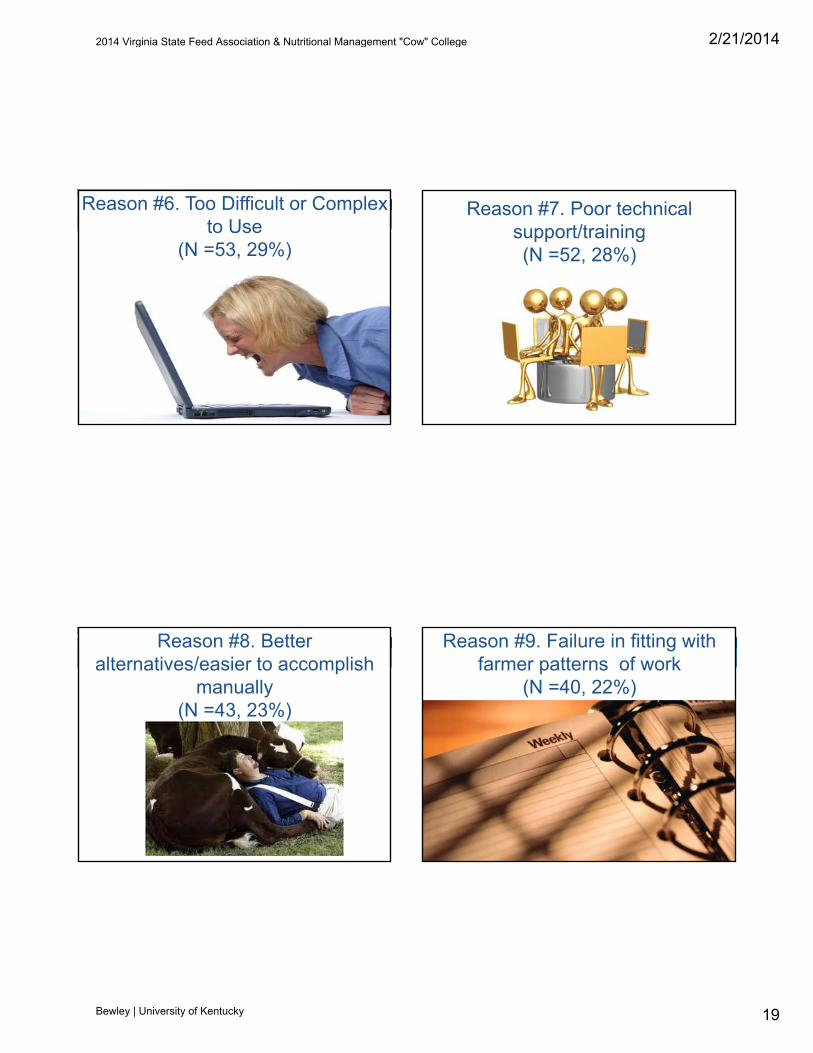
Reason #6. Too Difficult or Complex to Use
(N =53, 29%)
Reason #7. Poor technical support/training(N =52, 28%)
Reason #8. Better alternatives/easier to accomplish
manually(N =43, 23%)
Reason #9. Failure in fitting with farmer patterns of work
(N =40, 22%)
2014 Virginia State Feed Association & Nutritional Management "Cow" College
Bewley | University of Kentucky

2/21/2014
20
Reason #10. Fear of technology/computer illiteracy
(N =39, 21%)
Reason #11. Not reliable or flexible enough
(N =33, 18%)
Reason #99. Wrong College Degree
(N =289, 100%)
Customer Service is Key
• More important than the gadget
• Computer literacy
• Not engineers
• Time limits
• Failure of hardware and software
2014 Virginia State Feed Association & Nutritional Management "Cow" College
Bewley | University of Kentucky
2/21/2014
21
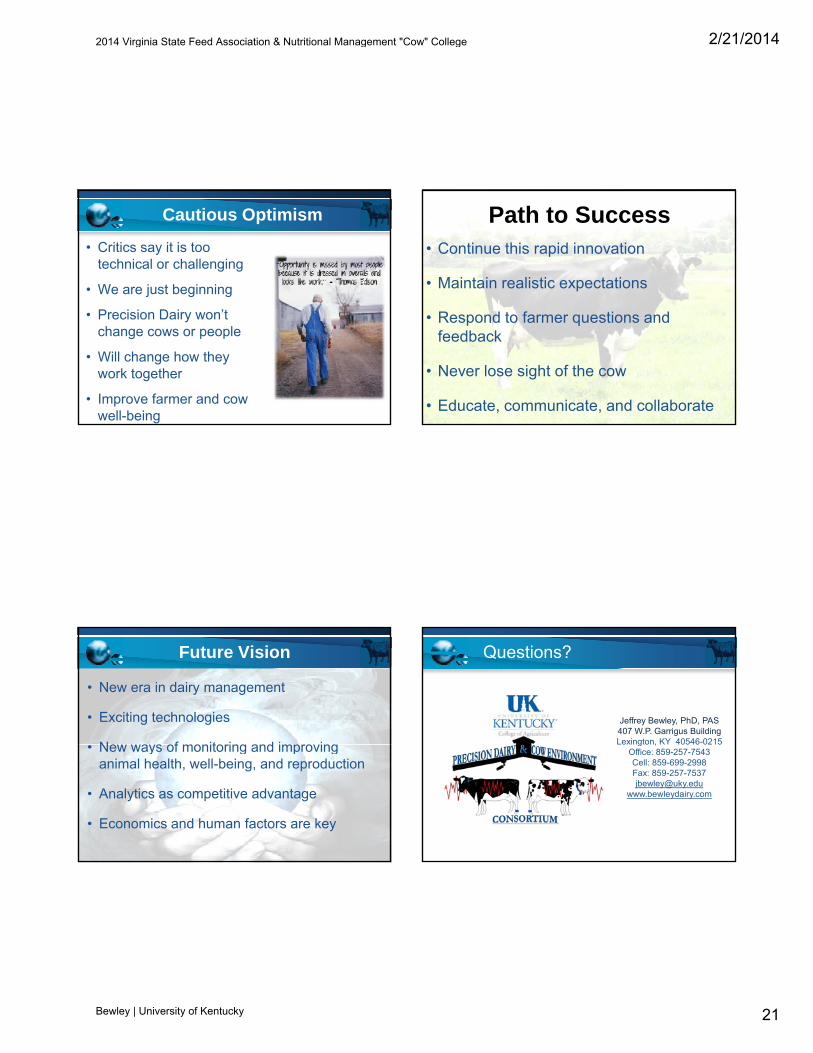
Cautious Optimism
• Critics say it is too technical or challenging
• We are just beginning
• Precision Dairy won’t change cows or people
• Will change how they work together
• Improve farmer and cow well-being
Path to Success• Continue this rapid innovation
• Maintain realistic expectations
• Respond to farmer questions and feedback
• Never lose sight of the cow
• Educate, communicate, and collaborate
Future Vision
• New era in dairy management
• Exciting technologies
New ways of monitoring and improving• New ways of monitoring and improving animal health, well-being, and reproduction
• Analytics as competitive advantage
• Economics and human factors are key
Questions?
Jeffrey Bewley, PhD, PAS407 W.P. Garrigus BuildingLexington, KY 40546-0215g ,
Office: 859-257-7543Cell: 859-699-2998Fax: [email protected]
www.bewleydairy.com
2014 Virginia State Feed Association & Nutritional Management "Cow" College
Bewley | University of Kentucky