farmstead at long meadow ranch expansion project …
TRANSCRIPT

FARMSTEAD AT LONG MEADOW RANCH EXPANSION PROJECT DRAFT AIR QUALITY & GREENHOUSE GAS EMISSIONS ASSESSMENT
St. Helena, California
August 23, 2016 Updated December 2019 & February 27, 2020
Prepared for: Elliot S. Faxstein Director of Special Projects Long Meadow Ranch PO Box 477 Rutherford, CA 94573
Prepared by:
James Reyff
1 Willowbrook Court, Suite 120 Petaluma, CA 94954 (707) 794-0400
Project: 16-125

1
Introduction
The purpose of this report is to address air quality, toxic air contaminant (TAC), and greenhouse gas (GHG) emission impacts associated with the proposed lodging facility and Long Meadow Ranch expansion project located on an approximate 10-acre parcel along the east side of State Route 29 at Mills Lane in St. Helena, California. We understand that the lodging facility would consist of 65 units, 908 square feet (sf) of Farmer’s Market expansion, and associated parking facility. Air quality and GHG impacts could occur due to temporary construction emissions and as a result of direct and indirect emissions from new employees and customers. The primary issue addressed in this air quality study is localized community risk impacts from emissions of project construction equipment and the emissions resulting from the operation of the project. This analysis was conducted following guidance provided by the Bay Area Air Quality Management District (BAAQMD).
2019 Update to this Analysis
Illingworth & Rodkin, Inc. prepared the air quality study for this project in 20161. This report is an update to that analysis, to incorporate the most recent traffic study in predicting operational GHG emissions2. Our understanding is that the traffic study was updated to conform with current activity at the Farmstead location. The traffic studies are used in the air quality and GHG emissions assessment to provide the amount of daily traffic that is generated by operation of the project. These data are input to the CalEEMod model to predict annual emissions of GHG and average daily emissions of air pollutants caused by operation of the project. Therefore, the operational emissions forecasted for the project are updated in this report to reflect the latest traffic data and the most recent version of the CalEEMod model, Version 2016.3.2. Note that BAAQMD updated their Clean Air Plan in 2017 (since this report was published); however, that does not affect the findings in this report. The construction portion of the analysis was not affected by the traffic projections, and therefore, that previous analysis is carried forward in this updated report. The 200-person events were included in this update.
Setting
The project is located in Napa County, which is in the San Francisco Bay Area Air Basin. Ambient air quality standards have been established at both the State and federal level. The Bay Area meets all ambient air quality standards with the exception of ground-level ozone, respirable particulate matter (PM10), and fine particulate matter (PM2.5).
Air Pollutants of Concern
High ozone levels are caused by the cumulative emissions of reactive organic gases (ROG) and nitrogen oxides (NOx). These precursor pollutants react under certain meteorological conditions to form high ozone levels. Controlling the emissions of these precursor pollutants is the focus of the Bay Area’s attempts to reduce ozone levels. The highest ozone levels in the Bay Area occur
1 Illingworth & Rodkin, Inc. 2016. Farmstead at Long Meadow Ranch Expansion Project Draft Air Quality
& Greenhouse Gas Emissions Assessment. August 23.2 CTG. 2019. Traffic Impact Report – Proposed Farmstead at Long Meadow Ranch. November 21.

2
in the eastern and southern inland valleys that are downwind of air pollutant sources. High ozone levels aggravate respiratory and cardiovascular diseases, reduced lung function, and increase coughing and chest discomfort.
Particulate matter is another problematic air pollutant of the Bay Area. Particulate matter is assessed and measured in terms of respirable particulate matter or particles that have a diameter of 10 micrometers or less (PM10) and fine particulate matter where particles have a diameter of 2.5 micrometers or less (PM2.5). Elevated concentrations of PM10 and PM2.5 are the result of both region-wide (or cumulative) emissions and localized emissions. High particulate matter levels aggravate respiratory and cardiovascular diseases, reduce lung function, increase mortality (e.g., lung cancer), and result in reduced lung function growth in children.
Toxic Air Contaminants
Toxic air contaminants (TAC) are a broad class of compounds known to cause morbidity or mortality (usually because they cause cancer) and include, but are not limited to, the criteria air pollutants. TACs are found in ambient air, especially in urban areas, and are caused by industry, agriculture, fuel combustion, and commercial operations (e.g., dry cleaners). TACs are typically found in low concentrations, even near their source (e.g., diesel particulate matter [DPM] near a freeway). Because chronic exposure can result in adverse health effects, TACs are regulated at the regional, State, and federal level.
Diesel exhaust is the predominant TAC in urban air and is estimated to represent about three-quarters of the cancer risk from TACs (based on the Bay Area average). According to the California Air Resources Board (CARB), diesel exhaust is a complex mixture of gases, vapors, and fine particles. This complexity makes the evaluation of health effects of diesel exhaust a complex scientific issue. Some of the chemicals in diesel exhaust, such as benzene and formaldehyde, have been previously identified as TACs by the CARB, and are listed as carcinogens either under the State's Proposition 65 or under the Federal Hazardous Air Pollutants programs.
CARB has adopted and implemented a number of regulations for stationary and mobile sources to reduce emissions of DPM. Several of these regulatory programs affect medium and heavy duty diesel trucks that represent the bulk of DPM emissions from California highways. These regulations include the solid waste collection vehicle (SWCV) rule, in-use public and utility fleets, and the heavy-duty diesel truck and bus regulations. In 2008, CARB approved a new regulation to reduce emissions of DPM and nitrogen oxides from existing on-road heavy-duty diesel fueled vehicles.3 The regulation requires affected vehicles to meet specific performance requirements between 2014 and 2023, with all affected diesel vehicles required to have 2010 model-year engines or equivalent by 2023. These requirements are phased in over the compliance period and depend on the model year of the vehicle.
The BAAQMD is the regional agency tasked with managing air quality in the region. At the State level, the CARB (a part of the California Environmental Protection Agency [EPA]) oversees regional air district activities and regulates air quality at the State level. The BAAQMD
3 Available online: http://www.arb.ca.gov/msprog/onrdiesel/onrdiesel.htm. Accessed: June 9, 2015.

3
has recently published California Environmental Quality Act (CEQA) Air Quality Guidelines that are used in this assessment to evaluate air quality impacts of projects.4 Sensitive Receptors There are groups of people more affected by air pollution than others. CARB has identified the following persons who are most likely to be affected by air pollution: children under 16, the elderly over 65, athletes, and people with cardiovascular and chronic respiratory diseases. These groups are classified as sensitive receptors. Locations that may contain a high concentration of these sensitive population groups include residential areas, hospitals, daycare facilities, elder care facilities, elementary schools, and parks. The closest sensitive receptors include residences to the north of the project site and the St. Helena High School to the southwest of the project site. There are residences further to the west. Greenhouse Gases Gases that trap heat in the atmosphere, GHGs, regulate the earth’s temperature. This phenomenon, known as the greenhouse effect, is responsible for maintaining a habitable climate. The most common GHGs are carbon dioxide (CO2) and water vapor but there are also several others, most importantly methane (CH4), nitrous oxide (N2O), hydrofluorocarbons (HFCs), perfluorocarbons (PFCs), and sulfur hexafluoride (SF6). These are released into the earth’s atmosphere through a variety of natural processes and human activities. Sources of GHGs are generally as follows:
• CO2 and N2O are byproducts of fossil fuel combustion. • N2O is associated with agricultural operations such as fertilization of crops. • CH4 is commonly created by off-gassing from agricultural practices (e.g., keeping
livestock) and landfill operations. • Chlorofluorocarbons (CFCs) were widely used as refrigerants, propellants, and cleaning
solvents but their production has been stopped by international treaty. • HFCs are now used as a substitute for CFCs in refrigeration and cooling. • PFCs and sulfur hexafluoride emissions are commonly created by industries such as
aluminum production and semi-conductor manufacturing. Each GHG has its own potency and effect upon the earth’s energy balance. This is expressed in terms of a global warming potential (GWP), with CO2 being assigned a value of 1 and sulfur hexafluoride being several orders of magnitude stronger with a GWP of 23,900. In GHG emission inventories, the weight of each gas is multiplied by its GWP and is measured in units of CO2 equivalents (CO2e). An expanding body of scientific research supports the theory that global warming is currently affecting changes in weather patterns, average sea level, ocean acidification, chemical reaction rates, and precipitation rates, and that it will increasingly do so in the future. The climate and several naturally occurring resources within California could be adversely affected by the global warming trend. Increased precipitation and sea level rise could increase coastal flooding,
4 Bay Area Air Quality Management District, 2017. BAAQMD CEQA Air Quality Guidelines. May.
4
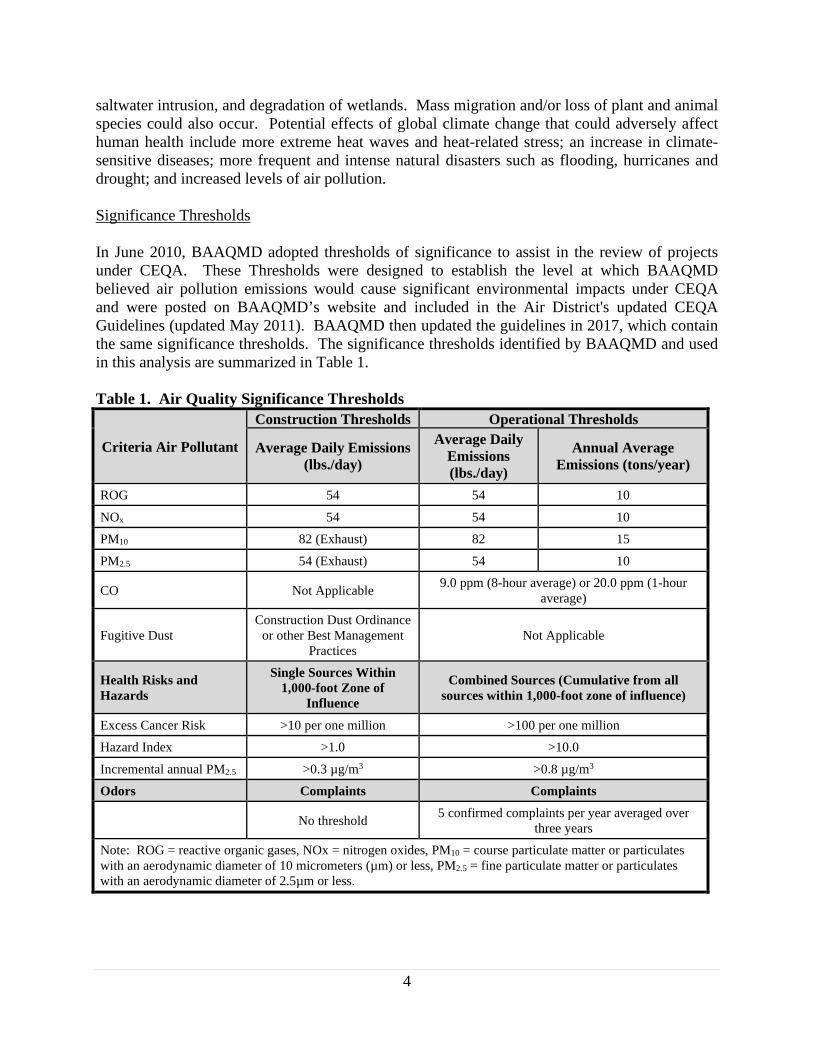
saltwater intrusion, and degradation of wetlands. Mass migration and/or loss of plant and animal species could also occur. Potential effects of global climate change that could adversely affect human health include more extreme heat waves and heat-related stress; an increase in climate-sensitive diseases; more frequent and intense natural disasters such as flooding, hurricanes and drought; and increased levels of air pollution. Significance Thresholds In June 2010, BAAQMD adopted thresholds of significance to assist in the review of projects under CEQA. These Thresholds were designed to establish the level at which BAAQMD believed air pollution emissions would cause significant environmental impacts under CEQA and were posted on BAAQMD’s website and included in the Air District's updated CEQA Guidelines (updated May 2011). BAAQMD then updated the guidelines in 2017, which contain the same significance thresholds. The significance thresholds identified by BAAQMD and used in this analysis are summarized in Table 1. Table 1. Air Quality Significance Thresholds
Criteria Air Pollutant
Construction Thresholds Operational Thresholds
Average Daily Emissions (lbs./day)
Average Daily Emissions (lbs./day)
Annual Average Emissions (tons/year)
ROG 54 54 10
NOx 54 54 10 PM10 82 (Exhaust) 82 15
PM2.5 54 (Exhaust) 54 10
CO Not Applicable 9.0 ppm (8-hour average) or 20.0 ppm (1-hour average)
Fugitive Dust Construction Dust Ordinance
or other Best Management Practices
Not Applicable
Health Risks and Hazards
Single Sources Within 1,000-foot Zone of
Influence
Combined Sources (Cumulative from all sources within 1,000-foot zone of influence)
Excess Cancer Risk >10 per one million >100 per one million Hazard Index >1.0 >10.0
Incremental annual PM2.5 >0.3 µg/m3 >0.8 µg/m3 Odors Complaints Complaints
No threshold 5 confirmed complaints per year averaged over three years
Note: ROG = reactive organic gases, NOx = nitrogen oxides, PM10 = course particulate matter or particulates with an aerodynamic diameter of 10 micrometers (µm) or less, PM2.5 = fine particulate matter or particulates with an aerodynamic diameter of 2.5µm or less.

5
Impacts and Project Measures
Impact 1: Conflict with or obstruct implementation of the applicable air quality plan? Less than significant.
The most recent clean air plan is the Bay Area 2010 Clean Air Plan that was adopted by BAAQMD in September 2010. The proposed project would not conflict with the latest Clean Air planning efforts since the project would have emissions well below the BAAQMD thresholds (see Impact 2). The project is too small to exceed any of the significance thresholds and, thus, it is not required to incorporate project-specific transportation control measures listed in the latest Clean Air Plan.
Impact 2: Result in a cumulatively considerable net increase of any criteria pollutant for
which the project region is non-attainment under an applicable State or federal ambient air quality standard (including releasing emissions which exceed quantitative thresholds for ozone precursors)? Less than significant with construction period control measures.
The Bay Area is considered a non-attainment area for ground-level ozone and PM2.5 under both the Federal Clean Air Act and the California Clean Air Act. The area is also considered non-attainment for PM10 under the California Clean Air Act, but not the federal act. The area has attained both State and federal ambient air quality standards for carbon monoxide. As part of an effort to attain and maintain ambient air quality standards for ozone and PM10, the BAAQMD has established thresholds of significance for these air pollutants and their precursors. These thresholds are for ozone precursor pollutants (ROG and NOx), PM10, and PM2.5 and apply to both construction period and operational period impacts. Due to the project size, construction- and operational-period emissions would be less than significant. In the 2011 and 2017 update to the CEQA Air Quality Guidelines, BAAQMD identifies screening criteria for the sizes of land use projects that could result in significant air pollutant emissions. For operational impacts, the screening project size is identified at 489 rooms. For construction impacts, the screening size is identified as 554 rooms. Hotel projects of smaller size would be expected to have less-than-significant impacts. Since the project proposes to develop up to 65 rooms, it is concluded that emissions would be below the BAAQMD significance thresholds. Stationary sources of air pollution (e.g., back-up generators) have not been identified with this project. Construction activities, particularly during site preparation and grading would temporarily generate fugitive dust in the form of PM10 and PM2.5. Sources of fugitive dust would include disturbed soils at the construction site and trucks carrying uncovered loads of soils. Unless properly controlled, vehicles leaving the site would deposit mud on local streets, which could be an additional source of airborne dust after it dries. Fugitive dust emissions would vary from day to day, depending on the nature and magnitude of construction activity and local weather conditions. Fugitive dust emissions would also depend on soil moisture, silt content of soil, wind speed, and the amount of equipment operating. Larger dust particles would settle near the source, while fine particles would be dispersed over greater distances from the construction site. The BAAQMD CEQA Air Quality Guidelines consider these impacts to be less than significant

6
if best management practices are employed to reduce these emissions. Mitigation Measure 1 would implement BAAQMD-required best management practices.
Mitigation Measure 1: Include basic measures to control dust and exhaust during construction.
During any construction period ground disturbance, the applicant shall ensure that the project contractor implement measures to control dust and exhaust. Implementation of the measures recommended by BAAQMD and listed below would reduce the air quality impacts associated with grading and new construction to a less than significant level. The contractor shall implement the following best management practices that are required of all projects:
1. All exposed surfaces (e.g., parking areas, staging areas, soil piles, graded areas, and unpaved access roads) shall be watered two times per day.
2. All haul trucks transporting soil, sand, or other loose material off-site shall be
covered. 3. All visible mud or dirt track-out onto adjacent public roads shall be removed
using wet power vacuum street sweepers at least once per day. The use of dry power sweeping is prohibited.
4. All vehicle speeds on unpaved roads shall be limited to 15 miles per hour (mph). 5. All roadways, driveways, and sidewalks to be paved shall be completed as soon
as possible. Building pads shall be laid as soon as possible after grading unless seeding or soil binders are used.
6. Idling times shall be minimized either by shutting equipment off when not in use
or reducing the maximum idling time to 5 minutes (as required by the California airborne toxics control measure Title 13, Section 2485 of California Code of Regulations [CCR]). Clear signage shall be provided for construction workers at all access points.
7. All construction equipment shall be maintained and properly tuned in accordance
with manufacturer’s specifications. All equipment shall be checked by a certified mechanic and determined to be running in proper condition prior to operation.
8. Post a publicly visible sign with the telephone number and person to contact at the
Lead Agency regarding dust complaints. This person shall respond and take corrective action within 48 hours. The Air District’s phone number shall also be visible to ensure compliance with applicable regulations.
Impact 3: Violate any air quality standard or contribute substantially to an existing or projected air quality violation? Less than significant.
7
As discussed under Impact 2, the project would have emissions less than the BAAQMD screening size for evaluating impacts related to ozone and particulate matter. Therefore, the project would not contribute substantially to existing or projected violations of those standards. Carbon monoxide emissions from traffic generated by the project would be the pollutant of greatest concern at the local level. Congested intersections with a large volume of traffic have the greatest potential to cause high-localized concentrations of carbon monoxide. Air pollutant monitoring data indicate that carbon monoxide levels have been at healthy levels (i.e., below State and federal standards) in the Bay Area since the early 1990s. As a result, the region has been designated as attainment for the standard. The highest measured level over any 8-hour averaging period during the last 3 years in the Bay Area is less than 3.0 parts per million (ppm), compared to the ambient air quality standard of 9.0 ppm. Intersections affected by the project would have traffic volumes less than the BAAQMD screening criteria and, thus, would not cause a violation of an ambient air quality standard or have a considerable contribution to cumulative violations of these standards.5
Impact 4: Expose sensitive receptors to substantial pollutant concentrations? Less than significant construction period control measures.
Project impacts related to increased community risk can occur either by introducing a new sensitive receptor, such as a residential use, in proximity to an existing source of TACs or by introducing a new source of TACs with the potential to adversely affect existing sensitive receptors in the project vicinity. The BAAQMD recommends using a 1,000-foot screening radius around a project site for purposes of identifying community health risk from siting a new sensitive receptor or a new source of TACs. Operation of the project is not expected to cause any localized emissions that could expose sensitive receptors to unhealthy air pollutant levels. No stationary sources of TACs, such as generators, are proposed as part of the project. The project would not introduce new sensitive receptors to the area. There are thresholds that address both the impact of single and cumulative TAC sources upon projects that include new sensitive receptors (see Table 1). Construction activity would generate dust and equipment exhaust on a temporary basis that could affect nearby sensitive receptors (residences and St. Helena High School). Project Construction Activity Construction activities, particularly during site preparation and grading would temporarily generate fugitive dust in the form of respirable particulate matter (PM10) and PM2.5. Sources of fugitive dust would include disturbed soils at the construction site and trucks carrying uncovered loads of soils. Unless properly controlled, vehicles leaving the site would deposit mud on local streets, which could be an additional source of airborne dust after it dries. The BAAQMD CEQA Air Quality Guidelines consider these impacts to be less than significant if best management practices are employed to reduce these emissions. Mitigation Measure 1 would implement BAAQMD-required best management practices. Construction equipment and associated heavy-duty truck traffic generates diesel exhaust, which is a known TAC. These exhaust air pollutant emissions would not be considered to contribute
5 For a land-use project type, the BAAQMD CEQA Air Quality Guidelines state that a proposed project would result in a less than significant impact to localized carbon monoxide concentrations if the project would not increase traffic at affected intersections with more than 44,000 vehicles per hour.

8
substantially to existing or projected air quality violations. Construction exhaust emissions may still pose community risks for sensitive receptors such as nearby residents. The primary community risk impact issues associated with construction emissions are cancer risk and exposure to PM2.5. Diesel exhaust poses both a potential health and nuisance impact to nearby receptors. A community risk assessment of the project construction activities was conducted that evaluated potential health effects of sensitive receptors at these nearby residences from construction emissions of DPM and PM2.5.6 The closest sensitive receptors include single-family residences to the north of the project site and the St. Helena High School to the southwest of the project site. Emissions and dispersion modeling was conducted to predict the off-site DPM concentrations resulting from project construction, so that lifetime cancer risks and non-cancer health effects could be evaluated. Attachment 1 includes the detailed health risk calculation methodology. Construction Period Emissions The California Emissions Estimator Model (CalEEMod) Version 2013.2.2 was used to predict annual emissions for construction. CalEEMod provides emission estimates for both on-site and off-site construction activities. On-site activities are primarily made up of construction equipment emissions, while off-site activity includes worker, hauling, and vendor traffic. The proposed project land uses were input into CalEEMod, which included 65 rooms entered as “Hotel,” 908 square feet (sf) entered as “High Turnover (Sit-down) Restaurant”, and 70 spaces entered as “Parking Lot” on a 10.5-acre site. A construction build-out scenario, including equipment list and phasing schedule provided by the applicant was entered into the model. It is expected that 8,000 cubic yards (cy) of soil import would be necessary, which was entered into the model. In addition, 250 one-way asphalt truck trips based on 2,000 cy of asphalt are expected during the paving phase and were entered into the model. It is anticipated that temporary line power will be available to the site, so no generators are expected. In addition, liquid propane gas (LPG) aerial lifts are anticipated for use in place of diesel lifts. Attachment 2 includes the CalEEMod input and output values for construction emissions. The CalEEMod model provided total annual PM2.5 exhaust emissions (assumed to be DPM) for the off-road construction equipment and for exhaust emissions from on-road vehicles, with total emissions from all construction stages of 0.1371 tons (274 pounds). The on-road emissions are a result of haul truck travel during grading activities, worker travel, and vendor deliveries during construction. A trip length of half a mile was used to represent vehicle travel while at or near the construction site. It was assumed that these emissions from on-road vehicles traveling at or near the site would occur at the construction site. Fugitive PM2.5 dust emissions were calculated by CalEEMod as 0.1048 tons (210 pounds) for the overall construction period. Dispersion Modeling The U.S. EPA ISCST3 dispersion model was used to predict concentrations of DPM and PM2.5 concentrations at existing sensitive receptors (residences and high school) in the vicinity of the project site. The ISCST3 modeling utilized two area sources to represent the on-site construction emissions, one for DPM exhaust emissions and the other for fugitive PM2.5 dust emissions. To
6 DPM is identified by California as a toxic air contaminant due to the potential to cause cancer.

9
represent the construction equipment exhaust emissions, an emission release height of six meters was used for the area source. The elevated source height reflects the height of the equipment exhaust pipes and buoyancy of the exhaust plume. For modeling fugitive PM2.5 emissions, a near ground level release height of two meters was used for the area source. Emissions from vehicle travel around the project site were included in the modeled area sources. Construction emissions were modeled as occurring daily between 7 a.m. - 4 p.m., when the majority of construction activity would occur. The modeling used a two-year data set (2000-2001) of hourly meteorological data from Napa Sewage Treatment Plant prepared for use with the ICST3 model by the BAAQMD. Annual DPM and PM2.5 concentrations from construction activities in 2017 and 2018 were calculated using the model. DPM and PM2.5 concentrations were calculated at nearby residential locations. Receptor heights of 1.5 meters (4.9 feet) were used in the modeling to represent the breathing heights of nearby residences. Figure 1 shows the construction area modeled, and locations of nearby residential receptors. Predicted Cancer Risk and Hazards The maximum-modeled DPM and PM2.5 concentrations occurred at two different residences to the north of the project site. Using the maximum annual modeled DPM concentrations, the maximum increased cancer risks were calculated using the methods previously described. Due to the short anticipated duration of project construction activities (about 20 months), infant exposures were assumed in calculating cancer risks for residential exposures. Because an infant (0 to 2 years of age) has a breathing rate that is greater than the breathing rate for the 3rd trimester the contribution to total cancer risk from an infant exposure is greater than if the initial exposure assumed for the 3rd trimester is assumed. It was conservatively assumed that an infant exposure to construction emissions would occur over the entire construction period. Results of this assessment indicate that the maximum increased residential cancer risks would be 34.8 in one million for an infant exposure and 0.6 in one million for an adult exposure. The maximum incremental school site cancer risk would be 1.8 in one million for child exposure. The locations of both the residential and school site Maximally Exposed Individual (MEI) are shown in Figure 1. Assuming infant exposure at the residential MEI, the maximum residential excess cancer risk for would be greater than the BAAQMD significance threshold of 10 in one million and would be considered a significant impact The maximum-modeled annual PM2.5 concentration, which is based on combined exhaust and fugitive dust emissions, was 0.396 μg/m3 and occurred at a location adjacent to the residential cancer risk MEI. This annual PM2.5 concentration would be greater than the BAAQMD significance threshold of 0.3 μg/m3 and would be considered a significant impact. The maximum modeled annual residential DPM concentration (i.e., from construction exhaust) was 0.1540 μg/m3. The maximum computed HI based on this DPM concentration is 0.03, which is lower than the BAAQMD significance criterion of a HI greater than 1.0.

10
The project would have a significant impact with respect to community risk caused by construction activities. Implementation of Mitigation Measures 1 and 2 would reduce this impact to a level of less than significant. Attachment 2 includes the emission calculations used for the area source modeling and the cancer risk calculations. Combined Construction Risk Assessment A review of the BAAQMD Google Earth screening analysis tools identified State Route 29 (SR-29) as the only substantial mobile source of TAC with the potential to affect the construction MEI. The construction MEI is located about 940 feet west of SR-29, Link 1046. The Highway Risk Screening Analysis Tool was used to identify screening level risk and screening cancer risk was adjusted using a factor of 1.3744 to account for new OEHHA 2015 guidance.7 This was added to the calculated maximum construction risk level and reported in Table 2. The Napa Valley Wine Train line is located about 930 feet west of the construction MEI. The impact from the train emissions would be less than the impact from SR-29. Therefore, the effect would be less than significant. Cancer risk, assuming infant exposure, annual PM2.5 concentrations and non-cancer hazards would not exceed the significance thresholds for combined TAC source exposures. Table 2. Combined Cancer Risks, PM2.5 Concentrations, and Hazard Index at Construction MEI
Source
Cancer Risk (per million)
Annual PM2.5
(µg/m3)
Acute or Chronic Hazard Index
Unmitigated Project Construction 34.8 0.3962 0.03 SR-29, Link 1046 (6-ft elevation)1 2.3 <0.02 <0.01 Total 37.1 <0.42 <0.04 BAAQMD Cumulative Source Threshold 100.0 0.8 10.0 Significant? No No No Note: 1Based on BAAQMD Highway Screening Analysis Tool and adjusted for 2015 OEHHA methodology
2While the maximum annual PM2.5 concentration occurred at a residence adjacent to the cancer risk MEI, it is reported here as occurring at the same location.
Mitigation Measure 2: Selection of equipment during construction to minimize emissions. Such equipment selection would include the following:
The project shall develop a plan demonstrating that the off-road equipment used on-site to construct the project would achieve a fleet-wide average 72 percent reduction in PM2.5 exhaust emissions or more. One feasible plan to achieve this reduction would include the following:
7 Correspondence with Alison Kirk, BAAQMD, November 23, 2015.

11
All mobile diesel-powered off-road equipment larger than 25 horsepower and operating on the site for more than two days shall meet, at a minimum, U.S. EPA particulate matter emissions standards for Tier 4 engines or equivalent. Note that the construction contractor could use other measures to minimize construction period DPM emissions to reduce the calculated cancer risk and annual PM2.5 concentrations below the thresholds. The use of equipment that includes CARB-certified Level 3 Diesel Particulate Filters8 or alternatively-fueled equipment (i.e., non-diesel) would meet this requirement. Other measures may be the use of added exhaust devices, or a combination of measures, provided that these measures are approved by the City and demonstrated to reduce community risk impacts to less than significant.
Effectiveness of Mitigation Measures 1 and 2 Implementation of Mitigation Measure 1 is considered to reduce exhaust emissions by 5 percent. Implementation of Mitigation Measures 2 would further reduce on-site diesel exhaust emissions. This would reduce the DPM concentrations and cancer risk proportionally, such that the mitigated risk would be less than 1.0 in one million, which is less than the BAAQMD significance threshold of 10 in one million. The annual PM2.5 concentration would be less than 0.05 µg/m3, which is less than the BAAQMD significance threshold of 0.3 µg/m3. Therefore, after implementation of these mitigation measures, the project would have a less-than-significant impact with respect to community risk caused by construction activities.
8 See http://www.arb.ca.gov/diesel/verdev/vt/cvt.htm

12
Figure 1 Project Construction Site, Locations of Off-Site Sensitive Receptors and Maximum TAC Impact

13
Impact 5: Create objectionable odors affecting a substantial number of people? Less
than significant. The project would generate localized emissions of diesel exhaust during construction equipment operation and truck activity. These emissions may be noticeable from time to time by adjacent receptors. However, they would be localized and are not likely to adversely affect people off site by resulting in confirmed odor complaints. The project would not include any sources of significant odors that would cause complaints from surrounding uses. This would be a less-than-significant impact
Impact 6: Generate greenhouse gas emissions, either directly or indirectly, that may have a significant impact on the environment? Less than significant.
GHG emissions associated with development of the proposed project would occur over the short-term from construction activities, consisting primarily of emissions from equipment exhaust and worker and vendor trips. There would also be long-term operational emissions associated with vehicular traffic within the project vicinity, energy and water usage, and solid waste disposal. Emissions for the proposed project are discussed below and were analyzed using the methodology recommended in the BAAQMD CEQA Air Quality Guidelines. Methodology GHG emissions for the construction period and the full-build out scenario of the proposed project were computed using CalEEMod. Construction emissions were based on the size and type of the project and phasing, duration and equipment usage information provided by the applicant. The model calculates emissions of GHG in the form of equivalent carbon dioxide emissions or CO2e. CalEEMod also computes emissions from traffic generated by the project as well as emissions associated with energy usage, water usage and solid waste generation. CalEEMod is the model recommended by BAAQMD for predicting emissions from land use development projects, such as this one. The GHG operational modeling was updated in 2019 to use the most recent traffic projections and the latest version of the CalEEMod model, version 2016.3.2. Land Use Types The following land use types were input to the model:
• Hotel = 65 rooms
• High Turnover (Sit Down Restaurant) for the Farmer’s Market expansion = 908 square feet
• Parking Lot = 80 spaces

14
Construction Emissions
The CalEEMod model was used to predict construction GHG emissions, as previous described. Construction of the project would emit 366 MT of CO2e. Neither the City nor BAAQMD have quantified thresholds for construction activities. However, the annual emissions would be below the lowest project emission threshold considered significant by BAAQMD. BAAQMD also encourages the incorporation of best management practices to reduce GHG emissions during construction where feasible and applicable. Best management practices assumed to be incorporated into construction of the proposed project include but are not limited to: using local building materials of at least 10 percent and recycling or reusing at least 50 percent of construction waste or demolition materials.
Operational Emissions
The CalEEMod model along with the project vehicle trip generation rates were used to calculate operational period GHG emissions associated with operation of a fully developed site under the proposed project. The model uses mobile emission factors from the California Air Resources Board’s EMFAC2011 model and adjusts these based on the effect of new regulations to reduce GHG emissions. These regulations include the Pavley Rule that increases fleet efficiency (reducing fuel consumption) and the low carbon fuel standard. This model is sensitive to the year selected, since vehicle emissions have and continue to be reduced due to fuel efficiency standards and low carbon fuels. Adjustments to the modeling are described below. Year of Analysis Emissions associated with vehicle travel depend on the year of analysis. The earlier the year, the higher the emission rates as CalEEMod uses the California Air Resources Board’s EMFAC2014 motor vehicle emissions model. This model assumes reduced emission rates as newer vehicles with lower emission rates replace older, more polluting vehicles through attrition of the overall vehicle fleet. The earliest full year the project could be possibly constructed and operational would be 2020. CalEEMod Traffic Inputs Traffic trip generation rates provided by the project traffic consultant (Crane Transportation Group) were used and input to CalEEMod. The traffic study reports daily trip generation assuming 100 percent occupancy of the proposed lodging facility. The Friday trips rates were assumed to represent all weekdays. The traffic report also provided the Saturday trip rate, which is the same as the CalEEMod default rate. The CalEEMod default rate for Sunday was used. Trip rates for the High Turnover Restaurant (Farmer’s Market expansion) were assumed to be zero, as no increase in visitor trips to the Farmer’s Market were reported in the traffic report. Energy Consumption CalEEMod has a default rate of 641.3 pounds of CO2 per megawatt of electricity produced, which is based on PG&E’s 2008 emissions rate. The PG&E rate was updated to be the most recent rate
15
reported in the California Climate Registry that was for 2020, which is 290 pounds of CO2 per megawatt of electricity produced.9
Solid Waste Generation
Emissions from solid waste generation are based on CalEEMod model defaults that are based on the project type and size. These are emissions associated with transporting and landfilling of solid waste generated by the project.
Water Usage
Emissions from water usage are based on CalEEMod model defaults that are based on the project type and size. These are emissions associated with electricity usage associated with conveyance and treatment of water and wastewater associated with the project.
Occupancy
GHG emissions are based on annual operations. The hotel is anticipated to have an occupancy rate of 100 percent. Therefore, emissions were modeled for full occupancy.
200-Person Events
Periodically, the Farmstead at Long Meadow Ranch would host events with up to 200 people. These events were assumed to occur, on average, twice per week. This could be more often in summer and less often during winter. Shuttle buses are required by the applicant for events this large. Also, it is projected that a few guests will drive to the event (up to 5 vehicles). GHG emissions were computed using the EMFAC2017 model, assuming 28 shuttle buses trips that were modeled as medium-duty vehicles) and 10 automobiles that were modeled as light-duty automobiles.
Operational Emissions
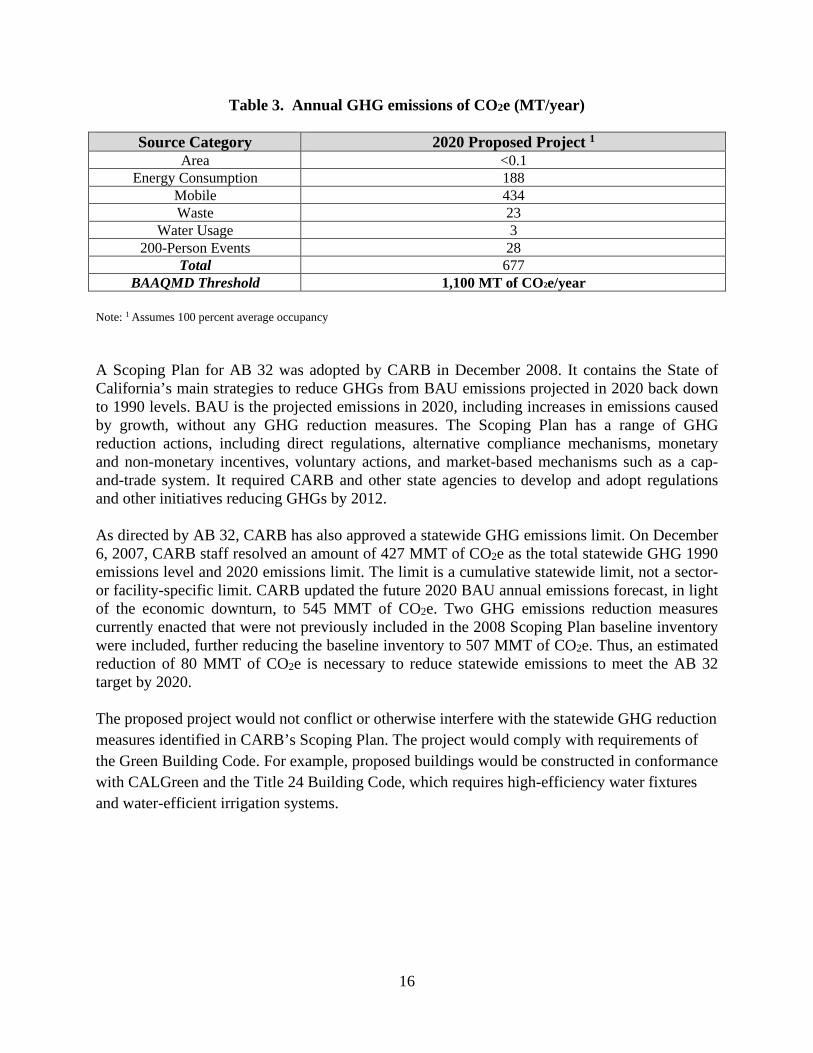
The CalEEMod model, along with the project vehicle trip generation rates, was used to predict daily emissions associated with operation of the fully-developed site under the proposed project. In 2020, as shown in Table 3, annual increased emissions resulting from operation of the proposed project are predicted to be 649 MT of CO2e, which would be less than the BAAQMD significance threshold of 1,100 MT of CO2e/ year.
Impact 7: Conflict with an applicable plan, policy, or regulation adopted for the purpose of reducing the emissions of greenhouse gases? Less than significant.
AB 32, the Global Warming Solutions Act of 2006, codifies the State of California’s GHG emissions target by directing CARB to reduce the state’s global warming emissions to 1990 levels by 2020. AB 32 was signed and passed into law by Governor Schwarzenegger on September 27, 2006. Since that time, CARB, CEC, the California Public Utilities Commission (CPUC), and the Building Standards Commission have all been developing regulations that will help meet the goals of AB 32 and Executive Order S-3-05.
9 See Climate Registry most current version of default emissions factors: http://www.theclimateregistry.org/tools-resources/reporting-protocols/general-reporting-protocol. Accessed: May 17, 2016.
16
Table 3. Annual GHG emissions of CO2e (MT/year)
Note: 1 Assumes 100 percent average occupancy A Scoping Plan for AB 32 was adopted by CARB in December 2008. It contains the State of California’s main strategies to reduce GHGs from BAU emissions projected in 2020 back down to 1990 levels. BAU is the projected emissions in 2020, including increases in emissions caused by growth, without any GHG reduction measures. The Scoping Plan has a range of GHG reduction actions, including direct regulations, alternative compliance mechanisms, monetary and non-monetary incentives, voluntary actions, and market-based mechanisms such as a cap-and-trade system. It required CARB and other state agencies to develop and adopt regulations and other initiatives reducing GHGs by 2012. As directed by AB 32, CARB has also approved a statewide GHG emissions limit. On December 6, 2007, CARB staff resolved an amount of 427 MMT of CO2e as the total statewide GHG 1990 emissions level and 2020 emissions limit. The limit is a cumulative statewide limit, not a sector- or facility-specific limit. CARB updated the future 2020 BAU annual emissions forecast, in light of the economic downturn, to 545 MMT of CO2e. Two GHG emissions reduction measures currently enacted that were not previously included in the 2008 Scoping Plan baseline inventory were included, further reducing the baseline inventory to 507 MMT of CO2e. Thus, an estimated reduction of 80 MMT of CO2e is necessary to reduce statewide emissions to meet the AB 32 target by 2020. The proposed project would not conflict or otherwise interfere with the statewide GHG reduction measures identified in CARB’s Scoping Plan. The project would comply with requirements of the Green Building Code. For example, proposed buildings would be constructed in conformance with CALGreen and the Title 24 Building Code, which requires high-efficiency water fixtures and water-efficient irrigation systems.
Source Category 2020 Proposed Project 1 Area <0.1
Energy Consumption 188 Mobile 434 Waste 23
Water Usage 3 200-Person Events 28
Total 677 BAAQMD Threshold 1,100 MT of CO2e/year

Attachment 1: Health Risk Calculation Methodology A health risk assessment (HRA) for exposure to Toxic Air Contaminates (TACs) requires the application of a risk characterization model to the results from the air dispersion model to estimate potential health risk at each sensitive receptor location. The State of California Office of Environmental Health Hazard Assessment (OEHHA) and California Air Resources Board (CARB) develop recommended methods for conducting health risk assessments. The most recent OEHHA risk assessment guidelines were published in February of 2015.10 These guidelines incorporate substantial changes designed to provide for enhanced protection of children, as required by State law, compared to previous published risk assessment guidelines. CARB has provided additional guidance on implementing OEHHA’s recommended methods.11 This HRA used the recent 2015 OEHHA risk assessment guidelines and CARB guidance. While the OEHHA guidelines use substantially more conservative assumptions than the current Bay Area Air Quality Management District (BAAQMD) guidelines, BAAQMD has not formally adopted recommended procedures for applying the newest OEHHA guidelines. BAAQMD is in the process of developing new guidance and has developed proposed HRA Guidelines as part of the proposed amendments to Regulation 2, Rule 5: New Source Review of Toxic Air Contaminants.12 Exposure parameters from the OEHHA guidelines and newly proposed BAAQMD HRA Guidelines were used in this evaluation. Cancer Risk Potential increased cancer risk from inhalation of TACs are calculated based on the TAC concentration over the period of exposure, inhalation dose, the TAC cancer potency factor, and an age sensitivity factor to reflect the greater sensitivity of infants and children to cancer causing TACs. The inhalation dose depends on a person’s breathing rate, exposure time and frequency of exposure, and the exposure duration. These parameters vary depending on the age, or age range, of the persons being exposed and whether the exposure is considered to occur at a residential location or other sensitive receptor location. The current OEHHA guidance recommends that cancer risk be calculated by age groups to account for different breathing rates and sensitivity to TACs. Specifically, they recommend evaluating risks for the third trimester of pregnancy to age zero, ages zero to less than two (infant exposure), ages two to less than 16 (child exposure), and ages 16 to 70 (adult exposure). Age sensitivity factors (ASFs) associated with the different types of exposure are an ASF of 10 for the third trimester and infant exposures, an ASF of 3 for a child exposure, and an ASF of 1 for an adult exposure. Also associated with each exposure type are different breathing rates, expressed as liters per kilogram of body weight per day (L/kg-day). As recommended by the BAAQMD, 95th percentile breathing rates are used for the third trimester and infant exposures, and 80th
10 OEHHA, 2015. Air Toxics Hot Spots Program Risk Assessment Guidelines, The Air Toxics Hot Spots Program Guidance Manual for Preparation of Health Risk Assessments. Office of Environmental Health Hazard Assessment. February. 11 CARB, 2015. Risk Management Guidance for Stationary Sources of Air Toxics. July 23. 12 BAAQMD, 2016. Workshop Report. Proposed Amendments to Air District Regulation 2, Rule 5: New Source Review of Toxic Air Contaminants. Appendix C. Proposed Air District HRA Guidelines. January 2016.
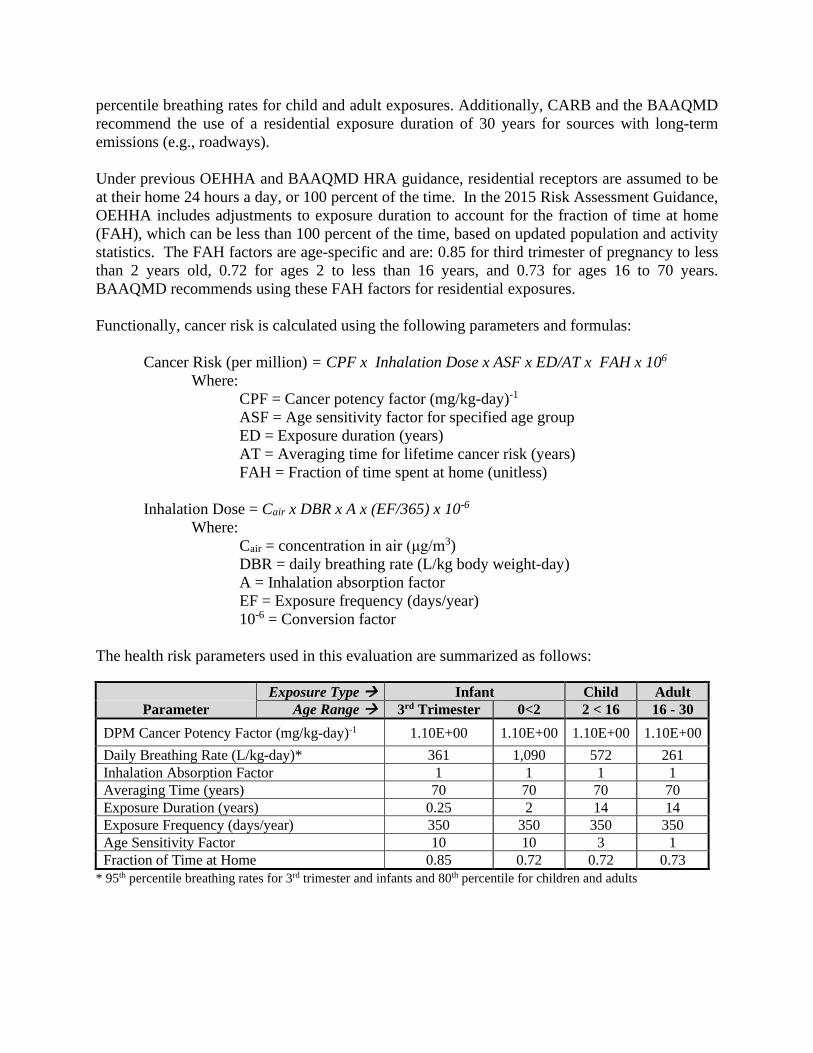
percentile breathing rates for child and adult exposures. Additionally, CARB and the BAAQMD recommend the use of a residential exposure duration of 30 years for sources with long-term emissions (e.g., roadways). Under previous OEHHA and BAAQMD HRA guidance, residential receptors are assumed to be at their home 24 hours a day, or 100 percent of the time. In the 2015 Risk Assessment Guidance, OEHHA includes adjustments to exposure duration to account for the fraction of time at home (FAH), which can be less than 100 percent of the time, based on updated population and activity statistics. The FAH factors are age-specific and are: 0.85 for third trimester of pregnancy to less than 2 years old, 0.72 for ages 2 to less than 16 years, and 0.73 for ages 16 to 70 years. BAAQMD recommends using these FAH factors for residential exposures. Functionally, cancer risk is calculated using the following parameters and formulas:
Cancer Risk (per million) = CPF x Inhalation Dose x ASF x ED/AT x FAH x 106 Where:
CPF = Cancer potency factor (mg/kg-day)-1 ASF = Age sensitivity factor for specified age group ED = Exposure duration (years) AT = Averaging time for lifetime cancer risk (years) FAH = Fraction of time spent at home (unitless)
Inhalation Dose = Cair x DBR x A x (EF/365) x 10-6 Where:
Cair = concentration in air (μg/m3) DBR = daily breathing rate (L/kg body weight-day) A = Inhalation absorption factor EF = Exposure frequency (days/year) 10-6 = Conversion factor
The health risk parameters used in this evaluation are summarized as follows:
Exposure Type Infant Child Adult Parameter Age Range 3rd Trimester 0<2 2 < 16 16 - 30
DPM Cancer Potency Factor (mg/kg-day)-1 1.10E+00 1.10E+00 1.10E+00 1.10E+00 Daily Breathing Rate (L/kg-day)* 361 1,090 572 261 Inhalation Absorption Factor 1 1 1 1 Averaging Time (years) 70 70 70 70 Exposure Duration (years) 0.25 2 14 14 Exposure Frequency (days/year) 350 350 350 350 Age Sensitivity Factor 10 10 3 1 Fraction of Time at Home 0.85 0.72 0.72 0.73
* 95th percentile breathing rates for 3rd trimester and infants and 80th percentile for children and adults

Non-Cancer Hazards Potential non-cancer health hazards from TAC exposure are expressed in terms of a hazard index (HI), which is the ratio of the TAC concentration to a reference exposure level (REL). OEHHA has defined acceptable concentration levels for contaminants that pose non-cancer health hazards. TAC concentrations below the REL are not expected to cause adverse health impacts, even for sensitive individuals. The total HI is calculated as the sum of the HIs for each TAC evaluated and the total HI is compared to the BAAQMD significance thresholds to determine whether a significant non-cancer health impact from a project would occur. Typically, for residential projects located near roadways with substantial TAC emissions, the primary TAC of concern with non-cancer health effects is diesel particulate matter (DPM). For DPM, the chronic inhalation REL is 5 micrograms per cubic meter (μg/m3). Annual PM2.5 Concentrations While not a TAC, fine particulate matter (PM2.5) has been identified by the BAAQMD as a pollutant with potential non-cancer health effects that should be included when evaluating potential community health impacts under the California Environmental Quality Act (CEQA). The thresholds of significance for PM2.5 (project level and cumulative) are in terms of an increase in the annual average concentration. When considering PM2.5 impacts, the contribution from all sources of PM2.5 emissions should be included. For projects with potential impacts from nearby local roadways, the PM2.5 impacts should include those from vehicle exhaust emissions, PM2.5 generated from vehicle tire and brake wear, and fugitive emissions from re-suspended dust on the roads.

Attachment 2: Construction Schedule, CalEEMod Output and Health Risk Calculations

Project Name: Farmstead at Long Meadow RanchSee Equipment Type TAB for type, horsepower and load factor
Project Size 65 Hotel Rooms 10.5 total project acres disturbed
s.f. other (specify)
s.f. parking garage spaces
s.f. parking lot spaces
Construction Hours 7 am to 4 pm
Qty Description HP Load Factor Hours/day
Total Work Days
Avg. Hours per
day Comments
Site Preperation Start Date: 1/28/2017 Total phase: 10End Date: 2/15/2017
Graders 174 0.41 8 10 83 Rubber Tired Dozers 255 0.4 8 10 84 Tractors/Loaders/Backhoes 97 0.37 8 10 8
Grading / Excavation Start Date: 2/21/2017 Total phase: 30End Date: 3/20/2017 Soil Hauling Volume
2 Excavators 162 0.38 8 30 8 Export volume = 0 cubic yards?1 Graders 174 0.41 8 30 8 Import volume = 8,000 cubic yards?1 Rubber Tired Dozers 255 0.4 8 30 82 Scrapers 361 0.48 8 302 Tractors/Loaders/Backhoes 97 0.37 8 30 8
Other Equipment?
Trenching Start Date: Total phase: 10End Date:
1 Tractor/Loader/Backhoe 97 0.37 8 20 16Excavators 162 0.38 8 20 16Other Equipment?
Building - Exterior Start Date: Total phase: 300 Cement Trucks? _?_ Total Round-TripsEnd Date:
1 Cranes 226 0.29 6 10 0.2 Electric? (Y/N) _N_ Otherwise assumed diesel3 Forklifts 89 0.2 8 200 5.33333333 Liquid Propane (LPG)? (Y/N) _N_ Otherwise Assumed diesel1 Generator Sets 84 0.74 8 0 0 Or temporary line power? (Y/N) _Y_3 Tractors/Loaders/Backhoes 97 0.37 7 100 2.333333331 Welders 46 0.45 8 50 1.33333333
Other Equipment? 0
Building - Interior/Architectural Coating Start Date: Total phase: 20End Date:
1 Air Compressors 78 0.48 6 50 151 Aerial Lift 62 0.31 6 100 30 Liquid Propane (LPG)? (Y/N) _Y_ Otherwise Assumed diesel
Other Equipment?
Paving Start Date: Total phase: 20
Complete ALL Portions in Yellow

Start Date:Cement and Mortar Mixers 9 0.56 0
2 Pavers 125 0.42 8 6 2.42 Paving Equipment 130 0.36 8 6 2.42 Rollers 80 0.38 8 6 2.4
Tractors/Loaders/Backhoes 97 0.37 8 10 4Other Equipment?
Asphalt? _2000__ cubic yards or ____ round trips?

Emissions Summary DPM Construction Emissions and Modeling Emission Rates - Unmitigated DPM
Modeled Emission Construction DPM Area DPM Emissions Area Rate
Year Activity (ton/year) Source (lb/yr) (lb/hr) (g/s) (m2) (g/s/m2) 2017 Construction 0.0996 1_DPM 199.2 0.06064 7.64E-03 40,663 1.88E-07 2018 Construction 0.0375 1_DPM 75.0 0.02283 2.88E-03 40,663 7.07E-08 Total 0.1371 274 0 0
PM2.5 Fugitive Dust Construction Emissions for Modeling - Unmitigated PM2.5
Modeled Emission
Construction Area PM2.5 Emissions Area Rate
Year Activity Source (ton/year) (lb/yr) (lb/hr) (g/s) (m2) g/s/m2
2017 Construction 1_FUG 0.1043 208.6 0.06350 8.00E-
03 40,663 1.97E-07
2018 Construction 1_FUG 0.0005 1.1 0.00032 4.07E-
05 40,663 1.00E-09
Total 0.1048 209.6600 0.0638 0.0080

Health Risk Calculations- Off-Site Residences

Maximum Modeled PM 2.5 Concentration- Off Site Residences

Results Summary- Residences
Unmitigated
Maximum
Concentrations Maximum Exhaust Fugitive Cancer Risk Hazard Annual PM2.5
Construction PM2.5/DPM PM2.5 (per million) Index Concentration Year (μg/m3) (μg/m3) Child Adult (-) (μg/m3)
2017 0.1536 0.2418 25.29 0.44 0.031 0.395 2018 0.0578 0.0012 9.51 0.17 0.012 0.059 Total - - 34.8 0.6 - -
Maximum Annual 0.1536 0.2418 - - 0.031 0.395
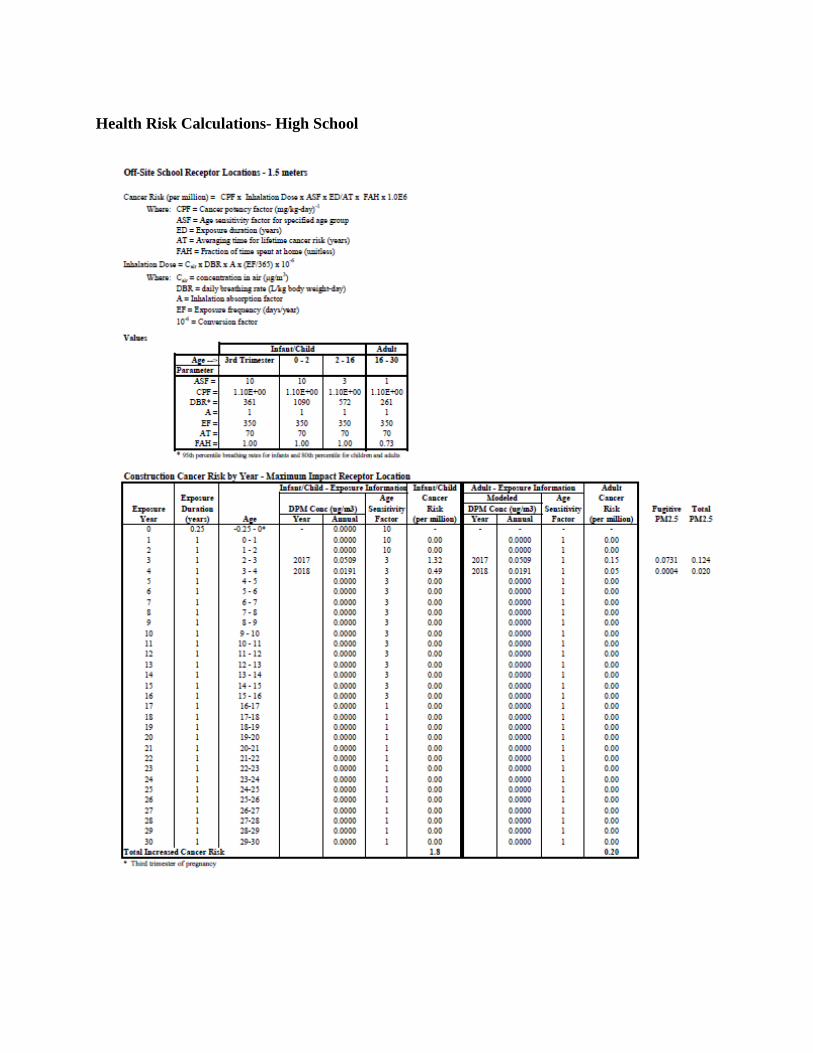
Health Risk Calculations- High School

Results Summary
Unmitigated
Maximum
Concentrations Maximum Exhaust Fugitive Cancer Risk Hazard Annual PM2.5
Construction PM2.5/DPM PM2.5 (per million) Index Concentration
Year (μg/m3) (μg/m3) Child (-) (μg/m3)
2017 0.0509 0.0731 1.32 0.010 0.124 2018 0.0191 0.0004 0.49 0.004 0.020 Total - - 1.8 - -
Maximum Annual 0.0509 0.0731 - 0.010 0.124

CalEEMod Output- TAC Emissions
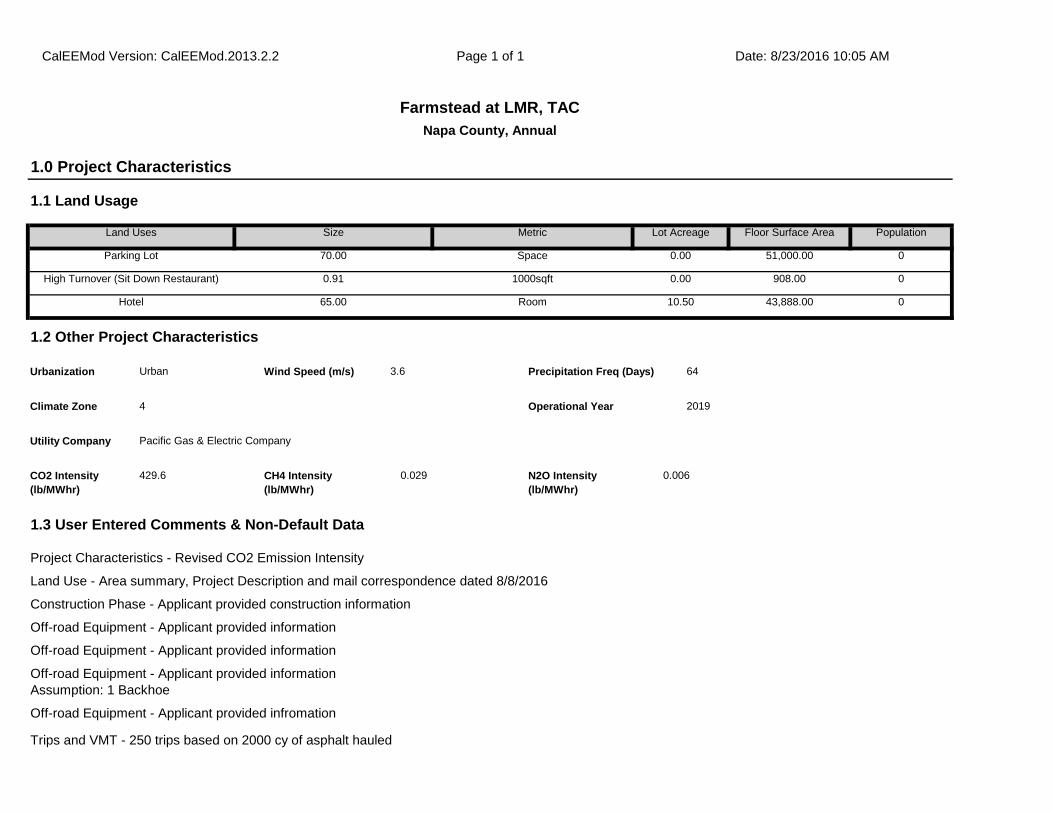
CalEEMod Version: CalEEMod.2013.2.2 Page 1 of 1 Date: 8/23/2016 10:05 AM
Farmstead at LMR, TAC
Napa County, Annual
1.0 Project Characteristics
1.1 Land Usage
Land Uses Size Metric Lot Acreage Floor Surface Area Population
Parking Lot 70.00 Space 0.00 51,000.00 0
High Turnover (Sit Down Restaurant) 0.91 1000sqft 0.00 908.00 0
Hotel 65.00 Room 10.50 43,888.00 0
1.2 Other Project Characteristics
Urbanization Urban Wind Speed (m/s) 3.6 Precipitation Freq (Days) 64
Climate Zone 4 Operational Year 2019
Utility Company Pacific Gas & Electric Company
CO2 Intensity
(lb/MWhr)
429.6 CH4 Intensity
(lb/MWhr)
0.029 N2O Intensity
(lb/MWhr)
0.006
1.3 User Entered Comments & Non-Default Data
Project Characteristics - Revised CO2 Emission Intensity
Land Use - Area summary, Project Description and mail correspondence dated 8/8/2016
Construction Phase - Applicant provided construction information
Off-road Equipment - Applicant provided information
Off-road Equipment - Applicant provided information
Off-road Equipment - Applicant provided information
Assumption: 1 Backhoe
Off-road Equipment - Applicant provided infromation
Trips and VMT - 250 trips based on 2000 cy of asphalt hauled

Grading - 8000 cy of soil imported
Architectural Coating -
Construction Off-road Equipment Mitigation - Best Management Practice
Tier 4 Mitigation for all equipment >25HP
Table Name Column Name Default Value New Value
tblConstEquipMitigation NumberOfEquipmentMitigated 0.00 1.00
tblConstEquipMitigation NumberOfEquipmentMitigated 0.00 1.00
tblConstEquipMitigation NumberOfEquipmentMitigated 0.00 2.00
tblConstEquipMitigation NumberOfEquipmentMitigated 0.00 3.00
tblConstEquipMitigation NumberOfEquipmentMitigated 0.00 1.00
tblConstEquipMitigation NumberOfEquipmentMitigated 0.00 2.00
tblConstEquipMitigation NumberOfEquipmentMitigated 0.00 2.00
tblConstEquipMitigation NumberOfEquipmentMitigated 0.00 2.00
tblConstEquipMitigation NumberOfEquipmentMitigated 0.00 4.00
tblConstEquipMitigation NumberOfEquipmentMitigated 0.00 2.00
tblConstEquipMitigation NumberOfEquipmentMitigated 0.00 11.00
tblConstEquipMitigation NumberOfEquipmentMitigated 0.00 1.00
tblConstEquipMitigation Tier No Change Tier 4 Final
tblConstEquipMitigation Tier No Change Tier 4 Final
tblConstEquipMitigation Tier No Change Tier 4 Final
tblConstEquipMitigation Tier No Change Tier 4 Final
tblConstEquipMitigation Tier No Change Tier 4 Final
tblConstEquipMitigation Tier No Change Tier 4 Final
tblConstEquipMitigation Tier No Change Tier 4 Final
tblConstEquipMitigation Tier No Change Tier 4 Final
tblConstEquipMitigation Tier No Change Tier 4 Final
tblConstEquipMitigation Tier No Change Tier 4 Final
tblConstEquipMitigation Tier No Change Tier 4 Final
tblConstEquipMitigation Tier No Change Tier 4 Final
tblConstructionPhase NumDays 20.00 100.00

tblConstructionPhase PhaseEndDate 1/4/2019 12/7/2018
tblConstructionPhase PhaseEndDate 7/28/2017 8/17/2018
tblConstructionPhase PhaseEndDate 8/17/2018 6/30/2017
tblConstructionPhase PhaseStartDate 8/18/2018 7/21/2018
tblConstructionPhase PhaseStartDate 4/15/2017 4/17/2017
tblConstructionPhase PhaseStartDate 7/1/2017 7/21/2018
tblConstructionPhase PhaseStartDate 7/21/2018 6/5/2017
tblGrading MaterialImported 0.00 8,000.00
tblLandUse LandUseSquareFeet 28,000.00 51,000.00
tblLandUse LandUseSquareFeet 910.00 908.00
tblLandUse LandUseSquareFeet 94,380.00 43,888.00
tblLandUse LotAcreage 0.63 0.00
tblLandUse LotAcreage 0.02 0.00
tblLandUse LotAcreage 2.17 10.50
tblOffRoadEquipment OffRoadEquipmentUnitAmount 1.00 0.00
tblOffRoadEquipment UsageHours 6.00 3.00
tblOffRoadEquipment UsageHours 7.00 0.20
tblOffRoadEquipment UsageHours 8.00 5.40
tblOffRoadEquipment UsageHours 8.00 0.00
tblOffRoadEquipment UsageHours 8.00 2.40
tblOffRoadEquipment UsageHours 8.00 2.40
tblOffRoadEquipment UsageHours 8.00 2.40
tblOffRoadEquipment UsageHours 7.00 2.40
tblOffRoadEquipment UsageHours 8.00 1.40
tblProjectCharacteristics CO2IntensityFactor 641.35 429.6
tblProjectCharacteristics OperationalYear 2014 2019
tblTripsAndVMT HaulingTripLength 20.00 0.50
tblTripsAndVMT HaulingTripLength 20.00 0.50
tblTripsAndVMT HaulingTripLength 20.00 0.50
tblTripsAndVMT HaulingTripLength 20.00 0.50

tblTripsAndVMT HaulingTripLength 20.00 0.50
tblTripsAndVMT HaulingTripLength 20.00 0.50
tblTripsAndVMT HaulingTripNumber 0.00 250.00
tblTripsAndVMT VendorTripLength 7.30 0.50
tblTripsAndVMT VendorTripLength 7.30 0.50
tblTripsAndVMT VendorTripLength 7.30 0.50
tblTripsAndVMT VendorTripLength 7.30 0.50
tblTripsAndVMT VendorTripLength 7.30 0.50
tblTripsAndVMT VendorTripLength 7.30 0.50
tblTripsAndVMT WorkerTripLength 12.40 0.50
tblTripsAndVMT WorkerTripLength 12.40 0.50
tblTripsAndVMT WorkerTripLength 12.40 0.50
tblTripsAndVMT WorkerTripLength 12.40 0.50
tblTripsAndVMT WorkerTripLength 12.40 0.50
Exhaust
PM10
PM10
Total
tblTripsAndVMT WorkerTripLength 12.40 0.50
2.0 Emissions Summary
2.1 Overall Construction
NBio- CO2 Total CO2
Unmitigated Construction
ROG NOx CO SO2 Fugitive
PM10
CH4 N2O CO2e
Year tons/yr MT/yr
Fugitive
PM2.5
Exhaust
PM2.5
PM2.5
Total
Bio- CO2
2017 0.2109 1.9191 1.6171 1.7400e-
003
0.2234 0.1081 0.3315 0.1043 0.0996 0.2039 0.0000 159.8480 159.8480 0.0469 0.0000 160.8327
2018 0.3244 0.5843 0.6518 6.9000e-
004
1.8900e-
003
0.0403 0.0422 5.2000e-
004
0.0375 0.0380 0.0000 61.5743 61.5743 0.0161 0.0000 61.9116
Total 0.5353 2.5034 2.2689 2.4300e-
003
0.0630 0.0000 222.74430.2253 0.1484 0.3737 0.1048 0.1371 0.2419 0.0000 221.4223 221.4223

SO2 Fugitive
PM10
Exhaust
PM10
PM2.5
Total
Bio- CO2 NBio- CO2
Mitigated Construction
ROG NOx CO Total CO2 CH4 N2O CO2e
Year tons/yr MT/yr
PM10
Total
Fugitive
PM2.5
Exhaust
PM2.5
2017 0.0493 0.1482 1.3220 1.7400e-
003
0.1017 2.9700e-
003
0.1047 0.0239 2.9500e-
003
0.0269 0.0000 159.8478 159.8478 0.0469 0.0000 160.8325
2018 0.2683 0.0769 0.6472 6.9000e-
004
1.8900e-
003
1.1900e-
003
3.0900e-
003
5.2000e-
004
1.1800e-
003
1.7000e-
003
0.0000 61.5742 61.5742 0.0161 0.0000 61.9115
Total 0.3176 0.2251 1.9691 2.4300e-
003
0.1036 4.1600e-
003
0.1078 0.0244 4.1300e-
003
0.0286 0.0000 221.4220 221.4220 0.0630 0.0000 222.7440
ROG NOx CO SO2 Fugitive
PM10
Exhaust
PM10
PM10
Total
Fugitive
PM2.5
Exhaust
PM2.5
PM2.5
Total
Bio- CO2 NBio-CO2 Total CO2 CH4 N20 CO2e
Percent
Reduction
40.68 91.01 13.21 0.00 0.00 0.00 0.0054.02 97.20 71.17 76.69 96.99 88.19 0.00 0.00 0.00
3.0 Construction Detail
Construction Phase
Phase
Number
Phase Name Phase Type Start Date End Date Num Days
Week
Num Days Phase Description
1 Site Preparation Site Preparation 4/3/2017 4/14/2017 5 10
2 Grading Grading 4/17/2017 5/26/2017 5 30
3 Building Construction Building Construction 5/27/2017 7/20/2018 5 300
4 Trenching Trenching 6/5/2017 6/30/2017 5 20
5 Paving Paving 7/21/2018 8/17/2018 5 20
6 Architectural Coating Architectural Coating 7/21/2018 12/7/2018 5 100
Acres of Grading (Site Preparation Phase): 0
Acres of Grading (Grading Phase): 75
Acres of Paving: 0
Residential Indoor: 0; Residential Outdoor: 0; Non-Residential Indoor: 69,489; Non-Residential Outdoor: 23,163 (Architectural Coating –
sqft)

OffRoad Equipment
Phase Name Offroad Equipment Type Amount Usage Hours Horse Power Load Factor
Site Preparation Rubber Tired Dozers 3 8.00 255 0.40
Site Preparation Tractors/Loaders/Backhoes 4 8.00 97 0.37
Grading Excavators 2 8.00 162 0.38
Grading Graders 1 8.00 174 0.41
Grading Rubber Tired Dozers 1 8.00 255 0.40
Grading Scrapers 2 8.00 361 0.48
Grading Tractors/Loaders/Backhoes 2 8.00 97 0.37
Building Construction Cranes 1 0.20 226 0.29
Building Construction Forklifts 3 5.40 89 0.20
Building Construction Generator Sets 0 0.00 84 0.74
Building Construction Tractors/Loaders/Backhoes 3 2.40 97 0.37
Building Construction Welders 1 1.40 46 0.45
Trenching Tractors/Loaders/Backhoes 1 8.00 97 0.37
Paving Pavers 2 2.40 125 0.42
Paving Paving Equipment 2 2.40 130 0.36
Paving Rollers 2 2.40 80 0.38
Paving Tractors/Loaders/Backhoes 1 4.00 97 0.37
Architectural Coating Aerial Lifts 0 6.00 62 0.31
Architectural Coating Air Compressors 1 3.00 78 0.48
Trips and VMT
Phase Name Offroad Equipment
Count
Worker Trip
Number
Vendor Trip
Number
Hauling Trip
Number
Worker Trip
Length
Vendor Trip
Length
Hauling Trip
Length
Worker Vehicle
Class
Vendor
Vehicle Class
Hauling
Vehicle Class
Site Preparation 7 18.00 0.00 1,000.00 0.50 0.50 0.50 LD_Mix HDT_Mix HHDT
Grading 8 20.00 0.00 0.00 0.50 0.50 0.50 LD_Mix HDT_Mix HHDT
Building Construction 8 40.00 16.00 0.00 0.50 0.50 0.50 LD_Mix HDT_Mix HHDT
Trenching 1 3.00 0.00 0.00 0.50 0.50 0.50 LD_Mix HDT_Mix HHDT
Paving 7 18.00 0.00 250.00 0.50 0.50 0.50 LD_Mix HDT_Mix HHDT

Architectural Coating 1 8.00 0.00 0.00 0.50 0.50 0.50 LD_Mix HDT_Mix HHDT
SO2 Fugitive
PM10
Exhaust
PM10
3.1 Mitigation Measures Construction
Use Cleaner Engines for Construction Equipment
Replace Ground Cover
Water Exposed Area
Reduce Vehicle Speed on Unpaved Roads
Clean Paved Roads
PM2.5
Total
Bio- CO2 NBio- CO2
3.2 Site Preparation - 2017
Unmitigated Construction On-Site
ROG NOx CO Total CO2 CH4 N2O CO2e
Category tons/yr MT/yr
PM10
Total
Fugitive
PM2.5
Exhaust
PM2.5
Fugitive Dust 0.0912 0.0000 0.0912 0.0498 0.0000 0.0498 0.0000 0.0000 0.0000 0.0000 0.0000 0.0000
Off-Road 0.0242 0.2588 0.1970 2.0000e-
004
0.0138 0.0138 0.0127 0.0127 0.0000 18.1577 18.1577 5.5600e-
003
0.0000 18.2745
Total 0.0242 0.2588 0.1970 2.0000e-
004
5.5600e-
003
0.0000 18.27450.0912 0.0138 0.1050 0.0498 0.0127 0.0625
SO2 Fugitive
PM10
Exhaust
PM10
0.0000 18.1577 18.1577
PM2.5
Total
Bio- CO2 NBio- CO2
Unmitigated Construction Off-Site
ROG NOx CO Total CO2 CH4 N2O CO2e
Category tons/yr MT/yr
PM10
Total
Fugitive
PM2.5
Exhaust
PM2.5
Hauling 7.1200e-
003
0.0146 0.0994 2.0000e-
005
2.2000e-
004
7.0000e-
005
2.9000e-
004
6.0000e-
005
6.0000e-
005
1.2000e-
004
0.0000 1.6042 1.6042 3.0000e-
005
0.0000 1.6048
Vendor 0.0000 0.0000 0.0000 0.0000 0.0000 0.0000 0.0000 0.0000 0.0000 0.0000 0.0000 0.0000 0.0000 0.0000 0.0000 0.0000

Worker 2.3000e-
004
7.0000e-
005
9.8000e-
004
0.0000 3.0000e-
005
0.0000 3.0000e-
005
1.0000e-
005
0.0000 1.0000e-
005
0.0000 0.0453 0.0453 0.0000 0.0000 0.0454
Total 7.3500e-
003
0.0146 0.1004 2.0000e-
005
3.0000e-
005
0.0000 1.65032.5000e-
004
7.0000e-
005
3.2000e-
004
7.0000e-
005
6.0000e-
005
1.3000e-
004
SO2 Fugitive
PM10
Exhaust
PM10
0.0000 1.6495 1.6495
PM2.5
Total
Bio- CO2 NBio- CO2
Mitigated Construction On-Site
ROG NOx CO Total CO2 CH4 N2O CO2e
Category tons/yr MT/yr
PM10
Total
Fugitive
PM2.5
Exhaust
PM2.5
Fugitive Dust 0.0410 0.0000 0.0410 0.0112 0.0000 0.0112 0.0000 0.0000 0.0000 0.0000 0.0000 0.0000
Off-Road 2.3800e-
003
0.0103 0.1062 2.0000e-
004
3.2000e-
004
3.2000e-
004
3.2000e-
004
3.2000e-
004
0.0000 18.1577 18.1577 5.5600e-
003
0.0000 18.2745
Total 2.3800e-
003
0.0103 0.1062 2.0000e-
004
5.5600e-
003
0.0000 18.27450.0410 3.2000e-
004
0.0414 0.0112 3.2000e-
004
0.0115
SO2 Fugitive
PM10
Exhaust
PM10
0.0000 18.1577 18.1577
PM2.5
Total
Bio- CO2 NBio- CO2
Mitigated Construction Off-Site
ROG NOx CO Total CO2 CH4 N2O CO2e
Category tons/yr MT/yr
PM10
Total
Fugitive
PM2.5
Exhaust
PM2.5
Hauling 7.1200e-
003
0.0146 0.0994 2.0000e-
005
2.2000e-
004
7.0000e-
005
2.9000e-
004
6.0000e-
005
6.0000e-
005
1.2000e-
004
0.0000 1.6042 1.6042 3.0000e-
005
0.0000 1.6048
Vendor 0.0000 0.0000 0.0000 0.0000 0.0000 0.0000 0.0000 0.0000 0.0000 0.0000 0.0000 0.0000 0.0000 0.0000 0.0000 0.0000
Worker 2.3000e-
004
7.0000e-
005
9.8000e-
004
0.0000 3.0000e-
005
0.0000 3.0000e-
005
1.0000e-
005
0.0000 1.0000e-
005
0.0000 0.0453 0.0453 0.0000 0.0000 0.0454
Total 7.3500e-
003
0.0146 0.1004 2.0000e-
005
3.0000e-
005
0.0000 1.65032.5000e-
004
7.0000e-
005
3.2000e-
004
7.0000e-
005
6.0000e-
005
1.3000e-
004
0.0000 1.6495 1.6495
3.3 Grading - 2017
Unmitigated Construction On-Site

SO2 Fugitive
PM10
Exhaust
PM10
PM2.5
Total
Bio- CO2 NBio- CO2ROG NOx CO Total CO2 CH4 N2O CO2e
Category tons/yr MT/yr
PM10
Total
Fugitive
PM2.5
Exhaust
PM2.5
Fugitive Dust 0.1301 0.0000 0.1301 0.0540 0.0000 0.0540 0.0000 0.0000 0.0000 0.0000 0.0000 0.0000
Off-Road 0.0915 1.0439 0.7021 9.3000e-
004
0.0498 0.0498 0.0458 0.0458 0.0000 85.9109 85.9109 0.0263 0.0000 86.4637
Total 0.0915 1.0439 0.7021 9.3000e-
004
0.0263 0.0000 86.46370.1301 0.0498 0.1799 0.0540 0.0458 0.0997
SO2 Fugitive
PM10
Exhaust
PM10
0.0000 85.9109 85.9109
PM2.5
Total
Bio- CO2 NBio- CO2
Unmitigated Construction Off-Site
ROG NOx CO Total CO2 CH4 N2O CO2e
Category tons/yr MT/yr
PM10
Total
Fugitive
PM2.5
Exhaust
PM2.5
Hauling 0.0000 0.0000 0.0000 0.0000 0.0000 0.0000 0.0000 0.0000 0.0000 0.0000 0.0000 0.0000 0.0000 0.0000 0.0000 0.0000
Vendor 0.0000 0.0000 0.0000 0.0000 0.0000 0.0000 0.0000 0.0000 0.0000 0.0000 0.0000 0.0000 0.0000 0.0000 0.0000 0.0000
Worker 7.7000e-
004
2.3000e-
004
3.2500e-
003
0.0000 1.1000e-
004
0.0000 1.2000e-
004
3.0000e-
005
0.0000 3.0000e-
005
0.0000 0.1511 0.1511 2.0000e-
005
0.0000 0.1515
Total 7.7000e-
004
2.3000e-
004
3.2500e-
003
0.0000 2.0000e-
005
0.0000 0.15151.1000e-
004
0.0000 1.2000e-
004
3.0000e-
005
0.0000 3.0000e-
005
SO2 Fugitive
PM10
Exhaust
PM10
0.0000 0.1511 0.1511
PM2.5
Total
Bio- CO2 NBio- CO2
Mitigated Construction On-Site
ROG NOx CO Total CO2 CH4 N2O CO2e
Category tons/yr MT/yr
PM10
Total
Fugitive
PM2.5
Exhaust
PM2.5

Fugitive Dust 0.0586 0.0000 0.0586 0.0121 0.0000 0.0121 0.0000 0.0000 0.0000 0.0000 0.0000 0.0000
Off-Road 0.0114 0.0492 0.5217 9.3000e-
004
1.5100e-
003
1.5100e-
003
1.5100e-
003
1.5100e-
003
0.0000 85.9108 85.9108 0.0263 0.0000 86.4636
Total 0.0114 0.0492 0.5217 9.3000e-
004
0.0263 0.0000 86.46360.0586 1.5100e-
003
0.0601 0.0121 1.5100e-
003
0.0137
SO2 Fugitive
PM10
Exhaust
PM10
0.0000 85.9108 85.9108
PM2.5
Total
Bio- CO2 NBio- CO2
Mitigated Construction Off-Site
ROG NOx CO Total CO2 CH4 N2O CO2e
Category tons/yr MT/yr
PM10
Total
Fugitive
PM2.5
Exhaust
PM2.5
Hauling 0.0000 0.0000 0.0000 0.0000 0.0000 0.0000 0.0000 0.0000 0.0000 0.0000 0.0000 0.0000 0.0000 0.0000 0.0000 0.0000
Vendor 0.0000 0.0000 0.0000 0.0000 0.0000 0.0000 0.0000 0.0000 0.0000 0.0000 0.0000 0.0000 0.0000 0.0000 0.0000 0.0000
Worker 7.7000e-
004
2.3000e-
004
3.2500e-
003
0.0000 1.1000e-
004
0.0000 1.2000e-
004
3.0000e-
005
0.0000 3.0000e-
005
0.0000 0.1511 0.1511 2.0000e-
005
0.0000 0.1515
Total 7.7000e-
004
2.3000e-
004
3.2500e-
003
0.0000 2.0000e-
005
0.0000 0.15151.1000e-
004
0.0000 1.2000e-
004
3.0000e-
005
0.0000 3.0000e-
005
SO2 Fugitive
PM10
Exhaust
PM10
0.0000 0.1511 0.1511
PM2.5
Total
Bio- CO2 NBio- CO2
3.4 Building Construction - 2017
Unmitigated Construction On-Site
ROG NOx CO Total CO2 CH4 N2O CO2e
Category tons/yr MT/yr
PM10
Total
Fugitive
PM2.5
Exhaust
PM2.5
Off-Road 0.0633 0.5375 0.3943 5.0000e-
004
0.0420 0.0420 0.0388 0.0388 0.0000 45.9521 45.9521 0.0139 0.0000 46.2430
Total 0.0633 0.5375 0.3943 5.0000e-
004
0.0139 0.0000 46.24300.0420 0.0420 0.0388 0.0388 0.0000 45.9521 45.9521

SO2 Fugitive
PM10
Exhaust
PM10
PM2.5
Total
Bio- CO2 NBio- CO2
Unmitigated Construction Off-Site
ROG NOx CO Total CO2 CH4 N2O CO2e
Category tons/yr MT/yr
PM10
Total
Fugitive
PM2.5
Exhaust
PM2.5
Hauling 0.0000 0.0000 0.0000 0.0000 0.0000 0.0000 0.0000 0.0000 0.0000 0.0000 0.0000 0.0000 0.0000 0.0000 0.0000 0.0000
Vendor 0.0127 0.0313 0.1622 4.0000e-
005
5.7000e-
004
1.8000e-
004
7.5000e-
004
1.7000e-
004
1.6000e-
004
3.3000e-
004
0.0000 3.5627 3.5627 5.0000e-
005
0.0000 3.5638
Worker 7.9400e-
003
2.4200e-
003
0.0336 2.0000e-
005
1.1600e-
003
4.0000e-
005
1.2000e-
003
3.1000e-
004
3.0000e-
005
3.5000e-
004
0.0000 1.5616 1.5616 1.7000e-
004
0.0000 1.5651
Total 0.0206 0.0337 0.1958 6.0000e-
005
2.2000e-
004
0.0000 5.12891.7300e-
003
2.2000e-
004
1.9500e-
003
4.8000e-
004
1.9000e-
004
6.8000e-
004
SO2 Fugitive
PM10
Exhaust
PM10
0.0000 5.1243 5.1243
PM2.5
Total
Bio- CO2 NBio- CO2
Mitigated Construction On-Site
ROG NOx CO Total CO2 CH4 N2O CO2e
Category tons/yr MT/yr
PM10
Total
Fugitive
PM2.5
Exhaust
PM2.5
Off-Road 6.3300e-
003
0.0385 0.3709 5.0000e-
004
8.0000e-
004
8.0000e-
004
8.0000e-
004
8.0000e-
004
0.0000 45.9521 45.9521 0.0139 0.0000 46.2429
Total 6.3300e-
003
0.0385 0.3709 5.0000e-
004
0.0139 0.0000 46.24298.0000e-
004
8.0000e-
004
8.0000e-
004
8.0000e-
004
SO2 Fugitive
PM10
Exhaust
PM10
0.0000 45.9521 45.9521
PM2.5
Total
Bio- CO2 NBio- CO2
Mitigated Construction Off-Site
ROG NOx CO Total CO2 CH4 N2O CO2ePM10
Total
Fugitive
PM2.5
Exhaust
PM2.5

Category tons/yr MT/yr
Hauling 0.0000 0.0000 0.0000 0.0000 0.0000 0.0000 0.0000 0.0000 0.0000 0.0000 0.0000 0.0000 0.0000 0.0000 0.0000 0.0000
Vendor 0.0127 0.0313 0.1622 4.0000e-
005
5.7000e-
004
1.8000e-
004
7.5000e-
004
1.7000e-
004
1.6000e-
004
3.3000e-
004
0.0000 3.5627 3.5627 5.0000e-
005
0.0000 3.5638
Worker 7.9400e-
003
2.4200e-
003
0.0336 2.0000e-
005
1.1600e-
003
4.0000e-
005
1.2000e-
003
3.1000e-
004
3.0000e-
005
3.5000e-
004
0.0000 1.5616 1.5616 1.7000e-
004
0.0000 1.5651
Total 0.0206 0.0337 0.1958 6.0000e-
005
2.2000e-
004
0.0000 5.12891.7300e-
003
2.2000e-
004
1.9500e-
003
4.8000e-
004
1.9000e-
004
6.8000e-
004
SO2 Fugitive
PM10
Exhaust
PM10
0.0000 5.1243 5.1243
PM2.5
Total
Bio- CO2 NBio- CO2
3.4 Building Construction - 2018
Unmitigated Construction On-Site
ROG NOx CO Total CO2 CH4 N2O CO2e
Category tons/yr MT/yr
PM10
Total
Fugitive
PM2.5
Exhaust
PM2.5
Off-Road 0.0501 0.4362 0.3584 4.7000e-
004
0.0326 0.0326 0.0301 0.0301 0.0000 42.3188 42.3188 0.0129 0.0000 42.5895
Total 0.0501 0.4362 0.3584 4.7000e-
004
0.0129 0.0000 42.58950.0326 0.0326 0.0301 0.0301
SO2 Fugitive
PM10
Exhaust
PM10
0.0000 42.3188 42.3188
PM2.5
Total
Bio- CO2 NBio- CO2
Unmitigated Construction Off-Site
ROG NOx CO Total CO2 CH4 N2O CO2e
Category tons/yr MT/yr
PM10
Total
Fugitive
PM2.5
Exhaust
PM2.5
Hauling 0.0000 0.0000 0.0000 0.0000 0.0000 0.0000 0.0000 0.0000 0.0000 0.0000 0.0000 0.0000 0.0000 0.0000 0.0000 0.0000
Vendor 9.5400e-
003
0.0275 0.1359 4.0000e-
005
5.3000e-
004
1.5000e-
004
6.8000e-
004
1.5000e-
004
1.4000e-
004
2.9000e-
004
0.0000 3.2628 3.2628 5.0000e-
005
0.0000 3.2638
Worker 6.7800e-
003
2.0100e-
003
0.0282 2.0000e-
005
1.0900e-
003
3.0000e-
005
1.1200e-
003
2.9000e-
004
3.0000e-
005
3.2000e-
004
0.0000 1.4071 1.4071 1.4000e-
004
0.0000 1.4100

Total 0.0163 0.0295 0.1641 6.0000e-
005
1.9000e-
004
0.0000 4.67381.6200e-
003
1.8000e-
004
1.8000e-
003
4.4000e-
004
1.7000e-
004
6.1000e-
004
SO2 Fugitive
PM10
Exhaust
PM10
0.0000 4.6698 4.6698
PM2.5
Total
Bio- CO2 NBio- CO2
Mitigated Construction On-Site
ROG NOx CO Total CO2 CH4 N2O CO2e
Category tons/yr MT/yr
PM10
Total
Fugitive
PM2.5
Exhaust
PM2.5
Off-Road 5.9300e-
003
0.0360 0.3470 4.7000e-
004
7.5000e-
004
7.5000e-
004
7.5000e-
004
7.5000e-
004
0.0000 42.3188 42.3188 0.0129 0.0000 42.5894
Total 5.9300e-
003
0.0360 0.3470 4.7000e-
004
0.0129 0.0000 42.58947.5000e-
004
7.5000e-
004
7.5000e-
004
7.5000e-
004
SO2 Fugitive
PM10
Exhaust
PM10
0.0000 42.3188 42.3188
PM2.5
Total
Bio- CO2 NBio- CO2
Mitigated Construction Off-Site
ROG NOx CO Total CO2 CH4 N2O CO2e
Category tons/yr MT/yr
PM10
Total
Fugitive
PM2.5
Exhaust
PM2.5
Hauling 0.0000 0.0000 0.0000 0.0000 0.0000 0.0000 0.0000 0.0000 0.0000 0.0000 0.0000 0.0000 0.0000 0.0000 0.0000 0.0000
Vendor 9.5400e-
003
0.0275 0.1359 4.0000e-
005
5.3000e-
004
1.5000e-
004
6.8000e-
004
1.5000e-
004
1.4000e-
004
2.9000e-
004
0.0000 3.2628 3.2628 5.0000e-
005
0.0000 3.2638
Worker 6.7800e-
003
2.0100e-
003
0.0282 2.0000e-
005
1.0900e-
003
3.0000e-
005
1.1200e-
003
2.9000e-
004
3.0000e-
005
3.2000e-
004
0.0000 1.4071 1.4071 1.4000e-
004
0.0000 1.4100
Total 0.0163 0.0295 0.1641 6.0000e-
005
1.9000e-
004
0.0000 4.67381.6200e-
003
1.8000e-
004
1.8000e-
003
4.4000e-
004
1.7000e-
004
6.1000e-
004
0.0000 4.6698 4.6698
3.5 Trenching - 2017
Unmitigated Construction On-Site

SO2 Fugitive
PM10
Exhaust
PM10
PM2.5
Total
Bio- CO2 NBio- CO2ROG NOx CO Total CO2 CH4 N2O CO2e
Category tons/yr MT/yr
PM10
Total
Fugitive
PM2.5
Exhaust
PM2.5
Off-Road 3.1700e-
003
0.0304 0.0239 3.0000e-
005
2.2900e-
003
2.2900e-
003
2.1100e-
003
2.1100e-
003
0.0000 2.8873 2.8873 8.8000e-
004
0.0000 2.9058
Total 3.1700e-
003
0.0304 0.0239 3.0000e-
005
8.8000e-
004
0.0000 2.90582.2900e-
003
2.2900e-
003
2.1100e-
003
2.1100e-
003
SO2 Fugitive
PM10
Exhaust
PM10
0.0000 2.8873 2.8873
PM2.5
Total
Bio- CO2 NBio- CO2
Unmitigated Construction Off-Site
ROG NOx CO Total CO2 CH4 N2O CO2e
Category tons/yr MT/yr
PM10
Total
Fugitive
PM2.5
Exhaust
PM2.5
Hauling 0.0000 0.0000 0.0000 0.0000 0.0000 0.0000 0.0000 0.0000 0.0000 0.0000 0.0000 0.0000 0.0000 0.0000 0.0000 0.0000
Vendor 0.0000 0.0000 0.0000 0.0000 0.0000 0.0000 0.0000 0.0000 0.0000 0.0000 0.0000 0.0000 0.0000 0.0000 0.0000 0.0000
Worker 8.0000e-
005
2.0000e-
005
3.3000e-
004
0.0000 1.0000e-
005
0.0000 1.0000e-
005
0.0000 0.0000 0.0000 0.0000 0.0151 0.0151 0.0000 0.0000 0.0152
Total 8.0000e-
005
2.0000e-
005
3.3000e-
004
0.0000 0.0000 0.0000 0.01521.0000e-
005
0.0000 1.0000e-
005
0.0000 0.0000 0.0000
SO2 Fugitive
PM10
Exhaust
PM10
0.0000 0.0151 0.0151
PM2.5
Total
Bio- CO2 NBio- CO2
Mitigated Construction On-Site
ROG NOx CO Total CO2 CH4 N2O CO2e
Category tons/yr MT/yr
PM10
Total
Fugitive
PM2.5
Exhaust
PM2.5

Off-Road 3.8000e-
004
1.6500e-
003
0.0234 3.0000e-
005
5.0000e-
005
5.0000e-
005
5.0000e-
005
5.0000e-
005
0.0000 2.8873 2.8873 8.8000e-
004
0.0000 2.9058
Total 3.8000e-
004
1.6500e-
003
0.0234 3.0000e-
005
8.8000e-
004
0.0000 2.90585.0000e-
005
5.0000e-
005
5.0000e-
005
5.0000e-
005
SO2 Fugitive
PM10
Exhaust
PM10
0.0000 2.8873 2.8873
PM2.5
Total
Bio- CO2 NBio- CO2
Mitigated Construction Off-Site
ROG NOx CO Total CO2 CH4 N2O CO2e
Category tons/yr MT/yr
PM10
Total
Fugitive
PM2.5
Exhaust
PM2.5
Hauling 0.0000 0.0000 0.0000 0.0000 0.0000 0.0000 0.0000 0.0000 0.0000 0.0000 0.0000 0.0000 0.0000 0.0000 0.0000 0.0000
Vendor 0.0000 0.0000 0.0000 0.0000 0.0000 0.0000 0.0000 0.0000 0.0000 0.0000 0.0000 0.0000 0.0000 0.0000 0.0000 0.0000
Worker 8.0000e-
005
2.0000e-
005
3.3000e-
004
0.0000 1.0000e-
005
0.0000 1.0000e-
005
0.0000 0.0000 0.0000 0.0000 0.0151 0.0151 0.0000 0.0000 0.0152
Total 8.0000e-
005
2.0000e-
005
3.3000e-
004
0.0000 0.0000 0.0000 0.01521.0000e-
005
0.0000 1.0000e-
005
0.0000 0.0000 0.0000
SO2 Fugitive
PM10
Exhaust
PM10
0.0000 0.0151 0.0151
PM2.5
Total
Bio- CO2 NBio- CO2
3.6 Paving - 2018
Unmitigated Construction On-Site
ROG NOx CO Total CO2 CH4 N2O CO2e
Category tons/yr MT/yr
PM10
Total
Fugitive
PM2.5
Exhaust
PM2.5
Off-Road 6.1600e-
003
0.0646 0.0552 8.0000e-
005
3.7500e-
003
3.7500e-
003
3.4500e-
003
3.4500e-
003
0.0000 7.5294 7.5294 2.3400e-
003
0.0000 7.5786
Paving 0.0000 0.0000 0.0000 0.0000 0.0000 0.0000 0.0000 0.0000 0.0000 0.0000 0.0000
Total 6.1600e-
003
0.0646 0.0552 8.0000e-
005
2.3400e-
003
0.0000 7.57863.7500e-
003
3.7500e-
003
3.4500e-
003
3.4500e-
003
0.0000 7.5294 7.5294

SO2 Fugitive
PM10
Exhaust
PM10
PM2.5
Total
Bio- CO2 NBio- CO2
Unmitigated Construction Off-Site
ROG NOx CO Total CO2 CH4 N2O CO2e
Category tons/yr MT/yr
PM10
Total
Fugitive
PM2.5
Exhaust
PM2.5
Hauling 1.3900e-
003
3.4400e-
003
0.0222 0.0000 6.0000e-
005
2.0000e-
005
7.0000e-
005
2.0000e-
005
1.0000e-
005
3.0000e-
005
0.0000 0.3918 0.3918 1.0000e-
005
0.0000 0.3919
Vendor 0.0000 0.0000 0.0000 0.0000 0.0000 0.0000 0.0000 0.0000 0.0000 0.0000 0.0000 0.0000 0.0000 0.0000 0.0000 0.0000
Worker 4.2000e-
004
1.3000e-
004
1.7500e-
003
0.0000 7.0000e-
005
0.0000 7.0000e-
005
2.0000e-
005
0.0000 2.0000e-
005
0.0000 0.0873 0.0873 1.0000e-
005
0.0000 0.0875
Total 1.8100e-
003
3.5700e-
003
0.0239 0.0000 2.0000e-
005
0.0000 0.47941.3000e-
004
2.0000e-
005
1.4000e-
004
4.0000e-
005
1.0000e-
005
5.0000e-
005
SO2 Fugitive
PM10
Exhaust
PM10
0.0000 0.4791 0.4791
PM2.5
Total
Bio- CO2 NBio- CO2
Mitigated Construction On-Site
ROG NOx CO Total CO2 CH4 N2O CO2e
Category tons/yr MT/yr
PM10
Total
Fugitive
PM2.5
Exhaust
PM2.5
Off-Road 1.0100e-
003
4.3900e-
003
0.0625 8.0000e-
005
1.4000e-
004
1.4000e-
004
1.4000e-
004
1.4000e-
004
0.0000 7.5293 7.5293 2.3400e-
003
0.0000 7.5786
Paving 0.0000 0.0000 0.0000 0.0000 0.0000 0.0000 0.0000 0.0000 0.0000 0.0000 0.0000
Total 1.0100e-
003
4.3900e-
003
0.0625 8.0000e-
005
2.3400e-
003
0.0000 7.57861.4000e-
004
1.4000e-
004
1.4000e-
004
1.4000e-
004
SO2 Fugitive
PM10
Exhaust
PM10
0.0000 7.5293 7.5293
PM2.5
Total
Bio- CO2 NBio- CO2
Mitigated Construction Off-Site
ROG NOx CO Total CO2 CH4 N2O CO2ePM10
Total
Fugitive
PM2.5
Exhaust
PM2.5
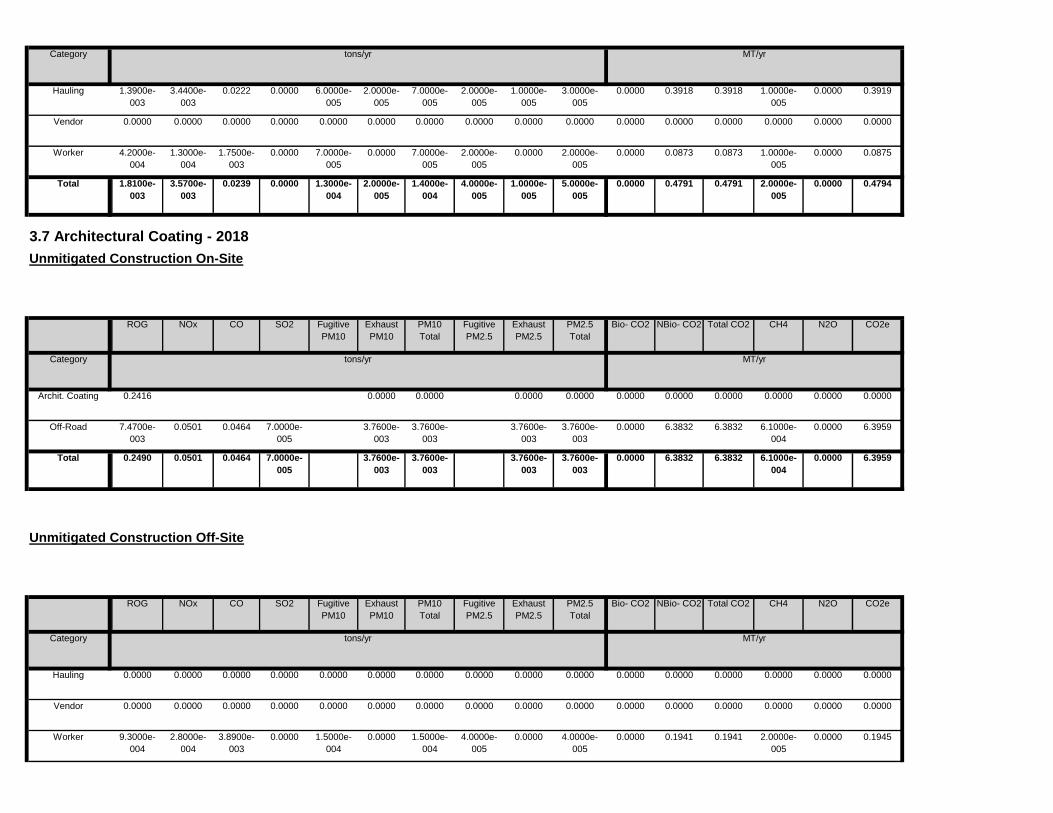
Category tons/yr MT/yr
Hauling 1.3900e-
003
3.4400e-
003
0.0222 0.0000 6.0000e-
005
2.0000e-
005
7.0000e-
005
2.0000e-
005
1.0000e-
005
3.0000e-
005
0.0000 0.3918 0.3918 1.0000e-
005
0.0000 0.3919
Vendor 0.0000 0.0000 0.0000 0.0000 0.0000 0.0000 0.0000 0.0000 0.0000 0.0000 0.0000 0.0000 0.0000 0.0000 0.0000 0.0000
Worker 4.2000e-
004
1.3000e-
004
1.7500e-
003
0.0000 7.0000e-
005
0.0000 7.0000e-
005
2.0000e-
005
0.0000 2.0000e-
005
0.0000 0.0873 0.0873 1.0000e-
005
0.0000 0.0875
Total 1.8100e-
003
3.5700e-
003
0.0239 0.0000 2.0000e-
005
0.0000 0.47941.3000e-
004
2.0000e-
005
1.4000e-
004
4.0000e-
005
1.0000e-
005
5.0000e-
005
SO2 Fugitive
PM10
Exhaust
PM10
0.0000 0.4791 0.4791
PM2.5
Total
Bio- CO2 NBio- CO2
3.7 Architectural Coating - 2018
Unmitigated Construction On-Site
ROG NOx CO Total CO2 CH4 N2O CO2e
Category tons/yr MT/yr
PM10
Total
Fugitive
PM2.5
Exhaust
PM2.5
Archit. Coating 0.2416 0.0000 0.0000 0.0000 0.0000 0.0000 0.0000 0.0000 0.0000 0.0000 0.0000
Off-Road 7.4700e-
003
0.0501 0.0464 7.0000e-
005
3.7600e-
003
3.7600e-
003
3.7600e-
003
3.7600e-
003
0.0000 6.3832 6.3832 6.1000e-
004
0.0000 6.3959
Total 0.2490 0.0501 0.0464 7.0000e-
005
6.1000e-
004
0.0000 6.39593.7600e-
003
3.7600e-
003
3.7600e-
003
3.7600e-
003
SO2 Fugitive
PM10
Exhaust
PM10
0.0000 6.3832 6.3832
PM2.5
Total
Bio- CO2 NBio- CO2
Unmitigated Construction Off-Site
ROG NOx CO Total CO2 CH4 N2O CO2e
Category tons/yr MT/yr
PM10
Total
Fugitive
PM2.5
Exhaust
PM2.5
Hauling 0.0000 0.0000 0.0000 0.0000 0.0000 0.0000 0.0000 0.0000 0.0000 0.0000 0.0000 0.0000 0.0000 0.0000 0.0000 0.0000
Vendor 0.0000 0.0000 0.0000 0.0000 0.0000 0.0000 0.0000 0.0000 0.0000 0.0000 0.0000 0.0000 0.0000 0.0000 0.0000 0.0000
Worker 9.3000e-
004
2.8000e-
004
3.8900e-
003
0.0000 1.5000e-
004
0.0000 1.5000e-
004
4.0000e-
005
0.0000 4.0000e-
005
0.0000 0.1941 0.1941 2.0000e-
005
0.0000 0.1945

Total 9.3000e-
004
2.8000e-
004
3.8900e-
003
0.0000 2.0000e-
005
0.0000 0.19451.5000e-
004
0.0000 1.5000e-
004
4.0000e-
005
0.0000 4.0000e-
005
SO2 Fugitive
PM10
Exhaust
PM10
0.0000 0.1941 0.1941
PM2.5
Total
Bio- CO2 NBio- CO2
Mitigated Construction On-Site
ROG NOx CO Total CO2 CH4 N2O CO2e
Category tons/yr MT/yr
PM10
Total
Fugitive
PM2.5
Exhaust
PM2.5
Archit. Coating 0.2416 0.0000 0.0000 0.0000 0.0000 0.0000 0.0000 0.0000 0.0000 0.0000 0.0000
Off-Road 7.4000e-
004
3.2200e-
003
0.0458 7.0000e-
005
1.0000e-
004
1.0000e-
004
1.0000e-
004
1.0000e-
004
0.0000 6.3831 6.3831 6.1000e-
004
0.0000 6.3959
Total 0.2423 3.2200e-
003
0.0458 7.0000e-
005
6.1000e-
004
0.0000 6.39591.0000e-
004
1.0000e-
004
1.0000e-
004
1.0000e-
004
SO2 Fugitive
PM10
Exhaust
PM10
0.0000 6.3831 6.3831
PM2.5
Total
Bio- CO2 NBio- CO2
Mitigated Construction Off-Site
ROG NOx CO Total CO2 CH4 N2O CO2e
Category tons/yr MT/yr
PM10
Total
Fugitive
PM2.5
Exhaust
PM2.5
Hauling 0.0000 0.0000 0.0000 0.0000 0.0000 0.0000 0.0000 0.0000 0.0000 0.0000 0.0000 0.0000 0.0000 0.0000 0.0000 0.0000
Vendor 0.0000 0.0000 0.0000 0.0000 0.0000 0.0000 0.0000 0.0000 0.0000 0.0000 0.0000 0.0000 0.0000 0.0000 0.0000 0.0000
Worker 9.3000e-
004
2.8000e-
004
3.8900e-
003
0.0000 1.5000e-
004
0.0000 1.5000e-
004
4.0000e-
005
0.0000 4.0000e-
005
0.0000 0.1941 0.1941 2.0000e-
005
0.0000 0.1945
Total 9.3000e-
004
2.8000e-
004
3.8900e-
003
0.0000 2.0000e-
005
0.0000 0.19451.5000e-
004
0.0000 1.5000e-
004
4.0000e-
005
0.0000 4.0000e-
005
0.0000 0.1941 0.1941

CalEEMod Output- Operational GHG Emissions

Vehicle Trips - Used traffic report of 8.36 weekday, 8.19 Saturday (similar to CalEEMod). Used CalEEMod for Sunday
Water And Wastewater - wtp treatment
1.3 User Entered Comments & Non-Default Data
Project Characteristics - PG&E 2020 rate
Land Use - Area summary, project description and mail correspondence dated 8/8/2016 updated to 80 parking spaces
Construction Phase - Operational run only
Off-road Equipment - Operational run only
Trips and VMT - Operational run only
CO2 Intensity (lb/MWhr)
290 CH4 Intensity (lb/MWhr)
0.029 N2O Intensity (lb/MWhr)
0.006
64
Climate Zone 4 Operational Year 2020
Utility Company Pacific Gas & Electric Company
1.2 Other Project Characteristics
Urbanization Urban Wind Speed (m/s) 3.6 Precipitation Freq (Days)
Parking Lot 80.00 Space 0.00 32,000.00 0
High Turnover (Sit Down Restaurant) 0.91 1000sqft 0.00 910.00 0
Floor Surface Area Population
Hotel 65.00 Room 10.50 51,000.00 0
1.0 Project Characteristics
1.1 Land Usage
Land Uses Size Metric Lot Acreage
CalEEMod Version: CalEEMod.2016.3.2Page 1 of 1 Date: 9/12/2019 10:24 AM
Farmstead at LMR, Criteria and Operational - Napa County, Annual
Farmstead at LMR, Criteria and OperationalNapa County, Annual
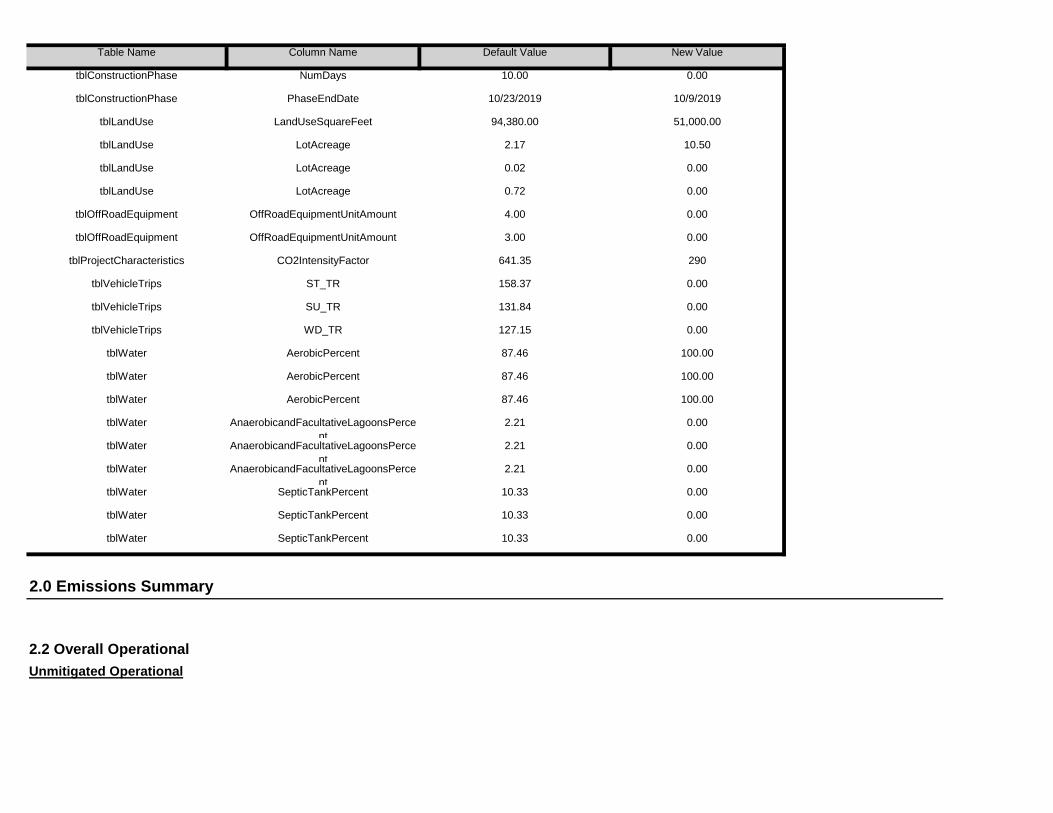
2.2 Overall OperationalUnmitigated Operational
tblWater SepticTankPercent 10.33 0.00
2.0 Emissions Summary
tblWater SepticTankPercent 10.33 0.00
tblWater SepticTankPercent 10.33 0.00
tblWater AnaerobicandFacultativeLagoonsPercent
2.21 0.00
tblWater AnaerobicandFacultativeLagoonsPercent
2.21 0.00
tblWater AerobicPercent 87.46 100.00
tblWater AnaerobicandFacultativeLagoonsPercent
2.21 0.00
tblWater AerobicPercent 87.46 100.00
tblWater AerobicPercent 87.46 100.00
tblVehicleTrips SU_TR 131.84 0.00
tblVehicleTrips WD_TR 127.15 0.00
tblProjectCharacteristics CO2IntensityFactor 641.35 290
tblVehicleTrips ST_TR 158.37 0.00
tblOffRoadEquipment OffRoadEquipmentUnitAmount 4.00 0.00
tblOffRoadEquipment OffRoadEquipmentUnitAmount 3.00 0.00
tblLandUse LotAcreage 0.02 0.00
tblLandUse LotAcreage 0.72 0.00
tblLandUse LandUseSquareFeet 94,380.00 51,000.00
tblLandUse LotAcreage 2.17 10.50
tblConstructionPhase NumDays 10.00 0.00
tblConstructionPhase PhaseEndDate 10/23/2019 10/9/2019
Table Name Column Name Default Value New Value

0.00 0.00 0.00 0.00 0.00 0.000.00 0.00 0.00 0.00 0.00 0.00
NBio-CO2 Total CO2 CH4 N20 CO2e
Percent Reduction
0.00 0.00 0.00 0.00
Exhaust PM10
PM10 Total
Fugitive PM2.5
Exhaust PM2.5
PM2.5 Total
Bio- CO2ROG NOx CO SO2 Fugitive PM10
10.1039 622.4282 632.5322 0.5873 5.0800e-003
648.72810.3617 0.0148 0.3765 0.0971 0.0145 0.1116Total 0.4037 0.9805 1.7659 5.4400e-003
0.6811 1.4627 2.1438 2.4900e-003
1.5100e-003
2.65640.0000 0.0000 0.0000 0.0000Water
9.4228 0.0000 9.4228 0.5569 0.0000 23.34470.0000 0.0000 0.0000 0.0000Waste
0.0000 433.7663 433.7663 0.0198 0.0000 434.26130.3617 5.7200e-003
0.3674 0.0971 5.3900e-003
0.1025Mobile 0.1578 0.8604 1.6637 4.7200e-003
0.0000 187.1967 187.1967 8.1600e-003
3.5700e-003
188.46309.1200e-003
9.1200e-003
9.1200e-003
9.1200e-003
Energy 0.0132 0.1201 0.1008 7.2000e-004
0.0000 2.6100e-003
2.6100e-003
1.0000e-005
0.0000 2.7800e-003
0.0000 0.0000 0.0000 0.0000Area 0.2327 1.0000e-005
1.3500e-003
0.0000
Total CO2 CH4 N2O CO2e
Category tons/yr MT/yr
PM10 Total
Fugitive PM2.5
Exhaust PM2.5
PM2.5 Total
Bio- CO2 NBio- CO2
Mitigated Operational
ROG NOx CO SO2 Fugitive PM10
Exhaust PM10
10.1039 622.4282 632.5322 0.5873 5.0800e-003
648.72810.3617 0.0148 0.3765 0.0971 0.0145 0.1116Total 0.4037 0.9805 1.7659 5.4400e-003
0.6811 1.4627 2.1438 2.4900e-003
1.5100e-003
2.65640.0000 0.0000 0.0000 0.0000Water
9.4228 0.0000 9.4228 0.5569 0.0000 23.34470.0000 0.0000 0.0000 0.0000Waste
0.0000 433.7663 433.7663 0.0198 0.0000 434.26130.3617 5.7200e-003
0.3674 0.0971 5.3900e-003
0.1025Mobile 0.1578 0.8604 1.6637 4.7200e-003
0.0000 187.1967 187.1967 8.1600e-003
3.5700e-003
188.46309.1200e-003
9.1200e-003
9.1200e-003
9.1200e-003
Energy 0.0132 0.1201 0.1008 7.2000e-004
0.0000 2.6100e-003
2.6100e-003
1.0000e-005
0.0000 2.7800e-003
0.0000 0.0000 0.0000 0.0000Area 0.2327 1.0000e-005
1.3500e-003
0.0000
Total CO2 CH4 N2O CO2e
Category tons/yr MT/yr
PM10 Total
Fugitive PM2.5
Exhaust PM2.5
PM2.5 Total
Bio- CO2 NBio- CO2ROG NOx CO SO2 Fugitive PM10
Exhaust PM10

0.00 0.00 0 0 0
61.60 19.00 58 38 4
Parking Lot 9.50 7.30 7.30 0.00
72.50 19.00 37 20 43
Hotel 9.50 7.30 7.30 19.40
H-S or C-C H-O or C-NW Primary Diverted Pass-by
High Turnover (Sit Down Restaurant)
9.50 7.30 7.30 8.50
4.3 Trip Type Information
Miles Trip % Trip Purpose %
Land Use H-W or C-W H-S or C-C H-O or C-NW H-W or C-W
Total 531.05 532.35 386.75 970,145 970,145Parking Lot 0.00 0.00 0.00
Hotel 531.05 532.35 386.75 970,145 970,145
Annual VMT
High Turnover (Sit Down Restaurant) 0.00 0.00 0.00
4.2 Trip Summary Information
Average Daily Trip Rate Unmitigated MitigatedLand Use Weekday Saturday Sunday Annual VMT
0.0000 433.7663 433.7663 0.0198 0.0000 434.26130.3617 5.7200e-003
0.3674 0.0971 5.3900e-003
0.1025Unmitigated 0.1578 0.8604 1.6637 4.7200e-003
0.0000 433.7663 433.7663 0.0198 0.0000 434.26130.3617 5.7200e-003
0.3674 0.0971 5.3900e-003
0.1025Mitigated 0.1578 0.8604 1.6637 4.7200e-003
NBio- CO2 Total CO2 CH4 N2O CO2e
Category tons/yr MT/yr
Exhaust PM10
PM10 Total
Fugitive PM2.5
Exhaust PM2.5
PM2.5 Total
Bio- CO2
4.0 Operational Detail - Mobile
4.1 Mitigation Measures Mobile
ROG NOx CO SO2 Fugitive PM10

NBio- CO2 Total CO2 CH4 N2O CO2e
Land Use kBTU/yr tons/yr MT/yr
Exhaust PM10
PM10 Total
Fugitive PM2.5
Exhaust PM2.5
PM2.5 Total
Bio- CO2
5.2 Energy by Land Use - NaturalGasUnmitigated
NaturalGas Use
ROG NOx CO SO2 Fugitive PM10
0.0000 130.6869 130.6869 2.5000e-003
2.4000e-003
131.46369.1200e-003
9.1200e-003
9.1200e-003
9.1200e-003
NaturalGas Unmitigated
0.0132 0.1201 0.1008 7.2000e-004
0.0000 130.6869 130.6869 2.5000e-003
2.4000e-003
131.46369.1200e-003
9.1200e-003
9.1200e-003
9.1200e-003
NaturalGas Mitigated
0.0132 0.1201 0.1008 7.2000e-004
0.0000 56.5097 56.5097 5.6500e-003
1.1700e-003
56.99940.0000 0.0000 0.0000 0.0000Electricity Unmitigated
0.0000 56.5097 56.5097 5.6500e-003
1.1700e-003
56.99940.0000 0.0000 0.0000 0.0000Electricity Mitigated
NBio- CO2 Total CO2 CH4 N2O CO2e
Category tons/yr MT/yr
Exhaust PM10
PM10 Total
Fugitive PM2.5
Exhaust PM2.5
PM2.5 Total
Bio- CO2
5.0 Energy Detail
Historical Energy Use: N
5.1 Mitigation Measures Energy
ROG NOx CO SO2 Fugitive PM10
0.035422 0.003826 0.001868 0.005693 0.001021 0.001123
0.001021 0.001123
Parking Lot 0.569185 0.038999 0.171806 0.120317 0.026328 0.006551 0.017860
0.006551 0.017860 0.035422 0.003826 0.001868 0.005693Hotel 0.569185 0.038999 0.171806 0.120317 0.026328
0.035422 0.003826 0.001868 0.005693 0.001021 0.001123
SBUS MH
High Turnover (Sit Down Restaurant)
0.569185 0.038999 0.171806 0.120317 0.026328 0.006551 0.017860
LHD2 MHD HHD OBUS UBUS MCYLand Use LDA LDT1 LDT2 MDV LHD1
4.4 Fleet Mix
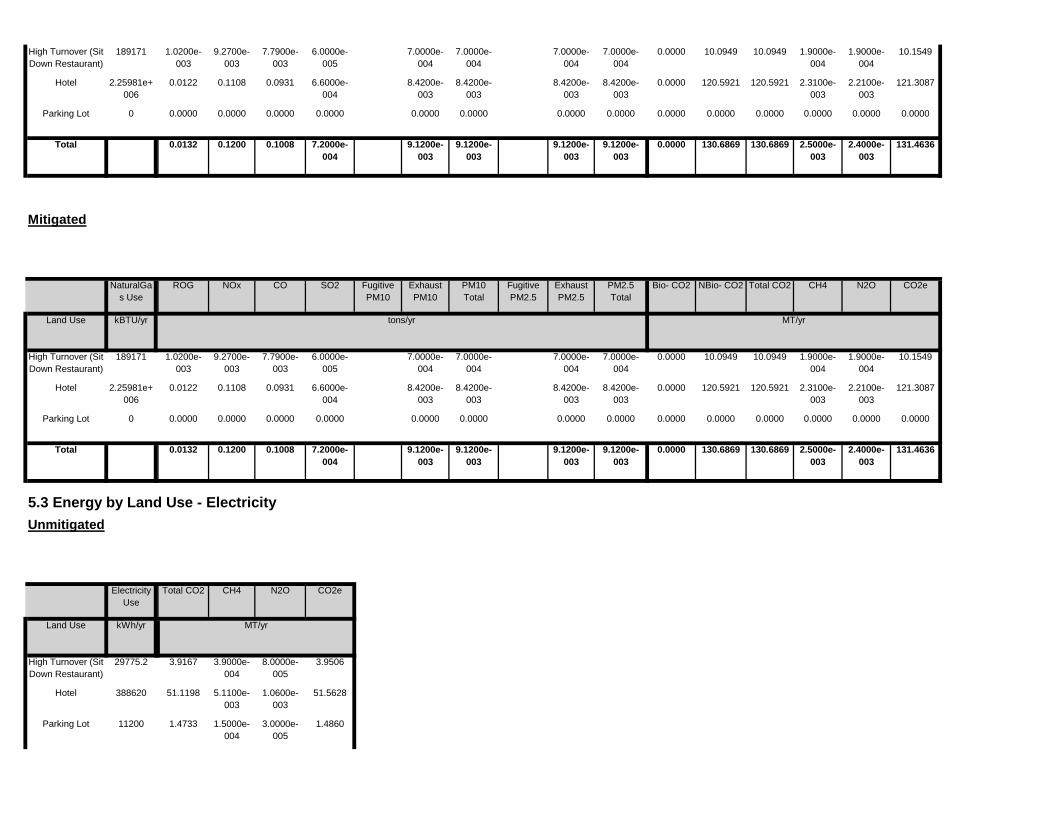
1.4860Parking Lot 11200 1.4733 1.5000e-004
3.0000e-005
3.9506
Hotel 388620 51.1198 5.1100e-003
1.0600e-003
51.5628
Land Use kWh/yr ton
MT/yr
High Turnover (Sit Down Restaurant)
29775.2 3.9167 3.9000e-004
8.0000e-005
Unmitigated
Electricity Use
Total CO2 CH4 N2O CO2e
130.6869 130.6869 2.5000e-003
2.4000e-003
131.4636
5.3 Energy by Land Use - Electricity
9.1200e-003
9.1200e-003
9.1200e-003
9.1200e-003
0.0000
0.0000 0.0000
Total 0.0132 0.1200 0.1008 7.2000e-004
0.0000 0.0000 0.0000 0.0000 0.0000 0.00000.0000 0.0000 0.0000 0.0000
120.5921 120.5921 2.3100e-003
2.2100e-003
121.3087
Parking Lot 0 0.0000 0.0000
8.4200e-003
8.4200e-003
8.4200e-003
8.4200e-003
0.0000
1.9000e-004
10.1549
Hotel 2.25981e+006
0.0122 0.1108 0.0931 6.6000e-004
7.0000e-004
7.0000e-004
0.0000 10.0949 10.0949 1.9000e-004
7.7900e-003
6.0000e-005
7.0000e-004
7.0000e-004
CO2e
Land Use kBTU/yr tons/yr MT/yr
High Turnover (Sit Down Restaurant)
189171 1.0200e-003
9.2700e-003
PM2.5 Total
Bio- CO2 NBio- CO2 Total CO2 CH4 N2OSO2 Fugitive PM10
Exhaust PM10
PM10 Total
Fugitive PM2.5
Exhaust PM2.5
NaturalGas Use
ROG NOx CO
130.6869 2.5000e-003
2.4000e-003
131.4636
Mitigated
9.1200e-003
9.1200e-003
9.1200e-003
0.0000 130.6869
0.0000
Total 0.0132 0.1200 0.1008 7.2000e-004
9.1200e-003
0.0000 0.0000 0.0000 0.0000 0.0000 0.00000.0000 0.0000 0.0000 0.0000
120.5921 2.3100e-003
2.2100e-003
121.3087
Parking Lot 0 0.0000 0.0000 0.0000
8.4200e-003
8.4200e-003
8.4200e-003
0.0000 120.5921
10.1549
Hotel 2.25981e+006
0.0122 0.1108 0.0931 6.6000e-004
8.4200e-003
7.0000e-004
0.0000 10.0949 10.0949 1.9000e-004
1.9000e-004
6.0000e-005
7.0000e-004
7.0000e-004
7.0000e-004
High Turnover (Sit Down Restaurant)
189171 1.0200e-003
9.2700e-003
7.7900e-003

0.0000 2.6100e-003
2.6100e-003
1.0000e-005
0.0000 2.7800e-003
0.0000 0.0000 0.0000 0.0000Unmitigated 0.2327 1.0000e-005
1.3500e-003
0.0000
0.0000 2.6100e-003
2.6100e-003
1.0000e-005
0.0000 2.7800e-003
0.0000 0.0000 0.0000 0.0000Mitigated 0.2327 1.0000e-005
1.3500e-003
0.0000
NBio- CO2 Total CO2 CH4 N2O CO2e
Category tons/yr MT/yr
Exhaust PM10
PM10 Total
Fugitive PM2.5
Exhaust PM2.5
PM2.5 Total
Bio- CO2
6.0 Area Detail
6.1 Mitigation Measures Area
ROG NOx CO SO2 Fugitive PM10
1.4860
Total 56.5097 5.6500e-003
1.1700e-003
56.9994
Parking Lot 11200 1.4733 1.5000e-004
3.0000e-005
3.9506
Hotel 388620 51.1198 5.1100e-003
1.0600e-003
51.5628
Land Use kWh/yr ton
MT/yr
High Turnover (Sit Down Restaurant)
29775.2 3.9167 3.9000e-004
8.0000e-005
Mitigated
Electricity Use
Total CO2 CH4 N2O CO2e
Total 56.5097 5.6500e-003
1.1700e-003
56.9994

7.0 Water Detail
7.1 Mitigation Measures Water
0.0000 2.6100e-003
2.6100e-003
1.0000e-005
0.0000 2.7800e-003
0.0000 0.0000 0.0000 0.0000Total 0.2327 1.0000e-005
1.3500e-003
0.0000
0.0000 2.6100e-003
2.6100e-003
1.0000e-005
0.0000 2.7800e-003
0.0000 0.0000 0.0000 0.0000Landscaping 1.3000e-004
1.0000e-005
1.3500e-003
0.0000
0.0000 0.0000 0.0000 0.0000 0.0000 0.00000.0000 0.0000 0.0000 0.0000Consumer Products
0.2048
0.0000 0.0000 0.0000 0.0000 0.0000 0.00000.0000 0.0000 0.0000 0.0000Architectural Coating
0.0277
Total CO2 CH4 N2O CO2e
SubCategory tons/yr MT/yr
PM10 Total
Fugitive PM2.5
Exhaust PM2.5
PM2.5 Total
Bio- CO2 NBio- CO2
Mitigated
ROG NOx CO SO2 Fugitive PM10
Exhaust PM10
0.0000 2.6100e-003
2.6100e-003
1.0000e-005
0.0000 2.7800e-003
0.0000 0.0000 0.0000 0.0000Total 0.2327 1.0000e-005
1.3500e-003
0.0000
0.0000 2.6100e-003
2.6100e-003
1.0000e-005
0.0000 2.7800e-003
0.0000 0.0000 0.0000 0.0000Landscaping 1.3000e-004
1.0000e-005
1.3500e-003
0.0000
0.0000 0.0000 0.0000 0.0000 0.0000 0.00000.0000 0.0000 0.0000 0.0000Consumer Products
0.2048
0.0000 0.0000 0.0000 0.0000 0.0000 0.00000.0000 0.0000 0.0000 0.0000Architectural Coating
0.0277
Total CO2 CH4 N2O CO2e
SubCategory tons/yr MT/yr
PM10 Total
Fugitive PM2.5
Exhaust PM2.5
PM2.5 Total
Bio- CO2 NBio- CO2
6.2 Area by SubCategoryUnmitigated
ROG NOx CO SO2 Fugitive PM10
Exhaust PM10

Mitigated
Indoor/Outdoor Use
Total CO2 CH4 N2O CO2e
0.0000
Total 2.1438 2.4900e-003
1.5100e-003
2.6564
Parking Lot 0 / 0 0.0000 0.0000 0.0000
0.3760
Hotel 1.64884 / 0.183204
1.8413 2.1300e-003
1.2900e-003
2.2805
Land Use Mgal ton
MT/yr
High Turnover (Sit Down Restaurant)
0.276216 / 0.0176308
0.3025 3.6000e-004
2.2000e-004
7.2 Water by Land UseUnmitigated
Indoor/Outdoor Use
Total CO2 CH4 N2O CO2e
Unmitigated 2.1438 2.4900e-003
1.5100e-003
2.6564
Category ton
MT/yr
Mitigated 2.1438 2.4900e-003
1.5100e-003
2.6564
Total CO2 CH4 N2O CO2e

Land Use tons ton
MT/yr
8.2 Waste by Land UseUnmitigated
Waste Disposed
Total CO2 CH4 N2O CO2e
Unmitigated 9.4228 0.5569 0.0000 23.3447
ton
MT/yr
Mitigated 9.4228 0.5569 0.0000 23.3447
8.0 Waste Detail
8.1 Mitigation Measures Waste
Category/Year
Total CO2 CH4 N2O CO2e
0.0000
Total 2.1438 2.4900e-003
1.5100e-003
2.6564
Parking Lot 0 / 0 0.0000 0.0000 0.0000
0.3760
Hotel 1.64884 / 0.183204
1.8413 2.1300e-003
1.2900e-003
2.2805
Land Use Mgal ton
MT/yr
High Turnover (Sit Down Restaurant)
0.276216 / 0.0176308
0.3025 3.6000e-004
2.2000e-004

Fuel Type
Boilers
Equipment Type Number Heat Input/Day Heat Input/Year Boiler Rating Fuel Type
Load Factor Fuel Type
10.0 Stationary Equipment
Fire Pumps and Emergency Generators
Equipment Type Number Hours/Day Hours/Year Horse Power Load Factor
9.0 Operational Offroad
Equipment Type Number Hours/Day Days/Year Horse Power
0.0000
Total 9.4228 0.5569 0.0000 23.3447
Parking Lot 0 0.0000 0.0000 0.0000
5.4464
Hotel 35.59 7.2245 0.4270 0.0000 17.8983
Land Use tons ton
MT/yr
High Turnover (Sit Down Restaurant)
10.83 2.1984 0.1299 0.0000
Mitigated
Waste Disposed
Total CO2 CH4 N2O CO2e
0.0000
Total 9.4228 0.5569 0.0000 23.3447
Parking Lot 0 0.0000 0.0000 0.0000
5.4464
Hotel 35.59 7.2245 0.4270 0.0000 17.8983
High Turnover (Sit Down Restaurant)
10.83 2.1984 0.1299 0.0000

User Defined Equipment
Equipment Type Number
11.0 Vegetation

EMFAC2017 (v1.0.2) Emission RatesRegion Type: Air BasinRegion: SAN FRANCISCO BAY AREACalendar Year: 2020Season: AnnualVehicle Classification: EMFAC2011 CategoriesUnits: miles/day for VMT, trips/day for Trips, g/mile for RUNEX, PMBW and PMTW, g/trip for STREX, HTSK and RUNLS, g/vehicle/day for IDLEX, RESTL and DIURN
Region Calendar Year Vehicle Category Model Year Speed Fuel VMT Trips CO2_RUNEX CO2_IDLEX CO2_STREX CH4_RUNEX CH4_IDLEX CH4_STREX N2O_RUNEX N2O_IDLEX N2O_STREXSAN FRANCISCO BAY AREA 2020 LDA Aggregated Aggregated GAS 18 10 276 0 58.76293 0.003284 0 0.066074 0.005456 0 0.029212SAN FRANCISCO BAY AREA 2020 MDV Aggregated Aggregated GAS 18 28 426 0 92.90541 0.006144 0 0.105028 0.009739 0 0.041414
Sum: 49,745 587.6293 0.59113 0.660738 0.982115 0.29212 214,651 2601.352 3.096353 2.94078 4.908311 1.159589 264,395 3188.981 3.687483 3.601518 5.890426 1.451709
Sum(GWP): 267,584 153.069 2276.062 270,013 grams/event 595 lbs/event 0.27 MT/event 28 MT/110 events