fastqc manual
TRANSCRIPT

FastQC
1. Introduction
1.1 What is FastQC
Modern high throughput sequencers can generate tens of millions of sequences in a single run. Before analysing this sequence to draw biological conclusions you should always perform some simple quality control checks to ensure that the raw data looks good and there are no problems or biases in your data which may affect how you can usefully use it.
Most sequencers will generate a QC report as part of their analysis pipeline, but this is usually only focused on identifying problems which were generated by the sequencer itself. FastQC aims to provide a QC report which can spot problems which originate either in the sequencer or in the starting library material.
FastQC can be run in one of two modes. It can either run as a stand alone interactive application for the immediate analysis of small numbers of FastQ files, or it can be run in a non-interactive mode where it would be suitable for integrating into a larger analysis pipeline for the systematic processing of large numbers of files.

2. Basic Operations
2.1 Opening a Sequence file
To open one or more Sequence files interactively simply run the program and select File > Open. You can then select the files you want to analyse.
Newly opened files will immediately appear in the set of tabs at the top of the screen. Because of the size of these files it can take a couple of minutes to open them. FastQC operates a queueing system where only one file is opened at a time, and new files will wait until existing files have been processed.
FastQC supports files in the following formats
FastQ (all quality encoding variants) Casava FastQ files* Colorspace FastQ GZip compressed FastQ SAM BAM SAM/BAM Mapped only (normally used for colorspace data)
* Casava fastq format is the same as regular fastq except that the data is usually split across multiple files for a single sample. In this mode the program will merge the files in a sample group and present a single report for each sample. Also Casava fastq files contain poor quality sequences which have been flagged to be remove. In Casava mode the program will exclude these flagged sequences from the report.
By default FastQC will try to guess the file format from the name of the input file. Anything ending in .sam or .bam will be opened as a SAM/BAM file (using all sequences, mapped and unmapped) , and everything else will be treated as FastQ format. If you want to override this detection and specify the file format manually then you can use the drop down file filter in the file chooser to select the type of file you're going to load. You need to use the drop down selector to make the program use the Mapped BAM or Casava file modes as these won't be selected automatically.

2.2 Evaluating Results
The analysis in FastQC is performed by a series of analysis modules. The left hand side of the main interactive display or the top of the HTML report show a summary of the modules which were run, and a quick evaluation of whether the results of the module seem entirely normal (green tick), slightly abnormal (orange triangle) or very unusual (red cross).
It is important to stress that although the analysis results appear to give a pass/fail result, these evaluations must be taken in the context of what you expect from your library. A 'normal' sample as far as FastQC is concerned is random and diverse. Some experiments may be expected to produce libraries which are biased in particular ways. You should treat the summary evaluations therefore as pointers to where you should concentrate your attention and understand why your library may not look random and diverse.
Specific guidance on how to interpret the output of each module can be found in the modules section of the help.
2.3 Saving a Report
In addition to providing an interactive report FastQC also has the option to create an HTML version of this report for a more permanent record. This HTML report can also be generated directly by running FastQC in non-interactive mode.
To create a report simply select File > Save Report from the main menu. By default a report will be created using the name of the fastq file with _fastqc.zip appended to the end. The report will be created for whichever file tab was active when the menu option was selected.
The report file which is created is actually a zip file. When uncompressed this will create a folder with the same name as the report file. Inside this will be a series of files, but the one to look at is the fastqc_report.html file which links to the other files in the report.

3. Analysis Modules
3.1 Basic Statistics
Summary
The Basic Statistics module generates some simple composition statistics for the file analysed.
Filename: The original filename of the file which was analysed File type: Says whether the file appeared to contain actual base calls or colorspace
data which had to be converted to base calls Encoding: Says which ASCII encoding of quality values was found in this file. Total Sequences: A count of the total number of sequences processed. There are
two values reported, actual and estimated. At the moment these will always be the same. In the future it may be possible to analyse just a subset of sequences and estimate the total number, to speed up the analysis, but since we have found that problematic sequences are not evenly distributed through a file we have disabled this for now.
Filtered Sequences: If running in Casava mode sequences flagged to be filtered will be removed from all analyses. The number of such sequences removed will be reported here. The total sequences count above will not include these filtered sequences and will the number of sequences actually used for the rest of the analysis.
Sequence Length: Provides the length of the shortest and longest sequence in the set. If all sequences are the same length only one value is reported.
%GC: The overall %GC of all bases in all sequences
Warning
Basic Statistics never raises a warning.
Failure
Basic Statistics never raises an error.

3.2 Per Base Sequence Quality
Summary
This view shows an overview of the range of quality values across all bases at each position in the FastQ file.
For each position a BoxWhisker type plot is drawn. The elements of the plot are as follows:
The central red line is the median value The yellow box represents the inter-quartile range (25-75%) The upper and lower whiskers represent the 10% and 90% points The blue line represents the mean quality
The y-axis on the graph shows the quality scores. The higher the score the better the base call. The background of the graph divides the y axis into very good quality calls (green), calls of reasonable quality (orange), and calls of poor quality (red). The quality of calls on most platforms will degrade as the run progresses, so it is common to see base calls falling into the orange area towards the end of a read.

It should be mentioned that there are number of different ways to encode a quality score in a FastQ file. FastQC attempts to automatically determine which encoding method was used, but in some very limited datasets it is possible that it will guess this incorrectly (ironically only when your data is universally very good!). The title of the graph will describe the encoding FastQC thinks your file used.
Warning
A warning will be issued if the lower quartile for any base is less than 10, or if the median for any base is less than 25.
Failure
This module will raise a failure if the lower quartile for any base is less than 5 or if the median for any base is less than 20.
3.3 Per Sequence Quality Scores
Summary
The per sequence quality score report allows you to see if a subset of your sequences have universally low quality values. It is often the case that a subset of sequences will have universally poor quality, often because they are poorly imaged (on the edge of the field of view etc), however these should represent only a small percentage of the total sequences.
If a significant proportion of the sequences in a run have overall low quality then this could indicate some kind of systematic problem - possibly with just part of the run (for example one end of a flowcell).
Warning
A warning is raised if the most frequently observed mean quality is below 27 - this equates to a 0.2% error rate.
Failure
An error is raised if the most frequently observed mean quality is below 20 - this equates to a 1% error rate.
3.4 Per Base Sequence Content
Summary
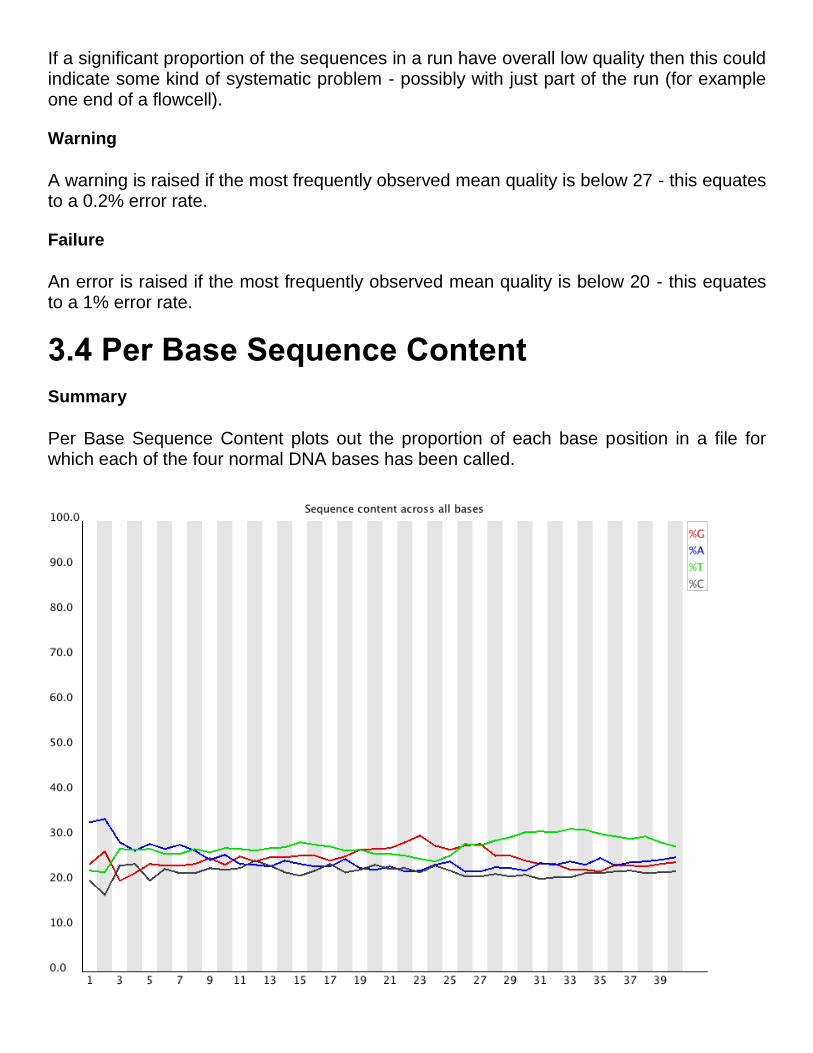
Per Base Sequence Content plots out the proportion of each base position in a file for which each of the four normal DNA bases has been called.

In a random library you would expect that there would be little to no difference between the different bases of a sequence run, so the lines in this plot should run parallel with each other. The relative amount of each base should reflect the overall amount of these bases in your genome, but in any case they should not be hugely imbalanced from each other.
If you see strong biases which change in different bases then this usually indicates an overrepresented sequence which is contaminating your library. A bias which is consistent across all bases either indicates that the original library was sequence biased, or that there was a systematic problem during the sequencing of the library.
Warning
This module issues a warning if the difference between A and T, or G and C is greater than 10% in any position.
Failure
This module will fail if the difference between A and T, or G and C is greater than 20% in any position.
3.5 Per Base GC Content
Summary
Per Base GC Content plots out the GC content of each base position in a file.

In a random library you would expect that there would be little to no difference between the different bases of a sequence run, so the line in this plot should run horizontally across the graph. The overall GC content should reflect the GC content of the underlying genome.
If you see a GC bias which changes in different bases then this could indicate an overrepresented sequence which is contaminating your library. A bias which is consistent across all bases either indicates that the original library was sequence biased, or that there was a systematic problem during the sequencing of the library.
Warning
This module issues a warning it the GC content of any base strays more than 5% from the mean GC content.
Failure
This module will fail if the GC content of any base strays more than 10% from the mean GC content.
3.6 Per Sequence GC Content
Summary
This module measures the GC content across the whole length of each sequence in a file and compares it to a modelled normal distribution of GC content.

In a normal random library you would expect to see a roughly normal distribution of GC content where the central peak corresponds to the overall GC content of the underlying genome. Since we don't know the the GC content of the genome the modal GC content is calculated from the observed data and used to build a reference distribution.
An unusually shaped distribution could indicate a contaminated library or some other kinds of biased subset. A normal distribution which is shifted indicates some systematic bias which is independent of base position. If there is a systematic bias which creates a shifted normal distribution then this won't be flagged as an error by the module since it doesn't know what your genome's GC content should be.
Warning
A warning is raised if the sum of the deviations from the normal distribution represents more than 15% of the reads.
Failure
This module will indicate a failure if the sum of the deviations from the normal distribution represents more than 30% of the reads.
3.7 Per Base N Content

Summary
If a sequencer is unable to make a base call with sufficient confidence then it will normally substitute an N rather than a conventional base] call
This module plots out the percentage of base calls at each position for which an N was called.
It's not unusual to see a very low proportion of Ns appearing in a sequence, especially nearer the end of a sequence. However, if this proportion rises above a few percent it suggests that the analysis pipeline was unable to interpret the data well enough to make valid base calls.
Warning
This module raises a warning if any position shows an N content of >5%.
Failure
This module will raise an error if any position shows an N content of >20%.
3.8 Sequence Length Distribution

Summary
Some high throughput sequencers generate sequence fragments of uniform length, but others can contain reads of wildly varying lengths. Even within uniform length libraries some pipelines will trim sequences to remove poor quality base calls from the end.
This module generates a graph showing the distribution of fragment sizes in the file which was analysed.
In many cases this will produce a simple graph showing a peak only at one size, but for variable length FastQ files this will show the relative amounts of each different size of sequence fragment.
Warning
This module will raise a warning if all sequences are not the same length.
Failure
This module will raise an error if any of the sequences have zero length.

3.9 Duplicate Sequences
Summary
In a diverse library most sequences will occur only once in the final set. A low level of duplication may indicate a very high level of coverage of the target sequence, but a high level of duplication is more likely to indicate some kind of enrichment bias (eg PCR over amplification).
This module counts the degree of duplication for every sequence in the set and creates a plot showing the relative number of sequences with different degrees of duplication.
To cut down on the memory requirements for this module only sequences which occur in the first 200,000 sequences in each file are analysed, but this should be enough to get a good impression for the duplication levels in the whole file. Each sequence is tracked to the end of the file to give a representative count of the overall duplication level. To cut down on the amount of information in the final plot any sequences with more than 10 duplicates are placed into the 10 duplicates category - so it's not unusual to see a small rise in this final category. If you see a big rise in this final category then it means you have a large number of sequences with very high levels of duplication.

Because the duplication detection requires an exact sequence match over the whole length of the sequence any reads over 75bp in length are truncated to 50bp for the purposes of this analysis. Even so, longer reads are more likely to contain sequencing errors which will artificially increase the observed diversity and will tend to underrepresent highly duplicated sequences.
Warning
This module will issue a warning if non-unique sequences make up more than 20% of the total.
Failure
This module will issue a error if non-unique sequences make up more than 50% of the total.
3.10 Overrepresented Sequences
Summary
A normal high-throughput library will contain a diverse set of sequences, with no individual sequence making up a tiny fraction of the whole. Finding that a single sequence is very overrepresented in the set either means that it is highly biologically significant, or indicates that the library is contaminated, or not as diverse as you expected.
This module lists all of the sequence which make up more than 0.1% of the total. To conserve memory only sequences which appear in the first 200,000 sequences are tracked to the end of the file. It is therefore possible that a sequence which is overrepresented but doesn't appear at the start of the file for some reason could be missed by this module.
For each overrepresented sequence the program will look for matches in a database of common contaminants and will report the best hit it finds. Hits must be at least 20bp in length and have no more than 1 mismatch. Finding a hit doesn't necessarily mean that this is the source of the contamination, but may point you in the right direction. It's also worth pointing out that many adapter sequences are very similar to each other so you may get a hit reported which isn't technically correct, but which has very similar sequence to the actual match.
Because the duplication detection requires an exact sequence match over the whole length of the sequence any reads over 75bp in length are truncated to 50bp for the purposes of this analysis. Even so, longer reads are more likely to contain sequencing errors which will artificially increase the observed diversity and will tend to underrepresent highly duplicated sequences.

Warning
This module will issue a warning if any sequence is found to represent more than 0.1% of the total.
Failure
This module will issue an error if any sequence is found to represent more than 1% of the total.
3.11 Overrepresented Kmers
Summary
The analysis of overrepresented sequences will spot an increase in any exactly duplicated sequences, but there are a different subset of problems where it will not work.
If you have very long sequences with poor sequence quality then random sequencing errors will dramatically reduce the counts for exactly duplicated sequences.
If you have a partial sequence which is appearing at a variety of places within your sequence then this won't be seen either by the per base content plot or the duplicate sequence analysis.
This module counts the enrichment of every 5-mer within the sequence library. It calculates an expected level at which this k-mer should have been seen based on the base content of the library as a whole and then uses the actual count to calculate an observed/expected ratio for that k-mer. In addition to reporting a list of hits it will draw a graph for the top 6 hits to show the pattern of enrichment of that Kmer across the length of your reads. This will show if you have a general enrichment, or if there is a pattern of bias at different points over your read length.

Any k-mer showing more than a 3 fold overall enrichment or a 5 fold enrichment at any given base position will be reported by this module.
To allow this module to run in a reasonable time only 20% of the whole library is analysed and the results are extrapolated to the rest of the library.
Warning
This module will issue a warning if any k-mer is enriched more than 3 fold overall, or more than 5 fold at any individual position.
Failure
This module will issue a error if any k-mer is enriched more than 10 fold at any individual base position.