fatigue tes
TRANSCRIPT

8/14/2019 Fatigue Tes
http://slidepdf.com/reader/full/fatigue-tes 1/3
Fatigue Test
Reading Assignment: 8.7-8.11in Callister Objectives
• Recognize fatigue as a major cause of failure in mechanical components subjectto cyclic loading.
• Define common terms related to fatigue testing.• Describe the general procedure and equipment used in conducting fatigue testing.• Recognize the stress-life data presentation in the S-N curve and be able to define
fatigue limit, fatigue strength, and fatigue life.• Recognize the major characteristics of fatigue fracture surface.
IntroductionSo far we have examined materials behavior under slowly rising load (the tensile test)and under impact loading (the impact test). We learned from the first test that a smooth
specimen fails by overloading if the statistically applied stress exceeds the tensilestrength of the material. However, failure can still occur at a stress level less than theyield strength ( σ y) if the applied stress is fluctuating with time. Failure caused by cyclicloading is termed fatigue and the number of total loading cycles applied until fracture iscalled the fatigue-life. The majority of engineering components experience some sort of load fluctuations and it has been estimated that fatigue is responsible for more than 70%of all engineering materials failures. Therefore, engineers should be aware of this type of failure and know how to design against it.
Where Fatigue is important?Fatigue failure consists of two stages: crack initiating and crack propagation until totalfracture. For machine components containing no pre-existing cracks, the majority of fatigue life is spent in initiating or starting fatigue cracks and the fatigue process isdescribed as initiation-controlled. Examples of these include crank shafts, gear teeth, androtating shafts or axles. On the other hand, large structures or welded parts almost alwayscontain pre-existing cracks such as in bridges, ships,aircraft fuselage, and pressure vessels. In suchstructures, the majority of fatigue life is spent ingrowing a pre-existing crack to a critical size andthen to final fracture. The fatigue process in thiscase is described propagation-controlled. In thislaboratory session we will be concerned only withfatigue testing of un-cracked specimens where mostof fatigue life is spent in the initiation stage.
Figure 5.1: a shaft containing akeyhole failed due to fatigue
Engineering structures and components oftencontain stress concentrations such as notches.Fatigue cracks almost always start at regions of high stress concentrations. For example, Figure 5.1shows a fatigue crack starting from a keyhole in arotating shaft. Fracture surfaces of components failedby fatigue are usually flat and perpendicular to the applied stress and often show features
called beachmark ridges as shown in Figure 5.1. These marks are positive indication forfatigue failure and they represent the crack fronts during loading. Furthermore, fatigue

8/14/2019 Fatigue Tes
http://slidepdf.com/reader/full/fatigue-tes 2/3
failure is brittle in nature and does not involve gross plastic deformation even in metalsthat behave in a ductile manner under static loading. Hence, fatigue failure occurssuddenly and can cause catastrophic consequences.
Test Description
You can perform a simple fatigue test withyour hands. Take a thin wire and bend itback and forth many times, the wire willbreak after a number of cycles dependingon the stress level. Increasing the appliedload will reduce the number of cyclesrequired to break the wire and you can testthis by increasing the displacement of yourhands during bending. However, for goodtesting we need more accurate control of the cyclic load and this can be done by arotating bending machine, shown in Figure5.2. In this machine, a cylindrical smooth specimen is mounted and loaded from bothends using rotating chucks (see figure 5.3). A weight is suspended from one side of thespecimen to vary the bending stressesexperienced by the specimen surface.Initially, the specimen will experiencetensile stresses at its top surface andcompressive stresses at its bottom. As thespecimen rotates 180 degrees, the stresseswill be reversed and the top will be undercompressive stresses while the bottom willbe under tensile stresses. When thespecimen completes one full rotation, thespecimen surfaces would haveexperienced one full loading cycle. Themaximum bending stress acting on thespecimen surface is given by
Figure 5.2: Fatigue rotatingbending machine
Figure 5.3: Mounted fatiguespecimen
σ = 32 M/ π d 3
where, σ = the maximum bending stress
M = the bending moment at the specimen cross-section (weight*distance)d = specimen diameter
The same test is repeated for many specimens each conducted at different stress level andthe number of cycles it would take to fail is recorded. The S-N curve is a plot of theapplied stresses versus the logarithm of the number of cycles to failure (N) for eachspecimen. The ASTM standards E466 and E468 are to be consulted for further details of the test.
8/14/2019 Fatigue Tes
http://slidepdf.com/reader/full/fatigue-tes 3/3
The S-N Curve
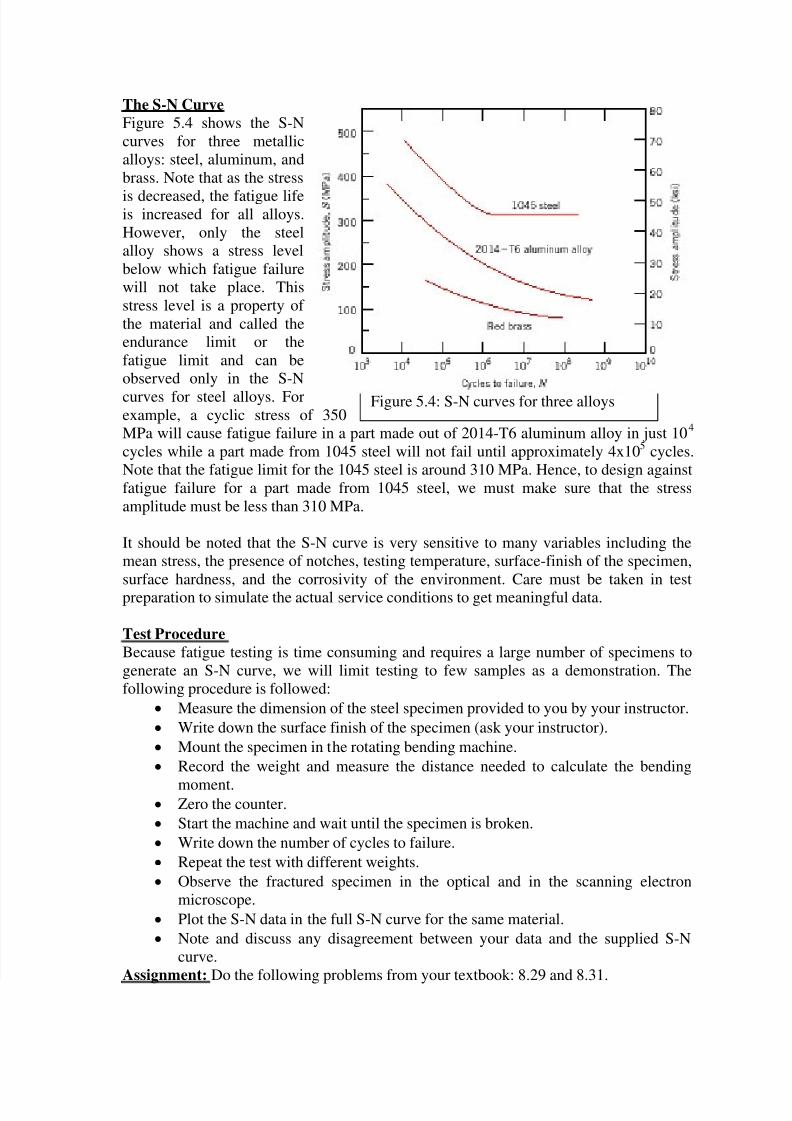
Figure 5.4: S-N curves for three alloys
Figure 5.4 shows the S-Ncurves for three metallicalloys: steel, aluminum, andbrass. Note that as the stress
is decreased, the fatigue lifeis increased for all alloys.However, only the steelalloy shows a stress levelbelow which fatigue failurewill not take place. Thisstress level is a property of the material and called theendurance limit or thefatigue limit and can beobserved only in the S-Ncurves for steel alloys. Forexample, a cyclic stress of 350MPa will cause fatigue failure in a part made out of 2014-T6 aluminum alloy in just 10 4 cycles while a part made from 1045 steel will not fail until approximately 4x10 5 cycles.Note that the fatigue limit for the 1045 steel is around 310 MPa. Hence, to design againstfatigue failure for a part made from 1045 steel, we must make sure that the stressamplitude must be less than 310 MPa.
It should be noted that the S-N curve is very sensitive to many variables including themean stress, the presence of notches, testing temperature, surface-finish of the specimen,surface hardness, and the corrosivity of the environment. Care must be taken in testpreparation to simulate the actual service conditions to get meaningful data.
Test ProcedureBecause fatigue testing is time consuming and requires a large number of specimens togenerate an S-N curve, we will limit testing to few samples as a demonstration. Thefollowing procedure is followed:
• Measure the dimension of the steel specimen provided to you by your instructor.• Write down the surface finish of the specimen (ask your instructor).• Mount the specimen in the rotating bending machine.• Record the weight and measure the distance needed to calculate the bending
moment.• Zero the counter.• Start the machine and wait until the specimen is broken.• Write down the number of cycles to failure.• Repeat the test with different weights.• Observe the fractured specimen in the optical and in the scanning electron
microscope.• Plot the S-N data in the full S-N curve for the same material.• Note and discuss any disagreement between your data and the supplied S-N
curve.
Assignment: Do the following problems from your textbook: 8.29 and 8.31.