fault detection and diagnosis of control …ibpsa\bs05_0609_616.… · introduction fault detection...
TRANSCRIPT

FAULT DETECTION AND DIAGNOSIS OF CONTROL STRATEGIES FOR AIR-HANDLING UNITS
Thoi H. Le1,2,3, Ph.D. Gottfried Knabe2, Ph.D., D.Sc. Gregor P. Henze3, Ph.D., P.E.
1Fraunhofer Institute for Solar Energy Systems, Freiburg, Germany
2Building Systems Engineering at the Technical University of Dresden, Germany 3Architectural Engineering at the University of Nebraska – Lincoln, USA
ABSTRACT
This paper introduces a novel approach to fault de-tection and diagnosis (FDD) of building control strategies for air-handling systems using a mathe-matical model that links linear algebra analysis and psychrometric analysis. The analysis of the psy-chrometric processes associated with each HVAC system component, which are obtainable from simu-lation using the program TRNSYS, leads to an as-sessment of the thermodynamic efficiency of the air-handling unit process governed by the control se-quence under investigation. The proposed method allows for the elimination of potential faults of the control strategies in the design phase as well as for the evaluation of control strategies in existing build-ings in order to make system operation more energy efficient, more economical, and more reliable.
INTRODUCTION Fault detection and diagnosis (FDD) is concerned with automating the processes of detecting faults in physical systems and diagnosing their causes. For several decades, FDD has been an active area of research and development in the aerospace, process control, automotive, manufacturing, nuclear, and national defense fields and continues to be so today. Unlike research on FDD in these mentioned areas, FDD research for HVAC systems did not begin until the late 1980s and early 1990s (Braun 1999). While FDD is well established in other industries (e.g. in the automotive industry, automated FDD has been incorporated in products for more than a decade), it is still in its infancy with respect to HVAC systems. Much of the research and development in HVAC systems is still performed at universities and in na-tional laboratories (Katipamula and Brambley 2004).
Poorly maintained, degraded, and improperly con-trolled equipment wastes an estimated 15% to 30% of energy used in commercial buildings. Much of this waste could be prevented by using automated FDD procedures. The first objective of an FDD system is the early detection of faults and the subsequent diag-nosis of their causes, if there are any, and than ena-bling corrective measures to address these faults
before additional damage to the system or loss of service occurs.
In the 1990s, several FDD applications for building systems were developed and tested in laboratories. As an example of these applications, the Annex 25 collaborative research project on real-time simulation of HVAC systems for building optimization, fault detection, and diagnostics (Hyvärinen and Kärki 1996; Madjidi 1996), was initiated by the Interna-tional Energy Agency (IEA) in the early 1990s. The Annex 25 study identified common faults for various types of HVAC systems, and a wide variety of detec-tion and diagnosis methods were investigated. This study also showed that operational faults range from mere energy inefficiencies, to temporary interrup-tions of HVAC components such as pumps or damp-ers, all the way to a complete breakdown of HVAC systems. Such errors can occur during engineering design, installation, and operation.
IEA Annex 34 (Dexter and Pakanen 2001) further developed FDD methods of Annex 25 that are primarily concerned with recommissiong existing buildings. The study indicates that 20-30% energy savings in commercial buildings can be attained by re-commissioning HVAC systems in order to correct faulty operation. Current strategies do not explicitly optimize performance and cannot respond to performance deteriorating faults.
IEA Annex 40 (Visier 2004) continued to verify and optimize the performance of building energy sys-tems. The objective of this annex was to develop, validate and document tools for commissioning buildings and building services that would help facilitate the achievement of this goal. These tools include guidelines on commissioning procedures and recommendations for improving commissioning processes, as well as prototype software that could be implemented in stand-alone tools and/or embedded in building energy management systems (BEMS).
In general, these applications of FDD used measured temperature and/or pressure at various locations in a system and thermodynamic relationships to detect and diagnose common faults. This is accomplished by continuously monitoring the operation of a sys-tem, using FDD to detect and diagnose abnormal
Ninth International IBPSA Conference Montréal, Canada
August 15-18, 2005
- 609 -

conditions and the faults associated with them, then evaluating the significance of the detected faults, and deciding how to respond. A typical operation and maintenance process using automated FDD can be divided into four distinct functional processes (Iser-mann 1984): The first step is to monitor the physical system or device and detect any abnormal conditions. When an abnormal condition is detected, fault diag-nosis is used to evaluate the fault and determine its causes (2nd step). These two steps constitute the FDD process. Following diagnosis (3rd step), fault evalua-tion assesses the extent and significance of the im-pact on system performance (in terms of energy use, cost, system reliability, or effects on other perform-ance indices). Based on the fault evaluation, a deci-sion is then made on how to respond to the faults (4th step).
Furthermore, Isermann (1994) introduced the two main methods for FDD. The first one, monitoring of the system operation, has already been mentioned above. This monitoring method allows for the obser-vation of every single component of the entire sys-tem, but does not give any information about the interaction between these components. The second one uses a mathematical model and allows a deeper diagnosis of the whole process and the interactions between every component of the investigated system, respectively.
Until now, the common method used for fault detec-tion and diagnosis (FDD) in building control systems involves margin testing of the measured signals, in which the measured signals are compared with the predefined upper and lower bounds (thresholds). In order to avoid serious damage to the HVAC systems, one reduces the threshold, so there is enough time to adopt countermeasures. On the other hand, this can lead to more frequent alarms and malfunction re-ports. Process monitoring observes the functionality of every single component of the entire HVAC sys-tem, and therefore, the operation is assured. How-ever, the faults of the control strategies remain un-known and cannot be detected.
A new mathematical model introduced in this paper is based on linear algebra analysis (vector orienta-tion) for FDD of control systems for air-handling units (AHU). The novel approach allows for an analysis of the psychrometric processes associated with each AHU component based on benchmark calculations provided by the building simulation program TRNSYS, and facilitates a quantitative assessment of the thermodynamic efficiency of the HVAC process in the AHU as governed by the in-vestigated control strategy.
FDD OF AHU CONTROL STRATEGIES This section describes the FDD of building control strategies applied to air-handling units employing a
coupled TRNSYS simulation of the building (Type 56) and HVAC system (Type 94 (Rathey 2000)). In addition, Type 93 (Rathey 2000) implements the control sequences for each HVAC component under control in the AHU. Fig. 1 depicts an overview how the FDD of AHU control strategies is implemented in the program TRNSYS and it shows the results of Types 56, 93, and 94 as input variables for the newly developed FDD module.
Error ?
FDD for Control Strategy
Report
yesno
Building Simulation(Type 56)
Plant Simulation(Type 94)
Control(Type 93)
Figure 1: Flow Diagram for FDD with TRNSYS
The concept of FDD is divided into two fundamental steps, where the first step tests for the compliance with the desired setpoints. If the difference between actual values and setpoints exceeds the selected threshold (upper and lower bound), an alarm with time stamp is sent to a log file for fault diagnosis. The current article does not consider optimal setpoint selection in which HVAC process setpoints such as supply air temperature are defined based on a mathematical model (Felsmann 2002). According to Bachmann and Schumacher 1997, Glück 1998, Rathey 2000, and Sokollik et al. 2001, HVAC set-points greatly influence operating costs.
The second step deals with the analysis of the psy-chrometric processes governed by the investigated AHU control strategy from outside air to supply air (conditioned air). Commonly, there are at most two controlled variables in air-handling units: tempera-ture and humidity, each of which is controlled by a separate control loop. Typically, there is only one controlled device modulating in a non-extreme posi-tion, i.e., not at minimum or maximum position. Thus, no more than two controlled devices (actuators
- 610 -
for valves and dampers) are modulating at the same time, while all other controlled devices are at the fully open or closed position (Bachmann and Schumacher 1997, Feder 1992, Rathey 2000, Sokol-lik et al. 2001). However, optimal control approaches may call for the concurrent modulation of more than two controlled devices (Felsmann 2002 and Glück 1998). For this reason, at the beginning of the analy-sis, the proposed FDD system provides an option, in which one can select whether the current control strategy allows for more than two AHU components to be controlled simultaneously.
In the following sections, the FDD concepts for conventional air-handling units and those with desic-cant evaporative cooling (DEC) technology are sepa-rately introduced.
Conventional HVAC Systems
Based on the selected supply air temperature and humidity setpoints, the Mollier h,x-diagram is di-vided into three areas (Fig. 2). For every field of this diagram, a mathematical model has been developed for the analysis of the psychrometric processes re-sulting from the investigated control strategy.
Area I: (hOA < hSA & wOA ≤ wSA)
Every psychrometric process of a AHU component is represented by a vector in the Mollier h,x-diagram. The process vector begins at the condition of the inlet air into the component and ends at the condition of the outlet air of the same component. Subse-quently, one projects all the process vectors ( 1, 12, , )O NS… onto the unit enthalpy vector h of the coordination system h,x of the Mollier diagram as shown in Fig. 3. The unit enthalpy vector h points into the direction of increasing enthalpies, i.e., it is normal to any isenthalpic line in the diagram.
Figure 2: Areas for FDD of Conventional Systems
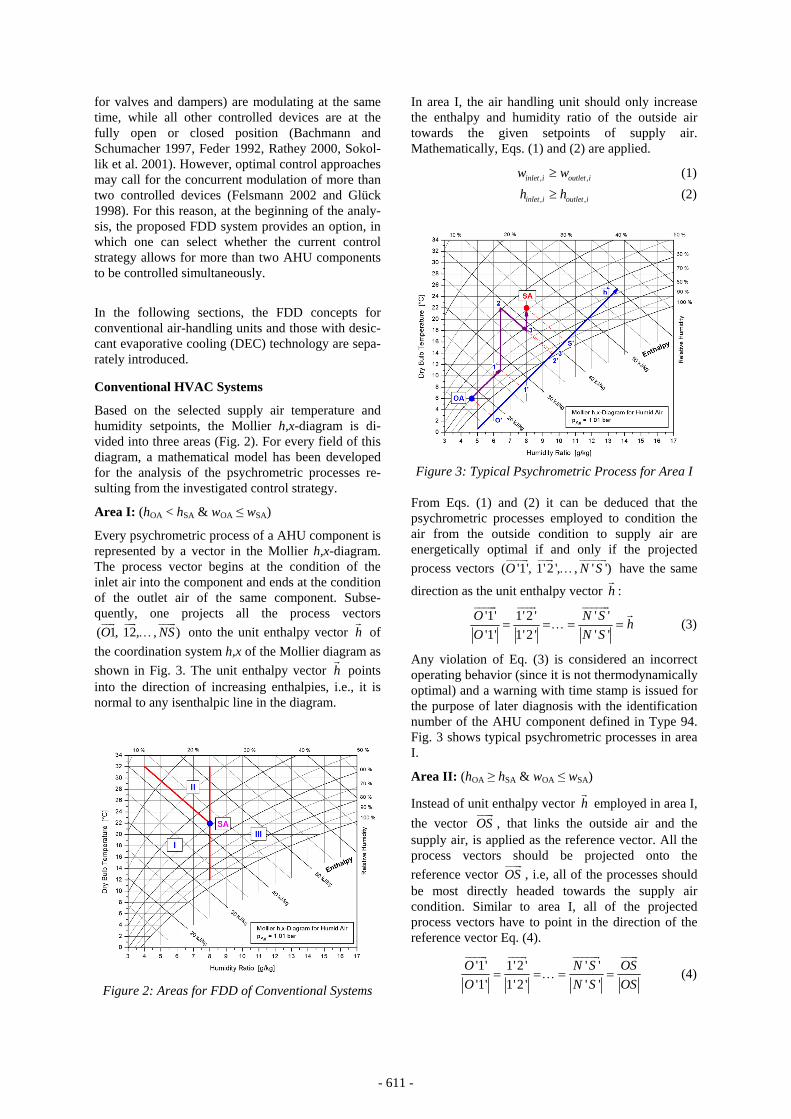
In area I, the air handling unit should only increase the enthalpy and humidity ratio of the outside air towards the given setpoints of supply air. Mathematically, Eqs. (1) and (2) are applied.
, ,inlet i outlet iw w≥ (1) , ,inlet i outlet ih h≥ (2)
Figure 3: Typical Psychrometric Process for Area I
From Eqs. (1) and (2) it can be deduced that the psychrometric processes employed to condition the air from the outside condition to supply air are energetically optimal if and only if the projected process vectors ( '1', 1'2 ', , ' ')O N S… have the same
direction as the unit enthalpy vector h :
'1' 1'2 ' ' ' '1' 1'2 ' ' '
O N S hO N S
= =…= = (3)
Any violation of Eq. (3) is considered an incorrect operating behavior (since it is not thermodynamically optimal) and a warning with time stamp is issued for the purpose of later diagnosis with the identification number of the AHU component defined in Type 94. Fig. 3 shows typical psychrometric processes in area I.
Area II: (hOA ≥ hSA & wOA ≤ wSA)
Instead of unit enthalpy vector h employed in area I, the vector OS , that links the outside air and the supply air, is applied as the reference vector. All the process vectors should be projected onto the reference vector OS , i.e, all of the processes should be most directly headed towards the supply air condition. Similar to area I, all of the projected process vectors have to point in the direction of the reference vector Eq. (4).
'1' 1'2 ' ' ' '1' 1'2 ' ' '
O N S OSO N S OS
= =…= = (4)
- 611 -
Area III: (hOA ≥ hSA & wOA > wSA)
In area III, unit enthalpy vector h is used again and the outside air is always dehumidified and possibly cooled. However, because the outside air is always cooled by the cooling coil in order to be dehumidified, and subsequently the air is reheated to the supply air temperature setpoint, the projected process vectors cannot all have the same direction as was the case in area I. However, there is allowed only one reversal of the direction of these projected process vectors. Eqs. (5) and (6) apply to area III.
'1' 1'2 ' '( 1) ' -'1' 1'2 ' '( 1) '
O I I hO I I
+= =…= =
+ (5)
'( 1) ' ( 1) '( 2) ' ' '...'( 1) ' ( 1) '( 2) ' ' '
I I I I N S hI I I I N S
+ + += = = =
+ + + (6)
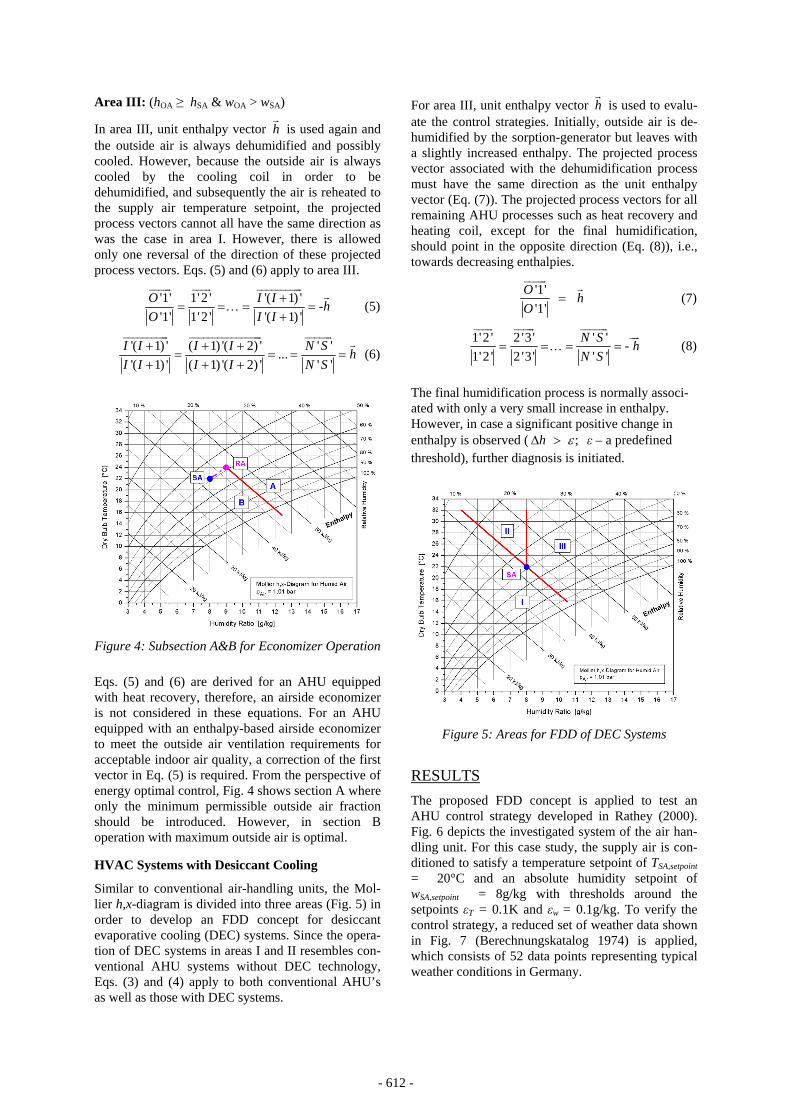
Figure 4: Subsection A&B for Economizer Operation
Eqs. (5) and (6) are derived for an AHU equipped with heat recovery, therefore, an airside economizer is not considered in these equations. For an AHU equipped with an enthalpy-based airside economizer to meet the outside air ventilation requirements for acceptable indoor air quality, a correction of the first vector in Eq. (5) is required. From the perspective of energy optimal control, Fig. 4 shows section A where only the minimum permissible outside air fraction should be introduced. However, in section B operation with maximum outside air is optimal.
HVAC Systems with Desiccant Cooling
Similar to conventional air-handling units, the Mol-lier h,x-diagram is divided into three areas (Fig. 5) in order to develop an FDD concept for desiccant evaporative cooling (DEC) systems. Since the opera-tion of DEC systems in areas I and II resembles con-ventional AHU systems without DEC technology, Eqs. (3) and (4) apply to both conventional AHU’s as well as those with DEC systems.
For area III, unit enthalpy vector h is used to evalu-ate the control strategies. Initially, outside air is de-humidified by the sorption-generator but leaves with a slightly increased enthalpy. The projected process vector associated with the dehumidification process must have the same direction as the unit enthalpy vector (Eq. (7)). The projected process vectors for all remaining AHU processes such as heat recovery and heating coil, except for the final humidification, should point in the opposite direction (Eq. (8)), i.e., towards decreasing enthalpies.
'1' '1'
O hO
= (7)
1'2 ' 2 '3' ' ' - 1'2 ' 2 '3' ' '
N S hN S
= =…= = (8)
The final humidification process is normally associ-ated with only a very small increase in enthalpy. However, in case a significant positive change in enthalpy is observed ( ; h εΔ > ε – a predefined threshold), further diagnosis is initiated.
Figure 5: Areas for FDD of DEC Systems
RESULTS The proposed FDD concept is applied to test an AHU control strategy developed in Rathey (2000). Fig. 6 depicts the investigated system of the air han-dling unit. For this case study, the supply air is con-ditioned to satisfy a temperature setpoint of TSA,setpoint = 20°C and an absolute humidity setpoint of wSA,setpoint = 8g/kg with thresholds around the setpoints εT = 0.1K and εw = 0.1g/kg. To verify the control strategy, a reduced set of weather data shown in Fig. 7 (Berechnungskatalog 1974) is applied, which consists of 52 data points representing typical weather conditions in Germany.
- 612 -

Figure 6: Schematic Diagram of used HVAC System
Figure 7: Reduced Set of Weather Data
The frost protection (FP) in Fig. 6, after the inlet of the outside air, maintains the outside air intake at the outlet of the FP at -10°C in order to prevent damage from occurring in the heat recovery (HR) during the winter period. Figs. 8 and 9 illustrate the AHU con-trol sequences for temperature and humidity. While the humidifier (HUM) can theoretically be used to facilitate direct evaporative cooling, this option is not taken advantage of in this analysis because the HUM increases the humidity ratio. As reported in Forum-diskussion (1998), room air that is slightly warmer and dryer is perceived as more comfortable in com-parison with room air that is slightly cooler and more humid because people tend to be more sensitive with respect to high levels of humidity.
Fig. 10 illustrates an AHU in which the outside air is in area III (Fig. 2) first heated by the heat recovery (HR), then cooled by the cooling coil and thereafter reheated to the desired supply air condition. Accord-ing to Eqs. (5) and (6), only one reversal of the pro-jected process vectors is allowed, yet two reversals are detected for this control strategy. Therefore, this is clearly an incorrect and wasteful psychrometric
process for outdoor air at a dry-bulb temperature (ODB) that is below the supply air setpoint tempera-ture and an outdoor air humidity ratio (OHR) that is greater than the supply air setpoint humidity.
Figure 8: AHU Temperature Control Sequence
Figure 9: AHU Humidity Control Sequence
Figure10: Example of Incorrect Operating Process
According to the temperature control sequence (Fig. 8), heat recovery HR is activated to heat up the air, because the ODB is less than the supply air tempera-ture (TSA = 20°C). At the same time, the OHR is greater than the setpoint (8g/kg), therefore, the cool-ing coil (CC) in the humidity control sequence (Fig. 9) operates to cool down and dehumidify the outdoor air. Unfortunately, the HR is arranged in front of the CC, such that the sensible heating process caused by the HR takes place before the air is dehumidified by the CC. Subsequently, the reheat coil (RH) warms the dehumidified but overcooled air to the desired
- 613 -
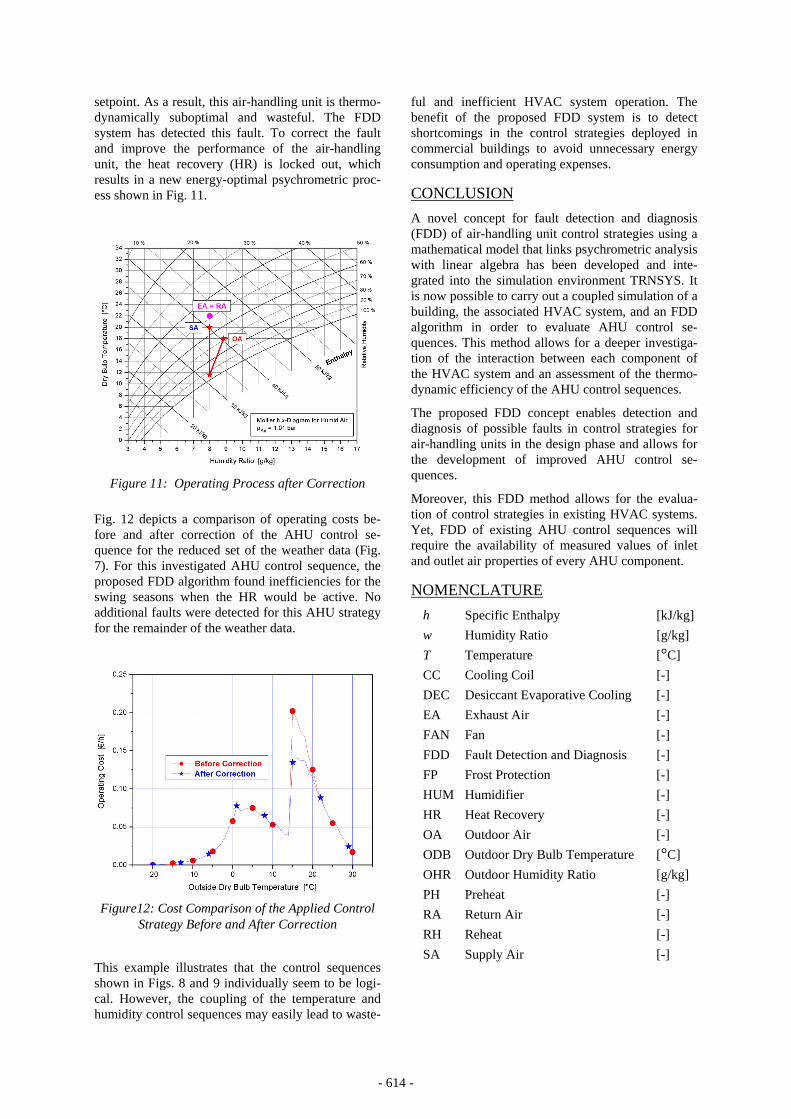
setpoint. As a result, this air-handling unit is thermo-dynamically suboptimal and wasteful. The FDD system has detected this fault. To correct the fault and improve the performance of the air-handling unit, the heat recovery (HR) is locked out, which results in a new energy-optimal psychrometric proc-ess shown in Fig. 11.
Figure 11: Operating Process after Correction
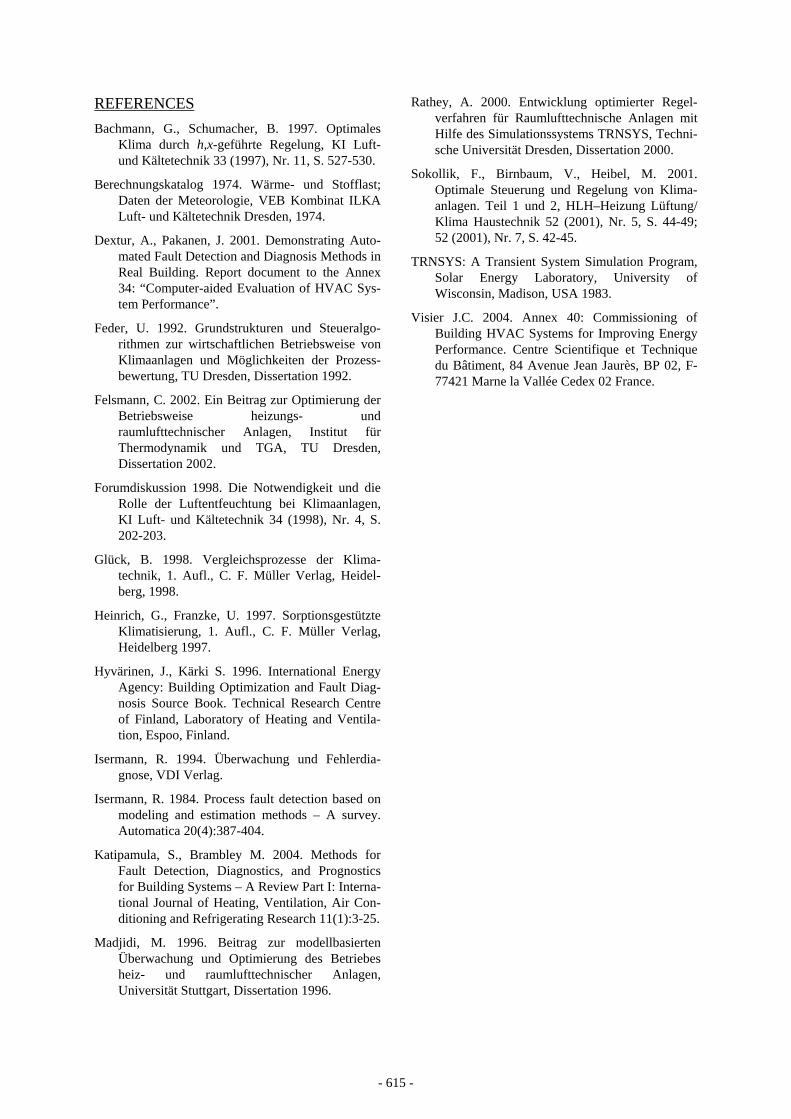
Fig. 12 depicts a comparison of operating costs be-fore and after correction of the AHU control se-quence for the reduced set of the weather data (Fig. 7). For this investigated AHU control sequence, the proposed FDD algorithm found inefficiencies for the swing seasons when the HR would be active. No additional faults were detected for this AHU strategy for the remainder of the weather data.
Figure12: Cost Comparison of the Applied Control
Strategy Before and After Correction
This example illustrates that the control sequences shown in Figs. 8 and 9 individually seem to be logi-cal. However, the coupling of the temperature and humidity control sequences may easily lead to waste-
ful and inefficient HVAC system operation. The benefit of the proposed FDD system is to detect shortcomings in the control strategies deployed in commercial buildings to avoid unnecessary energy consumption and operating expenses.
CONCLUSION A novel concept for fault detection and diagnosis (FDD) of air-handling unit control strategies using a mathematical model that links psychrometric analysis with linear algebra has been developed and inte-grated into the simulation environment TRNSYS. It is now possible to carry out a coupled simulation of a building, the associated HVAC system, and an FDD algorithm in order to evaluate AHU control se-quences. This method allows for a deeper investiga-tion of the interaction between each component of the HVAC system and an assessment of the thermo-dynamic efficiency of the AHU control sequences.
The proposed FDD concept enables detection and diagnosis of possible faults in control strategies for air-handling units in the design phase and allows for the development of improved AHU control se-quences.
Moreover, this FDD method allows for the evalua-tion of control strategies in existing HVAC systems. Yet, FDD of existing AHU control sequences will require the availability of measured values of inlet and outlet air properties of every AHU component.
NOMENCLATURE h Specific Enthalpy [kJ/kg] w Humidity Ratio [g/kg] T Temperature [°C] CC Cooling Coil [-] DEC Desiccant Evaporative Cooling [-] EA Exhaust Air [-] FAN Fan [-] FDD Fault Detection and Diagnosis [-] FP Frost Protection [-] HUM Humidifier [-] HR Heat Recovery [-] OA Outdoor Air [-] ODB Outdoor Dry Bulb Temperature [°C] OHR Outdoor Humidity Ratio [g/kg] PH Preheat [-] RA Return Air [-] RH Reheat [-] SA Supply Air [-]
- 614 -
REFERENCES Bachmann, G., Schumacher, B. 1997. Optimales
Klima durch h,x-geführte Regelung, KI Luft- und Kältetechnik 33 (1997), Nr. 11, S. 527-530.
Berechnungskatalog 1974. Wärme- und Stofflast; Daten der Meteorologie, VEB Kombinat ILKA Luft- und Kältetechnik Dresden, 1974.
Dextur, A., Pakanen, J. 2001. Demonstrating Auto-mated Fault Detection and Diagnosis Methods in Real Building. Report document to the Annex 34: “Computer-aided Evaluation of HVAC Sys-tem Performance”.
Feder, U. 1992. Grundstrukturen und Steueralgo-rithmen zur wirtschaftlichen Betriebsweise von Klimaanlagen und Möglichkeiten der Prozess-bewertung, TU Dresden, Dissertation 1992.
Felsmann, C. 2002. Ein Beitrag zur Optimierung der Betriebsweise heizungs- und raumlufttechnischer Anlagen, Institut für Thermodynamik und TGA, TU Dresden, Dissertation 2002.
Forumdiskussion 1998. Die Notwendigkeit und die Rolle der Luftentfeuchtung bei Klimaanlagen, KI Luft- und Kältetechnik 34 (1998), Nr. 4, S. 202-203.
Glück, B. 1998. Vergleichsprozesse der Klima-technik, 1. Aufl., C. F. Müller Verlag, Heidel-berg, 1998.
Heinrich, G., Franzke, U. 1997. Sorptionsgestützte Klimatisierung, 1. Aufl., C. F. Müller Verlag, Heidelberg 1997.
Hyvärinen, J., Kärki S. 1996. International Energy Agency: Building Optimization and Fault Diag-nosis Source Book. Technical Research Centre of Finland, Laboratory of Heating and Ventila-tion, Espoo, Finland.
Isermann, R. 1994. Überwachung und Fehlerdia-gnose, VDI Verlag.
Isermann, R. 1984. Process fault detection based on modeling and estimation methods – A survey. Automatica 20(4):387-404.
Katipamula, S., Brambley M. 2004. Methods for Fault Detection, Diagnostics, and Prognostics for Building Systems – A Review Part I: Interna-tional Journal of Heating, Ventilation, Air Con-ditioning and Refrigerating Research 11(1):3-25.
Madjidi, M. 1996. Beitrag zur modellbasierten Überwachung und Optimierung des Betriebes heiz- und raumlufttechnischer Anlagen, Universität Stuttgart, Dissertation 1996.
Rathey, A. 2000. Entwicklung optimierter Regel-verfahren für Raumlufttechnische Anlagen mit Hilfe des Simulationssystems TRNSYS, Techni-sche Universität Dresden, Dissertation 2000.
Sokollik, F., Birnbaum, V., Heibel, M. 2001. Optimale Steuerung und Regelung von Klima-anlagen. Teil 1 und 2, HLH–Heizung Lüftung/ Klima Haustechnik 52 (2001), Nr. 5, S. 44-49; 52 (2001), Nr. 7, S. 42-45.
TRNSYS: A Transient System Simulation Program, Solar Energy Laboratory, University of Wisconsin, Madison, USA 1983.
Visier J.C. 2004. Annex 40: Commissioning of Building HVAC Systems for Improving Energy Performance. Centre Scientifique et Technique du Bâtiment, 84 Avenue Jean Jaurès, BP 02, F-77421 Marne la Vallée Cedex 02 France.
- 615 -

- 616 -