feasibility and assessment
TRANSCRIPT

I-Drive Transit Feasibility and
Alternative Technology
Assessment Report
August 2021

Acronyms-i Transit Feasibility and Technology Assessment Report
Acronyms and Abbreviations Abbreviation Meaning
AADT Annual Average Daily Traffic
ACF Axle Correction Factor
ADT Average Daily Traffic
AGT automated guideway transit
AST aboveground storage tank
ASTM American Society for Testing and Materials
AV Autonomous Vehicle
BAT Business Access and Transit
BID Business Improvement District
Blvd Boulevard
BRT Bus Rapid Transit
BUILD Better Utilizing Investments to Leverage Development
CIG Capital Investment Grant
CMAQ Congestion Mitigation and Air Quality Improvement Program
CO Carbon monoxide
CV Connected vehicle
DDR District Dedicated Revenues
Dr Drive
DTTER Design Traffic and Transit Engineering Report
EPA Environmental Protection Agency
ESA Environmental Site Assessment
FAC Florida Administrative Code
FTA Federal Transit Administration
FDOT Florida Department of Transportation
FHWA Federal Highway Administration
FLU Future Land Use
FTA Federal Transit Administration
FY Fiscal year
GPS Global Positioning System
GRP Gross Regional Product

Acronyms-ii Transit Feasibility and Technology Assessment Report
Abbreviation Meaning HCM Highway Capacity Manual
I-Drive International Drive
hr hour
ID identification
JTA Jacksonville Transportation Authority
LOS Level of Service
LPG Liquefied natural gas
mph miles per hour
MPO Metropolitan Planning Organization
NAAQS National Ambient Air Quality Standards
NEPA National Environmental Policy Act
NOFO Notifications of Funding Opportunities
NRCS Natural Resources Conservation Service
NSTP New Starts Transit Program
NSWR New Starts Wheels on the Road
MSA Metropolitan Statistical Area
NB northbound
NSTP New Starts Transit Program
NTD National Transit Database
O&M Operations & Maintenance
OCS Overhead contact system
OCCC Orange County Convention Center
OCEPD Orange County Environmental Protection Division
OCPS Orange County Public Schools
O-D Origin-destination
OIA Orlando International Airport
OUC Orlando Utilities Commission
PAG Project Advisory Group
PCW petroleum contact water
PD&E Project Development & Environmental
PHF Peak Hour Factor

Acronyms-iii Transit Feasibility and Technology Assessment Report
Abbreviation Meaning PIP Public Involvement Plan
ppm parts per million
Pkwy Parkway
POV Privately Owned Vehicle
PRT Personal rapid transit
RCA Roadway Conceptual Analysis
SB southbound
sec second
SF Seasonal Factor
SFWMD South Florida Water Management District
sq ft square feet
STOPS Simplified Trips-On-Project Software
STP Surface Transportation Program
STTF State Transportation Trust Fund
TCAR Transit Concept and Alternatives Review
TFATA Transit Feasibility and Alternative Technology Assessment
TMC Turning movement counts
TMS Transportation Management Services
TOD Transit Oriented Development
TPSS traction power substations
TSP Transit Signal Priority
USDOT United States Department of Transportation
USFWS United States Fish and Wildlife Service
UST underground storage tank
veh vehicle
V/C Volume to Capacity
VMSF vehicle maintenance and storage facility
VWCD Valencia Water Control District
YOE year of expenditure

TOC-i Transit Feasibility and Technology Assessment Report
CONTENTS 1.0 Introduction .......................................................................................................................... 1
1.1 Study Area .................................................................................................................... 2 1.2 Purpose and Need ........................................................................................................ 2
1.2.1 Definition of the Problem ......................................................................................... 2 1.2.2 Goals and Objectives .............................................................................................. 4
2.0 Existing Conditions .............................................................................................................. 5 2.1 Land Use ...................................................................................................................... 5
2.1.1 Existing Land Use and Development ...................................................................... 5 2.1.2 Future Land Use and Development ........................................................................ 7 2.1.3 Orange County Convention Center ......................................................................... 7
2.2 Roadway Elements ..................................................................................................... 10 2.2.1 Roadway Characteristics ...................................................................................... 10 2.2.2 Utilities Assessment .............................................................................................. 14 2.2.3 Geotechnical Analysis ........................................................................................... 18 2.2.4 Environmental Site Assessment ........................................................................... 18
2.3 Operational Elements ................................................................................................. 22 2.3.1 Transportation Planning Consistency .................................................................... 22 2.3.2 Crash Analysis ...................................................................................................... 22 2.3.1 Existing Traffic Operations .................................................................................... 24 2.3.2 Existing Transit Operations ................................................................................... 28 2.3.3 Parking Analysis ................................................................................................... 32
2.4 Natural Elements ........................................................................................................ 32 2.4.1 Hydrologic and Natural Features .......................................................................... 32 2.4.2 Threatened and Endangered Species ................................................................... 33
3.0 Definition of Alternatives .................................................................................................... 33 3.1 No-Build Alternative .................................................................................................... 33 3.2 Identification of Viable Alternatives ............................................................................. 34
3.2.1 Vehicle Technology Alternatives ........................................................................... 34 3.2.2 Alignment Alternatives .......................................................................................... 38
3.3 Viable Alternatives ...................................................................................................... 42 3.4 Station and Transit Hub Locations .............................................................................. 44
3.4.1 Standard Stations Locations and Characteristics .................................................. 44 3.4.2 Transit Hub Options .............................................................................................. 46
4.0 Evaluation of Viable Alternatives ........................................................................................ 48 4.1 System Effectiveness ................................................................................................. 48 4.2 Transit Operating Plan ................................................................................................ 49 4.3 System Operations and Maintenance Cost ................................................................. 54 4.4 Fare Structure and Transfer Policy ............................................................................. 55 4.5 Ridership Estimates .................................................................................................... 55 4.6 Traffic Operations ....................................................................................................... 56
4.6.1 Opening Year ....................................................................................................... 56 4.6.2 Interim Year Traffic Operations ............................................................................. 57 4.6.3 Design Year Traffic Operations ............................................................................. 58 4.6.4 Right-Turn Queues ............................................................................................... 58 4.6.5 Curbside vs. Median Transit Lane Traffic Operations............................................ 58

TOC-ii Transit Feasibility and Technology Assessment Report
4.7 Opinions of Probable Capital Costs ............................................................................ 59 4.7.1 Capital Cost Assumptions ..................................................................................... 59 4.7.2 Capital Cost Components ..................................................................................... 60
4.8 Environmental Considerations .................................................................................... 69 4.8.1 Air Quality Impacts ................................................................................................ 69
4.9 Alternatives Matrix ...................................................................................................... 69
5.0 Recommended Premium Transit System ........................................................................... 72 5.1 Ridership Forecast ..................................................................................................... 74
6.0 Implementation Plan .......................................................................................................... 75 6.1 Governance Options ................................................................................................... 76 6.2 Federal Funding ......................................................................................................... 77
6.2.1 Capital Investment Grant Program ........................................................................ 77 6.2.2 Better Utilizing Investments to Leverage Development ......................................... 77 6.2.3 Flexible Funding Programs ................................................................................... 78
6.3 State Funding ............................................................................................................. 78 6.3.1 New Starts Transit Program .................................................................................. 78 6.3.2 Public Transit Block Grant Program ...................................................................... 79
6.4 FDOT Discretionary Programs .................................................................................... 79 6.4.1 Transit Service Development Program ................................................................. 79 6.4.2 Transit Corridor Program ...................................................................................... 80
6.5 Local Financial Commitment....................................................................................... 80 6.6 Transit Project Delivery ............................................................................................... 81 6.7 Recommended Funding Strategy ............................................................................... 82
7.0 Public Involvement Summary ............................................................................................. 85 7.1 Public Involvement Plan ............................................................................................. 85
7.1.1 Engagement Tools ................................................................................................ 85 7.2 Public Involvement Activities....................................................................................... 86
7.2.1 Stakeholder Engagement ..................................................................................... 86 7.2.2 Agencies and Small Groups.................................................................................. 88 7.2.3 Public Meetings .................................................................................................... 93 7.2.4 Local Planning Agency & Board of County Commissioners .................................. 95
APPENDICES Appendix A. Viable Alternatives Plan Sheets Appendix B. Station Area Assessment Appendix C. Transit Hub Assessment Appendix D. Alternatives Comparison Matrix Appendix E. Capital and O&M Costs Supporting Tables Appendix F. Recommended Transit System Plan Sheets Appendix G. Public Involvement Materials

TOC-iii Transit Feasibility and Technology Assessment Report
FIGURES Figure 1. Study Area .............................................................................................................. 3 Figure 2. Existing Land Use ................................................................................................... 6 Figure 3. Orange County Future Land Use Map .................................................................... 8 Figure 4. Recent Completed and Planned Developments ...................................................... 9 Figure 5. Study Area Sidewalks and Signalized Intersection Locations ................................ 12 Figure 6. Study Area 2018 Average Annual Daily Traffic ..................................................... 13 Figure 7. Existing Utilities – Water and Utility Easements .................................................... 15 Figure 8. Existing Utilities –Reuse Water and OUC Electrical Distribution ........................... 16 Figure 9. Existing Utilities – Wastewater .............................................................................. 17 Figure 10. Soil Survey of Study Area Map ............................................................................. 19 Figure 11. Location of MEDIUM and HIGH Ranked Sites ...................................................... 21 Figure 12. Study Area Crash Heat Map ................................................................................. 23 Figure 13. Traffic Data Count Map ......................................................................................... 25 Figure 14. 2020 AADT Volumes ............................................................................................ 26 Figure 15. Existing LYNX Routes and Stops .......................................................................... 29 Figure 16. Existing I-Ride Trolley Routes and Stops .............................................................. 31 Figure 17. Orange County I-Drive Transit Lanes Project Typical Section ............................... 34 Figure 18. Alternative 2 Routing Alignment Options ............................................................... 39 Figure 19. Alternatives 1 & 2 .................................................................................................. 40 Figure 20. Curbside (top) vs Median (bottom) Running .......................................................... 41 Figure 21. Alternative 1 Stations Locations ............................................................................ 45 Figure 22. Alternative 2 Stations Locations ............................................................................ 46 Figure 23. Potential Transit Hubs ........................................................................................... 47 Figure 24. Alternative 1 Bus Turnaround Options North Portion of Alignment ........................ 51 Figure 25. Alternative 2 Bus Turnaround Options North Portion of Alignment ........................ 51 Figure 26. Bus Turnaround Options South Portion of Alignment ............................................ 52 Figure 27. Recommended I-Drive Premium Transit System .................................................. 73 Figure 28. Transit Project Delivery ......................................................................................... 82 Figure 29. PAG Focus Areas ................................................................................................. 88 Figure 30. Public and Community Members Focus Areas...................................................... 94

TOC-iv Transit Feasibility and Technology Assessment Report
TABLES Table 1. Goals and Objectives .............................................................................................. 4 Table 2. Roadway Characteristics of the Study Segments .................................................. 10 Table 3. List of Sites with Potential Contamination Concerns ............................................. 20 Table 4. Existing Year (2020) Network Performance .......................................................... 27 Table 5. Existing Year (2020) Intersection Performance ..................................................... 27 Table 6. 2018 LYNX Route Operating Characteristics ........................................................ 28 Table 7. 2018 LYNX Stop Activity in the I-Drive District ...................................................... 30 Table 8. I-Ride Trolley Routes Operating Characteristics ................................................... 30 Table 9. 2018 I-Ride Trolley Ridership ................................................................................ 30 Table 10. Summary Comparison of Vehicle Technologies .................................................... 37 Table 11. Curbside and Median Running Comparison .......................................................... 42 Table 12. Viable Alternatives ................................................................................................ 43 Table 13. Viable Alternatives Weekday Operating Plan ........................................................ 50 Table 14. Viable Alternatives Weekend Operating Plan ........................................................ 50 Table 15. Viable Alternatives Travel Times ........................................................................... 53 Table 16. Viable Alternatives Operating Hours and Operating Miles ..................................... 53 Table 17. Viable Alternatives Peak, Spare and Total Vehicles .............................................. 54 Table 18. Viable Alternatives Total O&M Costs .................................................................... 55 Table 19. Ridership Estimates .............................................................................................. 56 Table 20. Opening Year (2025) Network Performance ......................................................... 57 Table 21. Interim Year (2035) Network Performance ............................................................ 57 Table 22. Design Year (2045) Network Performance ............................................................ 58 Table 23. Conceptual Right-of-Way Requirements ............................................................... 64 Table 24. Unallocated Contingencies Applied to Cost Components ..................................... 66 Table 25. Viable Alternatives Capital Cost Summary ............................................................ 68 Table 26. Viable Alternatives Comparison Summary ............................................................ 70 Table 27. Viable Alternatives Comparison Scoring ............................................................... 71 Table 28. Ridership Results for Recommended Premium Transit System ............................ 75 Table 29. Governance Options Analysis ............................................................................... 77 Table 30. Near Term Implementation Steps ......................................................................... 84 Table 31. Project Advisory Group Members ......................................................................... 87

1 Transit Feasibility and Technology Assessment Report
1.0 INTRODUCTION The International Drive (I-Drive) Transit Feasibility and Alternative Technology Assessment (TFATA) evaluated the potential of implementing a premium transit service as an urban circulator operating within the I-Drive District. The project purpose is to improve mobility options for a diverse set of travel markets within the rapidly growing I-Drive District, and to implement a sustainable multimodal system that reflects and complements the surrounding environment. The I-Drive 2040 Strategic Vision Plan approved by the Orange County Board of County Commissioners in February 2016 includes a policy direction intended to further enhance and sustain the economic viability of the I-Drive District and the Orange County Convention Center (OCCC). Careful planning and design for an effective premium transit system with multiple transportation modes can achieve the intent and purpose of the Board’s policy and will be essential to the existing and future growth of the I-Drive District.
This comprehensive report discusses the key issues and opportunities facing the implementation of a premium transit service within the I-Drive District, the process used to arrive at a proposed premium transit system, and a detailed discussion of that recommendation. The content in this report is organized into the following sections.
Section Description
1.0 Introduction Describes the study area and presents the project’s goals and objectives
2.0 Existing Conditions Presents the study area conditions and characteristics
3.0 Definition of Alternatives Describes the vehicle technology, alignment alternatives, stations, and transit hubs considered
4.0 Evaluation of Viable Alternatives Outlines the analysis performed to ultimately identify the recommended premium transit system
5.0 Recommended Premium Transit System Presents the recommended premium transit system, including operating considerations
6.0 Implementation Plan Presents the implementation strategy based on the project funding needs
7.0 Public Involvement Summary Presents a summary of the public outreach activities

2 Transit Feasibility and Technology Assessment Report
1.1 Study Area The study area for a potential premium transit service is illustrated in Figure 1, and includes key roadway segments where the existing I-Ride Trolley operates between Sand Lake Road and the Destination Parkway Superstop, and continues further south to Sea Harbor Drive. The study area encompasses the OCCC and surrounding land uses including hotels, restaurants, entertainment venues, and theme parks. The five roadway segments being studied are:
1. I-Drive from Sea Harbor Drive to Sand Lake Road, 2. Via Mercado from I-Drive to Universal Boulevard, 3. Destination Parkway from I-Drive to Tradeshow Boulevard, 4. Tradeshow Boulevard from Destination Parkway to Universal Boulevard, and 5. Universal Boulevard from Tradeshow Boulevard to Sand Lake Road.
The arrows on Figure 1 pointing to the north of Sand Lake Road and to the south of Sea Harbor Drive reflect an understanding that this study area is a subset of the I-Drive District, and that mobility options for the study area will need to consider opportunities for subarea and regional expansion to the north and south, and potentially to the east and west.
1.2 Purpose and Need The purpose and need for the I-Drive TFATA is documented in detail in the Purpose and Need Report. This section provides a summary of the definition of the problem and the goals and objectives that were integrated into the evaluation framework.
1.2.1 Definition of the Problem The I-Drive District is a major economic generator within Orange County and generates significant mobility demand for visitors, commuters, and residents alike. The I-Drive District is home to 6 theme parks, 4 entertainment complexes, 35 additional major attractions, over 120 hotels and resorts, and more than 300 restaurants and nightlife venues; and it will soon be home to Universal Studio’s newest theme park, EPIC Universe.1 A 2017 economic impact analysis found the I-Drive District’s economic impact accounts for $7.3 billion in Gross Regional Product (GRP), which is approximately 7% of the total Metropolitan Statistical Area (MSA) GRP.2 The I-Drive District also accounts for approximately 12% of the jobs in Orange County,3 hosts 20% of all Orlando’s visitors,4 and produces over $3.4 billion in personal income. Major employers include Universal Orlando Resorts, SeaWorld Orlando and Aquatica, as well as the numerous associated hotels, commercial and entertainment facilities.
1 I-Drive Business Improvement District Website (www.IDriveDistrict.com) 2 I-Drive Economic Impact Analysis 2017 3 I-Drive Economic Impact Analysis, 2017 4 I-Drive District Guide, 2019

3 Transit Feasibility and Technology Assessment Report
Figure 1. Study Area

4 Transit Feasibility and Technology Assessment Report
OCCC, a major economic contributor in the Central Florida area, is located in the I-Drive District and in the study area. The OCCC attracts over 230 events annually and contributes more than $2.4 billion in annual economic impact to the area.5 In March 2016, the OCCC published a master plan with a goal to further increase the attractiveness of the facility for large-scale events. Recommended improvements include, but are not limited to, enhanced vehicular circulation, freight service, transit, monumental art, and unique meeting spaces. These enhancements will continue to attract global and domestic visitors alike to the I-Drive area.
The I-Drive District’s current transportation system faces challenges beyond the increasing vehicular traffic congestion. The I-Ride Trolley, a bus circulator service that operates within the District, experiences long travel times due to short distances between stops and long dwell times for passengers to get on and off the vehicle. In addition, convention event organizers often hire private shuttle bus services to transport conventioneers to and from hotels and special events, which adds more vehicles to an already congested corridor. Visitors looking to take advantage of the area’s many attractions, shopping, and dining experiences often find mobility options limited and time-consuming.
The purpose of this project is to improve mobility options for this diverse set of travel markets within the rapidly growing I-Drive District through an investment in a high-quality transit system (referred to as “premium transit”).
1.2.2 Goals and Objectives The goals and objectives presented in Table 1 were integrated into the evaluation framework and applied to assess each of the transit alternatives considered.
Table 1. Goals and Objectives
Goals Description Objectives Support Multimodal Connectivity
While the primary goal is to provide a transit circulator serving local trips in the I-Drive District, the proposed premium transit investment will also connect with other transit services serving key destinations within the Orlando region.
- Support Local Connectivity
- Support Regional Connectivity
Serve Diverse Travel Markets and Needs A premium transit service will offer a
frequent, convenient, and comfortable travel option within the I-Drive District for visitors, residents, conventioneers, and workers.
- Serve Tourist Travel Market
- Serve Conventioneer Travel Market
- Serve Employee Travel Market
- Implement a Safe Transit System
5 Orange County Convention Center Website https://www.occc.net/About-Us

5 Transit Feasibility and Technology Assessment Report
Table 1. Goals and Objectives
Goals Description Objectives Sustain Economic Competitiveness and Development A premium transit service will provide cost-
effective infrastructure and mobility investment, which will support global competitiveness and promote sustainable economic development within the I-Drive District.
- Global Economic Competitiveness
- Support New and Sustainable Development
- Implement Cost Effective Transit Investment
- Support County and Local Community Development Goals and Plans
2.0 EXISTING CONDITIONS This section provides a comprehensive assessment of the study area conditions and characteristics, including land use context, roadway elements, traffic and transit operational elements, and natural elements. This section summarizes the Study Area Conditions and Characteristics Report and the existing/current conditions sections of the Design Traffic and Transit Engineering Report (DTTER), and the Transit System Plan Analysis Report.
2.1 Land Use
2.1.1 Existing Land Use and Development The I-Drive District has a broad-ranging mix of land uses, but can be categorized into four general land use categories: Commercial (including hotel, motel, and lodging), Vacant, Institutional (including convention centers), and Residential. Almost 50% of the land use can be classified as Commercial, 21% Vacant, and approximately 10% Residential. Most Residential land use is south of the study area and consists primarily of apartments and condominiums. Within the actual study area boundaries, the land use patterns are similar to the larger District - the majority of land use is categorized as Commercial, which includes both travel demand generators, such as hotels, and travel demand attractors, such as restaurants, retail, and entertainment. Institutional land use follows, with a small portion east of Universal Boulevard designated as Vacant. Figure 2 shows the existing land use of the study area. Greater detail is provided in the Study Area Conditions and Characteristics Report.

6 Transit Feasibility and Technology Assessment Report
Figure 2. Existing Land Use
CARRIER DRIVE
SAND LAKE ROAD
VIA MERCADO
DESTINATION PARKWAY
KIR
KM
AN
RO
AD
INTE
RN
ATI
ON
AL
DRI
VE
UNIVERSAL BOULEVARD

7 Transit Feasibility and Technology Assessment Report
2.1.2 Future Land Use and Development The study area is planned primarily for Commercial and Institutional uses and planned developments, as shown in Figure 3. Projects that are recently completed or planned are shown in Figure 4. Particularly noteworthy is EPIC Universe, Universal Studios theme park that is under construction. Kirkman Road is planned to be extended from Sand Lake Road to Universal Boulevard in support of this development, where it will continue onto Tradeshow Boulevard. Details about future land use and development can be found in the Study Area Conditions and Characteristics Report.
2.1.3 Orange County Convention Center The OCCC is the second largest convention center in the nation with two buildings (one on each side of I-Drive). On the southwest side of I-Drive is the West Concourse, and on the northeast side are the North and South Concourses in one building. The two buildings are connected via a covered elevated walkway that also connects to the Hyatt Regency hotel and convention center. Separate walkways connect to the Rosen Plaza and Rosen Centre Hotels.
In 2015, the OCCC crafted a Master Plan to address potential expansion opportunities and improvements to the OCCC campus. The most notable outcome is the expansion of the North/South Concourses, which has been under construction since March 2020. It will consist of a North/South Connector and a Multipurpose Venue. The North/South Connector will provide an enclosed hallway to connect the two Concourses as well as a ballroom and meeting space. Part of the Connector will be a new “front door” to the North/South Concourse building that is oriented toward Convention Way. Enhancements planned for the West Concourse include an activity center at its front entrance, a covered pedestrian plaza, and cafes/informal seating.
Furthermore, the OCCC Master Plan addresses parking, freight movement, traffic circulation (including new Privately Owned Vehicle (POV) lanes at the North/South Concourses), other pedestrian improvements, and a potential new Autonomous Vehicles (AV) shuttle to provide circulation within its campus. A potential transit hub is proposed in the vicinity of the North/South Concourses to provide additional modal connectivity. More details can be found in the Study Area Conditions and Characteristics Report.
OCCC North/South Connector inside rendering Source: Populous

8 Transit Feasibility and Technology Assessment Report
Figure 3. Orange County Future Land Use Map
CARRIER DRIVE
SAND LAKE ROAD
VIA MERCADO
DESTINATION PARKWAY
KIR
KM
AN
RO
AD
INTE
RN
ATI
ON
AL
DRI
VE
UNIVERSAL BOULEVARD

9 Transit Feasibility and Technology Assessment Report
Figure 4. Recent Completed and Planned Developments
CARRIER DRIVE
SAND LAKE ROAD
VIA MERCADO
CON
VEN
TIO
N W
AY
DESTINATION PARKWAY
INTE
RN
ATI
ON
AL
DRI
VE
UNIVERSAL BOULEVARD

10 Transit Feasibility and Technology Assessment Report
2.2 Roadway Elements
2.2.1 Roadway Characteristics Roadway Geometry The roadway corridors within the study area include segments of I-Drive, Universal Boulevard, Destination Parkway, and all of Tradeshow Boulevard. The existing geometric design conditions of the study area roadways are generally consistent with the surrounding land use characteristics. The traffic lanes and control devices help define the functional geometrics and the roadway geometric analysis. The land use characteristics are automobile-oriented, with a large amount of spacing between developments, generous amounts of surface parking surrounding the buildings, and large setbacks of the buildings from the roadway. The roadway geometry matches that automobile orientation, with high vehicular capacities, wide spacing between signalized intersections, and limited cross-street connectivity. Overall, the land use and transportation network largely reflect suburban rather than downtown urban development patterns.
Lane configurations, signal spacing, and speed limits are defined for the four study roadways: I-Drive, Universal Boulevard, Destination Parkway, and Tradeshow Boulevard, as highlighted in Table 2. Details of each of the study segments can be found in the Study Area Conditions and Characteristics Report.
Table 2. Roadway Characteristics of the Study Segments
Roadway From To Typical Section # of Signals Speed Limit
(mph) Approx. Distance (miles)
International Drive Sand Lake Road Hawaiian Court 4 lanes 11 35 2.4 Hawaiian Court Sea Harbor Drive 6 lanes 5 45 0.8
Universal Boulevard
Sand Lake Road Pointe Plaza Avenue 4 lanes 2 40 1.0
Pointe Plaza Avenue
Tradeshow Boulevard 6 lanes 2 45 1.0
Via Mercado I-Drive Universal Boulevard 5 lanes 0 35 0.1 Destination Parkway I-Drive Tradeshow
Boulevard 4 lanes 2 35 0.3
Tradeshow Boulevard Universal Boulevard Destination Parkway 2 lanes 0 35 0.6

11 Transit Feasibility and Technology Assessment Report
Signalized Intersections Figure 5 shows the signalized intersections and sidewalks in the study area. Three new traffic signals are under design in the following locations:
I-Drive and Ale House/Helicopter Tours I-Drive and Austrian Row Universal Boulevard and Las Palmeras Hilton Vacation Club/Convention Center driveway
The existing signal controllers for signalized intersections located within the proposed I-Drive bus/ transit lane project will be replaced with adaptive control systems that enable traffic signals to adapt to actual traffic demand. In addition, global positional system (GPS)/infrared dual preemption will be installed, which will allow for Transit Signal Priority (TSP) and emergency vehicle preemption.
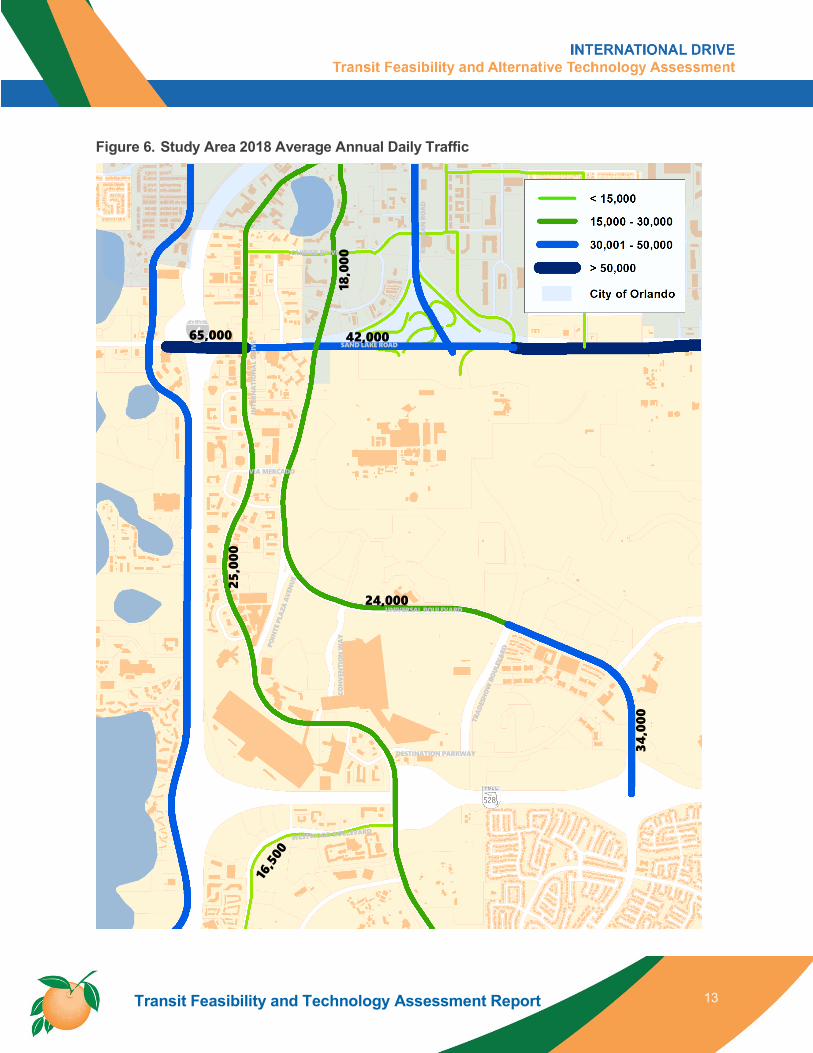
Traffic Volumes As shown in Figure 6, the 2018 average annual daily traffic (AADT) on Universal Boulevard, north of Destination Parkway, ranges from 18,000 to 24,000 while I-Drive’s AADT is 25,000. Traffic volumes along Sand Lake Road range from 42,000 to 65,000 AADT. Detailed traffic information within the study area are provided in the Design Traffic and Transit Memorandum.
Bicycle Features The absence of dedicated bicycle facilities within the study area limits the use of bicycles as an alternative mode of transportation and the promotion to a segment of tourism that is interested in bicycling. There are bike lanes only along I-Drive between Universal Boulevard and Oak Ridge Road, north of the study area.
Effective January 2018, Orange County began to license, permit and regulate the Pedicab Industry within the I-Drive District. A pedicab is a non-motorized vehicle with three wheels that is operated by a driver using bicycle-like pedals, pulling a cab behind them where passengers ride. Pedicabs currently operate on sidewalks, creating conflicts with pedestrians circulating along I-Drive.
Pedestrian Features Orange County conducted a walkability assessment for the study area in 2014, as documented in the International Drive Parking Study and Walkability Analysis Technical Memorandum. This 2014 document identifies many positive elements for the pedestrian facilities and walking environment throughout most of the study area, including the following:
Sidewalks are provided in most developed areas and are generally in good condition; Roadway and adjacent property lighting illuminates most of the study area; Crosswalks with various signalization are provided at various locations; and Regular pedestrian activity is found along I-Drive north of Pointe Plaza Avenue.

12 Transit Feasibility and Technology Assessment Report
Figure 5. Study Area Sidewalks and Signalized Intersection Locations
CARRIER DRIVE
SAND LAKE ROAD
VIA MERCADO
CON
VEN
TIO
N W
AY
DESTINATION PARKWAY
KIR
KM
AN
RO
AD
INTE
RN
ATI
ON
AL
DRI
VE
UNIVERSAL BOULEVARD
13 Transit Feasibility and Technology Assessment Report
Figure 6. Study Area 2018 Average Annual Daily Traffic
CARRIER DRIVE
SAND LAKE ROAD
VIA MERCADO
CON
VEN
TIO
N W
AY
DESTINATION PARKWAY
KIR
KM
AN
RO
AD
INTE
RN
ATI
ON
AL
DRI
VE
UNIVERSAL BOULEVARD 24,000
42,000 65,000
25,0
00
34,0
00
18,0
00

14 Transit Feasibility and Technology Assessment Report
The Walk Score online tool gives the TFATA study area a score of 44, meaning that the area is mainly car-dependent, as most errands involve the use of a vehicle for residents and visitors staying in the area. The 2014 Walkability Memorandum also identifies opportunities for enhancing walkability within the study area including improvements for crosswalks, walkways, bikeways, and lighting. A detailed assessment of walkability with respect to each study area corridor can be found in the Study Area Conditions and Characteristics Report.
2.2.2 Utilities Assessment Utility providers of electric services within the study area are Orlando Utilities Commission (OUC) and Duke Energy. Duke Energy owns a power sub‐station on the east side of Universal Boulevard (8101 Universal Boulevard) and a sub-station at 5707 Sea Splash Way next to SeaWorld. Providers for water/wastewater services include Orange County Utilities, OUC, and the City of Orlando Water Reclamation. Figure 7 shows the general location of water service lines along with the numerous utility easements located within the study area. Figure 8 shows the location of reuse water service lines and OUC electrical distribution. Figure 9 shows the general location of wastewater service lines and structures.
Gas service is provided by TECO, and traffic signals are provided by Orange County Public Works. Fiber and phone services are provided by Century Link, Charter Communications, MCI, Crown Castle, Summit Broadband, Comcast Communications, Smart City Telecom, and Uniti Fiber LLC.

15 Transit Feasibility and Technology Assessment Report
Figure 7. Existing Utilities – Water and Utility Easements
CARRIER DRIVE
SAND LAKE ROAD
VIA MERCADO
DESTINATION PARKWAY
KIR
KM
AN
RO
AD
INTE
RN
ATI
ON
AL
DRI
VE
UNIVERSAL BOULEVARD

16 Transit Feasibility and Technology Assessment Report
Figure 8. Existing Utilities –Reuse Water and OUC Electrical Distribution
CARRIER DRIVE
SAND LAKE ROAD
VIA MERCADO
DESTINATION PARKWAY
KIR
KM
AN
RO
AD
INTE
RN
ATI
ON
AL
DRI
VE
UNIVERSAL BOULEVARD

17 Transit Feasibility and Technology Assessment Report
Figure 9. Existing Utilities – Wastewater
CARRIER DRIVE
SAND LAKE ROAD
VIA MERCADO
DESTINATION PARKWAY
KIR
KM
AN
RO
AD
INTE
RN
ATI
ON
AL
DRI
VE
UNIVERSAL BOULEVARD

18 Transit Feasibility and Technology Assessment Report
2.2.3 Geotechnical Analysis Results of the geotechnical data collection activities are provided in the Geotechnical Report; and are summarized in this section. Most of the soils within the study area are classified as Group A/D, which includes Basinger fine sand, Smyrna-Smyrna wet fine sands, and Smyrna fine sand-urban land complex. The next prominent soil within the study area is Group A alone. The soil survey of the study area is shown in Figure 10.
2.2.4 Environmental Site Assessment A desktop environmental review for the study area was performed for existing conditions. This desktop-level assessment included a regulatory document review for properties within ¼-mile of the project corridor (one-mile for superfund sites and landfills). A detailed contamination screening, complying with the Level 1 investigation (FDOT Part 2, Chapter 20) and/or Phase 1 Environmental Site Assessment (ESA) (per American Society for Testing and Materials [ASTM] E 1527-13) was completed. Thirty-seven (37) sites were determined as having the potential for contamination concern. Of the 37 sites investigated, the following risk rankings have been applied: 29 sites ranked LOW, 3 sites ranked MEDIUM, and 5 sites ranked HIGH. The rankings are LOW, MEDIUM, and HIGH and are generally defined below. Table 3 lists the sites with MEDIUM and HIGH potential contamination concern to the study segments. Figure 11 shows the location of MEDIUM and HIGH potential contamination sites in relation to the proposed transit stops.
LOW: A review of available information indicates that past or current activities on the property have an ongoing contamination issue; the site has a hazardous waste generator identification (ID) number; or the site stores, handles, or manufactures hazardous materials. However, based on the review of conceptual or design plans and/or findings from this Level I evaluation, it is not likely that there would be any contamination impacts to the project.
MEDIUM: After a review of conceptual or design plans and findings from this Level I screening evaluation, a potential contamination impact to the project has been identified. If there was insufficient information (such as regulatory records or site historical documents) to make a determination as to the potential for contamination impact, and there was reasonable suspicion that contamination may exist, the property was ranked at least as MEDIUM. Properties used historically as gasoline stations and that have not been evaluated or assessed by regulatory agencies, sites with abandoned in-place underground petroleum storage tanks, or currently operating gasoline stations received this ranking.
HIGH: After a review of all available information and conceptual or design plans, there is appropriate analytical data that shows contamination would substantially impact construction activities, have implications to right-of-way acquisition, or have other potential transfer of contamination related liability to the FDOT.

19 Transit Feasibility and Technology Assessment Report
Figure 10. Soil Survey of Study Area Map
CARRIER DRIVE
SAND LAKE ROAD
VIA MERCADO
DESTINATION PARKWAY
KIR
KM
AN
RO
AD
INTE
RN
ATI
ON
AL
DRI
VE
UNIVERSAL BOULEVARD

20 Transit Feasibility and Technology Assessment Report
Table 3. List of Sites with Potential Contamination Concerns
Site No. Site Name Site Address
Dist. from Study
Segments Details Risk
Ranking
1 Sand Lake Shell Service/Circle K #2708960
6942 Sand Lake Rd 350 ft
Discharge in 1998 and in 2015. Site assessments are still ongoing. During site reconnaissance, this site was a BP/Circle K gas station. Observation monitoring wells were located in the parking lot.
HIGH
2 WAWA Food Market #51
6500 W Sand Lake Rd 220 ft
3 underground storage tanks (UST) and 8 dispensers on site. Multiple non-compliance violations. During site reconnaissance, this site was a WAWA. Multiple monitoring wells were located around the perimeter of the convenience store labeled with an S on it.
MEDIUM
3 Peabody Orlando/Hyatt Regency Orlando
9801 International Dr
120 ft
Discharge in 2011. No Further Action with Conditions has been approved stating the implementation of engineering controls and establishment and use of recordation of institutional controls. During site reconnaissance, this site was the Hyatt Regency Orlando. This may require a notification to the agency if intrusive activities are located nearby.
HIGH
4 Rikers International/Mobil #11220
9858 International Dr
230 ft
Discharge in 1998. Site assessment activities are still ongoing. During site reconnaissance, this site was a Walgreens. Monitoring wells were located throughout the parking lot.
HIGH
5 Air Florida Helicopter
8990 International Dr
170 ft
Five (5) 500-gallon singlewall steel tanks on site. Four (4) contain AV gas and one is empty. The tanks are not regulated by 2-762(FAC) due to being too small. Orange County Environmental Protection Division (OCEPD) Storage Tank Compliance Section has no jurisdiction. The site is also located in a Groundwater Contamination Area with Ethylbenzene. During site reconnaissance, this site is Air Florida Helicopter. Aboveground storage tanks (AST) were located in the back of the private property.
HIGH
6 Former Landfill and Brownfield Site
9751 Universal Blvd 300 ft
Brownfield Rehabilitation Site and Former Landfill Site with groundwater contamination. Remedial action plan in place. Multiple locations along Universal Boulevard from Destination Parkway to Via Mercado.
HIGH
7 7-Eleven Store #37611
9725 Universal Blvd 150 ft New active fuel user in 2019. USTs in place. During
site reconnaissance, this site was 7-Eleven. MEDIUM
8 Exxon Moil/7-Eleven Store #34881
6026 Destination Pkwy
120 ft
City water line broke in 2013. Cleanup status completed immediately. Removed a total of 50 gallons of petroleum contact water (PCW). During site reconnaissance, this site is a 7-Eleven gas station.
MEDIUM

21 Transit Feasibility and Technology Assessment Report
Figure 11. Location of MEDIUM and HIGH Ranked Sites
CARRIER DRIVE
SAND LAKE ROAD
VIA MERCADO
DESTINATION PARKWAY
KIR
KM
AN
RO
AD
INTE
RN
ATI
ON
AL
DRI
VE
UNIVERSAL BOULEVARD
2 1
3
4
5
6 7
8

22 Transit Feasibility and Technology Assessment Report
For those locations with a risk ranking of MEDIUM or HIGH, Level II field screening is recommended to be conducted during future project implementation phases. These sites have been determined to have potential contaminants that may impact the project. Further detail of the findings can be found in the Contamination Screening Evaluation Report.
2.3 Operational Elements
2.3.1 Transportation Planning Consistency The TFATA study is consistent with the policies outlined in the Orange County 2030 Comprehensive Plan 2010-2030—Goals, Objectives & Policies adopted in 2009 and is consistent with the adopted Orange County 2030 Long Range Transportation Plan. Orange County’s Comprehensive Plan highlights the I-Drive Activity Center Element as a special activity center that was adopted with a Strategic Development Plan and is subject to the policies contained in the I-Drive Activity Center Element (FLU3.2.14). The I-Drive Activity Center is considered a Regional Activity Center for the purposes of increasing the threshold set forth in Chapter 380, Florida Statues, and Rule 28-24.014(10), Florida Administrative Code (FAC). The Comprehensive Plan Objective FLU2.3 states that the Land Development Code and Future Land Use (FLU) Map shall reflect the coordination of land use and transportation as a major strategy for implementing the County’s development framework. Policy FLU2.3.9 states Orange County will support land use policies that reinforce effective transportation management. This includes support for activity centers, transit-oriented developments (TOD) and sector planning. The goals and objectives for the I-Drive Activity Center Element include:
To promote tourism by the development of an economically visible, well planned tourist-oriented activity center.
The efficient movement of people within the activity center shall be provided by the development of a multimodal transportation system.
To facilitate the expansion of residential development in proximity to employment areas of the activity center in order to minimize travel distance and time between the uses.
To provide a balance between infrastructure programming and land use.
To provide land use compatibility and environmental projection within and adjacent to the activity center.
2.3.2 Crash Analysis Crash records were acquired using the FDOT Signal Four Analytics database for areas in and around the study area. Six years of crash records were compiled from January 1, 2013, through December 31, 2018. A more complete review and analysis of crash data in the I-Drive District is provided in the Design Traffic and Transit Technical Memorandum and the Study Area Conditions and Characteristics Report. Figure 12 shows the crash heat map of the study area.

23 Transit Feasibility and Technology Assessment Report
Figure 12. Study Area Crash Heat Map
CARRIER DRIVE
SAND LAKE ROAD
VIA MERCADO
DESTINATION PARKWAY
KIR
KM
AN
RO
AD
INTE
RN
ATI
ON
AL
DRI
VE
UNIVERSAL BOULEVARD

24 Transit Feasibility and Technology Assessment Report
2.3.1 Existing Traffic Operations To assess existing and future traffic conditions, both 72-hour roadway segment counts and 8-hour intersection turning movement counts (TMC) were collected in January 2020 and considered along with counts from previous studies. The count locations are shown in Figure 13.
An operational analysis was conducted for the study corridors using the Synchro 10 software and its application of the Highway Capacity Manual (HCM) 6th Edition. Network performance results were based on Synchro’s Percentile Delay Analysis, given that the HCM does not provide network-level performance measures. The Synchro model was developed consistent with existing geometry. Google Earth was used to develop the model lane configurations and intersection control types. Posted speed limits along the corridor were input to the model link speeds. Existing signal timing plans were obtained from Orange County’s Traffic Engineering Division and coded in the model. All analysis procedures followed the 2014 FDOT Traffic Analysis Handbook. Consistent with the traffic methodology, the performance measures are:
Network performance measures: total delay; average delay per vehicle; underserved vehicles
Intersection performance measures:
> Turning-movement level: level of service (LOS), delay, volume-to-capacity (V/C) ratios, and 95th percentile queue lengths
> Overall intersection: LOS, delay, max V/C ratio
From the 72-hour classification counts and from prior studies, AADTs were calculated, as shown in Figure 14. The methodology is shown below. For AADTs derived from prior year counts, scale factors were applied as needed.
1. Obtain the Seasonal Factor (SF) and the Axle Correction Factor (ACF) from FDOT Florida Traffic Online (2018).
2. Apply the formula AADT = ADT x SF x ACF. (ADT stands for Average Daily Traffic)
3. Balance AADTs along the corridor
K and D factors were also determined for the AM and PM peak periods. Further details can be found in the DTTER.
At the intersection level, AM and PM peak hours were selected to be 8:00-9:00 AM and 5:00-6:00 PM, respectively, based on a review of the TMCs. Peak hour factors (PHF) and truck percentages were then calculated for each of the peak hours. TMCs were seasonally adjusted using seasonal factors from FDOT’s Florida Traffic Online and then balanced. Synchro was used to provide network- and intersection-level performance.

25 Transit Feasibility and Technology Assessment Report
Figure 13. Traffic Data Count Map

26 Transit Feasibility and Technology Assessment Report
Figure 14. 2020 AADT Volumes

27 Transit Feasibility and Technology Assessment Report
Table 4 shows the network performance. The network performance in the PM peak shows the increased PM traffic volume experiencing approximately 20% more delay per vehicle, resulting in almost 50% more total delay. In both the AM and PM, all traffic volume is served in the network.
Table 4. Existing Year (2020) Network Performance Performance Measure AM Peak Hour PM Peak Hour
Average Delay (sec/veh) 25 29 Total Delay (hr) 229 385
Number of Unserved Vehicles 0 0
Table 5 provides the performance of studied intersections. The two Tradeshow Boulevard stop-controlled intersections operate at LOS F due to having a minor street movement delay of greater than 50 seconds in the peak periods. The Destination Parkway at Tradeshow Boulevard intersection operates at LOS D in PM peak hour. Between the AM and PM peak, there are three intersections where one or more movements has delay greater than 80 seconds and cycle failure is likely to occur in the peak period: Universal Boulevard at Sand Lake Road, I-Drive at Sand Lake Road, and Universal Boulevard at Destination Parkway. Further details about existing traffic operations can be found in the DTTER.
Table 5. Existing Year (2020) Intersection Performance
Major Rd Cross Street AM Peak Hour PM Peak Hour Max V/C Delay LOS Max V/C Delay LOS
I-Drive
Sand Lake Rd 0.65 29.0 C 1.051 53.5 D Jamaican Ct (North) 0.42 18.9 B 0.57 7.3 A
Austrian Ct / via Mercado 0.44 17.1 B 0.51 25.9 C Pointe Plaza Ave 0.84 25.5 C 0.67 30.2 C Convention Way 0.45 41.6 D 0.68 40.0 D Destination Pkwy 0.54 25.4 C 0.59 32.8 C
SR 528 Westbound Ramps 1.0 48.9 D 0.86 27.7 C SR 528 Eastbound Ramps 0.65 30.2 C 0.97 32.8 C
Destination Pkwy Tradeshow Blvd* 0.40 111.8 F 0.47 30.7 D
Universal Blvd
Sand Lake Rd 1.13 43.8 D 0.96 49.8 D Pointe Plaza Ave 0.57 21.9 C 0.65 31.4 C Convention Way 0.62 26.5 C 0.81 26.3 C
Concourse Dr 0.37 4.6 A 0.43 18.7 B Tradeshow Blvd* 0.87 62.9 F 0.88 77.8 F Destination Pkwy 0.83 35.3 D 1.31 77.0 E
*Stop controlled intersection 1 The northbound movement on I-Drive is at capacity and delay is over 80 seconds per vehicle

28 Transit Feasibility and Technology Assessment Report
2.3.2 Existing Transit Operations This section provides an overview of the transit services currently offered in the I-Drive District, including LYNX, I-Ride Trolley and OCCC hotel shuttles. Private charter bus services also operate within the study area, often in association with pre-paid tours that visit attractions mainly located outside of the I-Drive TFATA study area.
LYNX The I-Drive District is served by six regular LYNX bus routes (8, 38, 42, 50, 58, and 111) that primarily run every 30 minutes on weekdays with reduced service levels at night and weekends (Routes 8 and 38 run every 15 minutes on weekdays). Table 6 summarizes key operating characteristics for each route.
Link 8: West Oak Ridge Road to I-Drive with major stops at OCCC and Orlando Outlet I-Drive
Link38: Downtown Orlando to I-Drive with stops at OCCC and Kirkman Road
Link 42: I-Drive to Orlando International Airport (OIA) with major stops at Destination Parkway and Orlando Premium Outlet I-Drive
Link 50: Downtown Orlando to Disney World, with stops on Sea Harbor Drive
Link 58: Shingle Creek with a stop at Destination Parkway
Link 111: OIA to SeaWorld with major stops Sea Harbor Drive and Destination Parkway
The operating characteristics of each route are shown in Table 6. Figure 15 provides a map of LYNX routes and stops in the study area. Each of these bus routes originates outside of the I-Drive District, most connecting to downtown Orlando or OIA.
Table 6. 2018 LYNX Route Operating Characteristics
LYNX Route Weekday
Frequency (minutes)
Saturday Frequency (minutes)
Sunday/Holiday Frequency (minutes)
Weekday Service Span Duration (hours)
Link 8 15 30 30 4:45am – 3:01am 22 Link 38 15 15 15 6:00am – 6:50pm 13 Link 42 30 30 60 4:50am – 12:30am 20 Link 50 30 30 30 5:15am – 12:55am 20 Link 58 30 30 30 6:29am – 11:43pm 17
Link 111 60 60 60 5:30am – 11:17pm 18

29 Transit Feasibility and Technology Assessment Report
Figure 15. Existing LYNX Routes and Stops

30 Transit Feasibility and Technology Assessment Report
The six LYNX routes serving the I-Drive District transported over 3.2 million LYNX passengers in 2018, as identified in Table 7. Additional system performance measures can be found in the Transit Systems Plan Analysis.
Table 7. 2018 LYNX Stop Activity in the I-Drive District LYNX Route Annual Weekday Annual Saturday Annual Sunday/Holiday Total
Link 8 1,097,521 172,017 174,564 1,444,102 Link 38 229,678 48,643 43,495 321,816 Link 42 293,223 69,983 43,421 406,627 Link 50 646,185 130,967 115,892 893,044 Link 58 43,146 1,836 4,827 49,809 Link 111 75,635 14,009 12,657 102,301
Total 3,217,699
I-RIDE Trolley The I-Ride Trolley provides scheduled transit service between local destinations, hotels, and the OCCC along two bus routes: the Red Line and Green Line, as illustrated in Figure 16. Table 8 summarizes the operating characteristics of each route. The Green Line and Red Line operate at different frequencies, but each route operates daily from 8:00 a.m. to 10:30 p.m. all year long.
Table 8. I-Ride Trolley Routes Operating Characteristics
I –Ride Trolley Route Frequency (minutes) Daily Service Span Duration (Hours)
Green Line 30 8:00am – 10:30pm 14.5
Red Line 20 8:00am – 10:30pm 14.5
The I-Ride Trolley routes served over 1.4 million passengers in 2018, as identified in Table 9. The Red Line accounted for nearly 68% of that total ridership. Additional system performance measures can be found in the Transit Systems Plan Analysis.
Table 9. 2018 I-Ride Trolley Ridership I-Ride Trolley Route Average Daily Total
Green Line 1,295 472,598 Red Line 2,772 101,976
Total 1,484,574

31 Transit Feasibility and Technology Assessment Report
Figure 16. Existing I-Ride Trolley Routes and Stops

32 Transit Feasibility and Technology Assessment Report
OCCC Hotel Shuttle In addition to the public transit options offered by LYNX and the I-Ride Trolley, hotel shuttle services are provided free to conventioneers for most OCCC events through contracts between event organizers and private shuttle service providers. Commonly contracted providers include Mears, Transportation Management Services (TMS), and the Florida Charter Bus Company.
OCCC hotel shuttle services at strategic pick-up locations serve hotel blocks that have been previously arranged for events. While hotel websites also advertise the I-Ride Trolley, the survey conducted for this study indicates that a good number of conventioneers are unaware of the service.
Most shuttle buses serving conventioneers are in the style of charter buses with a capacity of 50 passengers. For large events at OCCC, a range of 100 to 300 shuttle buses are needed, completing an average of four trips in the morning and three trips in the afternoon. OCCC shuttle buses generally operate at 15 to 20-minute headways, with some events requiring a more frequent service operating at 10-minute headways.
2.3.3 Parking Analysis The Orange County I-Drive Parking and Walkability Analysis (2014) determined there are over 31,000 off-street parking spaces located within the study area across all land uses. Active entertainment, hotel, restaurant, and retail account for approximately 20,400 spaces and represent two-thirds of the total existing parking inventory. The Study Area Conditions and Characteristics Report lists the parking information relevant to the study area. When a use requires more than 20 spaces, it is not permitted to provide surface parking greater than 25% over the minimum parking requirement. There is no cap on structured parking garages.
2.4 Natural Elements
2.4.1 Hydrologic and Natural Features The study area hydrology and natural features occurs within Section 36 Township 23 South Range 28 East, Section 1 Township 24 South Range 28 East, Section 6 Township 24 South Range 29 East, and Section 12 Township 24 South Range 28 East to include Sea Harbor Drive. The study area occurs within the boundaries of the South Florida Water Management District (SFWMD) in the Shingle Creek drainage basin. The study area is also located in the Valencia Water Control District (VWCD), whose boundary begins along the south right-of-way line of SR 528 and extends southward.
Orange County’s S-11 canal passes under Tradeshow Boulevard. According to the U.S.D.A. Natural Resources Conservation Service (NRCS) soil survey, the S-11 Canal was excavated through St. John’s fine sand, a poorly drained, non-hydric soil. The area should not be considered jurisdictional for regulatory purposes. Improvements to this road in anticipation of the Kirkman Road extension are in the scope of the TFATA and discussed in the Tradeshow Boulevard Roadway Conceptual Analysis (RCA). All other wetland and surface water systems

33 Transit Feasibility and Technology Assessment Report
outside of the right-of-way would likely not be impacted by the transit improvements or the Tradeshow Boulevard roadway improvements. Additionally, there are no known conservation areas or mitigation banks within the study corridor. More information can be found in the Study Area Conditions and Characteristics Report.
2.4.2 Threatened and Endangered Species The entire study area falls within the United States Fish and Wildlife Service (USFWS) Consultation Area for the sand skink. The federal status for the sand skink is threatened. The USFWS Information, Planning, and Consultation System also lists Audubon’s Crested Caracara, Everglades Snail Kite, Florida Scrub-Jay, Red-cockaded Woodpecker, and Wood Stork for the study area. The study area consists of mostly commercial developments with minimal, if any, occurrences of undisturbed habitat. Past impacts to the remnant vegetative communities and fragmentation have resulted in minimal wildlife utilization and diversity. More information can be found in the Study Area Conditions and Characteristics Report.
3.0 DEFINITION OF ALTERNATIVES The objective for the Definition of Alternatives is to identify premium transit alternatives that are viable and meet the project’s goals and objectives. This section presents the tiered process used to screen potential transit alternatives.
3.1 No-Build Alternative The No-Build Alternative incorporates the I-Drive transit lanes project, currently at 90% design, implementing four general use traffic lanes and two dedicated curbside Business Access and Transit (BAT) lanes in the segment from Sand Lake Road to Destination Parkway. Transit lanes are also programmed along Universal Boulevard from Sand Lake Road to Via Mercado. Construction is expected to begin in late 2021 or early 2022. Figure 17 illustrates a typical section of the I-Drive transit lanes.
The TFATA study findings include the recommendation for the development of a detailed “I-Drive Transit and Traffic Management Plan” as design and construction advances that would optimize the efficient and cost-effectiveness of the programmed transit lanes, regardless of the outcome of this study. Existing LYNX and I-Ride Trolley transit services will be operating in the newly constructed transit lanes once they are available. Other users of the transit lanes would include the OCCC hotel shuttles and the right-turning passenger and freight vehicles that will use the lanes for access to cross streets and I-Drive fronting properties.

34 Transit Feasibility and Technology Assessment Report
Figure 17. Orange County I-Drive Transit Lanes Project Typical Section
3.2 Identification of Viable Alternatives A set of viable build alternatives was identified, considering routing alignment alternatives, options for position alignments in relation to the cross-section of the roadway, and vehicle technology alternatives compatible with the character for premium transit within the I-Drive District. The viable alternatives plan sheets are provided in Appendix A.
3.2.1 Vehicle Technology Alternatives A set of transit vehicle technologies for initial consideration and screening were identified, including technologies recommended in earlier studies. The assessment focused on transit technologies with some degree of proven operational experience in urban environments, including automated guideway transit (AGT), monorail, aerial gondola, personal rapid transit (PRT), premium bus, modern streetcar, and autonomous/connected vehicle (AV/CV) shuttles.
Four of the technologies considered in the preliminary screening did not advance into the more detailed comparative assessment – AGT, monorail, aerial gondola, and PRT. Each of these technologies requires significant infrastructure resulting in very high capital costs for design and construction of the system. AGT, monorail, and PRT require exclusive, grade-separated guideways on an aerial structure. The aerial gondola requires significant structures to support the aerial guideway and passenger stations. Introduction of an aerial guideway and related infrastructure for elevated stations is out of character with the existing and planned development and pedestrian focus along I-Drive. In addition, each of these technologies, but particularly the

35 Transit Feasibility and Technology Assessment Report
aerial gondola, would typically be implemented in a corridor with greater distances between stations than needed in the I-Drive District.
Three of the technologies were advanced – premium bus, modern streetcar, and AV/CV shuttles. While each has its own unique set of advantages and disadvantages, these technologies were determined to be more compatible with the character for premium transit within the I-Drive District.
Premium Bus The term “bus rapid transit (BRT)” is often used; however, this study refers to the term “premium bus” to emphasize the use of this technology for a local circulator service. Premium buses can be configured in numerous sizes and can be powered by different technologies such as diesel, compressed natural gas (CNG), hybrid electric, and others.
The premium bus vehicle technology assessment evaluated available and operating technologies in the U.S. transit market. Premium bus vehicles available in today’s transit market offer many of the exterior and interior qualities of modern streetcar vehicles, but at lower capital costs and with increased maneuverability and flexibility.
Modern Streetcar The modern streetcar is similar to an LRT vehicle but typically smaller in size to accommodate operations as a circulator service, often in mixed traffic on the streets in an urban environment. The rail vehicle typically operates as a single car and can be electrically powered through contact with overhead catenary wires or with some combination of on-board battery storage systems. The relatively high-level passenger capacity combined with adaptability to many urban environments has led to the introduction of modern streetcars in a number of cities internationally and in the U.S. However, there are challenges, such as the high costs for the vehicles and related rail, stations, systems and maintenance facility infrastructure.
Las Vegas SDX
Kansas City Streetcar

36 Transit Feasibility and Technology Assessment Report
AV/CV Shuttles AV/CV shuttles are an emerging mode of transportation that have been deployed in various stages of demonstration and early implementation around the world and in the U.S., including a local Orlando demonstration at Lake Nona. Vehicles introduced to date are generally small, carrying up to 12 or 15 passengers and traveling at about 15 miles per hour. Currently, the various demonstrations and limited operations require an operator or at least a service representative on board, because of their emerging nature. It is anticipated that over time, the technology and applicability could evolve such that the shuttles can operate safely and effectively without operators on board and depending on the level of public acceptance and perception of safety and security.
Comparison Matrix The three vehicle technologies advanced from the preliminary screening (modern streetcar, premium bus, and AV/CV shuttle) were evaluated based the key performance characteristics listed below. Further details are provided in the Vehicle Technology Assessment.
Capacity - passenger capacity, both seated and standing.
Rider Experience – features such as level boarding and multiple doors, and ride comfort.
Adaptability/Maneuverability – ability to detour off the transit lane in case of accident, incident or other service changes.
Expandability – ability to alter or extend the route while minimizing cost and service disruption.
Proven Operating Experience – demonstrated implementation and in-service operations in comparable urban environments.
As shown in Table 10, based on the assessment of these key factors, the premium bus has the highest rating of the three vehicle technologies considered. Premium bus exhibits five “High” ratings and one “Medium” rating. The modern streetcar and AV/CV shuttle technologies each exhibit three “High” ratings and a split of “Medium” and “Low” ratings.
Move Nona Orlando

37 Transit Feasibility and Technology Assessment Report
Table 10. Summary Comparison of Vehicle Technologies Key Factor Premium Bus Modern Streetcar AV/CV Shuttle
Capacity Significant passenger capacity – seated and standing
Significant passenger capacity – seated and standing
Limited capacity – only 12 to 15 passengers per vehicle
Rider Experience Premium bus vehicles comparable to interiors and features of rail transit vehicles
High level of rider comfort and passenger amenities
Comfortable and convenient interior and seating
Adaptability/ Maneuverability
Route flexibility – easy to maneuver around obstructions and make detours.
Fixed rail system with no ability to deviate from route in reaction to incidents, accidents, construction
Very flexible – allows for dynamic route adjustments, and can deviate from the fixed route
Expandability
Easier to expand routes either permanently or for special events. Limited infrastructure requirements
Expandable, but requires up-front planning and design decisions
Expandable and flexible – limited infrastructure requirements
Proven Operating Experience
Numerous systems operating in U.S. serving diverse, congested urban corridors.
Numerous operating systems in U.S. and internationally. However, limited experience on similar transit lane in congested corridor similar to I-Drive.
Still in demonstration phase in numerous cities and operating environments, particularly for larger sized vehicles. Still uncertain on acceptance and safety/security of autonomous operations
Favorable Medium Non-Favorable
Vehicle Technology Findings Premium bus is rated high in terms of capacity, passenger experience, adaptability/maneuverability, expandability, and proven operating experience. Capital costs are significantly lower compared to modern streetcar with premium bus vehicles providing similar levels of service and rider comfort. The very high ratings for adaptability/maneuverability and expandable capacity are particularly significant in consideration of the I-Drive TFATA purpose and need. Upgraded premium buses available in today’s U.S. transit market offer many of the exterior and interior qualities of modern rail vehicles. In addition, various sized vehicles and different fuel/power source technologies are available.
Modern streetcar provides the greatest capacity with a high rating for passenger experience. However, the modern streetcar vehicles are by far the highest in cost and would require significant infrastructure investment. The implementation timeline is generally longer compared to premium bus because of the complexity of the rail systems and the need for a specialized vehicle maintenance and storage facility. In addition to high cost, operations on a fixed rail and tight turning radii significantly limit the adaptability/maneuverability of the modern streetcar in a corridor such as I-Drive. This could be the most significant negative factor for this technology in the context of the I-Drive District within the study area. While modern streetcar could be expanded to serve other local and regional connections, it would require significant up-front planning, coordination, and design decisions. Extensive infrastructure costs and disruption would be incurred for rail and power supply expansion, particularly to the north crossing congested Sand Lake Road. Additional challenges that are not necessarily reflected in this

38 Transit Feasibility and Technology Assessment Report
summary include more extensive and sometimes disruptive construction along the I-Drive corridor, the installation of fixed rail and power distribution systems, and utility relocations. Streetcar systems require extensive agency coordination to start-up, operate and maintain the new infrastructure and technology modes of transit service.
AV shuttles could present a promising potential addition to mobility solutions for the I-Drive District in the long-term. The technology rates very high in terms of rider experience, adaptability/maneuverability, and expandability. However, the limited capacity and low operating speeds of the current technologies are not consistent with the requirements for a full-scale, high-frequency transit operation needed in the I-Drive corridor.
3.2.2 Alignment Alternatives To arrive at the most operationally efficient and cost-effective transit alignment, the I-Drive TFATA study considered multiple corridor segments that provide opportunities for premium transit operations along I-Drive and Universal Boulevard. This section presents the screening process used to identify the preferred alignment, with regard to both routing and cross-sectional position.
Routing Selection A transit alignment along I-Drive from Sand Lake Road to Sea Harbor Drive, heading west along Sea Harbor Drive to SeaWorld, was identified as Alternative 1. Alternative 2 considers a shift of varying lengths of the I-Drive segment in Alternative 1 to Universal Boulevard. Both Alternatives 1 and 2 consider potential opportunities to extend the premium transit service north of Sand Lake Road as a subsequent project and include a spur along Destination Parkway to the east. Because Universal Boulevard is less developed, it is more feasible to extend the route with the transit vehicle operating in an exclusive lane.
To make the shift from I-Drive to Universal Boulevard, six routing options were considered, as shown in Figure 18. The first two options consider roads that presently serve as private access driveways behind Kings Dining & Entertainment and ICON Park. Other options consider transit operations on Via Mercado, Pointe Plaza Avenue, Convention Way, and a combination of Destination Parkway and Tradeshow Boulevard. As part of the I-Drive TFATA, improvements to Tradeshow Boulevard were evaluated; the concept recommended in the RCA includes considerations for median transit lanes that would provide continuity to the proposed transit lanes along the Kirkman Road extension project.

39 Transit Feasibility and Technology Assessment Report
Figure 18. Alternative 2 Routing Alignment Options
Because of the sparseness of existing development on Universal Boulevard relative to I-Drive, it was determined that Alternative 2 would utilize Via Mercado as the route to transition premium transit service from I-Drive to Universal Boulevard. The two options north of Via Mercado are on private property and required a significant transformation of the existing development with potential transit vehicle maneuverability issues. Other routing options south of Via Mercado do not efficiently serve main attractions along the I-Drive corridor, but could be revisited in future phases of the project as the surrounding land uses along Universal Boulevard are developed. Alternatives 1 and 2, shown in Figure 19, were identified as viable routing alignments and were evaluated as described in Section 4.0.

40 Transit Feasibility and Technology Assessment Report
Figure 19. Alternatives 1 & 2

41 Transit Feasibility and Technology Assessment Report
South of SR 528, additional routing options from I-Drive to SeaWorld were considered, including a service loop along Westwood Boulevard using Florida Festival Drive. This option would add direct service to apartments and hotels. However, the route would add a disproportionate amount of additional travel time, potentially causing scheduling issues that would require longer run times and more vehicles. Also, several of the hotels and commercial establishments served by this proposed loop are within walking distance of I-Drive. Thus, for Alternatives 1 and 2, the route continues along Sea Harbor Drive to SeaWorld and includes a station where Westwood Boulevard meets I-Drive.
Median vs Curbside Considerations The position of the premium transit alignment within the cross-section was also considered to determine viable alternatives. The assessment evaluated the potential impacts of the transit vehicles running along the curbside or running in the median. As shown in Figure 20, the two options for cross-section positions of the premium transit alignment include:
Curbside Running: The premium transit service would operate along the outside curb lane, sharing the I-Drive transit lanes with other existing transit services and right-turning passenger vehicles and trucks. South of Destination Parkway and along Destination Parkway, the premium transit service would operate in mixed traffic.
Median Running: The transit lane designation would shift to the lanes running along the median, and the premium transit service would operate within those lanes. Other existing transit services would be required to use left-door vehicles to serve stations located in the median. South of Destination Parkway and along Destination Parkway, the premium transit service would operate in mixed traffic.
Figure 20. Curbside (top) vs Median (bottom) Running
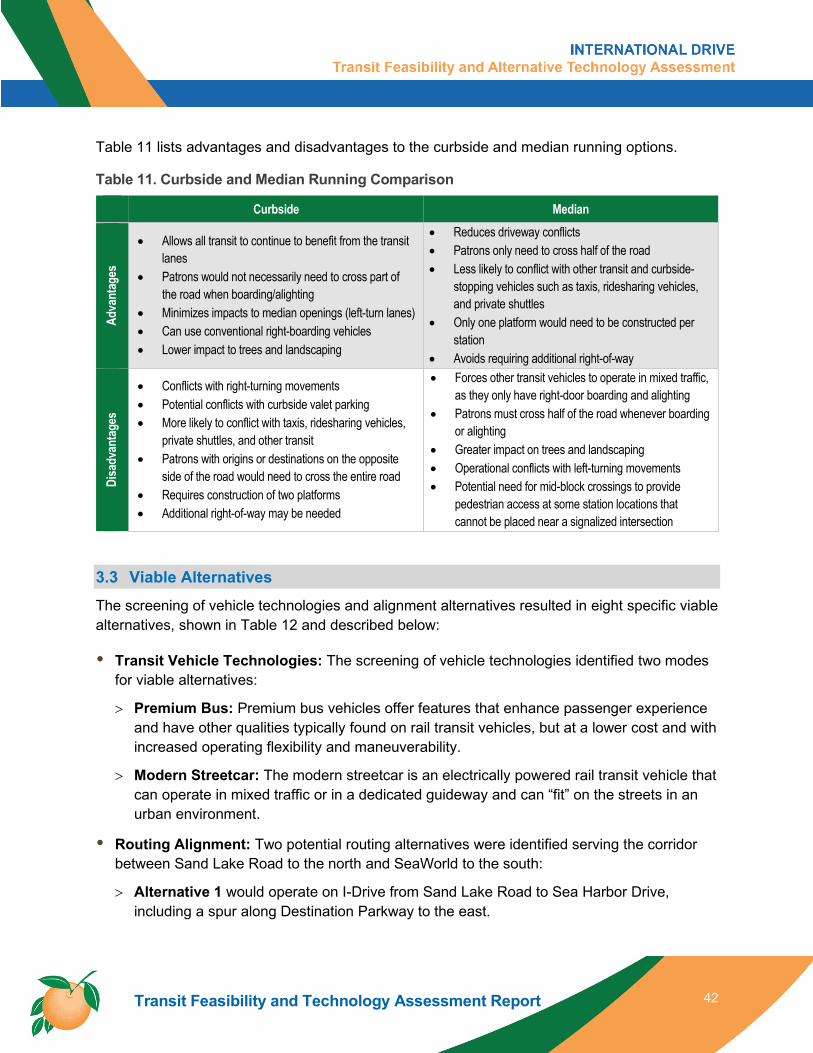
42 Transit Feasibility and Technology Assessment Report
Table 11 lists advantages and disadvantages to the curbside and median running options.
Table 11. Curbside and Median Running Comparison Curbside Median
Adva
ntag
es
• Allows all transit to continue to benefit from the transit lanes
• Patrons would not necessarily need to cross part of the road when boarding/alighting
• Minimizes impacts to median openings (left-turn lanes) • Can use conventional right-boarding vehicles • Lower impact to trees and landscaping
• Reduces driveway conflicts • Patrons only need to cross half of the road • Less likely to conflict with other transit and curbside-
stopping vehicles such as taxis, ridesharing vehicles, and private shuttles
• Only one platform would need to be constructed per station
• Avoids requiring additional right-of-way
Disa
dvan
tage
s
• Conflicts with right-turning movements • Potential conflicts with curbside valet parking • More likely to conflict with taxis, ridesharing vehicles,
private shuttles, and other transit • Patrons with origins or destinations on the opposite
side of the road would need to cross the entire road • Requires construction of two platforms • Additional right-of-way may be needed
• Forces other transit vehicles to operate in mixed traffic, as they only have right-door boarding and alighting
• Patrons must cross half of the road whenever boarding or alighting
• Greater impact on trees and landscaping • Operational conflicts with left-turning movements • Potential need for mid-block crossings to provide
pedestrian access at some station locations that cannot be placed near a signalized intersection
3.3 Viable Alternatives The screening of vehicle technologies and alignment alternatives resulted in eight specific viable alternatives, shown in Table 12 and described below:
Transit Vehicle Technologies: The screening of vehicle technologies identified two modes for viable alternatives:
> Premium Bus: Premium bus vehicles offer features that enhance passenger experience and have other qualities typically found on rail transit vehicles, but at a lower cost and with increased operating flexibility and maneuverability.
> Modern Streetcar: The modern streetcar is an electrically powered rail transit vehicle that can operate in mixed traffic or in a dedicated guideway and can “fit” on the streets in an urban environment.
Routing Alignment: Two potential routing alternatives were identified serving the corridor between Sand Lake Road to the north and SeaWorld to the south:
> Alternative 1 would operate on I-Drive from Sand Lake Road to Sea Harbor Drive, including a spur along Destination Parkway to the east.

43 Transit Feasibility and Technology Assessment Report
> Alternative 2 would operate on Universal Boulevard from Sand Lake Road to Via Mercado and then south on I-Drive (similar to Alternative 1) to Sea Harbor Drive, including a spur along Destination Parkway to the east.
Position Alignment: Each of the two routing alignments (Alternatives 1 and 2) were considered for operations in one of two possible position alignments in relation to the cross-section of the roadway:
> Curbside-Running would operate in shared curbside transit lanes (northbound and southbound) between Sand Lake Road and Destination Parkway, and then continue to operate in the curbside mixed traffic lane on Destination Parkway and on I-Drive south from Destination Parkway to Sea Harbor Drive, as well as on Sea Harbor Drive to the terminus stop near SeaWorld. In Alternative 2, this position would operate in a curbside lane on Via Mercado and north on Universal Drive.
> Median-Running would operate on inner lanes (northbound and southbound) adjacent to the median on I-Drive between Sand Lake Road and Destination Parkway, and then continue on the curbside mixed traffic lane on Destination Parkway, and back to median lane on I-Drive south to Sea Harbor Drive. With the implementation of median running lanes, the lanes constructed for the I-Drive transit lanes project would revert back to general purpose lanes. In Alternative 2, this position would operate on the curbside on Via Mercado and in median-running lanes on Universal Boulevard.
Table 12. Viable Alternatives
Viable Transit Alternatives Alternative 1 Alternative 2
Curb-Side Running Median Running Curb-Side
Running Median Running
Prem
ium B
us Alternative 1a Curb Premium Bus
Alternative 1b Median Premium Bus
Alternative 2a Curb Premium Bus
Alternative 2b Median Premium Bus
Mode
rn St
reetca
r
Alternative 1a Curb Streetcar
Alternative 1b Median Streetcar
Alternative 2a Curb Streetcar
Alternative 2b Median Streetcar

44 Transit Feasibility and Technology Assessment Report
3.4 Station and Transit Hub Locations
3.4.1 Standard Stations Locations and Characteristics Premium transit station locations were identified for the viable alternatives. This includes considerations for curbside and median-running transit alignments. Therefore, analysis for each station area includes considerations for curbside and median-running station locations, where applicable, with respect to the following criteria:
Land Use and Development - the efficient placement of stations with respect to surrounding land uses and major attractions is critical to enhancing customer’s overall accessibility and ability to reach their desired destination.
Multimodal Connectivity - transit stations that are strategically located to connect people to their destination by facilitating pedestrian/bicycle access and effective connections to other transit system services result in greater overall service attractiveness and efficiency.
Implementation & Impacts - the timing and ability to implement improvements to the transit system is influenced by the overall cost of such improvements. Transit station costs are greatly dependent on the availability of right-of-way, the need for relocating utilities or drainage structures, and long-term maintenance and operating costs.
The proposed stations for Alternative 1 and Alternative 2 are strategically located to provide a spacing of about 0.25 mile for the core area of the corridor while providing access to main attractions within the study area. Alternative 1 and Alternative 2 shared the same station locations south of Via Mercado. Figure 21 and Figure 22 illustrate the spacing of station areas and the main attractions within walking distance. Further details about the station area assessment can be found in the Appendix B.

45 Transit Feasibility and Technology Assessment Report
Figure 21. Alternative 1 Stations Locations

46 Transit Feasibility and Technology Assessment Report
Figure 22. Alternative 2 Stations Locations
3.4.2 Transit Hub Options To identify sites that could help transit passengers conveniently transfer at one location to a different route or service to complete their trip, an assessment of potential transit hubs for the I-Drive TFATA study area was conducted. Transit hubs can be designed to accommodate a variety of transit modes and services, and to provide a safe and comfortable waiting area for passengers and information on transit schedules. This assessment considered five sites, shown in Figure 23, for the one or more transit hubs that could facilitate connections between local transit routes serving the I-Drive District and regional transit services to the OIA, downtown Orlando, theme parks and attractions, and other areas. The analysis included a comprehensive evaluation to identify the advantages and disadvantages of each site based on the evaluation criteria initially referenced in Section 3.4.1: Land Use and Development, Multimodal Connectivity, and Implementation & Impacts. Further detail on each considered site can be found in Appendix C.

47 Transit Feasibility and Technology Assessment Report
Figure 23. Potential Transit Hubs
Site 1 - Destination Parkway SuperStop: The Destination Parkway Superstop is an existing LYNX transfer station. This facility provides direct access to the Hilton Orlando Hotel and serves the adjacent parking garage, dedicated to OCCC operations. Development near the site is presently sparse. However, future development plans associated with EPIC Universe and improvements to Tradeshow Boulevard will change development patterns in the area surrounding this site. Future planned developments in the vicinity of this site include affordable housing and expansions of the OCCC North/South Building and the Hilton Orlando Hotel. The implementation of a transit hub at this location facilitates connections and transfers with future transit services operating in the planned transit lanes along Tradeshow Boulevard, as well as existing and potential connections to downtown Orlando and OIA.

48 Transit Feasibility and Technology Assessment Report
Site 2 - I-Drive & Destination Parkway: At the southeast corner of the intersection of I-Drive and Destination Parkway lies a Mobil gas station, 7-Eleven convenience mart, and an Orange County building. These buildings would need to be acquired by Orange County to allow for the implementation of the transit hub facility and coordination with property owners will be required. Additionally, the county building that houses Human Resources for the OCCC would need to be relocated. Developing a transit hub at this location would potentially require environmental remediation due to its current gas station use.
Site 3 - I-Drive & Convention Way: This transit hub location would offer a central option on I-Drive, and provides direct access to the OCCC Campus with hotels, retail, and restaurants within a short walk. This site would facilitate connections with OCCC shuttle and circulator services, as well as PediCab services. However, connections to planned regional transit services operating along SR 528 from OIA and downtown Orlando would be challenging.
Site 4 - Convention Way across OCCC: This location provides access to OCCC and the Hyatt Regency; however, other developments along I-Drive and Universal Boulevard could be perceived as a far distance from the site. This site would require the premium transit service to deviate from its main route and no LYNX or I-Ride transit presently serves or is planned to serve this location.
Site 5 - Convention Way & Universal Boulevard: This location is adjacent to the back access areas of the OCCC North/South Concourses, and is a significant distance from activities on I-Drive. There is additional future development planned along Universal Boulevard and Convention Way that could be served by transit connections at this potential transit hub location. This site would require the premium transit service to deviate from its main route.
Transit Hub Assessment Results The assessment identifies the Destination Parkway SuperStop (Site 1) as the site that generally facilitates the implementation of a transit hub, while providing connectivity with existing and future regional and local transit services. This site would be served by planned regional transit services along SR 528, as well as future local transit services operating along the planned transit lanes on Tradeshow Boulevard. Moreover, this parcel is owned by Orange County, which eliminates the need for right-of-way acquisition.
4.0 EVALUATION OF VIABLE ALTERNATIVES The viable alternatives described in Section 3.3 were evaluated based on their general performance in meeting the goals of the project. Appendix D contains a detailed Transit Alternatives Comparison Matrix for the viable alternatives.
4.1 System Effectiveness The introduction of premium transit in the I-Drive District is intended to address the key operating parameters and characteristics that contribute to transit system performance and

49 Transit Feasibility and Technology Assessment Report
ridership. In summary, the key characteristics of the premium transit service to be introduced include:
Modern transit vehicle technology, including level boarding and multiple doors to improve convenience and timeliness of passenger boarding and alighting;
Higher service frequencies and reliable, on-time performance;
Operation in a dedicated guideway, in an exclusive or semi-exclusive transit lane minimizing delays due to operations in mixed traffic, including TSP and other measures to improve transit operating speeds;
Reasonable spacing of transit station stops so that there is convenient access for passengers while minimizing travel time for the transit vehicle;
Station amenities including safe, secure, and well-lit station platforms with shelters providing protection from sunlight and rain; and
Real-time information communicating to passengers the arrival time of the next available vehicle at the station stop as well as accessible on smartphone and/or website.
4.2 Transit Operating Plan To assess the effectiveness of the viable alternatives, a full range of operating statistics was developed, including: corridor or alignment lengths, vehicle travel speeds, span of service, headway, peak service span, days of operation, number of days of operations per year and, in the case of streetcar, the number of vehicles in a consist (train), as well as dwell times, layover, turnaround of the vehicles and annual miles and hours of service. The Premium Transit Operating Plan provides details on the operating plan analysis.
The operating assumption for all services includes start of service at 6:00 a.m. daily and continuing to 1:00 a.m. daily. This 19-hour span occurs 7 days per week. Headways are 10 minutes all day and every day, requiring 7 vehicles per hour. For this analysis, the assumption is that the service operates 254 weekdays and 111 weekends and holidays, or 365 days per year. For the streetcar service, the trains will run with a one car consist at all times. The one-way travel time (based on assumed average travel speeds), cycle time, and one-way distance calculations assumed an average transit vehicle speed of 12 mph due to the anticipated use of the I-Drive transit lanes by right-turning vehicles and other transit vehicles associated with LYNX local buses, the I-Ride Trolley vehicles, and OCCC hotel shuttles. Average dwell time per stop is assumed to be 30 seconds for all alternatives. Details of the operating plan for each viable alternative are inTable 13 and Table 14.

50 Transit Feasibility and Technology Assessment Report
Table 13. Viable Alternatives Weekday Operating Plan
Alternative Weekdays
of Operation
Weekday Peak Weekday Off-Peak Peak
Frequency Peak Span
Peak One-Way Trips
Off-Peak Frequency
Off-Peak span
Off-Peak One Way
Trips Premium Bus Alt 1a (Curb Premium Bus)
254 10 min 4 hrs 24 trips 10 min 16 hrs 96 trips Alt 1b (Median Premium Bus) Alt 2a (Curb Premium Bus) Alt 2b (Median Premium Bus) Streetcar Alt 1a (Curb Streetcar)
254 10 min 4 hrs 24 trips 10 min 16 hrs 96 trips Alt 1b (Median Streetcar) Alt 2a (Curb Streetcar) Alt 2b (Median Streetcar)
Table 14. Viable Alternatives Weekend Operating Plan
Alternative Weekend Days of Operation
Weekend Frequency Span One-Way Trips
Premium Bus Alt 1a (Curb Premium Bus)
111 10 min 20 hrs 120 trips Alt 1b (Median Premium Bus) Alt 2a (Curb Premium Bus) Alt 2b (Median Premium Bus) Streetcar Alt 1a (Curb Streetcar)
111 10 min 20 hrs 120 trips Alt 1b (Median Streetcar) Alt 2a (Curb Streetcar) Alt 2b (Median Streetcar)
There are different operating assumptions for streetcars and premium bus vehicles. Streetcars have an operator compartment and vehicle controls at each end of the vehicle, which means that turning the vehicle around is a matter of the operator securing the vehicle in place and walking from one end to the other. Therefore, the dwell time at the end of the streetcar lines is assumed to be 120 seconds, or 2 minutes at each end of the line. There are no additional route miles for streetcars.
For the premium bus vehicles, the turnaround is more involved, adding time and route miles. With the doors on the right side of the vehicles, the buses need to position for the trip in the opposite direction by physically turning around on adjacent streets. For the north portion of the routes, there are three turnaround options for Alternative 1 and three turnaround options for Alternative 2. For Alternative 1, the turnaround options are (with added route miles): Western Loop (.83 mile), via Canada Avenue (1.26 miles), and via Universal Boulevard (1.66 miles). For Alternative 2, these options are: Wawa (0.42 mile), Lakehurst (1.5 miles), I-Drive (1.78 miles). These options are depicted in Figure 24 and Figure 25.

51 Transit Feasibility and Technology Assessment Report
Figure 24. Alternative 1 Bus Turnaround Options North Portion of Alignment
Figure 25. Alternative 2 Bus Turnaround Options North Portion of Alignment
At the south end of the line, there are three turnaround options for Alternatives 1 and 2, shown in Figure 26. For Alternative 1 and Alternative 2, the routes and added route miles are the same. They are: Renaissance Inn (1.1 miles), SeaWorld (0.47 mile), and Central Florida Parkway (1.84 miles).

52 Transit Feasibility and Technology Assessment Report
Figure 26. Bus Turnaround Options South Portion of Alignment
To estimate operational statistics such as total distance and time for the premium bus alternatives, one turnaround option was selected for Alignment 1 (Western Loop) and one for Alignment 2 (Wawa option). This assumption will add 1.26 miles and 6.3 minutes, and .42 miles and 2.1 minutes respectively to the base statistics for Alternatives 1 and 2. The SeaWorld option was assumed for the southern location for both alternatives. This option adds 0.47 mile and 2.4 minutes to the base statistics for Alternative 1 and Alternative 2. The premium bus vehicles also have recovery time at the ends of the line for 120 seconds or 2 minutes, same as the streetcars.
Travel times, cycle times, and one-way distances were calculated for the eight viable alternatives based on the operating plan, turnaround options, and average speeds and dwell times. The total one-way travel times (based on assumed average travel speeds), station to station distances, acceleration and deceleration rates of the vehicles, assumed dwell times at each station, and recovery time at the end of the lines were identified. The travel time calculations assume an average transit vehicle speed of 12 mph and average dwell time per stop of 30 seconds for all alternatives. A recovery time of 2 minutes was assumed at the north and south ends of line to allow the vehicles to get back on schedule and/or for the operators to have a relief break. Table 15 depicts the total running times by alternative.

53 Transit Feasibility and Technology Assessment Report
Table 15. Viable Alternatives Travel Times
Alternative Station to
Station Travel Time
Dwell Time Layover Time
Turnaround Time*
One-Way Travel Time **
Cycle Time ***
Premium Bus Alt 1a (Curb Premium Bus) 18.3 min 4.5 min
2.0 min 4.3 min 29.1 min 64.1 min Alt 1b (Median Premium Bus)
Alt 2a (Curb Premium Bus) 19.7 min 5.0 min 2.3 min 29.0 min 63.8 min Alt 2b (Median Premium Bus) Streetcar Alt 1a (Curb Streetcar) 18.3 min 4.5 min
2.0 min 0.0 min 24.8 min 49.6 min Alt 1b (Median Streetcar)
Alt 2a (Curb Streetcar) 19.8 min 5.0 min 26.8 min 53.6 min Alt 2b (Median Streetcar) Note: * Turnaround time = ½ of total turnaround time to account for different patterns at north and south ends **One way travel time = station to station travel time + dwell time + layover + ½ total turnaround time ***Cycle time is the one-way travel time x 2 (for bidirectional service) +10% for bus options to account for traffic congestion during the turn around
The annual revenue hours, shown in Table 16, are determined by calculating the total running time for each trip multiplied by 120 trips per day multiplied by 365 service days per year. Annual revenue miles are a function of the number of trips multiplied by the distance. The one-way distance is multiplied by two to account for both directions, multiplied by 120 trips per day, and multiplied by 365 days per year to result in the total annual revenue miles.
Table 16. Viable Alternatives Operating Hours and Operating Miles
Alternative Annual Vehicle Revenue Hours
Annual Vehicle Revenue Miles
Premium Bus Alt 1a (Curb Premium Bus)
51,100 381,060 Alt 1b (Median Premium Bus)
Alt 2a (Curb Premium Bus) 369,672 Alt 2b (Median Premium Bus)
Streetcar Alt 1a (Curb Streetcar) 36,500 306,600 Alt 1b (Median Streetcar) Alt 2a (Curb Streetcar) 43,800 330,252 Alt 2b (Median Streetcar)
Note: One-way distance is ½ of the total travel distance including the turnaround for premium bus options
The number of peak vehicles needed to provide the service is determined by calculating the run time per trip and number of trips per hour based on the proposed headways. The total number of vehicles is calculated by taking the peak vehicle fleet and multiplying by the spare ratio, which

54 Transit Feasibility and Technology Assessment Report
calculates the needed number of spare vehicles. Table 17 depicts the peak, spare and total number of vehicles needed for each alternative.
Table 17. Viable Alternatives Peak, Spare and Total Vehicles
Alternative Peak Vehicles Spare Vehicles Total Vehicles
Premium Bus Alt 1a (Curb Premium Bus)
7 3 10 Alt 1b (Median Premium Bus) Alt 2a (Curb Premium Bus) Alt 2b (Median Premium Bus) Streetcar Alt 1a (Curb Streetcar) 5
2 7 Alt 1b (Median Streetcar)
Alt 2a (Curb Streetcar) 6 8 Alt 2b (Median Streetcar)
4.3 System Operations and Maintenance Cost Although other operating statistics were calculated, only one variable unit cost was identified for the O&M cost model. The Cost per Revenue Hour is the average cost for a transit vehicle to supply transit services to the public for one hour of revenue service. This includes wages and benefits of operators, and other personnel directly involved in providing the service, among other operating expenses.
Costs per revenue hour were developed based on experiences with and knowledge of other systems that currently operate similar services or have been or are being planned for. Costs for these peer-city transit services were derived from known planning project values used to estimate future planning level costs, actual operating data, which was pulled from Federal Transit Administration (FTA) National Transit Database (NTD) for existing systems, or a combination of these. Appropriate inflation factors were used to bring previous year costs from their base year into current year constant 2020 dollars. An average annual inflation factor of 1.5% per year was used to inflate the costs as needed.
The O&M costs were calculated by multiplying the hours, miles, peak vehicles and guideway miles by the unit costs by mode. The O&M cost estimates expressed in 2020 constant dollars are summarized in Table 18.

55 Transit Feasibility and Technology Assessment Report
Table 18. Viable Alternatives Total O&M Costs
Alternative Cost per Revenue Hour O&M Estimate (in $Millions 2020)
Premium Bus Alt 1a (Curb Premium Bus)
$94 $4.8 Alt 1b (Median Premium Bus) Alt 2a (Curb Premium Bus) Alt 2b (Median Premium Bus) Streetcar Alt 1a (Curb Streetcar)
$226 $8.2 Alt 1b (Median Streetcar)
Alt 2a (Curb Streetcar) $9.9 Alt 2b (Median Streetcar)
4.4 Fare Structure and Transfer Policy Orange County, LYNX, I-Ride Trolley and key stakeholders will need further discussion and consensus on development of a long-term fare structure and transfer policy for the I-Drive Premium Transit service as well as other transit operations in the corridor. The current operating plan assumes a $2.00 adult fare for a single trip and a $5.00 one-day pass, which is consistent with the current LYNX and I-Ride Trolley fares. The operating plan also assumes free transfers between the premium bus and other services. These fare and transfer assumptions are also consistently applied for ridership estimates, implementation plan and other relevant analysis.
The operating plan also assumes implementation of an off-vehicle ticket and payment system for the I-Drive Premium Bus Transit service, which will result in quicker boarding times and reduced dwell times for premium service vehicle operations on I-Drive. Ticketing equipment, supplemented by electronic fare payment options, will be included in the station stop infrastructure and design, and in the TFATA project capital cost estimate.
4.5 Ridership Estimates Transit ridership was estimated using the FTA forecasting tool known as Simplified Trips-On-Project Software (STOPS) model. Ridership estimates were generated based on results of the STOPS ridership forecasting model as well as “off-model” trips based on the extensive Special Generator activity in the corridor. Further details are documented in the STOPS Model Ridership Results Technical Memorandum.
As shown in Table 19, the ridership estimates for the streetcar technology running along Alternative 1 and sharing the dedicated lane with other transit services will carry about 3,200 daily trips in the opening year (2025) and about 5,000 daily trips in 2045. Ridership will be slightly higher for the Alternative 2 alignment. Ridership for the premium bus is expected to be about 10 to 15% lower than the streetcar ridership on both alignments.

56 Transit Feasibility and Technology Assessment Report
Table 19. Ridership Estimates
Premium Bus Streetcar Alternative 1 Alternative 2 Alternative 1 Alternative 2
Year 2025 2045 2025 2045 2025 2045 2025 2045 Model Based daily ridership 1,000 2,200 1,050 2,350 1,350 2,650 1,400 2,950
Model Based Annual ridership 335,000 737,000 351,750 787,250 452,250 887,750 418,750 988,250
Total Annual ridership including
Special Event trips 930,950 1,498,000 947,700 1,548,250 1,048,200 1,648,750 1,064,950 1,749,250
Average weekday ridership on project
(includes all trip purposes) 2,800 4,500 2,900 4,700 3,200 5,000 3,200 5,300
Sensitivity analyses applying different assumptions were conducted to assess ridership. The results of the sensitivity analyses using the STOPS model indicate that with the premium transit service running on an exclusive lane and the remaining transit services operating in the general purpose lanes, ridership would likely increase by about 15%. If no fares are charged on the premium transit service, ridership may increase by about 35%.
4.6 Traffic Operations Future year traffic operational analyses were conducted for opening year 2025, interim year 2035, and design year 2045. For the viable alternatives, Synchro inputs such as truck percentages and PHFs, were carried forward from the Existing Year model. For each alternative, corridor cycle lengths and splits were optimized, giving consideration to high-volume cross-street movements. For Alternatives 1 and 2, transit phases were coded into Synchro as 12-second hold phases. Transit stops were not modeled in Synchro because each alternative has a dedicated transit lane where stopping does not impact traffic flow.
Network performance measures were used to compare the No-Build Alternative and viable alternatives on a system-level. Network results can objectively compare different alternatives. Details on the traffic analysis for the I-Drive TFATA are provided in the DTTER.
4.6.1 Opening Year In opening year 2025, operations for Alternatives 1 and 2 are similar to one another in both the AM and PM peak hours. This is because the roadway network along I-Drive and Universal Boulevard are mostly under capacity and are able to serve the study area travel demand. Although Alternatives 1 and 2 reserve signal time for transit phases, the traffic operations do not significantly degrade relative to the No-Build Alternative.
The results of the analysis are tabulated in Table 20. In the opening year 2025, the AM peak hour yields similar results with regard to average delay and total delay, with minor differences due to signal timing and transit phases in Alternatives 1 and 2. In the PM peak hour, the study

57 Transit Feasibility and Technology Assessment Report
area average delay for Alternatives 1 and 2 is only increased by 4 seconds per vehicle in the PM peak hour relative to the No-Build Alternative. Alternative 2 shows the lowest number of unserved vehicles in the PM peak hour due to the Tradeshow Boulevard improvements relative to the No-Build Alternative, and the transit signal phase being located at the intersection of Sand Lake Road and Universal Boulevard instead of Sand Lake Road at I-Drive relative to Alternative 1.
Table 20. Opening Year (2025) Network Performance Performance Measure No-Build Alternative Alternative 1 Alternative 2
2025 AM Peak Average Delay (sec/veh) 28 29 30
Total Delay (hr) 330 349 365 Number of Unserved Vehicles 0 21 38
2025 PM Peak Average Delay (sec/veh) 41 45 45
Total Delay (hr) 753 825 820 Number of Unserved Vehicles 564 678 476
4.6.2 Interim Year Traffic Operations In the interim year 2035, the traffic operations on Destination Parkway begin to show differentiation between the No-Build Alternative and Alternatives 1 and 2. Destination Parkway at Tradeshow Boulevard experiences LOS F in the No-Build Alternative because there is only one eastbound left-turn lane and one southbound right-turn lane whereas Alternatives 1 and 2 include eastbound dual left-turn lanes and dual southbound right-turn lanes. I-Drive at Destination Parkway experiences LOS F in the PM peak hour in the Alternatives 1 and 2 because they have a transit signal hold phase that is not in the No-Build Alternative.
Network The network results for the interim year 2035 are displayed in Table 21. The No-Build Alternative has the lowest delay and number of unserved vehicles. In the Alternatives 1 and 2, the delay is similar but the number of unserved vehicles is lower in Alternative 2.
Table 21. Interim Year (2035) Network Performance Performance Measure No-Build Alternative Alternative 1 Alternative 2
2035 AM Peak Average Delay (sec/veh) 38 43 43
Total Delay (hr) 571 634 639 Number of Unserved Vehicles 174 473 492
2035 PM Peak Average Delay (sec/veh) 48 53 52
Total Delay (hr) 998 1,104 1,077 Number of Unserved Vehicles 928 1,270 1,413

58 Transit Feasibility and Technology Assessment Report
4.6.3 Design Year Traffic Operations In the design year 2045, the less effective network operations are driven by key intersections such as I-Drive at Sand Lake Road, I-Drive at Destination Parkway, and Universal Boulevard at Sand Lake Road. The remaining intersections are generally under capacity, with an intersection LOS of E or better.
Network The network results for the design year 2045 are displayed in Table 22. In the design year 2045, Alternatives 1 and 2 are slightly worse than the No-Build Alternative in all of the reported metrics, which reflects the installation of transit signal phases. However, the unserved demand for Alternatives 1 and 2 in the PM peak hour between 2,033 and 2,153 vehicles indicates that network degradation is not primarily due to transit signal installation, and the No-Build Alternative cannot accommodate the vehicular demand.
Table 22. Design Year (2045) Network Performance Performance Measure No-Build Alternative Alternative 1 Alternative 2
2045 AM Peak Average Delay (sec/veh) 49 54 56
Total Delay (hr) 867 936 968 Number of Unserved Vehicles 1,230 1,379 1,490
2045 PM Peak Average Delay (sec/veh) 61 62 62
Total Delay (hr) 1,407 1,468 1,445 Number of Unserved Vehicles 2,095 2,153 2,033
4.6.4 Right-Turn Queues An additional assessment of the interaction of the transit and non-transit uses of the BAT lanes was conducted to determine if dwell time at the new premium transit stations would impact traffic operations. To make this determination, the distance between the stop bar and the new stations was used as a proxy for right-turn queue storage. Based on the assessment, it is not expected that right-turn operations at the signalized intersections are affected by transit operations. This implies that the right-turn movements at signalized intersections do not cause additional delays for transit vehicles beyond the normal corridor travel speeds. A major contributing reason for the limited interaction of the right-turn queue is that right-turning vehicles can complete the movement during the mainline through phase at most of the signalized intersections.
4.6.5 Curbside vs. Median Transit Lane Traffic Operations The impact of median running transit lanes versus curbside running transit lanes on general vehicular traffic operations was evaluated as part of the DTTER. The analysis uses three primary metrics: increased signal delay due to a required transit hold phase; eliminated lane(s) due to transit lane alignment; and increased pedestrian calls due to a nearby transit stop

59 Transit Feasibility and Technology Assessment Report
location. Right-turn lane elimination was not a primary consideration since the movement could still occur during the through phase of the signal, which is typically allocated the most green time in a signal cycle. However, left-turn lane elimination or signalization may require a permitted movement to become protected only, reduce the total lanes on the intersection approach, or reroute movements to a different intersection to complete the left-turn movement. The DTTER analysis found that median transit lanes have more adverse impacts to vehicular traffic operations than the curbside running lanes.
4.7 Opinions of Probable Capital Costs The opinion of probable capital costs was determined using historical pricing of construction of a similar alignment type and vehicle technology. Engineering, guideway, utilities, structures, stations, systems, fare collection equipment, professional services, and contingencies were included in each cost estimate using the standard FTA Standard Cost Categories (SCC). It is important to note that these costs are not intended to be detailed capital cost estimates based on detailed design, but rather are to be used as preliminary capital cost estimates to aide in decision making based on order of magnitude differences between alternatives, alignments and technologies during conceptual planning phases.
The estimate includes only those improvements necessary for construction of the premium transit service. Betterments such as streetscape, street lighting, communication systems, roadway improvements outside of the guideway, or costs listed in the assumptions below are not included in this estimate. In general, the reported cost is the estimate to build a premium transit system within the existing curbs. These costs were estimated in both the current year (2020) and the year of expenditure (YOE) dollars, assumed as 2025 for the midpoint of construction. The level of design is still conceptual; therefore, most items in the capital cost estimates are represented as allowances, which in effect act as “place-holders” until further analysis and level(s) of design can identify the quantifiable items needed to develop a more accurate capital cost estimate.
4.7.1 Capital Cost Assumptions The following general and specific assumptions have been applied in the identification of cost components, quantities and unit costs.
Base costs are presented in 2020 constant dollars. YOE costs are 2020 costs inflated to 2025 (assumed as the mid-point of construction) at a 3% annual escalation rate, consistent with FTA guidance.
A combination of allocated and unallocated contingencies has been applied to the cost estimates. Allocated contingencies have been applied as a percentage of cost components and categories (ranging from 10% to 30%), and an overall 20% unallocated contingency has been applied to the total project costs.

60 Transit Feasibility and Technology Assessment Report
Position Alignments - Assumptions Both curbside and median platforms are assumed to facilitate level boarding with an elevated
curb height (typically 8 to 14 inches). If the platforms are to be shared use with other buses, the stops may need to be multi-level to provide access to both vehicle types.
Utility locations were provided for the I-Drive transit lane project (from Jamaican Court to Destination Parkway). The proposed station locations were reviewed for utility conflicts. It was assumed that the thickened slab stations can be placed over buried utilities (as would be assumed for driveway and sidewalk slabs), with the exception of utility vaults and manholes that were avoided in the alignment/station concepts.
A consistent station footprint was defined for station locations identified for curbside and median alignments. Platforms for both median and curb-running alignments are assumed to be 10 feet deep and 80 feet long with a 2 feet construction and landscaping buffer around three sides of the perimeter.
Vehicle Technologies – Assumptions Modern Streetcar:
> Range of vehicle size / dimensions, assume single car consist, multiple doors, low-floor
> Streetcar vehicles compatible with U.S. Buy America requirements.
> Allowance of $5.2 million per vehicle, plus a 10% allocated contingency.
Premium Bus:
> Range of vehicle size / dimensions, multiple doors, low-floor
> Premium bus vehicles compatible with U.S. Buy America requirements.
> Allowance of $1.0 million per vehicle, likely to support acquisition and implementation of 60’ articulated hybrid electric vehicle, plus a 10% allocated contingency.
4.7.2 Capital Cost Components The major cost components are intended to capture the key cost drivers associated with each alternative under consideration. Cost components are consistent with the FTA SCC, and costs for each alternative are organized and presented in the SCC format.
Guideway and Track Elements
Streetcar Guideway - This category includes costs for excavation and embankment to bring existing grade to subgrade and finishing the subgrade for the curbside, as well as median running alignments along the entire route from Sand Lake Road to Sea Harbor Drive, including the spur on Destination Parkway. For the curbside streetcar alternatives, rail is included along the I-Drive transit lanes from Sand Lake Road to Destination Parkway. For all remaining segments of the

61 Transit Feasibility and Technology Assessment Report
curbside and median-running alignments, rail is included on existing general purpose lanes. An aggregate base under the track slab is included in the estimate, along with geotextile materials and track drains. Earthwork and aggregate items are quantified by the cubic yard and/or ton as customarily included in bid documents, and geotextiles are quantified by the square yard.
Track Embedded - This category includes costs to acquire and build approximately 34,500 track feet (median-running) to 36,400 track feet (curb-running) of embedded track. Included are costs associated to furnish and install the reinforced concrete slab, insulated rail, and other track materials. The vehicle maintenance facility and storage yard embedded track (1,200 feet) is also included in this category (though it is often reported as yard track within SCC 30 Facilities). Costs for the track and other track materials included in the estimate are based on quoted budgetary material prices for recent U.S. streetcar projects.
Special Trackwork (Switches, Turnouts) - Special track work includes turnouts, bumping posts, major interchanges (grand union), and transition rail. The preliminary design and cost estimate include six turnouts and two half grand unions (at I-Drive and Destination Parkway and at Tradeshow and Destination Parkway). Special track is quantified by each unit and is made up of costs to furnish and install the reinforced concrete slab, and turnout. Cost estimates for turnouts and half grand unions are based on costs experienced in recent U.S. streetcar projects.
Premium Bus Guideway - This category includes an allowance of $0.4 million per guideway mile, including any additional improvements need to improve the I-Drive transit lanes, and treatment for mixed traffic lanes on the remainder of the alignment. For the curbside premium bus alignment alternatives, the guideway operates along the I-Drive transit lanes from Sand Lake Road to Destination Parkway. For all remaining segments on the curbside and median-running alignments, the guideway will be implemented on existing general purpose lanes with mixed traffic.
Stations, Stops, Terminals, Intermodal Station costs include capital costs for fixed facilities and infrastructure (platforms, shelters, seating, and railings), as well as station amenities (lighting, screening, signage and communication systems, and kiosks). Basic dimensions and amenities are identical for the streetcar and premium bus alternatives. Number and type of stations do differ between the curbside (20 side platforms) and median-running alignments (3 side platforms, 8 center platforms). There is only a minor cost difference per station between the streetcar and premium bus alternatives, reflecting additional station accommodations required for rail systems.
Support Facilities
Yard, Shops, Administrative Building Streetcar – The definition of the streetcar alternatives and the capital cost estimate have assumed the design and construction of a new, specialized vehicle maintenance and storage

62 Transit Feasibility and Technology Assessment Report
facility (VMSF) to accommodate up to 15 modern streetcar vehicles (to support estimated total vehicle requirements for the project and potential future expansion) and provide service to the overall program. It is also assumed that the facility would include space for equipment and spare parts, as well as a building to support management, administration, and operations staff. Also included are costs for major equipment needs and sitework in the vicinity of the VMSF site. The preliminary capital cost estimate for this facility is based on recent costs experienced in other modern streetcar projects in the U.S. and for comparable-sized facilities and vehicle fleets.
Premium Bus - The cost estimate assumes no costs in this category. It was assumed that existing or expanded bus maintenance facilities would be available for storage and maintenance of the I-Drive premium bus fleet, either by the local transit providers, or through private contracting. This assumption will be re-examined and any cost estimate adjustments incorporated in future phases of this project.
Sitework and Special Conditions
Demolition, Clearing, and Earthwork This category typically includes costs for demolition of quantifiable existing infrastructure and an allowance for other unquantifiable elements that may be defined as the design progresses, such as project site clearing, demolition, and fine grading. Costs are identical for the streetcar and premium bus alternatives, with an allowance of $0.5 million per guideway mile applied in the estimate.
Site Utilities and Utility Relocation This category typically includes the capital costs for constructing drainage, water and sewer improvements, new or modified street lighting, and relocating or adjusting existing public and private utilities that need to be moved to facilitate project construction. Allowances for utilities and drainage are included in the cost estimate and are typically similar for the streetcar and premium bus alternatives, ranging from $1.1 to $1.3 million per guideway mile for utilities and $0.3 million per guideway mile for drainage modifications.
Environmental Mitigation This category includes costs for mitigation of environmental conditions along the transit guideway. An allowance for environmental mitigation has been applied at $0.05 million per guideway mile for the streetcar and premium bus alternatives.
Roadways, Access-ways and Parking Lots This category includes construction of various asphalt and concrete pavement sections and curb and gutter, and the installation of pavement markings and roadway signage. Allowances for roadway work are included in the cost estimate and differ by technology, ranging from $1.2 million per guideway mile for streetcar to $0.24 million per guideway mile for premium bus, reflecting higher costs for roadway work in relation to rail tracks in the guideway.

63 Transit Feasibility and Technology Assessment Report
Maintenance of Traffic and Other Indirect Costs during Construction This category includes costs associated with contractor mobilization, traffic control/maintenance of traffic, and temporary erosion control. Allowances for maintenance of traffic are included in the cost estimate and differ by technology, ranging from $0.5 million per guideway mile for streetcar to $0.27 million per guideway mile for premium bus. Allowances for contractor indirect costs are also included in the cost estimate and are consistent for both technologies at 15% of direct construction costs.
Systems
Train Control and Signals Streetcar - This category includes allowance for providing control points and connected vehicle interfaces along the corridor and at key locations. Costs are based on experience on other streetcar projects.
Premium Bus - This category is not applicable.
Traffic Signals This category includes new construction, modifications, and/or upgrades at various intersections along the alignment. Cost estimates are typically similar for the streetcar and premium bus alternatives, ranging from $0.22 million per 18 intersections for complex traffic signals, $0.125 million per six modified traffic signals, and an allowance for TSP at $0.28 million per route mile.
Traction Power Supply: Substations Streetcar – This category includes cost for electric traction power substations (TPSS) located throughout the alignment. TPSS costs are estimated at $2.5 million per 3.4 route miles, consistent with experience on recent streetcar projects. The cost estimate assumes that the majority of the streetcar alignment would operate “on-wire” for electric power supply.
Premium Bus – Electric vehicle power charging stations costs are not included. Costs would vary based on the type of premium bus.
Traction Power Distribution: Catenary and Third Rail Streetcar - This category includes improvements required to distribute power across the project alignment. Costs include overhead contact system (OCS) poles and foundations and various assemblies, assuming $1.3 million per track mile, consistent with experience on recent streetcar projects. The cost estimate assumes that the majority of the streetcar alignment would operate “on-wire” for electric power supply.
Premium Bus – This category is not applicable.

64 Transit Feasibility and Technology Assessment Report
Communications This category includes allowances to provide new fiber conduit and cabling along the total length of the alignment. An allowance has been applied at $0.35 million per guideway mile for the streetcar and premium bus alternatives.
Fare Collection System and Equipment This category includes allowances to provide new fiber conduit and cabling along the total length of the alignment. An allowance has been applied at $30,000 per 40 pieces of fare equipment for the streetcar and premium bus alternatives.
Right-of-Way
Purchase or Lease of Real Estate This category includes anticipated costs to acquire property necessary to locate and construct any segments of the transit guideway, station stops, power substation equipment, and the VMSF. A primary goal of the conceptual design effort has been to utilize existing right-of-way to every extent possible for the transit guideway, stations, and VMSF. Some of the identified station platforms encroach into existing pedestrian easements outside of the right-of-way line. These stations are listed in Table 23. Orange County will need to verify if these easements can be used for the premium transit stations platforms.
Table 23. Conceptual Right-of-Way Requirements
Station Right-of-Way Area Needed (sq. ft.)
Affected Property Owner Address Parcel ID
ICON Park (NB) 560 Orlando Hotel International SPE LLC 8255 INTERNATIONAL DR 36-23-28-7168-02-001 ICON Park (SB) 640 8400 I-Drive LLC 8400 INTERNATIONAL DR 36-23-28-7164-02-005 Austrian Row (NB) 560 MWK Investments, Inc. 8625 INTERNATIONAL DR 36-23-28-7176-01-003 Pointe Plaza Avenue (SB) 640 Convention Hotel Partners, Inc. 9700 INTERNATIONAL DR 01-24-28-7158-02-003 SeaWorld (NB/SB) 640 SeaWorld of Florida, Inc. 7007 SEAWORLD DR 12-24-28-7874-00-010
The current estimate does not include any right-of-way costs. The transit guideway is on publicly owned roadways, and the potential VMSF site for the streetcar alternative is located on County-owned property. There are two potential remaining costs pending for inclusion in this category: some additional right-of way for station areas and potential right-of-way for location of streetcar TPSS power substations should that alternative be chosen. These costs can be re-examined in further project development and design.
65 Transit Feasibility and Technology Assessment Report
SCC 70 Vehicles
Streetcar This category includes allowances to purchase of seven or eight new modern streetcar vehicles compatible with U.S. Buy America requirements, along with procurement and inspection support. The allowance for this cost estimate is set at $5.2 million per vehicle, plus a 10% allocated contingency.
Premium Bus This category includes allowances to purchase 10 new premium bus vehicles compatible with U.S. Buy America requirements, along with procurement and inspection support. The allowance for this cost estimate is set at $1.0 million per vehicle, likely to support acquisition and implementation of 60-foot articulated hybrid electric vehicle, plus a 10% allocated contingency.
SCC 80 Professional Services
Project Development This category includes costs associated with advancing the planning and project development, environmental reviews, and preliminary engineering efforts. An allowance reflecting 3% of direct construction costs has been applied to all alternatives.
Final Design This category includes unquantified allowances for final design and related preconstruction contracts. An allowance reflecting 8% of direct construction costs has been applied for all alternatives. No decisions have been made at this time regarding project delivery method, selection of which could impact this cost category.
Project Management for Design and Construction This category includes allowances for agency and consultant project management efforts and public outreach costs throughout the life of the project. An allowance reflecting 6% of direct construction costs has been applied for all alternatives. No decisions have been made at this time regarding project delivery method, selection of which could impact this cost category.
Construction Administration and Management This category includes allowances for construction administration and management. An allowance reflecting 6% of direct construction costs has been applied for all alternatives. No decisions have been made at this time regarding project delivery method, selection of which could impact this cost category.

66 Transit Feasibility and Technology Assessment Report
Insurance and Legal This category includes an allowance for insurance and legal representation and permitting and review fees by other outside agencies. An allowance reflecting 1% for insurance and 2% for legal of direct construction costs has been applied for all alternatives.
Surveys, Testing, Investigation, Inspection This category includes an allowance for associated work. An allowance reflecting 2% of direct construction costs has been applied for all alternatives.
Start Up Startup efforts include preparation of standard operating procedures, rulebooks, emergency preparedness and training, operator training, integrations support, and simulation of services. An allowance reflecting 2% of direct construction costs has been applied for all alternatives.
SCC 90 Unallocated Contingency A combination of allocated and un-allocated contingencies has been applied to the cost estimates, consistent with FTA guidelines. Allocated contingencies have been applied as a percentage of each cost component category (ranging from 10% to 30%). An overall 20% unallocated contingency has been applied to the total project costs. Table 24 lists the specific allocated and unallocated contingency percentages applied to each SCC cost category, consistently for each of the alternatives.
Table 24. Unallocated Contingencies Applied to Cost Components Cost Component Allocated
Contingency Unallocated Contingency
SCC 10 Guideway and Track Elements 30% 20% SCC 20 Stations, Stops, Terminal, Intermodal 20% 20% SCC 30 Support Facilities: Yard, Shops, Admin. Buildings 30% 20% SCC 40 Sitework and Special Conditions 30% 20% SCC 50 Systems 30% 20% SCC 60 Right-of-Way, Land, Existing Improvements 0% 20% SCC 70 Vehicles 10% N/A SCC 80 Professional Services 0% 20% SCC100 Finance Charges N/A N/A
SCC 100 Finance Charges According to FTA guidelines, it is optional to include any applicable finance charges in the SCC cost estimate. Since the project delivery method has not been determined and no specific funding and financial plan has been developed to date, this cost estimate does include an allowance of 1% of direct construction costs for finance charges for all alternatives. This assumption can be reevaluated as the financial plan is further developed.

67 Transit Feasibility and Technology Assessment Report
The capital cost estimates for the viable alternatives are summarized in Figure 25, with more detailed tables included in Appendix E.
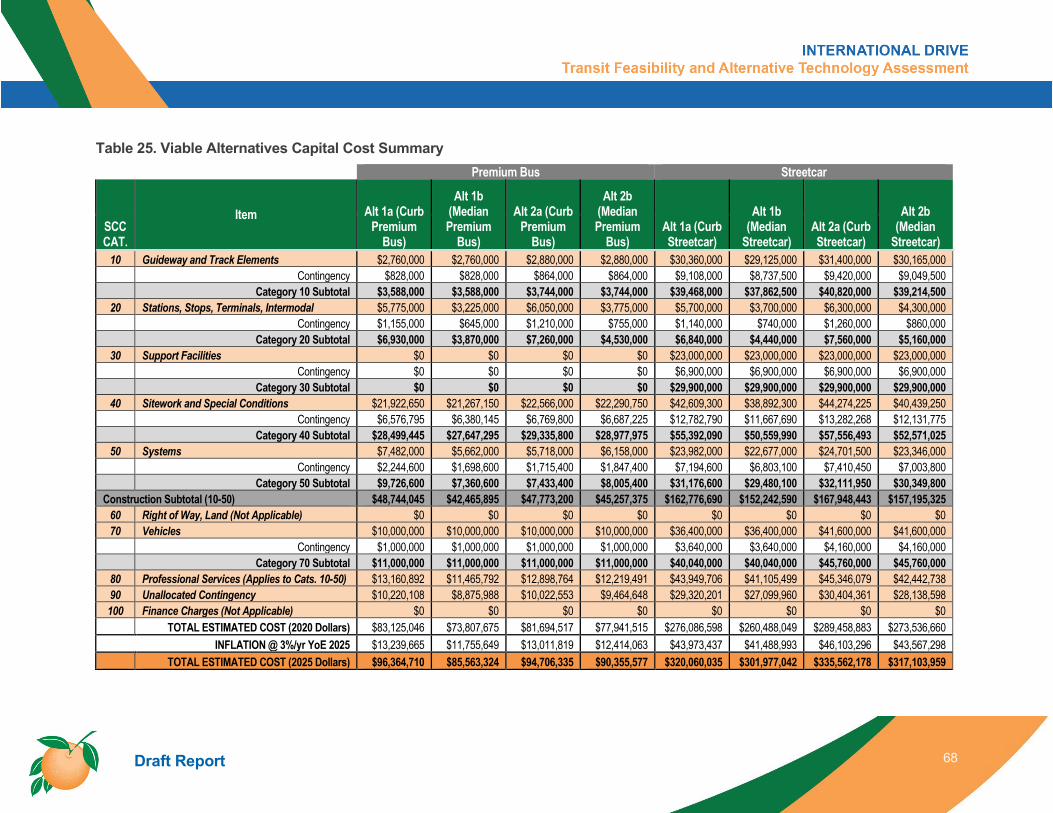
68 Draft Report
Table 25. Viable Alternatives Capital Cost Summary Premium Bus Streetcar
SCC CAT.
Item Alt 1a (Curb Premium
Bus)
Alt 1b (Median Premium
Bus)
Alt 2a (Curb Premium
Bus)
Alt 2b (Median Premium
Bus) Alt 1a (Curb Streetcar)
Alt 1b (Median
Streetcar) Alt 2a (Curb Streetcar)
Alt 2b (Median
Streetcar) 10 Guideway and Track Elements $2,760,000 $2,760,000 $2,880,000 $2,880,000 $30,360,000 $29,125,000 $31,400,000 $30,165,000 Contingency $828,000 $828,000 $864,000 $864,000 $9,108,000 $8,737,500 $9,420,000 $9,049,500 Category 10 Subtotal $3,588,000 $3,588,000 $3,744,000 $3,744,000 $39,468,000 $37,862,500 $40,820,000 $39,214,500
20 Stations, Stops, Terminals, Intermodal $5,775,000 $3,225,000 $6,050,000 $3,775,000 $5,700,000 $3,700,000 $6,300,000 $4,300,000 Contingency $1,155,000 $645,000 $1,210,000 $755,000 $1,140,000 $740,000 $1,260,000 $860,000 Category 20 Subtotal $6,930,000 $3,870,000 $7,260,000 $4,530,000 $6,840,000 $4,440,000 $7,560,000 $5,160,000
30 Support Facilities $0 $0 $0 $0 $23,000,000 $23,000,000 $23,000,000 $23,000,000 Contingency $0 $0 $0 $0 $6,900,000 $6,900,000 $6,900,000 $6,900,000 Category 30 Subtotal $0 $0 $0 $0 $29,900,000 $29,900,000 $29,900,000 $29,900,000
40 Sitework and Special Conditions $21,922,650 $21,267,150 $22,566,000 $22,290,750 $42,609,300 $38,892,300 $44,274,225 $40,439,250 Contingency $6,576,795 $6,380,145 $6,769,800 $6,687,225 $12,782,790 $11,667,690 $13,282,268 $12,131,775 Category 40 Subtotal $28,499,445 $27,647,295 $29,335,800 $28,977,975 $55,392,090 $50,559,990 $57,556,493 $52,571,025
50 Systems $7,482,000 $5,662,000 $5,718,000 $6,158,000 $23,982,000 $22,677,000 $24,701,500 $23,346,000 Contingency $2,244,600 $1,698,600 $1,715,400 $1,847,400 $7,194,600 $6,803,100 $7,410,450 $7,003,800 Category 50 Subtotal $9,726,600 $7,360,600 $7,433,400 $8,005,400 $31,176,600 $29,480,100 $32,111,950 $30,349,800
Construction Subtotal (10-50) $48,744,045 $42,465,895 $47,773,200 $45,257,375 $162,776,690 $152,242,590 $167,948,443 $157,195,325 60 Right of Way, Land (Not Applicable) $0 $0 $0 $0 $0 $0 $0 $0 70 Vehicles $10,000,000 $10,000,000 $10,000,000 $10,000,000 $36,400,000 $36,400,000 $41,600,000 $41,600,000 Contingency $1,000,000 $1,000,000 $1,000,000 $1,000,000 $3,640,000 $3,640,000 $4,160,000 $4,160,000 Category 70 Subtotal $11,000,000 $11,000,000 $11,000,000 $11,000,000 $40,040,000 $40,040,000 $45,760,000 $45,760,000
80 Professional Services (Applies to Cats. 10-50) $13,160,892 $11,465,792 $12,898,764 $12,219,491 $43,949,706 $41,105,499 $45,346,079 $42,442,738 90 Unallocated Contingency $10,220,108 $8,875,988 $10,022,553 $9,464,648 $29,320,201 $27,099,960 $30,404,361 $28,138,598 100 Finance Charges (Not Applicable) $0 $0 $0 $0 $0 $0 $0 $0
TOTAL ESTIMATED COST (2020 Dollars) $83,125,046 $73,807,675 $81,694,517 $77,941,515 $276,086,598 $260,488,049 $289,458,883 $273,536,660 INFLATION @ 3%/yr YoE 2025 $13,239,665 $11,755,649 $13,011,819 $12,414,063 $43,973,437 $41,488,993 $46,103,296 $43,567,298 TOTAL ESTIMATED COST (2025 Dollars) $96,364,710 $85,563,324 $94,706,335 $90,355,577 $320,060,035 $301,977,042 $335,562,178 $317,103,959

69 Draft Report
4.8 Environmental Considerations
4.8.1 Air Quality Impacts The proposed project is located in Orange County, an area currently designated as being in attainment with the Clean Air Act National Ambient Air Quality Standards (NAAQS) for all six criteria pollutants, including carbon monoxide (CO) and particulate matter (2.5 microns in size and 10 microns is size).
In accordance with the FDOT Project Development and Environment (PD&E) Manual, the project was subjected to a CO screening model that makes various conservative worst-case assumptions related to site conditions, meteorology, and traffic. The FDOT’s screening model for CO is based on United States Environmental Protection Agency (EPA) software, which produces conservative estimates of one-hour and eight-hour CO at default air quality receptor locations. The one-hour and eight-hour screening estimates can be directly compared to the current one-and eight-hour NAAQS for CO. The screening was performed for the project opening year (2025), interim year (2035,) and the design year (2045) at the intersection with a combination of the highest intersection approach volume and lowest approach speed along the project corridor, using FDOT’s most current air quality screening model, CO Florida 2012.
The roadway intersection forecasted to have the highest total approach traffic volume was International Drive and Sand Lake Road. The traffic forecasted volumes were based on the traffic demand on the roadway rather than the roadway capacity. Therefore, the No-Build, Alternative 1, and Alternative 2 scenarios were assumed to have the same traffic volumes for the project opening year (2025), the interim year (2035), and the project design year (2045). Estimates of CO were predicted for the default receptors (automatically assigned within the COFL 2012 screening software), which are located 10 feet to 150 feet from the edge of the roadway. Based on the results from the screening model, the highest project-related CO concentrations are below the NAAQS of 35 parts per million (ppm) for a one-hour concentration and 9 ppm for an eight-hour concentration for the three years evaluated. The full assessment of the air analysis is provided in the Air Quality Impact Technical Memorandum.
The project is not predicted to have substantial air quality impacts and has passed the NAAQS model screening. Construction activities may cause minor short-term air quality impacts in the form of dust from earthwork and unpaved roads. These impacts can be minimized by adherence to all applicable local and state regulations and application of appropriate construction specifications and procedures.
4.9 Alternatives Matrix The viable alternatives were evaluated based on their general performance in meeting the needs of the study area and consistency with the I-Drive TFATA goals and objectives. The comparison of viable alternatives also evaluates how each viable alternative performs with

70 Draft Report
respect to community and environmental impacts, traffic and pedestrian impacts, and constructability and operability. Figure 26 summarizes the results of the comparison of viable alternatives. The comparison matrix shown in Figure 27 provides details on the scoring of each alternative; a more detailed evaluation matrix is included in Appendix D.
Alternative 1a and Alternative 2a, curbside running using premium bus technology show an overall good score when compared to the other viable alternatives; however, Alternative 1a better meets the needs of the study area with respect to supporting multimodal activity, servicing diverse travel markets and needs, and sustaining economic competitiveness and development.
Alternative 1 better serves existing and key activity centers north of Via Mercado. This alternative also facilitates access to the public parking garage on I-Drive and Sand Lake Road, enhancing walkability within the I-Drive District and in consistency with the philosophy of “park once” highlighted in the I-Drive 2040 Vision Plan.
Table 26. Viable Alternatives Comparison Summary
EVALUATION SUMMARY Alt. 1a (Curb
Premium Bus)
Alt. 1b (Median Premium
Bus)
Alt. 2a (Curb
Premium Bus)
Alt. 2b (Median Premium
Bus)
Alt. 1a (Curb
Streetcar)
Alt. 1b (Median
Streetcar)
Alt. 2a (Curb
Streetcar)
Alt. 2b (Median
Streetcar)
Support Multimodal Activity Serve Diverse Travel Markets and Needs #REF! #REF! #REF! #REF! #REF! #REF! Sustain Economic Competitiveness and Development #REF! #REF! #REF! #REF! #REF! #REF! Community and Environmental Impacts Traffic and Pedestrian Impacts Constructability and Operability
Overall Summary
good fair poor

71 Transit Feasibility and Technology Assessment Report
Table 27. Viable Alternatives Comparison Scoring
EVALUATION SUMMARY Alt. 1a (Curb Premium Bus)
Alt. 1b (Median Premium Bus)
Alt. 2a (Curb Premium Bus)
Alt. 2b (Median Premium Bus)
Alt. 1a (Curb Streetcar)
Alt. 1b (Median Streetcar)
Alt. 2a (Curb Streetcar)
Alt. 2b (Median Streetcar)
Support Multimodal Activity Service to existing / planned regional and local transit hubs 1.00 1.00 1.00 1.00 1.00 1.00 1.00 1.00 Service to existing parking garage facilities 1.00 1.00 2.00 2.00 1.00 1.00 2.00 2.00 Average weekday ridership on project Opening Year 2025 2.00 2.00 2.00 2.00 1.00 1.00 1.00 1.00 Model Based Auto trip diversion (daily) Opening Year 2025 2.00 2.00 2.00 2.00 1.00 1.00 1.00 1.00
SUMMARY 6.00 6.00 7.00 7.00 4.00 4.00 5.00 5.00 Serve Diverse Travel Markets and Needs Population/Employment with 1/2 mile (2040) 2.00 2.00 2.00 2.00 2.00 2.00 2.00 2.00 Hotel population within 1/2 mile (2020) 2.00 2.00 2.00 2.00 2.00 2.00 2.00 2.00 Entertainment/tourism venues within 1/2 mile (2020) 1.00 1.00 2.00 2.00 1.00 1.00 2.00 2.00 Annual Special event trips Opening Year 2025 1.00 1.00 1.00 1.00 1.00 1.00 1.00 1.00 Percent of transit dependent trips 2.00 2.00 1.00 1.00 2.00 2.00 1.00 1.00 Pedestrian Accessibility 1.00 3.00 2.00 3.00 1.00 3.00 2.00 3.00
SUMMARY 9.00 11.00 10.00 11.00 9.00 11.00 10.00 11.00 Sustain Economic Competitiveness and Development Planned development within 1/2 mile (2020) 1.00 1.00 1.00 1.00 1.00 1.00 1.00 1.00 Direct connection between OCCC and key activity centers 1.00 1.00 2.00 2.00 1.00 1.00 2.00 2.00 Capital cost per mile (millions) 1.00 1.00 1.00 1.00 3.00 3.00 3.00 3.00 O&M cost per mile (millions) 1.00 1.00 1.00 1.00 3.00 3.00 3.00 3.00 Annualized cost (capital and O&M) per mile 1.00 1.00 1.00 1.00 3.00 3.00 3.00 3.00 Annualized cost (capital and O&M) per annual # passengers 1.00 1.00 1.00 1.00 3.00 3.00 3.00 3.00
SUMMARY 6.00 6.00 7.00 7.00 14.00 14.00 15.00 15.00 Community and Environmental Impacts # and % minorities within 1/2 mile (2020) 1.00 1.00 1.00 1.00 1.00 1.00 1.00 1.00 Access to community facilities 2.00 2.00 1.00 1.00 2.00 2.00 1.00 1.00 Impacts on trees and landscaping 1.00 2.00 1.00 2.00 1.00 2.00 1.00 2.00 Annual Monetized value of Air Quality Benefits Opening Year 2.00 2.00 2.00 2.00 1.00 1.00 1.00 1.00
SUMMARY 4.00 5.00 3.00 4.00 4.00 5.00 3.00 4.00 Traffic and Pedestrian Impacts Increased Signal Delay 1.00 2.00 1.00 2.00 1.00 2.00 1.00 2.00 # Driveways, parking entrances 2.00 1.00 2.00 1.00 2.00 1.00 2.00 1.00 Impacts to planned (I-Drive Lanes) left-turn lane operations 1.00 3.00 1.00 3.00 1.00 3.00 1.00 3.00
SUMMARY 4.00 6.00 4.00 6.00 4.00 6.00 4.00 6.00 Constructability and Operability Utility conflicts 1.00 1.00 1.00 1.00 2.00 2.00 2.00 2.00 Operability within planned I-Drive transit lanes 1.00 3.00 1.00 3.00 2.00 3.00 2.00 3.00 Requirements for the use of left-door transit vehicles 1.00 3.00 1.00 3.00 2.00 3.00 2.00 3.00 Flexibility for future system expansion 1.00 1.00 1.00 1.00 2.00 2.00 2.00 2.00
SUMMARY 4.00 8.00 4.00 8.00 8.00 10.00 8.00 10.00 Overall Summary 33 42 35 43 43 50 45 51
Overall Scoring Good (≤40) Fair (41 to 49) Poor (≥50)

72 Transit Feasibility and Technology Assessment Report
5.0 RECOMMENDED PREMIUM TRANSIT SYSTEM The I-Drive TFATA study completed a detailed evaluation of the viable alternatives to improve mobility in the I-Drive District. Based on the results from the evaluation of viable alternatives, the recommended premium transit system identifies a premium bus service operating on I-Drive from Sand Lake Road to Sea Harbor Drive including a spur on Destination Parkway, with 11 transit stations. As shown in Figure 27, this premium bus system would operate within the I-Drive transit lanes (northbound and southbound), and would operate in the curbside mixed traffic lane on Destination Parkway and on I-Drive south from Destination Parkway to Sea Harbor Drive as well as on Sea Harbor Drive to the proposed south end terminus stop near SeaWorld. These lanes would also accommodate the LYNX and I-Ride transit services. The recommended premium transit alignment plan sheets are provided in Appendix F.
The recommended premium bus stations are located at or near key activity centers, spaced in the core activity area at about every 0.25 mile, to minimize impacts to traffic, pedestrians, and landscaping along the alignment. Nine of the eleven stations have platforms in both the northbound and southbound direction, while two stations (Destination Parkway SuperStop and SeaWorld) have a shared single platform. Each of the stations have been conceptually designed as 80 feet in length and 8 to 10 feet in width with curb heights to accommodate level boarding and ADA accessibility. They are generally located on the far-side of signalized intersections within existing publicly owned right-of-way when feasible. Station design will be completed during a more advanced engineering phase, but current plans are to include passenger shelters, information kiosks, fare payment machines, real-time schedule information and other amenities.
The operating plan for the recommended premium transit system assumes hours of service starting at 6:00 a.m. daily and continuing to 1:00 a.m. daily. This 19-hour span occurs 7 days per week. Policy headways have been established as 10 minutes all day and every day. Based on the vehicle running time analysis and the estimated round-trip cycle time, the operating plan identifies that a total fleet of 10 premium bus vehicles are required.
The current operating assumption is that each of the premium bus vehicle trips will be scheduled to travel to and serve the Destination Parkway SuperStop station. The schedule and level of service to the Westwood Boulevard station could be adjusted as development increases around that station area and pedestrian access issues are addressed. However, the current operating plan assumes that each premium bus vehicle stops at each station on each vehicle trip.

73 Transit Feasibility and Technology Assessment Report
Figure 27. Recommended I-Drive Premium Transit System
Universal Boulevard
Sand Lake Road
Destination Parkway
Inter
natio
nal D
rive

74 Transit Feasibility and Technology Assessment Report
Orange County, LYNX, I-Ride Trolley and key stakeholders will need further discussion and consensus on development of a long-term fare structure and transfer policy for the I-Drive Premium Transit service as well as other transit operations in the corridor. A $2.00 adult fare for a single trip and a $5.00 one-day pass is assumed, which is consistent with the current LYNX and I-Ride Trolley fares. The operating plan also assumes free transfers between the premium bus and other services. These fare and transfer assumptions are also consistently applied for ridership estimates, financial plan and other relevant documents.
The implementation of an off-vehicle ticket and payment system for the I-Drive Premium Bus Transit service is recommended, which results in quicker boarding times and reduced dwell times for premium service vehicle operations on I-Drive. Ticketing equipment, supplemented by electronic fare payment options, are included in the station stop infrastructure and design, and in the TFATA project capital cost estimate.
5.1 Ridership Forecast The ridership forecasts for the I-Drive study were estimated using the STOPS travel modeling software. As shown in Figure 28, the recommended premium transit system is projected to carry about 1,000 trips in the opening year 2025 and about 2,200 trips in the long term. When ridership from Special Generators along the I-Drive corridor is included, the project is projected to carry 2,800 trips in the opening year and about 4,500 trips in the long term. The methodology used to estimate the Special Generators trips is described in the STOPS Model Ridership Results Technical Memorandum. The several existing park-and-ride (parking garage) facilities at I-Drive premium transit station locations will attract a significant number of transit trips that do not necessarily use the premium bus transit, but use other transit services in the area. The daily auto diversion in the opening year is about 1,400 and about 3,200 in the long term.
Sensitivity analyses, using the STOPS model, indicate that with the premium transit service running on an exclusive lane and the remaining transit services operating in the general purpose lanes, ridership is likely to increase by about 15%. If no fares are charged, ridership may increase by about 35% relative to the base case ridership.
The STOPS model development, implementation and calibration standards used in this analysis were designed to meet the needs of the I-Drive TFATA study and do not necessarily meet all of FTA’s technical requirements for STOPS ridership estimates to complete FTA Capital Investment Grant (CIG) funding eligibility and project ratings. However, the methodology and technical tools applied generate ridership estimates that can be applied for a consistent comparative assessment between alternatives. Moving forward, it is recommended that an updated and detailed Origin-Destination (O-D) survey be conducted to capture the visitor and non-visitor travel market be conducted and the results be incorporated in the STOPS model. Further, the model is recommended to be calibrated using a complete set of consistent station level boardings and updated demographic and land use input data.

75 Transit Feasibility and Technology Assessment Report
Table 28. Ridership Results for Recommended Premium Transit System Alternative 1 using Premium Bus technology running on
shared dedicated lane 2020 2025 2040 2045
Model Based daily ridership 900 1,000 2,000 2,200 Model Based work trips 550 572 1,383 1,515 Model Based non work trips 350 428 617 685 Percent of transit dependent trips 7.70% 7.59% 7.49% 7.49% Model based auto trip diversion (daily) 1,424 1,390 2,900 3,176 Daily VMT reduction -6,361 -5,199 -12,116 -13,270 Model Based Annual ridership 301,500 335,000 670,000 737,000 OFF-MODEL : Annual Special event trips- SeaWorld, Convention Center etc., (annual trips) 548,800 595,950 700,750 761,000
Total Annual ridership including Special Event trips 850,300 930,950 1,370,750 1,498,000
Average weekday ridership on project (includes all trip purposes) 2,600 2,800 4,100 4,500
As part of the analysis to examine transit ridership characteristics within the I-Drive District, surveys were conducted among I-Ride Trolley and LYNX passengers, as well as OCCC attendees; however the small number of responses to the survey were not enough for a statistically valid sample to be incorporated into the STOPS model. The survey results are documented in the Transit System Plan Analysis Report.
6.0 IMPLEMENTATION PLAN The FTA and the Federal Highway Administration (FHWA) (U.S. Department of Transportation [USDOT]) agencies) and the state FDOT have grant and funding programs that can help fund the proposed I Drive Premium Transit Project. These programs carry with them formal planning and application requirements to assist the funding agencies in determining the eligibility of the project to receive funds under these programs.
This section summarizes the recommended implementation strategy based on the project funding needs. The Implementation Plan Report documents details on the analysis of governance alternatives for transitioning the proposed I-Drive Premium Transit Project from the planning phase to construction and operation. It also describes the federal and state funding sources for premium transit and assesses each program’s suitability for the I-Drive Premium Transit Project.

76 Transit Feasibility and Technology Assessment Report
6.1 Governance Options The project sponsor/lead agency that will develop and manage the proposed I-Drive Premium Transit Project must be well positioned to apply for and access capital and potentially operations funding from federal, state, and local government and private sector sources. When evaluating applications for funds, the FTA and FDOT will critically evaluate the lead agency to assess its experience and technical capacity to carry out a transit capital project and operating program of this nature. Determining the agency or organization best positioned to lead the development and operation of the proposed I-Drive Premium Transit Project ultimately comes down to which agency has a mission to develop the transportation infrastructure and services in the I-Drive Corridor, and which has the requisite ability and authority to plan, fund, construct and operate the premium transit project. The two agencies with the most directly relevant missions are Orange County and the I-Drive Business Improvement District.
The International Drive Business Improvement District, an independent special district created through ordinances passed by Orange County and the City of Orlando, is charged with the responsibility of managing, coordinating and/or implementing major initiatives that contribute to the current and future economic development for the International Drive Resort Area. The I-Drive Business Improvement District is well positioned to play an important role in the planning and coordination elements of the project, and to potentially assist with resources necessary to develop and operate the project.
Orange County coordinates with Regional Transportation Partners to plan, fund, develop, and operate the County’s transportation system. Orange County has the status to receive grant funds from federal and state agencies. The County has led the development of the TFATA, and is the lead agency in development of the I-Drive transit lanes project. In addition, it is anticipated that most of the required local funding for the project will likely come from County sources. Therefore, it is recommended that Orange County be the lead agency to develop and operate the proposed I-Drive Premium Transit Project, and to coordinate as appropriate with each of the partners to ensure success of the system.
Orange County currently provides operating funds to LYNX for regional transit services; LYNX is the local transit operator and the FTA-designated recipient for the urbanized area. When assessing potential project partners, it should be recognized that LYNX is an existing transit-oriented organization with infrastructure and equipment and labor resources; and is experienced with the transit operating environment in the I-Drive corridor. In addition to and because of the above, LYNX may be able to operate the transit service at a lower cost than other providers. However, for comparative purposes, the County may wish to explore the costs associated with contracting with a private transit service provider to operate the transit service on the proposed I-Drive Premium Transit Project.
Table 29 summarizes the advantages and disadvantages related to each of these agencies and organizations serving as lead agency for the proposed I-Drive Premium Transit Project.

77 Transit Feasibility and Technology Assessment Report
Table 29. Governance Options Analysis
Agency/Organization Advantages Disadvantages Orange County •Owner of the corridors and roadway facilities,
and responsible for infrastructure development.
•Leading development of the I-Drive Transit Lanes Project.
•Public agency eligible to receive certain federal and state grants.
•Demonstrated technical capacity to develop and construct infrastructure and provide funding for contracted transit services.
•Primary source of local project funding with the ability to address budgetary issues.
•Limited by Countywide budgetary fluctuations.
•Adherence to public agency procurement procedures and regulations may limit contract flexibility.
•Support for the project may be impacted by the terms of elected officials.
•Little experience with transit projects or transit funding applications.
•Would likely need to contract for the provision of transit services.
I-Drive Business Improvement District
•Singularly focused on comprehensive economic improvements to this area, including transportation.
•Directly represents membership of business stakeholders.
•Positioned to respond quickly to the need for service adjustments.
•May not be eligible to receive certain grant funds directly, including the state New Starts Transit Program (NSTP), Transit Service Development, and federal BUILD programs.
•Technical capacity to manage the design and construction of the project.
•Would need to contract for the provision of transit services.
6.2 Federal Funding The USDOT supports public transit projects primarily through FTA programs, and state and local transportation providers have mechanisms to access multimodal funding through FHWA programs. Federal sources that may support the proposed I-Drive Premium Transit Project are presented in this section.
6.2.1 Capital Investment Grant Program Federal funding to support the capital costs of developing major rail transit and premium bus transit projects comes primarily through the FTA’s discretionary CIG Program for New Starts projects (over $300 million total project cost) and Small Starts projects (under $300 million project cost with maximum FTA funding of $100 million). These grants are highly competitive and can typically provide up to 50% of the capital costs of a selected project.
6.2.2 Better Utilizing Investments to Leverage Development The Better Utilizing Investments to Leverage Development (BUILD) transportation discretionary grant program allows the USDOT to provide funds to road, rail, transit, and port projects that promise to achieve national objectives. Previously known as Transportation Investment Generating Economic Recovery, or TIGER discretionary grants, Congress has dedicated nearly $7.9 billion for 11 rounds of National Infrastructure Investments to fund projects that have a significant local or regional impact.

78 Transit Feasibility and Technology Assessment Report
Under the BUILD program, project sponsors at the state and local levels are eligible to obtain funding for multimodal, multijurisdictional capital projects that are more difficult to support through traditional USDOT programs. BUILD funds can be awarded directly to any public entity—municipalities, counties, port authorities, tribal governments, Metropolitan Planning Organizations (MPO), or others—in contrast to traditional federal programs that provide funding to very specific groups of applicants (mostly state departments of transportation and transit agencies).
6.2.3 Flexible Funding Programs FTA offers several flexible funding programs that fund transit-related activities. Flexible funds are certain legislatively specified funds that may be used either for transit or highway purposes. The idea of flexible funds is that a local area can choose to use certain federal transportation program funds based on local planning priorities, rather than based on restrictive criteria of program eligibility. Flexible funding programs that could be applied to the proposed I-Drive Premium Transit Project include FHWA Surface Transportation Program (STP), Congestion Mitigation and Air Quality Improvement Program (CMAQ), and FTA Urban Formula Program.
The STP is the largest potential source of flexible funds. These funds can be used for both highway and transit purposes. This source can be utilized for buying buses or rail vehicles, or for constructing fixed guideway systems like BRT, light rail, or heavy rail. In cases where the transit improvement overlaps with roadway infrastructure, often the funds may be applied for through FHWA without transfer to an FTA program. FTA encourages local decision-makers to consider and advocate for these funds as they plan for transit projects and renovations.
6.3 State Funding The FDOT has long played an important role in the funding and development of premium transit projects across the state. This section presents discretionary and formula-based funding programs administered by FDOT that may support the proposed I-Drive Premium Transit Project.
6.3.1 New Starts Transit Program The primary state funding source for major premium transit capital projects is the New Starts Transit Program, consisting of both New Starts Transit Program (NSTP) and New Starts Wheels on the Road (NSWR) funding allocations. The program was created to assist local agencies in developing rail transit and BRT/premium bus projects. It is also designed to help improve Florida’s rate of return from the Mass Transit Account of the Federal Highway Trust Fund. State matching support of local capital funding for major transit projects strengthens the financial ratings of these projects, helping them qualify to receive discretionary FTA CIG Program (New Starts and Small Starts) funds.
Approximately 10% of the Documentary Stamp Tax collections which were dedicated to FDOT in Senate Bill 360 in 2005, are allocated off the top to FDOT for the NSTP. The amount available typically falls in the range of $30 to $40 million per year. The Florida Legislature later provided additional annual revenues for the program from the New Wheels on the Road

79 Transit Feasibility and Technology Assessment Report
revenue source, which is programmed as NSWR. This is typically $7 to $8 million per year. These two FDOT Work Program fund codes support the same type of transit projects, and the funding sources may be combined on an eligible project, which is defined as project type which would otherwise be eligible to receive FTA CIG funding.
Because the total funding available from these sources might be inadequate to fund several major transit projects in Florida advancing concurrently, additional funding sources from outside the NSTP program could be needed statewide in any given year. Most funds in the State Transportation Trust Fund (STTF), including District Dedicated Revenues (DDR), are not restricted from use in support of transit capital projects, and may be programmed for a District transit project based on the District’s project prioritization.
Premium transit projects (rail transit and BRT/premium bus) may be evaluated and rated under the FTA CIG evaluation process, or under the recently developed NSTP criteria, if not otherwise going through the FTA evaluation process. Projects rated under the state NSTP criteria may still be eligible to access federal funds, such as BUILD grants, flexible STP/SU funds, FTA formula funds, etc., and not be subject to the discretionary FTA CIG evaluation process.
Example projects funded during and since the development of this state program include the Miami-Dade Metrorail Orange Line/Airport Connector, SunRail Phases I and II, Orlando’s LYMMO BRT extensions, The Wave Streetcar in Fort Lauderdale (project terminated), Miami-Dade South Corridor BRT, Central Avenue BRT in Pinellas County, and the Jacksonville Transportation Authority (JTA) First Coast Flyer BRT lines.
6.3.2 Public Transit Block Grant Program FDOT’s largest annual source of transit funding is the Public Transit Block Grant program, which is allocated each year to mostly urbanized area transit agencies by a formula specified in Chapter 341, Florida Statutes. Of the total $106 million allocated in Fiscal Year (FY) 21, approximately $90 million per year is allocated directly to the urbanized area transit agencies and is used primarily by local public transit agencies to fund a portion of transit operating expenses. Section 341.052(8) of Florida Statutes allows FDOT to supplement the Public Transit Block Grant allocation of an existing Public Transit Block Grant Program recipient if requested by the MPO (in this case MetroPlan Orlando), if state funds are available, and should FDOT concur. Routing additional Public Transit Block Grant funds through LYNX (as the existing recipient) under this provision of state law could provide an additional revenue source for both the capital and operating costs of the proposed I-Drive Premium Transit Project.
6.4 FDOT Discretionary Programs
6.4.1 Transit Service Development Program FDOT provides discretionary funding to local public agencies to support new and/or demonstration transit projects and services through the Transit Service Development Program.

80 Transit Feasibility and Technology Assessment Report
Eligible activities under this program include transit capital, marketing, maintenance and operations for a period of up to three years. Locally sponsored projects require a 50% match. For FY 21, the total amount of state funds allocated from the statewide program for Transit Service Development is approximately $14 million, which is allocated based on a solicitation of local project applications and FDOT District Office support. The FDOT District Office may also supplement their allocation of these statewide distributed funds with other available FDOT funds. For example, should FDOT District 5’s priorities require additional funding beyond the level allocated to them from the statewide program, it may request FDOT Central Office approval to reprogram State Transportation Trust Fund dollars within the District to support the additional Transit Service Development Program needs.
6.4.2 Transit Corridor Program The purpose of the Transit Corridor Program is to fund transit projects and services that increase the throughput capacity of congested highway corridors. The funds may support up to 100% of both eligible capital and operating costs and are available to funded projects as long as they continue to meet their identified goals and objectives. The total amount of funding initially allocated for FY 21 is approximately $14 million, which is programmed primarily to ongoing projects. Like with the Transit Service Development Program, an FDOT District may supplement its statewide allocation of these funds with other available state funds.
6.5 Local Financial Commitment The federal Small Starts rating process places emphasis on Local Financial Commitment as a key criterion, which applies to both capital and operating revenues for a proposed project. FTA requires an “acceptable degree of local financial commitment including evidence of stable and dependable financing sources.” Twenty-five percent of the rating for local financial commitment is an assessment of the current financial condition of the project sponsor, which is based on average fleet age, bond ratings within the last two years, current ratio of assets to liabilities, and recent service history. An additional 25% of the rating is based on the dollar amount of the local financial commitment (both capital and operating). Finally, 50% of the rating is based on the reasonableness of assumptions and financial capacity, both for capital and operating costs. Note that FTA considers state and/or private funds committed to the project to be non-federal, and are therefore eligible to be counted as part of the Local Financial Commitment to the project.
At the state level, FDOT also places emphasis on Local Financial Commitment in its guidance for allocating NSTP/NSWR capital project funding. Before a project is rated based on quantitative and qualitative criteria, the agency must first demonstrate that the project meets initial qualification threshold criteria, which include:
Local policy board support for the project;

81 Transit Feasibility and Technology Assessment Report
Adoption of a financial commitment to program local capital funds for the proposed project equal to or exceeding the amount of funds requested from FDOT; and
Adoption of a financial commitment to fully fund the long-term operations and maintenance of the proposed and existing transit system with non-state funds.
Regarding funding for transit operating expenses, local government funding support is typically the critical determinant of a project’s financial rating. At this time, it is anticipated that Orange County General Revenues will be the primary source of operating funds for the proposed I-Drive Premium Transit Project. A possible future voter referendum would allow for up to a 1% sales tax increase to be dedicated for transportation uses and could support this and other transit projects in Orange County.
Existing County resources for operating funds may be supplemented from other sources, such as the FDOT discretionary transit programs discussed in Section 6.3. However, federal options for funding transit operations of an urbanized area premium transit project are very limited. The FTA’s primary source of funding to local transit agencies, the Urbanized Area Formula Program, may be used only for capital expenditures and preventative maintenance in urbanized areas that exceed 200,000 population like Orange County. These funds go directly to the local transit provider (in this case, LYNX) and are not seen as a viable funding alternative unless the fleet is operated and maintained by LYNX.
Finally, Notifications of Funding Opportunities (NOFO) are released periodically for grant programs that fund specific types of operating expenses. These programs are often released under FTA’s Research, Development, Demonstration and Deployment program and are highly competitive and have limited funding. Recent examples include Access and Mobility Partnership grants, the Mobility on Demand Sandbox Demonstration Program, and Mobility for All Pilot Program grants.
6.6 Transit Project Delivery Because of its involvement in leading or supporting the implementation of premium transit projects in Florida, FDOT has developed a uniform five-step process to take road and transit projects from concept to construction. This process is outlined in FDOT’s Transit Concept and Alternatives Review guidance (TCAR), which is an integrated guide for conducting the activities associated with major transit projects seeking funding from the FTA CIG Program and FDOT’s NSTP. Figure 28 illustrates how a local sponsor plans for and develops a project that can meet complex requirements associated with various sources of funding, including FTA and FDOT.
This I-Drive TFATA study addresses the requirements for Step 1 Planning and Community Support, and Step 2 Programming and Alternatives.
The I-Drive Premium Transit Project now stands at the entry into Step 3 Project Development and Environment. The decision point for the County at this stage of the process is whether to

82 Transit Feasibility and Technology Assessment Report
seek FTA CIG Small Starts Program funding, or to focus on a combination of local funding, federal discretionary program funds, and state funding including the NSTP. The data and information presented in the TFATA provide some of the information required to develop an FTA Request for Entry into Project Development, or to address the criteria and submit an application to FDOT for NSTP funds.
Figure 28. Transit Project Delivery
The key consideration for this decision is whether the County needs FTA CIG Program to advance the proposed I-Drive Premium Transit Project. Although the CIG Program can provide a potentially significant amount of capital funding, it has extensive eligibility requirements for the very competitive Small Starts application and evaluation process. Pursuing this type of funding would be expected to lengthen the schedule for project completion and delay the start of revenue service. Finally, there is no guarantee that even if the project receives the requisite MEDIUM or above project rating from FTA, that it would receive a funding recommendation and ultimately a Small Starts Grant Agreement and Congressional funding appropriations.
6.7 Recommended Funding Strategy It is recommended that Orange County serve as project sponsor/lead agency for the proposed I-Drive Premium Transit Project. The County is the primary source of local funding. As a public agency, it is eligible to receive and expend funding from both state and federal grant programs.

83 Transit Feasibility and Technology Assessment Report
While only LYNX can receive funding from the FTA Section 5307 Urbanized Area Transit Program and the state Public Transit Block Grant Program, Orange County may receive funds from discretionary programs, such as the federal BUILD discretionary grant program and the state Transit Service Development Program. The County has the requisite transportation technical and management capability to properly handle procurement steps and to implement and manage the program. This includes construction of the project as well as the management and administration of a public or private transit service provider contract to operate the system.
There are several factors to consider regarding whether to pursue FTA Small Starts funding for the project. The existing financial commitment of Orange County to the design and construction of the I-Drive transit lanes may constitute a significant portion of the required local match for the project. The FTA Project Development Process requires federal oversight and project evaluation, along with other requirements and process steps. The competition for funds is stiff, and following the process does not guarantee ultimate FTA approval and Congressional allocation of funds. In addition, the desired timeframe for construction of the I-Drive transit lanes is also a consideration relative to achievable timing of the construction phase as an FTA Small Starts project.
If the project uses FTA CIG funds, certain capital project elements may be subject to the National Environmental Policy Act (NEPA). This includes requesting a class of action determination from FTA, and then completing the corresponding NEPA document (Environmental Impact Statement, Environmental Assessment, or Categorical Exclusion). Should FDOT and FTA determine that the capital project requires FTA NEPA oversight, Orange County may need to request a class of action determination directly from FTA. If project elements requiring NEPA are roadway related (e.g. stations, park and ride lots, etc.), the NEPA may be performed under FDOT’s NEPA authority as delegated by FHWA. Should the project use state funds only, the County may follow the state process, which is typically to complete a Project Development and Environment (PD&E) Study or State Environmental Impact Report.
With these considerations, it is recommended that the County follow a strategy to fund the proposed I-Drive Premium Transit Project primarily with a combination of local and state funding, possibly supplemented with state and/or federal funding to reduce the amount of Orange County and FDOT NSTP contributions. The request for state capital cost participation would be supported with Orange County’s adherence to a project review and evaluation process consistent with FDOT’s Guidelines for Rail and BRT Project Advancement Utilizing FDOT Funds.
The general sequence of the near-term implementation steps recommended for the I-Drive Premium Transit Project are detailed in Table 30.

84 Transit Feasibility and Technology Assessment Report
Table 30. Near Term Implementation Steps Implementation Steps Description Purpose
1. Coordination with LYNX
Orange County will meet and coordinate with LYNX regarding roles and responsibilities related to the proposed I-Drive Premium Transit Project. This discussion will include whether LYNX is open to a contractual arrangement whereby LYNX would provide operations services.
LYNX will be a critical partner in the delivery of this service, and early communication can also help clarify which funding sources the County will be seeking to ensure compatibility between Orange County and LYNX plans.
2. Coordination with I-Drive Transit Lanes
The County will coordinate proposed on-street and other transit project elements, such as stations and shelters.
Reconcile ultimate I-Drive project with current planned and ongoing construction of the I-Drive transit lanes.
3. Application for State New Starts Transit Program
The County will prepare an application for submission to FDOT District 5 for state New Starts Transit Program funds in the amount of 50% of the eligible capital costs of the project, inclusive of the I-Drive transit lanes. Guidance for this application is provided in FDOT’s “Guidelines for Rail and BRT Project Advancement Utilizing FDOT Funds,” along with subsequent direction and application package currently being developed by FDOT.
The TFATA substantially addresses requirements of FDOT’s Transit Concept and Alternatives Review (TCAR) guidance, and documents certain information needed to either request entry into FTA Project Development or to prepare an application for FDOT NSTP funding.
4. Identification of additional local funds needed
The County will document in detail the current and planned expenditures on the eligible costs of designing and constructing the I-Drive transit lanes, which are a critical element of the proposed I-Drive Premium Transit Project. The County will identify and commit additional local funds needed to fully match the amount of state capital dollars being requested.
Including the cost of the I-Drive transit lanes within the total cost of the project may allow the County to claim those costs as committed local share and match to the state funding being requested.
5. Inclusion of the project in the Transportation Improvement Program and Five-Year Work Program
The County will coordinate with MetroPlan Orlando to have the eligible capital costs of the project included in their priority list and Transportation Improvement Program, and will request FDOT District 5 to include capital funding in the Department’s Five-Year Work Program.
Inclusion of the project in these adopted programming documents is a mandatory requirement to receive state and federal funding for the project.
6. Application for federal funding
The County will prepare for the next round of the federal BUILD discretionary grants or other applicable federal discretionary programs, and will prepare an application for federal funding of a portion of the capital costs of the project.
If successful, the amount awarded will reduce equally the share of both local and state dollars required to fund design, vehicle acquisition, and construction of the project.
7. Application for FTA Section 5339 Bus and Bus Facilities grant
The County will coordinate with LYNX to determine whether to apply for an FTA Section 5339 Bus and Bus Facilities discretionary grant to support acquisition of rolling stock and construction of capital infrastructure.
Any funds received through this discretionary program will reduce both the local and state shares of the proposed I-Drive Premium Transit Project costs.

85 Transit Feasibility and Technology Assessment Report
Table 30. Near Term Implementation Steps Implementation Steps Description Purpose
8. Identification of additional funding sources
The County will work with MetroPlan Orlando to identify additional funding sources for capital costs of the project, such as federal flexible funding.
MetroPlan Orlando may request to use federal transportation funds directly through FDOT to support transit-related capital improvements on the corridor, or to have these funds flexed to LYNX’s FTA Section 5307 allocation and drawn down for eligible transit capital expenses on the corridor.
9. Application for Transit Development Program grant
The County (or LYNX) may apply to FDOT District 5 during the annual application cycle for a Transit Service Development Program grant.
This would provide state funding of up to 50% of the net operating costs of the project for the first three years of service.
10. Identification of additional state funding sources
State funding programs may include allocation of Transit Corridor Program funds to support capital and/or operating costs. These funds may come either from a statewide allocation or from a District 5 supplement to the program. MetroPlan Orlando may also request FDOT to supplement LYNX’s Public Transit Block Grant allocation to help support operations on the project.
By taking full advantage of existing state transit programs and funding strategies, the County will be able to develop and operate a premium transit project with enhanced facilities and services that can best address the transportation needs and challenges of the I-Drive District.
7.0 PUBLIC INVOLVEMENT SUMMARY Multiple public involvement activities were conducted to provide many opportunities for incorporating the views, concerns and issues of community stakeholders into the county’s decision-making process. The public involvement process ensured that the study recommendations not only meet the transportation needs of the area, but also are supported by community stakeholders.
7.1 Public Involvement Plan A Public Involvement Plan (PIP) was developed to define the strategies to inform and involve the public during all phases of the I-Drive TFATA study. The activities described in the PIP established a process to engage the public and stakeholders by providing project information, timely public notice, and encourage opportunities for providing input in the decision-making process. The PIP and engagement used for the public involvement process are provided in Appendix G.
7.1.1 Engagement Tools The public outreach strategies for the International Drive TFATA involved a variety of engagement tools encompassing in-person activities and digital outlets as well. The next section describes each of the tools used during the outreach process.

86 Transit Feasibility and Technology Assessment Report
Newsletter Newsletters were created and distributed to property owners within the study area and additional stakeholders. The newsletters provided the community with general information of the study, upcoming public events, and project schedule.
Advertisements/News Releases To announce the purpose, date, time, and location for each public meeting and hearing, display advertisements were published in the Sunday Orange County Extra Section of the Orlando Sentinel and El Sentinel. A news release was also distributed prior to each meeting or hearing date. The Orange County’s Public Information Officer handled all contact with the media.
Project Website A project website was created and linked to the Orange County website. The website houses the project overview, map of the study area, schedule, and project documents as well as a contact page for the public to submit comments and input.
7.2 Public Involvement Activities
7.2.1 Stakeholder Engagement Orange County recognizes the importance of involving community leaders throughout the decision-making process. Key regional stakeholders were invited to participate in the Project Advisory Group (PAG) in an effort for keeping them updated on progress and ensuring they have a voice. Multiple opportunities for coordination with agencies and small groups were also provided to ensure maximum public and stakeholder involvement. Public involvement for the Tradeshow Boulevard RCA was implemented in accordance with the TFATA Public Involvement Plan.
Project Advisory Group The PAG was convened three times over the course of the study to participate in visioning and community feedback exercises. The PAG members, listed in Table 31, included agencies and stakeholders in the I-Drive District along the following transportation corridors:
I-Drive from Sand Lake Road (State Road 482) to Sea Harbor Drive Universal Boulevard from Sand Lake Road to Tradeshow Boulevard Via Mercado from International Drive to Universal Boulevard Destination Way International Drive to Tradeshow Boulevard Tradeshow Boulevard from Destination Parkway to Universal Boulevard
Supporting materials were provided to PAG members for discussion and concurrence to the recommendations of the transit study, including support for the Tradeshow Boulevard RCA recommendations. Meeting summaries and materials are provided in Appendix G.

87 Transit Feasibility and Technology Assessment Report
Table 31. Project Advisory Group Members Agency / Organization
Orange County Efficient Transportation for the Community of Central Florida, Inc.
City of Orlando Hilton Orlando
LYNX Plaza International / Brooksville Group
Orange County Convention Center Universal Blvd Property Owners Association
Visit Orlando Universal Orlando
International Drive Business Improvement District Paramount Hospitality Management / Avanti Hotel
International Drive Resort Area Chamber of Commerce Rosen Hotels & Resorts
Sea World Dowdy Realty North International Drive
Universal Orlando Hyatt Regency Orlando
ICON Orlando Wyndham Orlando Resort International Drive
Pointe Orlando UniCorp US
PAG Meeting #1. The first PAG Meeting took place on December 2, 2019. This meeting focused on an overview of the purpose of the project and findings from the preliminary existing conditions analysis. Preliminary concepts for Tradeshow Boulevard improvements were also presented and discussed.
PAG Meeting #2. The second PAG Meeting took place on March 12, 2020. This PAG meeting covered the study goals and objectives, preliminary transit alignment alternatives, transit stations and transit hubs, findings on the vehicle technology assessment, and the needs for a vehicle storage and maintenance facility.
PAG Meeting #3. Because of limitations caused by the COVID-19 pandemic and to adhere to social distancing requirements, this meeting was held on July 22, 2020, in a virtual space via GoToWebinar. The presentation was prerecorded, and project representatives were online to host the meeting, conduct instant polls, and answer questions. For two weeks following the meeting, PAG members had additional opportunity to provide input online via MindMixer.
The purpose of PAG Meeting #3 was to review the study findings and recommendations. PAG members’ input was incorporated in the development of a recommended premium transit system for the I-Drive District, as well as for the recommendations for Tradeshow Boulevard improvements.
Project Advisory Group Focus Areas PAG members expressed the need to consider multiple opportunities for expansion and connection(s) to the north and south, and potentially the east and west. The study area is a subset of a larger I-Drive District, and improving mobility for the District requires future expansions to serve existing and planned key activity centers located outside of the study area, particularly north of Sand Lake Road.

88 Transit Feasibility and Technology Assessment Report
The recommended premium service is identified to operate in the planned transit lanes to be constructed by Orange County on I-Drive between Sand Lake Road and Destination Parkway. PAG members expressed concerns with shared operations for the transit lanes including LYNX, I-Ride Trolley and OCCC hotel shuttles. Ongoing integration and coordination between the I-Drive Premium Bus Transit service and these other services is critical to maintain efficient and cost-effective operations and optimal services for the transit rider and visitor to the I-Drive District.
PAG members expressed their general support for a premium bus vehicle technology (which is also commonly referred to as Bus Rapid Transit or BRT that offers features that enhance passenger experience and other qualities typically found on rail vehicles, but at a lower cost and with increased operating flexibility and maneuverability. Figure 29 outlines the different PAG focus areas.
Figure 29. PAG Focus Areas
7.2.2 Agencies and Small Groups Agencies and smalls groups were invited to provide their thoughts on current and future transit needs in the I-Drive District. Multiple face-to-face and virtual stakeholder interviews were conducted to gather feedback on both the premium transit system for the I-Drive District and the improvements for Tradeshow Boulevard. Detailed agency and small groups meeting summaries are provided in Appendix D.
Agency Coordination
Existing Transit Services LYNX, I-Drive Trolley and OCCC hotel shuttles currently provide transit services in the I-Drive District. Multiple interviews with the I-Drive Business Improvement District, LYNX, and OCCC
• Future premium transit expansion and connection(s) to the north and south, and potentially the east and west
• Integration and coordination with other transit services (LYNX, I-Ride Trolley, OCCC shuttles)
Connectivity
• Incorporate findings of the previous I-Drive Crosswalk Study• Provide for safe pedestrian access transit stations Pedestrian Safety
• Ensure efficiency of transit lanes for shared-operations (LYNX, I-Ride Trolley, Premium Transit, and OCCC shuttles)
• Curbside transit lanes minimize impacts to landscaping and facilitate pedestrian access
Transit Lanes
• Implement off-board fare collection system for premium transit• Modern vehicles with smart bus technologies provide similar features to rail
while maintaining the ability to deviate from the routeTechnology

89 Transit Feasibility and Technology Assessment Report
were conducted to identify issues and areas of opportunity for the integration of the premium transit system with the existing transit services. Input from these interviews can be summarized as follows:
I-Ride Trolley
> The I-Ride Trolley will be introducing an updated vehicle fleet (utilizing a similar replica historic trolley design with a single door, but with low-floor capability).
> Expansion of the Green Line is being considered to continue service along Universal Boulevard (beyond Pointe Plaza toward the Kirkman Road Extension and Destination Parkway), replacing the current Green Line service operating on I-Drive south of Pointe Plaza.
LYNX
> LYNX is pursuing a major transit expansion plan as part of a proposed countywide penny sales tax referendum to fund transportation projects. Proposed improvements include a potential route restructuring in the I-Drive District, replacing some of the current bus route segments with consolidated services.
> An integrated fare structure and transfer policy and the implementation of an off-vehicle ticket and payment system would facilitate integration between the recommended premium transit system and other transit services.
OCCC Hotel Shuttles
> OCCC hotel shuttle services are free for conventioneers. Strategic pick-up locations serve hotel blocks that have been previously arranged for events.
> Most OCCC shuttles are in the style of charter coach buses, generally with a capacity of 50 passengers. For large events at OCCC, a range of 100 to 300 shuttle buses, completing an average of four trips in the morning and three trips in the afternoon, are needed.
> OCCC shuttle buses generally operate at 15 to 20-minute headways, with some events requiring a more frequent service operating at 10-minute headways.
Utility Providers Utility providers within the study area for electric services include Orlando Utilities Commission (OUC) and Duke Energy. Providers for water/wastewater services include Orange County Utilities and OUC. Interviews with utility providers were conducted to identify potential impacts to utilities for the identified Tradeshow Boulevard improvements and the implementation of the proposed transit system, particularly at proposed station locations. Collective feedback from utility providers is summarized below:
90 Transit Feasibility and Technology Assessment Report
Utility providers are working in coordination with Orange County to address impacts to utilities infrastructure for the I-Drive transit lanes design and construction.
Coordination with electric service providers for the design phase of the project is critical because transit charging stations might require significant electric load.
Emergency Responders The Orange County Sheriff’s Office and the Orange County Fire Department were invited to provide their input related to emergency response operations in the I-Drive District. Collective feedback from emergency respondents is summarized below:
Law enforcement is facing challenges with the fast growth in the I-Drive District area. Implementing a transit system that helps reduce the number of rental car vehicles would facilitate law enforcement operations.
Maintaining median cut-outs for law enforcement used along I-Drive would facilitate access to monitor major attractions.
Security elements for transit stations should include cameras and good visibility.
First responders will need to be trained regarding the recommended vehicle technology and system components.
Traffic and Transit Operations Coordination with Orange County Traffic Engineering and OCCC identified specific issues and opportunities related to traffic and transit operations along the I-Drive corridor. Collective feedback regarding traffic and transit operations is summarized below:
Orange County Traffic Engineering is installing three new traffic lights for the following locations: International Drive and Ale House/Helicopter Tours, International Drive and Austrian Row, and Universal Boulevard and Las Palmeras Hilton Vacation Club/Convention Center driveway.
Signal controllers for signalized intersections located within the proposed I-Drive transit lanes project will be replaced with an adaptive control system that enable traffic signals to adapt to actual traffic demand.
OCCC hotel shuttles are envisioned to operate in the I-Drive transit lanes. However, passengers using the OCCC hotel shuttles would be picked-up and dropped-off at designated areas outside of the transit lanes.
The OCCC Master Plan identifies freight routes for the OCCC campus. The need for a truck access and staging lane for Tradeshow Boulevard to accommodate freight traffic was identified.

91 Transit Feasibility and Technology Assessment Report
Incorporating transit lanes along Tradeshow Boulevard would provide connectivity with the planned transit lanes along Kirkman Road extension and the Destination Parkway Superstop.
The Destination Parkway SuperStop site facilitates connectivity with future regional transit services. This location also provides opportunities for connections with transit services operating along Tradeshow Boulevard.
Other Agencies Other agencies involved in the development of the I-Drive TFATA study included the FDOT, Orange County Public Schools (OCPS), Orange County Environmental Divisions, and the Orange County Real Estate Management Division. Input received from these agencies is summarized below.
FDOT
> Opportunities to obtain funds through the service development program could be considered for the project implementation plan, but there are limitations regarding the amount.
City of Orlando
> A potential for a request by the City to study options for future expansion, north of Sand Lake Road was discussed. Options that could be considered for future expansion north of Sand Lake include I-Drive, Canada Avenue, and Universal Boulevard. Expansion to the north is challenging due to high traffic volumes along Sand Lake Road and limited right-of-way along I-Drive north of Sand Lake Road.
Orange County Public Schools (OCPS)
> OCPS expressed interest in assessing the potential for school buses to use I-Drive transit lanes.
Orange County Environmental Division
> Impacts associated with the proposed improvements may require regulatory permits and compensatory mitigation for agencies that claim jurisdiction over these systems.
> Orange County’s S‐11 Canal passes under Tradeshow Boulevard. All other wetland and surface water systems outside of the right-of-way would likely not be impacted by the transit improvements or the Tradeshow Boulevard roadway improvements.
Orange County Real Estate Management Division
> Valuation of property is needed if right-of-way acquisition is required for transit stations, stormwater treatment, and Tradeshow Boulevard improvements.

92 Transit Feasibility and Technology Assessment Report
Small Groups
Theme Parks Major theme parks located within the I-Drive District were engaged to incorporate their input regarding transportation issues and opportunities for visitors traveling to and from the I-Drive District and circulating to the many attractions and activities within the District.
Universal Orlando
> The Kirkman Road extension will provide access to the new EPIC Universe theme park and will incorporate median transit lanes. Ongoing coordination for the design of the identified improvements for Tradeshow Boulevard would be required, particularly for the configuration of the intersection with Universal Boulevard.
> The new EPIC Universe development will include a transit hub for Universal buses only and hubs for other transit services and coach buses.
SeaWorld Orlando
> SeaWorld expressed concerns related to unsafe conditions for pedestrians in areas near the theme parks.
> SeaWorld employees currently use the LYNX stop on Sea Harbor. However, implementing transit service that would bring employees and visitors closer to the park main entrances at SeaWorld and Aquatica is preferable.
Hotels and Businesses To understand the perspective of hotels and businesses with respect to transportation needs for the I-Drive District, interviews were conducted with representatives of Hilton Orlando, Wyndham Orlando, Rosen Hotels, and Plaza International. The collective feedback from the hotels and businesses is summarized below:
The current situation with COVID-19 is greatly impacting businesses in the I-Drive District and recovery may take time, which may impact local funding opportunities.
Improving mobility for the I-Drive District requires considerations for a future expansion of the premium transit service to serve the hotels and businesses located north of Sand Lake Road.
Comfortable seating areas and passenger amenities for premium transit stations would provide a better experience for I-Drive visitors.
Efficient operations for the premium transit service require coordination for the use of the transit lanes by OCCC shuttles as well as designated areas for loading and unloading of passengers for OCCC events.

93 Transit Feasibility and Technology Assessment Report
Homeowners Associations Existing residential developments provide housing options for those working in the I-Drive District as well as vacation rental opportunities for visitors and conventioneers. Collective feedback from interviews with homeowners associations is summarized below:
Tangelo Park HOA
> Considerations for the implementation of security features for the new transit system such as metal detectors or scanning devices would provide a safer environment for premium transit operations.
> Implementing transit connections to and from Tangelo Park will reduce the need for automobile use for residents who work in the I-Drive District.
Bayshore at Vista Cay Condominium HOA
> Bayshore at Vista Cay Condominium is a vacation rental community. Guests often prefer to rent a car for their transportation needs while visiting the area. The use of transit is low due to the long walking distance to the I-Ride Trolley stop on Universal Boulevard and long headways for current transit services within the I-Drive area.
7.2.3 Public Meetings Public meetings allowed the public to react to the findings and recommendations of the I-Drive TFATA study. To ensure maximum exposure and promotion of the public workshops, efforts were taken to connect with public officials, community organizations, local agencies, employers, and various media outlets.
Two public meetings were conducted to gathered input from the community. Informational displays with maps and other graphics were displayed for public review and comment. The meetings began with a presentation, followed by an informal question and answer session during which attendees could interact with the study team members to comment and provide input. The public meeting summaries are contained in Appendix D.
Project Kick-Off Meeting. The first public meeting took place on January 30, 2020. The purpose of the meeting was to review the general scope of work including the Tradeshow Boulevard RCA and preliminary existing conditions analysis for the International Drive TFATA study.
Recommended Alternative Information Meeting. Because of limitations caused by the COVID-19 pandemic and to adhere to social distancing requirements, the meeting was held on September 23, 2020, in a virtual space via GoToWebinar. The presentation was prerecorded, and project representatives were online to host the meeting, conduct instant polls, and answer questions. For two weeks following the meeting, the public had additional opportunity to provide input online at MindMixer. The purpose of the meeting was to present the Tradeshow Boulevard

94 Transit Feasibility and Technology Assessment Report
Alternative Concepts and the transit analysis that was conducted for the TFATA study for public review and comment.
Public and Community Members Focus Areas Members of the public and the community expressed the need to consider opportunities for expansion and connection(s) within the I-Drive District and the region to provide for better mobility options for I-Drive visitors, residents, and employees.
Public focus areas highlighted the desire for pedestrian safety improvements that include adequate street lighting for pedestrian facilities and provisions for safe and convenient access for transit stations. Preference for curbside running transit lanes was expressed by members of the community because curbside operations facilitate pedestrian access.
Members of the community also expressed preference for environmentally friendly vehicle technology options and the use of smart bus technologies for the premium transit system. Figure 30 outlines the Public and Community Members focus areas.
Figure 30. Public and Community Members Focus Areas
• Future premium transit expansion and connection(s) to the north and south, and potentially the east and west
• Connectivity with regional transit systems such as SunRail • Connectivity with new EPIC Universe theme park
Connectivity
• Provide for safe pedestrian access transit stations• Improvements to street lighting to ensure safe environement for pedestriansPedestrian Safety
• Provisions for transit signal priority to ensure eficient operations• Curbside transit lanes minimize impacts to landscaping and facilitate
pedestrian access Transit Lanes
• Environmental friendly vehicle technology options• Modern vehicles with smart bus technologies• Dynamic local information at transit stops
Technology

95 Transit Feasibility and Technology Assessment Report
7.2.4 Local Planning Agency & Board of County Commissioners Orange County Local Planning Agency
The study’s recommendations were presented to the Orange County Local Planning Agency (LPA) as a public hearing agenda item on February 18, 2021. Notifications were made at least two (2) weeks before the meeting date and included: study newsletter (mailings), newspaper advertisements (Orlando Sentinel and El Sentinel), and press releases. The Study was recommended for approval by the LPA.
Orange County Board of County Commissioners
The study’s recommendations were presented to the Orange County Board of County Commissioners (BCC) as a public hearing agenda item on July 27, 2021. Notifications were made at least two (2) weeks before the meeting date and included: study newsletter (mailings and emailings), newspaper advertisements (Orlando Sentinel and El Sentinel), and press releases.
The BCC making a finding of consistency with the Comprehensive Plan, approved the International Drive Transit Feasibility and Alternative Technology Assessment, and authorized staff to initiate interagency coordination for funding, design, right-of-way acquisition, and construction phases of the project.

Transit Feasibility and Technology Assessment Report
Appendix A. VIABLE ALTERNATIVES PLAN SHEETS

Transit Feasibility and Technology Assessment Report
Appendix B. STATION AREA ASSESSMENT

Transit Feasibility and Technology Assessment Report
Appendix C. TRANSIT HUB ASSESSMENT

Transit Feasibility and Technology Assessment Report
Appendix D. ALTERNATIVES COMPARISON MATRIX

Transit Feasibility and Technology Assessment Report
Appendix E. CAPITAL AND O&M COSTS SUPPORTING TABLES

Transit Feasibility and Technology Assessment Report
Appendix F. RECOMMENDED TRANSIT SYSTEM PLAN SHEETS

Transit Feasibility and Technology Assessment Report
Appendix G. PUBLIC INVOLVEMENT MATERIALS
