feasibility and efficacy of public transportation …
TRANSCRIPT
FHWA-NJ-2014-013
FEASIBILITY AND EFFICACY OF PUBLIC TRANSPORTATION PARTNERSHIPS
Volume II – Case Studies
FINAL REPORT
July 2014
Submitted by
Janice R. Daniel, Ph.D. Department of Civil and Environmental Engineering
New Jersey Institute of Technology
Hindy Schachter, Ph.D. School of Management
New Jersey Institute of Technology
Rongfang (Rachel) Liu, Ph.D. Dept. of Civil and Environmental Engineering
New Jersey Institute of Technology
NJDOT Research Project Manager Priscilla Ukpah
In cooperation with
New Jersey Department of Transportation
Bureau of Research and
U.S. Department of Transportation Federal Highway Administration

D I S C L AI M E R S T A T E M E N T
The contents of this report reflect the views of the author(s) who is (are) responsible for the facts and the accuracy of the data presented herein. The contents do not necessarily reflect the official views or policies of the New Jersey Department of Transportation, NJ Transit or the Federal Highway Administration. This report does not constitute a standard, specification, or regulation.
TECHNICAL REPORT STANDARD TITLE PAGE
1. Report No.
FHWA-NJ-2014-013
2. Government Accession No. 3. Recipient’s Catalog No.
4. Title and Subtitle
Feasibility and Efficacy of Public Transportation Partnerships Vol. II -
Case Studies
5. Report Date
July 2014
6. Performing Organization Code
7. Author(s):
Janice R. Daniel, Hindy Schachter and Rongfang (Rachel) Liu
8. Performing Organization Report No.
9. Performing Organization Name and Address
Department of Civil and Environmental Engineering
New Jersey Institute of Technology
University Heights
Newark, NJ 07102-1982
10. Work Unit No.
11. Contract or Grant No.
12. Sponsoring Agency Name and Address
N.J. Department of Transportation
1035 Parkway Avenue
P.O. Box 600
Trenton, NJ 08625-0600
Federal Highway Administration
U.S. Department of
Transportation
Washington, D.C. 20590
13. Type of Report and Period Covered
Final Report, July 1, 2011 –
July 31, 2014
14. Sponsoring Agency Code
15. Supplementary Notes
16. Abstract
The overall objective of this research was to identify and assess examples of local government and public transportation agency partnerships and the funding mechanisms used to improve or expand public transportation. In addition, the research sought to identify what needs to be done to ensure successful partnerships can be pursued on a continuous programmatic basis. A comprehensive literature review, identifying partnerships developed through the use of value capture strategies, both within and outside of public transit was performed. A survey of State Departments of Transportation and Transit Agencies was performed to identify and assess both successful and not so successful partnerships developed to finance public transportation improvements. The survey identified 12 partnerships and case studies of these partnerships were performed. An assessment of the partnerships showed successful partnerships had elements such as: Strong leadership skills of project champion; Support from stakeholders; Innovative enabling legislation; Scale of the project was appropriate to meet the specific need; and Public partner was responsive to private partner’s time schedule and needs. The research provides recommendations regarding project identification, statutory environment and capacity building that should be in place to ensure successful partnerships can be pursued on a continuous programmatic basis. Volume I contains the research approach and findings, Volume II contains the detailed case studies of select partnerships.
17. K Words
Public-private partnerships
18. Distribution Statement
No Restrictions.
19. Security Classification (of this report)
Unclassified
20. Security Classification (of this page)
Unclassified
21. No of Pages
Vol. I – 72
Vol. II - 65
22. Price
Form DOT F 1700.7 (8-69)
ii
A C K N O W L E D G E M E N T S
The authors wish to acknowledge the efforts of the New Jersey Department of Transportation (NJDOT) including the Project Manager Priscilla Ukpah and Camille Crichton-Sumners, Manager of the Bureau of Research. The authors thank the Research Selection and Implementation Panel members including: Jeremy Colangelo-Bryan (NJ Transit), Janice Pepper (NJ Transit) and Vivian Baker (NJ Transit). These individuals offered valuable comments and suggestions on the research project resulting in an improved product. The research was performed with the assistance of Brian Reilly, Executive Director of the Municipal Land Use Center at The College of New Jersey and Megan Carr, Principal at Civitáe, LLC. The authors thank them for their contribution to the on-going research efforts.
iii
TABLE OF CONTENTS (Volume I)
Page
EXECUTIVE SUMMARY ................................................................................................ 1
INTRODUCTION ............................................................................................................. 8
RESEARCH OBJECTIVES ............................................................................................ 8
RESEARCH APPROACH ............................................................................................... 9
SUMMARY OF LITERATURE REVIEW ....................................................................... 11
Partnership Definition ............................................................................................. 11
Partnership Advantages ......................................................................................... 12
Elements of Successful Partnerships .................................................................... 13
A Need For New Resources .................................................................................... 15
Value Capture Techniques ...................................................................................... 17
Tax Increment Financing ..................................................................................... 17
Joint Development ............................................................................................... 19
Developer Impact Fees ........................................................................................ 20
Transportation Benefit or Improvement Districts (TIDs) .................................. 21
Local Improvement/Special Assessment Districts ........................................... 22
Transportation Concurrency .................................................................................. 22
Corporate Sponsorship ........................................................................................... 23
A Need for Leadership ............................................................................................ 23
PARTNERSHIP LEGISLATIVE REVIEW ..................................................................... 24
States Enabling PPPs and Value Mechanisms ..................................................... 24
Federal Legislation & Regulation ........................................................................... 25
State Legislation and Regulation ........................................................................... 26
SURVEY PEER STATE DOTS AND PUBLIC TRANSIT AGENCIES .......................... 28
Identifying Survey Candidates ............................................................................... 28
Survey Design .......................................................................................................... 28
Survey Results ......................................................................................................... 29
Types of PPPs Used ................................................................................................ 29
Elements of Successful Partnerships .................................................................... 31
Survey Respondent Suggestions on PPPs ........................................................... 31
Identified Partnerships ............................................................................................ 32
iv
CASE STUDY DEVELOPMENT ................................................................................... 34
Rail Transit Projects ................................................................................................ 34
Roadway Projects .................................................................................................... 36
Transit Center/Transit Naming Projects ................................................................ 38
Non-Transportation Projects .................................................................................. 40
ASSESSMENT OF EXEMPLARY PARTNERSHIPS ................................................... 42
Lessons Learned ..................................................................................................... 42
Reasons for Success/Failure .................................................................................. 48
Statutory Environment ............................................................................................ 51
RECOMMENDATIONS ................................................................................................. 52
What should be Done .............................................................................................. 52
What should be Avoided ......................................................................................... 52
Final Recommendations ......................................................................................... 53
Project Identification ........................................................................................... 53
Statutory Environment ........................................................................................ 54
Capacity Building ................................................................................................. 55
REFERENCES .............................................................................................................. 56
TABLE OF CONTENTS (Volume II) Page
INTRODUCTION ............................................................................................................. 1
Identified Partnerships .............................................................................................. 1
CASE STUDY 1: Streetcar Project (Portland, Oregon) .......................................... 3
CASE STUDY 2: Burnside Couch Couplet (Portland, Oregon) .............................. 7
CASE STUDY 3: NO-MA Gallaudet U. Station, WMATA (Washington, D.C.) ....... 12
CASE STUDY 4: Dover Transit Center (Dover, Delaware) .................................... 18
CASE STUDY 5: US 36 Managed lane/bus rapid transit project (Denver-boulder, Colorado) .................................................................................................................. 24
CASE STUDY 6: I-495 Capital Beltway (Fairfax, Virginia) ..................................... 28
CASE STUDY 8: Hudson County Open Space Tax (Hudson County, New Jersey) ...................................................................................................................... 34
v
CASE STUDY 9: Hudson Bergen Light Rail Transit (LRT) (Hudson County, New Jersey) ...................................................................................................................... 40
CASE STUDY 10: United Water Partnership (Hoboken, NJ) ............................... 49
CASE STUDY 11: New Jersey Transportation Development District Act 1989 (Brief Comments) ..................................................................................................... 54
CASE STUDY 12: North/Clybourn Station (Chicago, Illinois) .............................. 55
List of Figures (Volume I)
Page Figure 1. States with PPP Enabling Legislation as of 2013 ........................................... 24 Figure 2. Public Private Partnerships Worldwide, ........................................................ 25
Figure 3. Transportation Public Private Partnerships .................................................... 25 Figure 4. Summary of Survey Question 1 Responses .................................................. 30
Figure 5. Summary of Survey Question 2 Responses .................................................. 30 Figure 6. Summary of Survey Question 3 Responses ................................................... 31
List of Figures (Volume II) Page Figure 7. Location of Noma Gallaudet U. Station, Washington DC ............................... 12 Figure 8. Ridership at Selected WMATA Stations ......................................................... 16
Figure 9. Location of the Dover Transit Center ............................................................. 19
Figure 10. Improved Bus Terminal ................................................................................ 19 Figure 11. US 36 Managed Lane/BRT Project Limits ................................................... 25 Figure 12. HBLRT Line Diagram .................................................................................. 41
Figure 13. HBLRT Schedule ......................................................................................... 43 List of Tables (Volume I) Page Table 1 - Rail Transit Case Studies .............................................................................. 35 Table 2 - Roadway Projects Case Studies ................................................................... 37 Table 3 -Transit Center/Transit Naming Projects Case Studies .................................... 39
Table 4 - Non-Transportation Case Studies .................................................................. 41
Table 5 - Rail Transit Partnership Assessment ............................................................. 43
Table 6 -Roadway Projects Partnership Assessment.................................................... 44 Table 7 - Non-Transportation Projects Partnership Assessment ................................... 45 Table 8 - Transit Center/Naming of a Transit Station Partnership Assessment ............ 46 Table 9- Statutory Environment for Case Study Partnerships ....................................... 51
vi
List of Tables (Volume II) Page Table 10 - New Jersey Open Space Tax Program by County ....................................... 35
Table 11 - HBLRT Total Project CostsTable 11 - HBLRT Total Project Costs .............. 44 Table 12 - AM Peak Period Auto Work Trips to Downtown Jersey City ........................ 45
1
INTRODUCTION
The overall objective of this research was to identify and assess examples of local government and public transportation agency partnerships and the funding mechanisms used to improve or expand public transportation. In addition, the research sought to identify what needs to be done to ensure successful partnerships can be pursued on a continuous programmatic basis.
Identified Partnerships A survey performed of State Departments of Transportation and public transit agencies identified 18 partnerships which were then reviewed by the Research Panel to determine whether case studies should be developed. From these 18 partnerships, 12 were selected for further study. The partnerships selected for further study include the following: Case Study 1: Streetcar - Portland, Oregon Partnership between the City of Portland and the Portland Streetcar Inc. for Portland Streetcar to design, manage and operate the Streetcar.
Case Study 2: West Burnside Couch - Portland, Oregon Partnership between Portland Bureau of Transportation and private firm. Used innovative private cost sharing design for urban design, traffic and street improvements. Public sector designs and manages project. Private firm builds. Case Study 3: NO-MA Gallaudet U. Station, WMATA - Washington, D.C. Partnership between WMATA and District of Columbia. Used innovative public-private financing partnership in a design build model. Case Study 4: Dover Transit Center – Dover, Delaware Partnership between Delaware Department of Transportation, Delaware Transit Corporation and the City of Dover. Case Study 5: US 36 Managed Lanes/Bus Rapid Transit Project - Between Denver & Boulder, Colorado Partnership between US 36 Mayors and County Commissioners and DOT in a DBFOM project. Case Study 6: I495 Capital Beltway – Fairfax, Virginia Partnership between Virginia DOT and Fluor-Transurban in a DBOMF project. Fluor-Transurban is financing, designing and building the project. VDOT will provide the environmental review and oversight. Once completed, Transurban will operate and maintain the 495 Express Lanes.
2
Case Study 7: Norfolk and Portsmouth Downtown Tunnel Partnership between Virginia DOT, Elizabeth River Crossings Opco, LLC and Construction Joint Venture (design-build members). Case Study 8: Hudson County Open Space Tax, New Jersey Being studied to understand the climate for public financing of open space/transit. Case Study 9: NJT Hudson-Bergen Light Rail DBOM Being studied to identify the elements of a successful partnership in New Jersey. Case Study 10: United Water Company – Hoboken, New Jersey Partnership between the City of Hoboken and United Water to manage the city’s water supply. Case Study 11: NJ Transportation Development District Act of 1989, New Jersey Addresses why have only four counties in New Jersey engaged in this Act since 2000. Case Study 12:North/Clybourn Station – Chicago, Illinois Partnership between Apple and Chicago Transit Authority in anticipation of the opening of a new Apple store. The partnerships represent a broad range of cases to demonstrate successful and not so successful partnerships as well as partnerships covering transit, roadway and non-transportation projects. For the partnerships identified for further study, case studies were developed. Information about each partnership was gathered in six areas:
Motivation/Initiation: Who initiated the project? For what purpose?
Project Structure: Which stages are controlled by public authorities and which
are the responsibility of private partners?
Financing Mechanisms: How is the project financed?
Project cost (approximate).
State legislation Covering Partnerships: What is the basic framework of this
state's law?
Project Impacts: Impacts on mobility, economic growth, etc.
The detailed case studies are provided here.
3
CASE STUDY 1: Streetcar Project (Portland, Oregon) Background
Portland, Oregon has a long history of successfully using innovative financing to support mass transit and urban design. Its frequently touted projects include use of tax increment financing (TIF) to build Gateway Regional Center Light Rail. Also widely cited is use of TIF and local improvement district (LID) funds for a streetcar project operated as a tripartite partnership by the city of Portland, TRIMET and Portland Streetcar Inc. The city's transportation agency has also used multiple Local Improvement Districts (LID) to finance projects to upgrade streets, build sidewalks, and install storm water management systems. These projects are generally designed, engineered and managed by the city while private firms build the improvements. Complex projects require transportation agencies as initiators to create networks of enthusiastic participants. In other words agency administrators must lead in a way that makes private actors satisfied to participate. In particular, large complex projects which impact multiple actors require excellent leading skills to get consensus among different stakeholders including businesses and residents located in the project's vicinity, drivers, advocates for cycling and pedestrians, and others. Portland's political leaders demonstrated that they had those skills in working to implement the original Streetcar project and in securing property holder agreement to create various street improvement LIDs. Case 1, the Streetcar Project and Case 2, the Burnside Couch couplet illustrate some of the contextual issues involved in bringing partnerships to fruition. Each analysis explores Portland's aims in creating an innovatively funded and managed project, the network of actors it created to reach those aims, and the resulting outcomes. A final section examines lessons other jurisdictions can learn from these cases. Analysis is based on extensive reading of agency documents, newspaper articles, and blogs. I also received information through telephone interviews with Bill Hoffman and Ross Swanson, Portland Bureau of Transportation's (PBOT) project managers (at different times) for the Burnside Couch project; Vic Rhodes, former head of the Portland Department of Transportation; Catherine Ciarlo, former transportation policy director in the Portland Mayor's Office; and Michael Powell a Portland business owner who has supported the streetcar and the Burnside Couch couplet. Vicky Diede, PBOT Streetcar project manager; Ian Stunde, Portland State University's transportation manager; and Stanely Penkin, a founder of the better Burnside Alliance, sent me information in e-mail attachments. Motivation/Initiation Like many cities Portland used streetcars as an important transit form in the late nineteenth and early twentieth century. By the 1950s, their use declined as people switched to automobiles and busses for urban journeys.
4
The idea of reintroducing streetcar service in Portland first emerged as part of the 1988 Central City Plan which was based in part on ideas from a Citizen Advisory Committee. The Streetcar was seen as a way of moving people in the densely populated downtown area without increasing car use or producing a need for additional parking places. It was seen as a catalyst to downtown area economic growth and housing development. In the 1990s, Vic Rhodes, head of what was then the Portland Department of Transportation, made Streetcar development and implementation a priority on his agenda. He hired Vicky L. Diede who had a private-sector sales background to oversee the project and had her report directly to him. Her background made it relatively easy for her to recruit and interface with private sector partners necessary for the project's functioning. Her placement in the agency meant she had the direct ear of the agency head who cared about the project. When Portland first proposed a streetcar, some individual residents and businesses opposed the plan. The transportation department used neighborhood association support to get these opponents to change their minds. Department staff met one-on-one with people as did business executives who supported the project. The transportation agency produced a video simulation to show people how the project would look when it was implemented. As Vicky Diede has noted, when dealing with stakeholders, you have to be patient and persevere. Service commenced in 2001 in a 4.8 mile single-track loop connecting major job centers at Portland State University and Legacy Good Samaritan Hospital. As the innovation attracted a continually growing ridership and spurred development in a vital part of the city, Portland extended the line through the South Waterfront District in 2007. (Further extensions are in the planning stages.) By 2008 private developers had invested $3.5 billion within two blocks of the alignment; that is to say most of Portland's development in this period abutted the new vehicles. Project Structure The city owns and operates the Streetcar as partner with TRIMET, a public agency that provides busses, light rail and commuter rail to the Portland metropolitan area and which contributes a major part of the Streetcar's operating funds. Since 1995, the city has contracted with Portland Streetcar Inc. (PSI), a private nonprofit organization whose board of trustees consists primarily of business leaders, to design, build, operate and maintain the system. Employees come from all three partners: the city of Portland, TRIMET and PSI (as consulting staff). TRIMET supplies 14 operators, three supervisors and two mechanics. The city supplies four employees, three at the managerial level and one a streetcar cleaner. Vicky Diede, PBOT's Streetcar project manager says that having Portland Streetcar Inc., a nonprofit, involved helps the enterprise by increasing the diversity of the people monitoring its trajectory.
5
Clearly the PBOT/TRIMET partnership is key to Streetcar's success. Early on, however, TRIMET did not consider the streetcar a priority for its own agenda. The question for Portland's transit agency became: How can we turn TRIMET into an ally? Streetcar advocates realized the answer was to agree not to seek federal funds for the Streetcar from the same sources that TRIMET used to fund its own projects. With this agreement, the streetcar stopped being a possible competitor and emerged as a complement to TRIMET's agenda. TRIMET saw that enlightened self-interest gave it reason to assist the Streetcar's development as the streetcar meant TRIMET would have to supply fewer busses to downtown Portland. Financing Mechanisms Major funding sources for the 2001 loop included: parking garage bonds ($28.5 million), a LID ($9.6 million), TIF ($7.5 million), federal government money ($5 million), and city owned garage revenues ($2 million). A smaller amount of funding came from Portland's ability to sell to Seattle, Washington Sound Transit agency "car options" it had with Inekon, the streetcar manufacturer ($200,000). Major funding sources for the 2007 extension included: tax increment ($14 million), regional transportation funds ($10 million), a LID ($9.8 million), land sale ($3.1 million), system development charges, i.e., a formula levied on new developments to support infrastructure costs that support the development, and a Connect Oregon lottery grant targeted at non-highway transportation projects ($2.1 million). From 2001 each streetcar also had an organizational sponsor which pays $25,000/year to have its name on the vehicle and to have an audio recording acknowledging its sponsorship at least once along the route. Participants include important economic players for the city such as Portland State University (PSU), Oregon Health and Science University (OHSU), Portland General Electric, Legacy Health Systems, Hoyt Street Properties, Regence Blue Cross/Blue Shield, and Powell's Books. Other organizations sponsor stops along the line at $500/month. Portland Streetcar Inc. has the contractual obligation to secure and manage all the sponsorships. Enlightened self-interest spurs sponsor organizations to contribute funds as they see that the Streetcar helps them reach their own goals and improve their employees' and customers' work lives. Portland State University and OHSU faculty, staff and students, benefit from the Streetcar, for example, not only to reach various local establishments but also to access light rail stations that will take them to many places in the metropolitan area. In 2012, PSU renegotiated its streetcar commitment and paid extra to secure the right of its students, faculty and staff to ride the streetcar for free. For PSU students, faculty and staff photo IDs serve as valid fare when using the streetcar. Student surveys in 2011 showed that before this new arrangement only 1.4% of student trips campus were by Streetcar but in October 2012, 3.5% were, a gain of 150 per cent. The university expects this number to grow as the streetcar's loop is expanded to cover more areas where students live. Meanwhile the university saves on the expenses it would have to pay to build and maintain parking spaces if students and staff brought their automobiles on campus rather than using public transportation.
6
Hoy Street Properties, a major developer in Portland's Pearl District, has a different reason for sponsoring a streetcar. It sees the positive impact the streetcar has on housing and economic development in the area where the firm builds, an important plus for this sponsor. For sponsorships to succeed businesses must perceive that benefits outweigh costs. A key ingredient for business executives contemplating whether to buy streetcar sponsorship is that they do not consider the money required as a major expense. One business owner actually told me that in Portland "It's not a huge sum of money." PSU takes the money from the funds its Transportation and Parking Services Department procures through the sale of parking permits and other services. As Vic Rhodes notes, the key to the project's success lay in getting the financial buy-in and support of stakeholders including businesses, developers, and neighborhood associations. Many Streetcar sponsors also participated in the LID, another sign that they saw the project as aiding their own aims and goals.
7
CASE STUDY 2: Burnside Couch Couplet (Portland, Oregon) Introduction Burnside Avenue is a major Portland thoroughfare that bifurcates the city's downtown area. By the last decade of the twentieth century, Burnside was widely considered problematic by the various neighborhoods adjacent to it. One problem was that drivers could not make left turns from Burnside. Another important issue was pedestrian safety in crossing a large multi-lane avenue with two-way traffic. Additional issues of concern included inadequate on-street parking and lack of bicycle lanes in a city with many cyclists and a pro-cycling ethos. For these reasons neighborhood reports often referred to the avenue as a barrier to development and commerce. One person I talked to called it hostile to the human environment. Motivation/Initiation In 1999, the Portland Bureau of Transportation (PBOT) began to consider how to improve the situation. Administrators worked with relevant business and neighborhood leaders through a 27 person Stakeholder Advisor Committee that met each month to provide input to the agency. Out of this process came the idea of turning Burnside and its neighbor, Couch, a relatively underutilized adjacent avenue, into a couplet. Each of the two avenues would cease having traffic move in two directions and would become parallel streets that run one way in opposite flows. Both streets would get full time on-street parking, wider sidewalks, more intersections, signals at all intersections, and bike lanes. Financing Mechanisms PDOT needed multiple financing sources for the project. It expected about $3 million to come from LID assessments approved by property owners in the area. It intended to have a TIF request made for the Portland Development Commission (PDC) to appropriate $5,754,000. A third source would be parking related bonds. PDOT worked to create community support for the project. PDOT held open houses to tell interested community members about the plan. Its administrators made presentations at selected neighborhood association meetings. PDOT discussed the project on its website. PBOT brought the Burnside/Couch project to the city council in 2002 with extensive support from neighborhood constituencies. It passed by a unanimous vote of five to zero. Project Impacts However, in the aftermath of the vote, implementation did not go smoothly. Over time the project continued to develop supporters but it also developed opponents. Supporters rallied under the banner of a nonprofit called "Friends of Burnside Couch." In 2005, the city awarded this group a contract to help create a design and budget for the
8
couplet as well as to stage community events to get support for the undertaking. The leaders of this group worked to inform local property owners of a couplet's benefits for regulating traffic. The organization helped secure something over 50% of local property owner acquiescence for a LID assessment although over 40 per cent of affected business owners did not agree to the LID. An important figure among the supporters was Michael Powell, owner of Powell's Books. He was also a major figure in the organization supporting the original streetcar and chaired the board of directors of Portland Streetcar Inc. Neighborhood opponents on the west side rallied under the banner of the "Better Burnside Alliance." In the early 2000s development had taken place on Couch including building of high-end residential apartments. Residents of The Henry, an upscale condominium which abutted Couch, were leaders of the new organization. The Better Burnside Alliance spoke against directing traffic onto Couch--which up until that time had been a relatively quiet street-- in many forums including its own website, a booklet, and various blogs. As Stanley Penkin, one of the organization's founder’s notes, the group found allies in the community "by emailing and calling potential allies and having one on one meetings with various stakeholders throughout the city." Alliance members also met with individual city commissioners to voice concerns. At the same time, the Portland Planning Commission had a three to one advisory vote against the couplet even though they approved of other enhancements for Burnside such as additional opportunities to make left-hand turns. This part of the planning community saw the couplet as too focused on vehicle management as opposed to overall urban design. The opposition from The Henry and the Portland Planning Commission led important Portland political figures to step back from quick implementation. Mayor Sam Adams called for more analysis. He sponsored additional citizen meetings to get further input. Transportation administrators involved in this project characterize this period as a time of drift without firm leadership for the undertaking. At least one couplet proponent sees this failure to move forward as the chief reason the original project was not implemented. In his view, the mayor sought consensus, did not find it, and was unwilling to confront the opposition and continue without their buy-in. A respondent from the mayor's office told me that Adams supported the project but did not believe he had enough support from constituents to proceed. In April 2007 the City Council held a second vote on the project that would take into account The Henry's opposition to the couplet on the west side where the condominium is located. One person interviewed said it was a long night. The Council at this point split the project in two. It directed that the east side of Burnside/Couch go to construction while the west side went to "35 per cent engineering"--a time to figure horizontal alignment and where everything would go. The Council at this time also added a new streetcar line to the project. This change answered the objection that the original couplet idea was too focused solely on private car management but also increased potential costs. The assumption was that after PBOT submitted its "35% engineering" report, the Council would decide whether to send the west side segment

9
into construction as well. Unfortunately, looming in the near future was the economic downturn of 2008. This economic downturn made any construction project more difficult to finance. Two of Portland's federal congressmen, Earl Blumenauer and David Wu, were important to the project's eventual trajectory. They were key intermediaries in the search to help get federal funds to aid the project. Blumenauer, a savvy Washington player, was able to help secure funds for the project in his district encompassing the eastern part of Burnside Avenue but Wu was not able to secure funds for his western district. Federal funds made a huge difference in moving the project forward on the east side. The upshot was that despite Portland's success in implementing other innovative projects the city was only able to build a truncated version of the Burnside Couch couplet. Funds did not materialize to support the streetcar. PDOT only constructed a limited couplet that encompassed the eastern part of Burnside and Couch. Two community groups, Central Eastside Urban Renewal Advisory Committee and the Burnside Bridgehead Citizen Advisory Committee, helped procure about $4 million for this part of the couplet from TIF arranged through the PDC. Other funds came from a variety of governments including a federal earmark, an Oregon Department of Transportation opportunity fund grant, and the city of Portland transportation charge program. One set of stakeholders, bicycle advocacy groups, considered its bike lane a start towards better sharing the road although they noted that wanted a more protected riding space built eventually. Since the couplet construction, retail development on the eastside has increased. The change helped improve the economic vitality of the area as well as traffic safety on that part of Burnside. In June 2011, Mayor Sam Adams said he would not bring the entire original project with its streetcar and other amenities back to the council for implementation in the next 10 years but that he wanted to undertake a pared down $18 million couplet for West Burnside and Couch. The Better Burnside Alliance opposed this plan as well. Today, proponents of the couplet note that the safety issues on Burnside still continue. Eventually they will need to be confronted in some way. Lessons Learned From These Cases The cases suggest that the following factors impacted the success of these two projects and are likely to play a role in whether such projects achieve success in other jurisdictions as well.
1. Leadership. Projects need a savvy champion with passion for developing and implementing the innovation. This is the only person who can guide them through an extended political process. People matter. The difference in Congressperson Blumenhauer and Wu's ability to get federal funds for their parts of the Burnside/Couch project was one link in the chain that led to drastically different couplet endings on Portland's east and west side.
10
Vic Rhodes played the champion's role for the Streetcar. On the other hand, most of the people I interviewed believe no major political figure had the passion or will to move Burnside/Couch forward after opposition surfaced at The Henry.
2. "Win win" relationships with stakeholders. Projects succeed when political and administrative figures can make a case to private and public stakeholders that the project will benefit them and they should help make it a reality. Savvy public leaders create "win-win" relationships with stakeholders;, they create patterns where multiple stakeholders believe they benefit by getting involved with the project. PBOT did that brilliantly with the streetcar project in cementing its relationship with TRIMET. It was unable to do that with those residents of The Henry who objected to the Burnside/Couch couplet. Creating win-win relationships is not always easy. Success means understanding other people's perspectives and being able to fashion arguments that respect their agendas and needs. Vic Rhodes notes that because he had interacted in prior projects with TRIMET administrators, it was easier for him to develop good relations than it might have been for someone new to the field. Vicky Diede told me to, " involve all of the stakeholders--don't just pay them lip service." Project proponents also must understand, however, that problems can arise if they are too insistent on seeking a consensus that may not be available. An effective leader creates multiple "win-win" relationships with stakeholders but sometimes is willing to move the project on in the face of residual opponents who do not accept it. Each leader has to balance the attempt to draw new people in as supporters and the need to find closure. Leaders also have to know the values of their constituents and track how these values may change over time. It is difficult to build projects that do not seem to accord with constituent values. The difficulty here is that constituent preferences may change over time as realities on the ground shift. Development of residential housing on Couch changed the nature of the community opposition to the couplet, a point that might have been hard to forecast when the couplet idea was first broached.
3. Multiple funding sources. Both projects used multiple innovative funding
sources to bring together capital for implementation. Property owners who would benefit from the projects were approached to help pay its start-up costs. Agencies have to be able to sell property owners on the potential project benefits for their own businesses to get their acquiescence. Portland's administrators had to convince a stakeholder such as Portland State University that the Streetcar had benefits for its agenda. Only then would PSU commit to the LID and to sponsoring a vehicle.
4. Appropriate technology and presentation. The Streetcar project adopted an appropriate relatively low-cost technology. Designers used cars that were the right shape and size for the area. The tracks symbolized a permanence that gave
11
investors faith in the project. On the other hand, some administrators now believe that "couplet" was not the appropriate term they should have used to describe PBOT's Burnside/Couch plans--because of the term's association with highways. A better term might have been "one-way grid."
5. Economy. Projects are easier to fund in a growing economy as existed in the early 2000s when Portland inaugurated the Streetcar. The economic downturn in 2008 may have negatively impacted completion of the Burnside/Couch couplet.
12
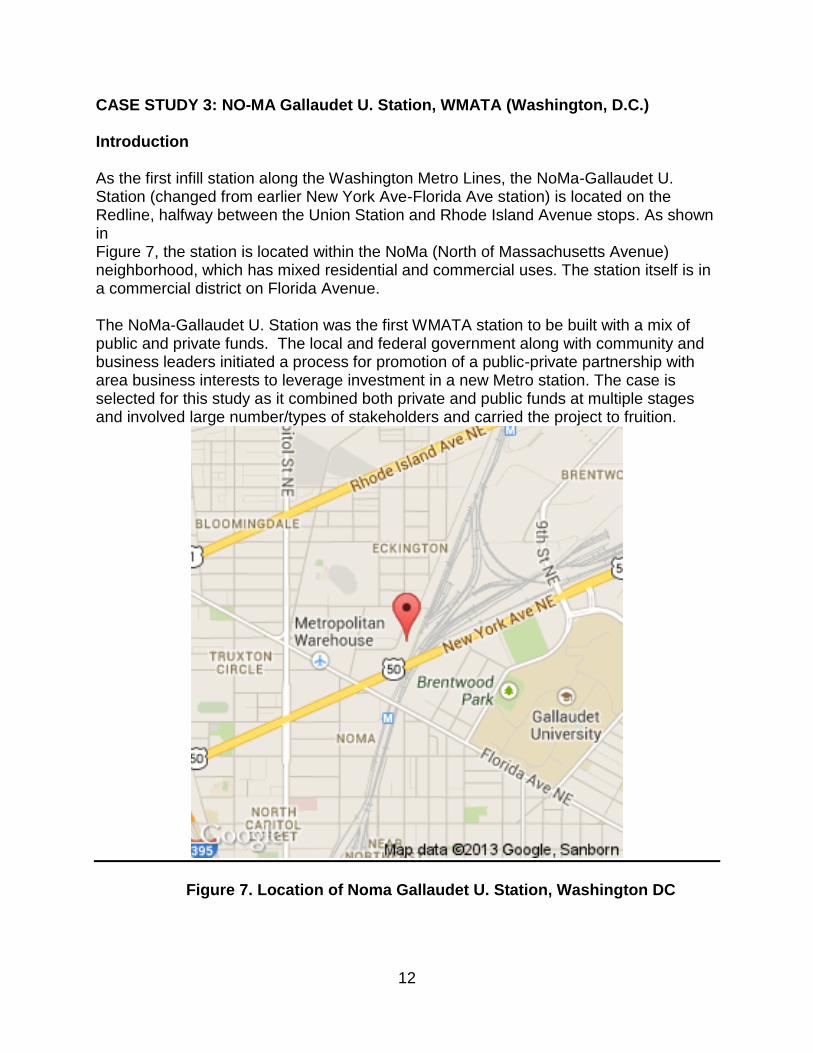
CASE STUDY 3: NO-MA Gallaudet U. Station, WMATA (Washington, D.C.) Introduction As the first infill station along the Washington Metro Lines, the NoMa-Gallaudet U. Station (changed from earlier New York Ave-Florida Ave station) is located on the Redline, halfway between the Union Station and Rhode Island Avenue stops. As shown in Figure 7, the station is located within the NoMa (North of Massachusetts Avenue) neighborhood, which has mixed residential and commercial uses. The station itself is in a commercial district on Florida Avenue. The NoMa-Gallaudet U. Station was the first WMATA station to be built with a mix of public and private funds. The local and federal government along with community and business leaders initiated a process for promotion of a public-private partnership with area business interests to leverage investment in a new Metro station. The case is selected for this study as it combined both private and public funds at multiple stages and involved large number/types of stakeholders and carried the project to fruition.
Figure 7. Location of Noma Gallaudet U. Station, Washington DC
13
Background The New York Ave. – Florida Ave Station was initially proposed in 1996 as part of greater improvements of New York Avenue between Downtown Washington and the Maryland state line. Prior to the addition of the station, NoMa was an urban, economically underdeveloped neighborhood. Inadequate transportation facilities stunted its economic growth and development. The neighborhood also had large amounts of vacant land. The Metro stop was built as part of an effort to revitalize the area. The partnership devised a plan under which the construction costs would be shared by the public and private sectors. The money would be collected from all commercial property owners within .5-mile (0.80 km) radius of the proposed station by being charged special tax assessments. The station was estimated as costing $84 million and construction began in December 2000. The federal government approved $25 million for its construction and the remaining costs would be split with $34 million coming from the District and $25 million coming from special tax assessments for the surrounding commercial properties. In May 2002, Metro awarded a design-build contract to the joint venture of Lane Construction/Slattery/Skanska for the design and construction of the station. On November 20, 2004, the station opened as the 84th station on the Metro system. The final cost was $103.7 million with the federal government and private land owners each contributing $25 million and the D.C. government contributing $53.7 million. Its construction has served as a catalyst for new development and redevelopment of the NoMa neighborhood. The station was renamed to NoMa–Gallaudet U on November 3, 2011, and formally christened with the new name on June 13, 2012. Motivation/Initiation In the end of last century, the city of Washington, DC was suffering from slow job growth, insufficient new investment and development, population loss, declining government revenues, and troubled low-income neighborhoods, among which, NoMa was a highly underdeveloped and predominantly abandoned and derelict former industrial area close to the center of the city, immediately north of the main train terminal, Union Station, covered by railroad tracks, large vacant parcels of land, and
mostly vacant industrial and warehouse structures. NoMa is traversed by New York Avenue (Route 50), one of the region’s most heavily travelled thoroughfares, leading directly to the White House in downtown Washington, as well as other major roadways including North Capitol Street and Florida Avenue. We firmly believed that downtown commercial development would eventually be moving east and north along the Massachusetts Avenue and New York Avenue corridors. The city had recently built the Washington Convention Centre on New York Avenue just north of the downtown, and the private sector, with city government infrastructure
14
financing, had constructed the Verizon Center sports and entertainment arena and the Gallery Place retail and entertainment mall, all of which were serving as catalysts for new investment in offices, housing, and retail in the East End of downtown Washington, generating a dynamic movement east and north that could spark the emergence of NoMa as a major development opportunity. The economic strategy for NoMa was built upon the following fundamental assets: centrality of location, regional transportation accessibility, availability of large development sites and industrial loft-style structures, broadband fiber optic cable lines already in place underneath the railroad tracks, the role of the nation’s capital as an international media center, the 1990s boom in information technology and telecommunications throughout the metropolitan region, and the urban lifestyle that is so attractive to talented and creative young artists, multi-media professionals, and technologists. A center piece of the NoMa strategy was to construct a new Metrorail station on an existing Red Line at the intersection of New York Avenue and Florida Avenue, NE. One of the largest gaps in the central city portion of the Metrorail system was between Union Station and Rhode Island Avenue to the north, nearly two miles apart, and New York and Florida Avenues were precisely halfway in between those two stations, so it made perfect sense to place a station at that location. The US government’s General Services Administration (GSA) essentially requires that all government-owned buildings as well as any federal government offices or facilities leased from private sector building owners should be located within 2,500 feet (walking distance) of a Metrorail station, in order to promote transit ridership and discourage automobile usage. Therefore, the proposed metro station will not only spur the development of NoMa but also enhance its rail transportation accessibility in general, and specifically to comply with the GSA location leasing criteria. Requests by neighborhood residents led WMATA to build station. Also important to WMATA's decision was the District of Columbia government's interest in using the station to increase economic development and hence its willingness to support the project financially.
Project Structure It took an entire year of discussion, persuasion, and consensus building, but in December 1998, the private owners agreed to pay $25 million (amortized over 30 years) for the proposed rail station. In the spring of the following year, the DC government agreed to commit $25 million as well, and in September 2000 the US Congress appropriated its $25 million contribution for the station. In addition, the US government provided another $6 million for constructing a portion of the Metropolitan Branch Trail (hiking and biking) as part of the New York Avenue Metro Station project, the DC government contributed an additional $19 million, and the
15
landowners donated $10 million in small land parcels to facilitate station construction. For the final price tag of $110 million, about $35 million came from the private sector, another $44 million from the DC government, and $31 million from the US federal government. Financing Mechanism Special taxing district (STD) created by private landowners near station brought in $25 million through assessments and donations and matches in the range of $10 million. District of Columbia government raised capital through bonds; bonds were paid through money from the special 30 year assessment that landowners in the area agreed to pay Project Cost 109.9 million Legislation Covering Partnership In August 1997, the US Congress passed legislation, signed by President Clinton, entitled the National Capital Revitalization Act. This law was primarily designed to address long-term structural fiscal imbalances harming the financial viability of the District of Columbia Government, such that it was running substantial budgetary deficits, unable to raise sufficient revenue to meet its expenditure obligations. The federal government created the District of Columbia Financial Responsibility and Management Assistance Authority (the “Control Board”) to order substantial reductions in personnel and spending, to directly manage the DC government, and to produce a strategic economic development plan designed to grow private sector businesses and jobs for DC residents, among other reasons, in order to increase the tax and revenue base. Project Impacts The heart of NoMa is the area around the New York Avenue Metro Station, all of which is now encompassed by the NoMa BID. By 2007, the total assessed value of private property totalled nearly $2.3 billion, up from $535 million in 2001, an increase of more than 30 percent annually. The total number of new permanent jobs, not including temporary construction jobs, created in the area since 1998 is approximately 15,550. The total amount of private investment in the area since 1998 is nearly $1.1 billion. The total amount of new development in the area since 1998 is 3.7 million square feet of office space and 21, 000 square feet of retail space. Average office rents in NoMa before the economic crisis was at $45 per square foot, significantly higher than the citywide average of $41. As one of the bright spot in the nation, Washington DC
16
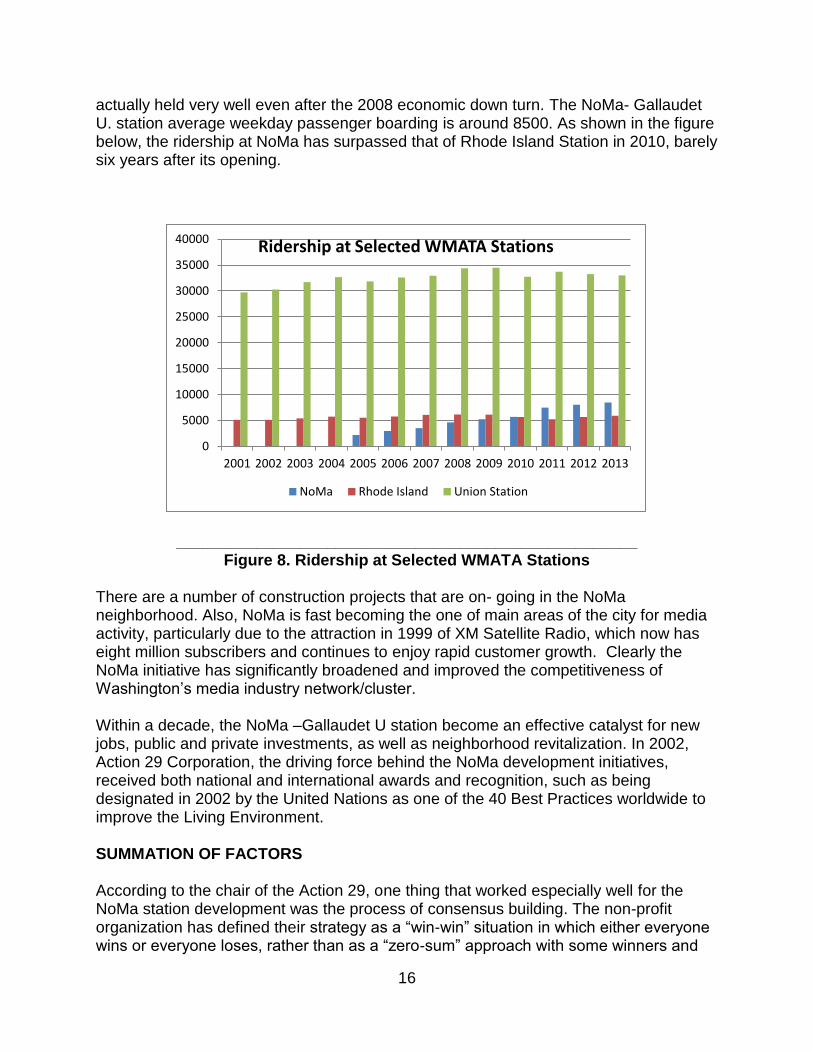
actually held very well even after the 2008 economic down turn. The NoMa- Gallaudet U. station average weekday passenger boarding is around 8500. As shown in the figure below, the ridership at NoMa has surpassed that of Rhode Island Station in 2010, barely six years after its opening.
____________________________________________________ Figure 8. Ridership at Selected WMATA Stations
There are a number of construction projects that are on- going in the NoMa neighborhood. Also, NoMa is fast becoming the one of main areas of the city for media activity, particularly due to the attraction in 1999 of XM Satellite Radio, which now has eight million subscribers and continues to enjoy rapid customer growth. Clearly the NoMa initiative has significantly broadened and improved the competitiveness of Washington’s media industry network/cluster. Within a decade, the NoMa –Gallaudet U station become an effective catalyst for new jobs, public and private investments, as well as neighborhood revitalization. In 2002, Action 29 Corporation, the driving force behind the NoMa development initiatives, received both national and international awards and recognition, such as being designated in 2002 by the United Nations as one of the 40 Best Practices worldwide to improve the Living Environment. SUMMATION OF FACTORS According to the chair of the Action 29, one thing that worked especially well for the NoMa station development was the process of consensus building. The non-profit organization has defined their strategy as a “win-win” situation in which either everyone wins or everyone loses, rather than as a “zero-sum” approach with some winners and
0
5000
10000
15000
20000
25000
30000
35000
40000
2001 2002 2003 2004 2005 2006 2007 2008 2009 2010 2011 2012 2013
Ridership at Selected WMATA Stations
NoMa Rhode Island Union Station
17
other losers. They succeeded in delivering benefits for the low- and moderate-income African-American families and neighborhoods surrounding NoMa, including construction of the new McKinley Technology High School, a new community-oriented shopping centre anchored by a Giant Foods hypermarket and Home Depot superstore, and another new “urban” retail centre with a 55,000 square-foot Safeway Stores supermarket. They also provided a portion of the Metropolitan Branch hiking and biking trail along with a substantial degree of sustainable high-density pedestrian-friendly transit-oriented development for environmental advocates. The organization provided city-owned land adjacent to the New York Avenue Metro Station for the new national headquarters building of the US Treasury Department’s Bureau of Alcohol, Tobacco, and Firearms (ATF), in exchange for obtaining $25 million from the US government to help finance the station’s construction. The initiative diversified the area economy by mixing and expanding media and technology companies, including recruiting XM Satellite Radio to place its national headquarters with 800 jobs in an abandoned printing factory across from the new Metrorail station. It generated significant tax revenue for the DC government. The most relevant aspect of the NoMa initiative was leveraging private financing by convincing the large commercial property owners and developers to contribute $25 million in cash and $10 million in land for construction of the New York Avenue Metro Station. Without that private sector commitment in December 1998, it would not be possible to obtain the DC government or US government funds that enable the entire project to be built. And without the New York Avenue Metro Station, much of the NoMa economic development initiative would not have succeeded. The unique geographic location and political structure of Washington DC as the nation’s capital has facilitated the success of the NoMa station, which may not be present or transferable to other locations. However, the strong commitment from local residents and businesses led by a strong leadership group has certainly helped or leveraged the position very well. One of the issues created by the prosperity of the NoMa is gentrification. As the urban land become more valuable, more businesses and high incomer move into the area, the original residents may be priced out the area soon. The problem is not unique to NoMa neighborhood but need to be addressed realistically.
18
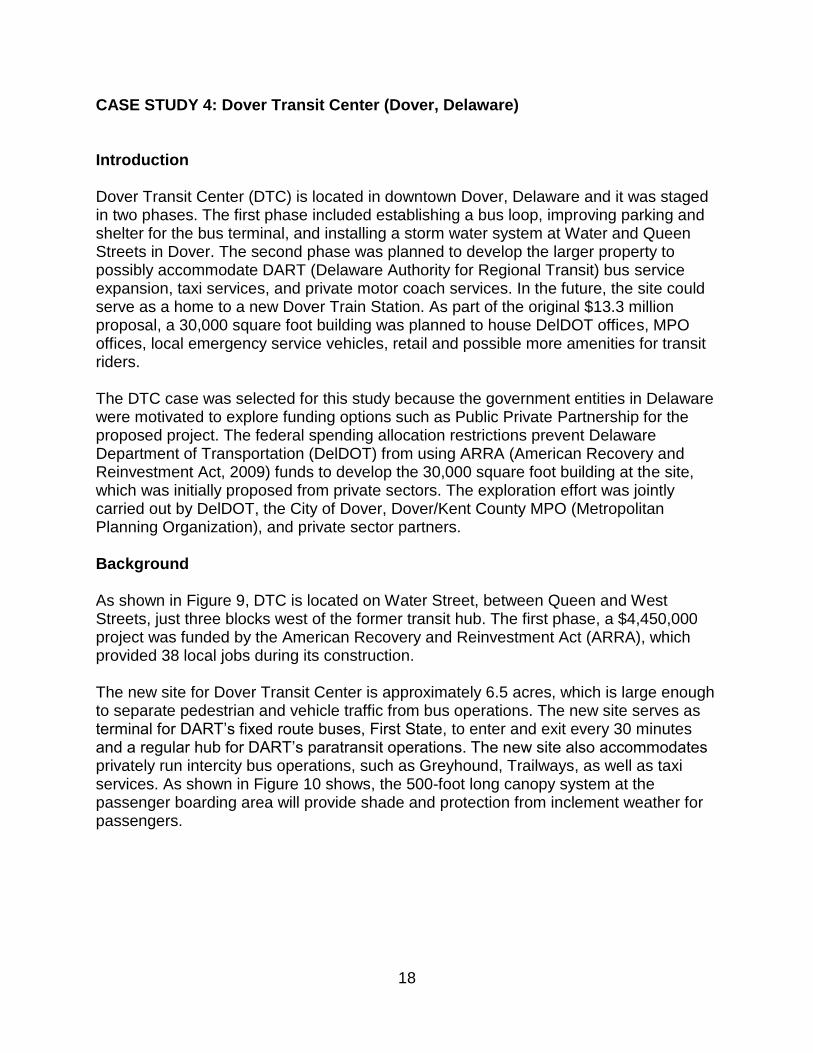
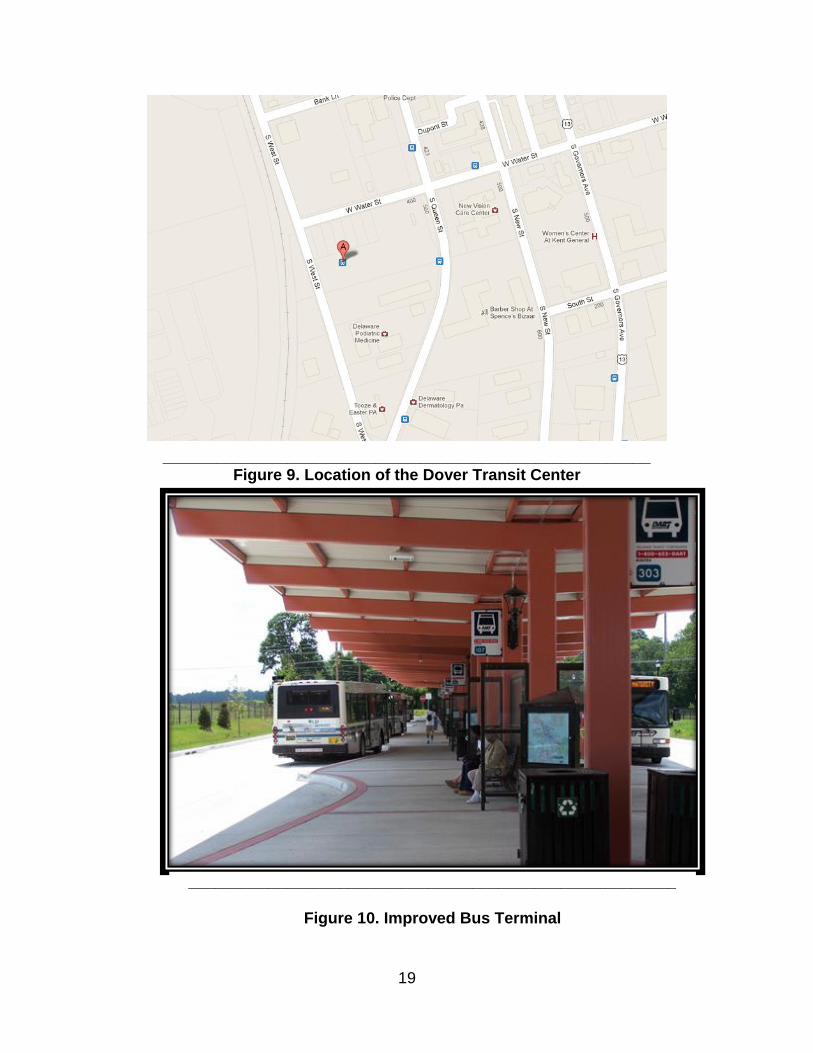
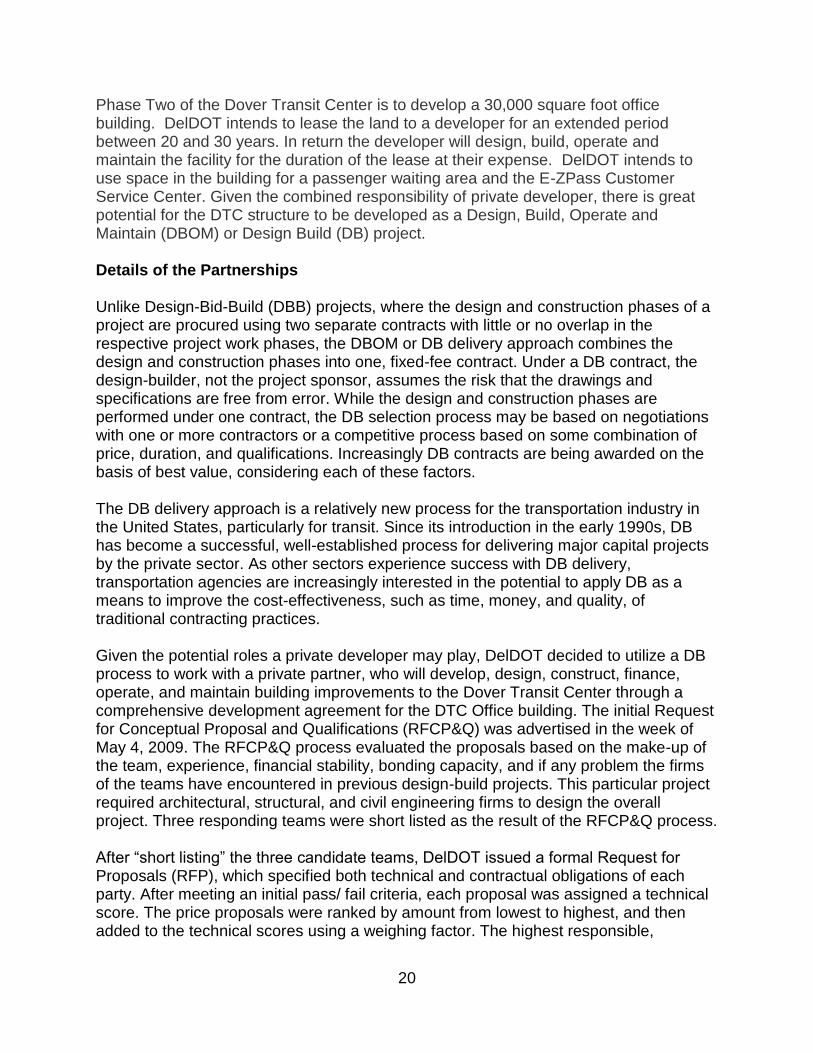
CASE STUDY 4: Dover Transit Center (Dover, Delaware) Introduction Dover Transit Center (DTC) is located in downtown Dover, Delaware and it was staged in two phases. The first phase included establishing a bus loop, improving parking and shelter for the bus terminal, and installing a storm water system at Water and Queen Streets in Dover. The second phase was planned to develop the larger property to possibly accommodate DART (Delaware Authority for Regional Transit) bus service expansion, taxi services, and private motor coach services. In the future, the site could serve as a home to a new Dover Train Station. As part of the original $13.3 million proposal, a 30,000 square foot building was planned to house DelDOT offices, MPO offices, local emergency service vehicles, retail and possible more amenities for transit riders. The DTC case was selected for this study because the government entities in Delaware were motivated to explore funding options such as Public Private Partnership for the proposed project. The federal spending allocation restrictions prevent Delaware Department of Transportation (DelDOT) from using ARRA (American Recovery and Reinvestment Act, 2009) funds to develop the 30,000 square foot building at the site, which was initially proposed from private sectors. The exploration effort was jointly carried out by DelDOT, the City of Dover, Dover/Kent County MPO (Metropolitan Planning Organization), and private sector partners. Background As shown in Figure 9, DTC is located on Water Street, between Queen and West Streets, just three blocks west of the former transit hub. The first phase, a $4,450,000 project was funded by the American Recovery and Reinvestment Act (ARRA), which provided 38 local jobs during its construction. The new site for Dover Transit Center is approximately 6.5 acres, which is large enough to separate pedestrian and vehicle traffic from bus operations. The new site serves as terminal for DART’s fixed route buses, First State, to enter and exit every 30 minutes and a regular hub for DART’s paratransit operations. The new site also accommodates privately run intercity bus operations, such as Greyhound, Trailways, as well as taxi services. As shown in Figure 10 shows, the 500-foot long canopy system at the passenger boarding area will provide shade and protection from inclement weather for passengers.
19
_______________________________________________________ Figure 9. Location of the Dover Transit Center
_______________________________________________________
Figure 10. Improved Bus Terminal
20
Phase Two of the Dover Transit Center is to develop a 30,000 square foot office building. DelDOT intends to lease the land to a developer for an extended period between 20 and 30 years. In return the developer will design, build, operate and maintain the facility for the duration of the lease at their expense. DelDOT intends to use space in the building for a passenger waiting area and the E-ZPass Customer Service Center. Given the combined responsibility of private developer, there is great potential for the DTC structure to be developed as a Design, Build, Operate and Maintain (DBOM) or Design Build (DB) project. Details of the Partnerships Unlike Design-Bid-Build (DBB) projects, where the design and construction phases of a project are procured using two separate contracts with little or no overlap in the respective project work phases, the DBOM or DB delivery approach combines the design and construction phases into one, fixed-fee contract. Under a DB contract, the design-builder, not the project sponsor, assumes the risk that the drawings and specifications are free from error. While the design and construction phases are performed under one contract, the DB selection process may be based on negotiations with one or more contractors or a competitive process based on some combination of price, duration, and qualifications. Increasingly DB contracts are being awarded on the basis of best value, considering each of these factors. The DB delivery approach is a relatively new process for the transportation industry in the United States, particularly for transit. Since its introduction in the early 1990s, DB has become a successful, well-established process for delivering major capital projects by the private sector. As other sectors experience success with DB delivery, transportation agencies are increasingly interested in the potential to apply DB as a means to improve the cost-effectiveness, such as time, money, and quality, of traditional contracting practices. Given the potential roles a private developer may play, DelDOT decided to utilize a DB process to work with a private partner, who will develop, design, construct, finance, operate, and maintain building improvements to the Dover Transit Center through a comprehensive development agreement for the DTC Office building. The initial Request for Conceptual Proposal and Qualifications (RFCP&Q) was advertised in the week of May 4, 2009. The RFCP&Q process evaluated the proposals based on the make-up of the team, experience, financial stability, bonding capacity, and if any problem the firms of the teams have encountered in previous design-build projects. This particular project required architectural, structural, and civil engineering firms to design the overall project. Three responding teams were short listed as the result of the RFCP&Q process. After “short listing” the three candidate teams, DelDOT issued a formal Request for Proposals (RFP), which specified both technical and contractual obligations of each party. After meeting an initial pass/ fail criteria, each proposal was assigned a technical score. The price proposals were ranked by amount from lowest to highest, and then added to the technical scores using a weighing factor. The highest responsible,
21
responsive score was determined to be the best value. The Dover Transit Center was awarded on November 20, 2009 to Richard E. Pierson Construction Co. for a Total Lump Sum Price of $4,460,000.00. Motivation/Initiation DelDOT initiated the first phase of the DTC, which included traffic circulation and storm water improvements to an existing parking lot. Private sector actually initiated the second phase after foreseeing potential for a larger structure that is adjacent to improve transit center in Dover. The motivations for private partners are the potential for job creation, revenue generation, and collaboration with the government agency. For the public entities, the motivations maybe to explore additional funding sources besides federal government, obtained additional office space and improve transit facilities. The PPP may also shift the risk of development into private sector or reduced the burden on the government during economic uncertainties. Project Structure If executed the DTC phase II has the potential to incorporate PPP into design, build, finance, operate and maintain phases. The private sector will take control of most phases during the specified leasing period while the public sector is the ultimate owners of the property. Financing Mechanisms
Contract supported outcomes
Landlord/tenant relationship
Project Costs The first phase of DTC was funded by ARRA grant via Federal Highway Administration for 3.4 million. The second phase of DTC was projected at 13.3 Million, which was the subject of PPP exploration effort. Future Development Federal spending allocation restrictions prevent the full $13.3 million from being funded. As such, DelDOT will move forward with the bus loop, parking areas and storm water aspects, while making future accommodations for the addition of the buildings. Eventually, this site would replace the current minimal facility on 1.5 acres on Water
22
Street, between Governors Ave. and State Street. The future facility could accommodate more buses, allowing for future expansion of the system if funding allows. The new facility will also be located on the rail line, allowing for possible use as a train station in the future if funding for such a capital project were available. DelDOT is soliciting Proposal and Qualifications Statements from entities interested in providing design/build, finance, operate, and maintain services for Phase II of the Dover Transit Center, which includes the office building. DelDOT, the Dover/Kent County MPO, the City of Dover and the Downtown Dover Partnership hope that the new Dover Transit Center will be a catalyst for the redevelopment of the area surrounding the facility. The Dover Transit Center will enhance multimodal travel in the City of Dover and in the West Dover Connector study area and facilitate the use of alternative modes of transportation thus supporting federal, state and community livability initiatives. In fall 2010, the Dover/Kent County MPO and the City of Dover held a multi-day workshop, to explore how the neighborhood surrounding the new Dover Transit Center could evolve over the next several years. The result was the Dover Transit Center Neighborhood Plan. The purpose of the plan and its guidelines is to provide the City of Dover with a development planning strategy for the area surrounding the transit center, using the hub as an impetus for redevelopment. The center also offers strategies to improve all modes of transport throughout downtown, and reenergize downtown Dover as a place worthy of the capital of the First State. The MPO Council approved and adopted the plan in 2011 and Dover City Council endorsed the plan as a strategy to revitalize Downtown Dover. State Legislation DelDOT is authorized to do a specific number of design-build projects by the legislature. Each design build has to be approved by the co-chairs of the Joint Legislative Committee on Capital Improvement Program and the Director of Office of Management and Budget (OMB). In addition, the use of design-build requires ratification by both the Federal Highway Administration (FHWA) and Federal Transit Authority (FTA). DelDOT received the approval from the legislative committee and OMB on February 12, 2009. Final approval and obligation of funds from the federal government came with the issuance of the RFP. Project Impacts It is safe to say that the impact of first phase was positive as it not only provided improved transit facilities but also spur interests from private sectors on further and large development. The impact of the second phase is unknown as it was not executed.
23
Summation of Factors The important factors in this PPP are the overall economic conditions and the need for transit services. The first phase of DTC was made possible by the ARRA grant. The second phase was initiated by the private sector given the development potential revealed or highlighted by the first phase development. On the other hand, the second phase of DTC was stalled due to economic uncertainty in the country and in the surrounding areas – the proposals received were clustered in the lower end of the project scales and revenue projections were not as optimistic as originally hoped, which caused concern and caution from the public entities. The experience of DTC should be a very good lesion for NJ Transit, which may evaluate all the factors, local, state and national and approach PPP with greater certainty.
References Delaware Department of Transportation. 2009. “Dover Transit Center, State Contract # 25-020-01, Federal Contract # Erra-2009 (31), Scope Of Services Package, Design-Build Project”, May 26, 2009. Dover/Kent County Metropolitan Planning Organization and the City of Dover, 2009. “Dover Transit Center Neighborhood Plan”, Dover, DE. Liu, Rongfang (Rachel), 2012. “Phone Interview with John Sisson, Manager of Facilities and Capital Projects, Delaware Transit Corporation”, August 2012.
24
CASE STUDY 5: US 36 Managed lane/bus rapid transit project (Denver-boulder, Colorado) Connecting Boulder and Denver, Colorado, the US 36 Managed Lane/ Bus Rapid Transit (BRT) project formed a partnership among the communities along the US 36, the county commissioners and Colorado Department of Transportation (CDOT) to carry out a Design Build Finance, Operate and Maintain (DBFOM) project. This project is selected as a case study due to its unique combination of highway and transit combinations and the planned the full array of partnerships along all stages of the project development. Background US 36 between Denver and Boulder opened as a toll road in 1951. The toll road bonds were paid off early and the tolling infrastructure was removed in 1968. When it was built, this four lane road had only one interchange between Denver and Boulder. In response to rapid population growth, there are now 10 interchanges along US 36 between I-25 and Boulder. However, the number of main through-lanes has remained at four. In September 2009, CDOT in partnership with the Regional Transportation District (RTD), U.S. 36 Mayors & Commissioners Coalition, nine local governments and 36 Community Solutions submitted an application to the U.S. Department of Transportation for a TIGER Discretionary Grant. In February 2010, the U.S. DOT awarded the State of Colorado $10 million through the TIGER grant program as a Transportation Infrastructure Finance and Innovation Act (TIFIA) Challenge Grant for the U.S. 36 Managed Lane/Bus Rapid Transit (BRT) Project (Project). For purposes of the TIGER grant program application, a segmented implementation plan was submitted. As shown in the figure on the next page, each of the segments includes BRT implementation, portions of the Bikeway, and replacement of aging infrastructure as well as a new managed lane from:
• Segment 1: Pecos Street to Wadsworth Boulevard. • Segment 2: Wadsworth Boulevard to Interlocken Loop. • Segment 3: Interlocken Loop to Table Mesa/Foothills Parkway.
In February 2011, the Colorado High Performance Transportation Enterprise (HPTE), with the assistance of the Regional RTD and regional partners, submitted an application for a TIFIA loan. On September 1, 2011, the U.S. DOT awarded the HPTE a TIFIA Loan in the amount of $54 million. The TIFIA Loan, coupled with a contribution from RTD of $120 million and other State and local contributions, will make it possible to deliver Segments 1 and 2, or Phase 1, of the Project. Upon completion of the Phase 1 project, U.S. 36 will be six lanes (three in each direction), two of which will be the managed lanes (Managed Lanes). The BRT system will become part of RTD’s FasTracks system. The Managed Lanes will connect

25
to the northern terminus of the existing, reversible I-25 Express Lanes, which opened in 2006 and extend for seven miles between downtown Denver and Pecos Street.
___________________________________________________________________
Figure 11. US 35 Managed Lane/BRT Project Limits
26
Partnership Details The first phase of the US 36 Managed Lane and BRT Project involves improvements to US 36 from Federal Boulevard to the Interlocken Loop interchange. The goal of the project is to increase traffic flow through the corridor by summer 2015. The design-build contract fixed price amount is $231 million. The project requires design and construction of the following components along US 36:
A buffer-separated managed lane in each direction as well as 12-ft. shoulders
Wadsworth Parkway, Wadsworth Boulevard, and Lowell Boulevard bridges
Sound and retaining walls
Bikeway improvements
BRT improvements
Installation of intelligent transportation systems (ITS) for tolling
Transit information and incident management and implementation of an appropriate transportation demand management (TDM) program
CDOT selected the Ames Granite Joint Venture team as the design-build contractor for the $312 million project, and they began construction in July 2012. The project will open to the public in January 2015.
Add an express lane in each direction of US 36 for Bus Rapid Transit (BRT), High Occupancy Vehicles (HOV) and tolled Single Occupancy Vehicles (SOV);
Widen the highway to accommodate 12-foot-wide inside and outside shoulders;
Replace the Wadsworth Parkway, Wadsworth Boulevard (at 112th Avenue), Lowell Boulevard and Sheridan Boulevard bridges, and the US 36 bridge over the Burlington Northern Santa Fe Railway.
Add Bus Rapid Transit (BRT) improvements, including new electronic display signage at stations and bus priority improvements at ramps. The improvements also will allow buses to operate on the shoulders of US 36 between interchanges to decrease bus travel time;
Install Intelligent Transportation Systems (ITS) for tolling, transit and traveler information, and incident management;
Install a separate commuter bikeway along much of the corridor; and
Improve RTD stations along the corridor, including new canopies with enhanced weather protection.
Reduced Project Duration It still remains to be determined as the project is in its early stages. The first inauguration is projected in 2015.
27
Shared Risks The DBFOM approach generally spread the risks but the results remain to be seen. Financing Mechanism Federal grants and loans are the main source of financing based on the information gathered so far. Project Costs Number various and not determined as the project is still on-going Project Impact Too early to tell.
28
CASE STUDY 6: I-495 Capital Beltway (Fairfax, Virginia) Background This case study discusses how the Virginia Department of Transportation (VDOT) successfully inaugurated a megaproject partnership with two private companies, Fluor and Transurban. The undertaking was to design, build, finance, operate, and maintain express high occupancy toll (HOT) lanes for a 14 mile stretch of the heavily congested I495 Capital Beltway. Completed in November 2012 the project provided two new lanes in each direction in addition to the traditional eight free lanes on the highway, thus producing a total of 12 lanes. These new lanes are free to busses and other vehicles with three or more occupants; all other vehicles must pay tolls. The project uses fully electronic, transponder facilitated toll collecting and dynamic billing based on actual traffic patterns at a given time; the more congested the roads, the higher the toll. The aim is to give riders a faster, pleasanter riding experience. As megaprojects are known to be particularly problematic in terms of estimating costs and benefits (Little 2011), studying this two billion dollar plus project can shed some light on the issue of reconciling reality with plans as well as how to inaugurate a complicated public-private endeavor. Analysis for this case comes from reading agency documents, reports on the project, newspaper articles and blogs. I also received information from telephone interviews with Larry Cloyed, Jay Loftus, and Ryan Pedraza, all VDOT senior managers. State Legislation VDOT has expansive authority to consider PPPs under Virginia's Public-Private Transportation Act (PPTA) of 1995. This act opened a new way to bring innovative ideas into the system by enabling private firms to submit unsolicited proposals for projects rather than only allowing them to respond to VDOT requests. When VDOT receives a private-sector proposal, it considers the project and then rejects it, asks for changes, or puts it on the department's web page with a solicitation for other firms to offer competing proposals. After posting, VDOT generally receives additional proposals, thus sending the original plan into a competitive bidding process. Such unsolicited proposals increase innovation. The state gets a greater number of ideas from a more diverse group of proposers. In addition, the 1995 Act gives VDOT flexibility in negotiating with private entities because the state does not have to accept the lowest bid. The expansive legislation is a result of political leadership from the governor's office. In particular Governors George Allen (1994-1998), Mark Warner (2002-2006), and Bob McDonnell (2010-present), have pushed hard for an expansive PPP program. This political leadership ensured funding. Another plus was that these governors appointed VDOT commissioners sympathetic to public-private initiatives.
29
In response to this legislation, VDOT created new units focusing on public-private projects. This structural change helped to promote a cadre of administrators with the proper skills to work with private actors. It also gave the private sector confidence that VDOT would contribute resources to PPP projects. The fact that a series of governors supported public-private initiatives led to successful moves for amendments to strengthen the legislation as new issues arose. An April 2002 amendment to the act permits tolling on interstate highways that are reconstructed to increase capacity. This amendment constituted an important provision for the I 495 project. Motivation/Initiation The transportation agency started to plan a public-private partnership for toll lanes on I 495 in 2002 after strong public opinion against an earlier proposal to widen the beltway that would have condemned hundreds of homes (Levy 2011). A game changer was an unsolicited proposal from Fluor in June 2002. This offer included a concept proposal to build the HOT lanes in the beltway's median--rather than on the sides-- thus requiring less space and home destruction (Perez, Barac and Vovsha 2012). As Virginia law required, VDOT advertised for competing proposals. No one replied to the Fluor proposal so the state did not submit the project for competitive bidding. Instead, VDOT asked Fluor to submit a detailed proposal which the firm sent in October 2003. In January 2005, the Virginia Transportation Board accepted Fluor's proposal and proceeded to negotiate a full contract. The project had wide stakeholder support. One supporter was the Washington Council of Governments which is the metropolitan planning organization. Business supported the project as did the American Automobile Association. These supporters came to public input meetings and wrote letters enumerating the benefits the project would bring. The key opponents were environmental groups. National organizations such as the Sierra Club and local organizations such as the Coalition for Smarter Growth argued against spending such a large sum of money on highway lanes rather than on mass transit (Harrison 2003). Other local groups such as Friends of Accotink Creek decried the harm to local water sources that the project's construction activities entailed. At one point, members of this group initiated a citizen's lawsuit against Fluor which was resolved by a consent decree. Transurban and Fluor worked to conciliate the environmentalist groups by setting up a community grant program for organizations that protect the environment in the I 495 area. Grants ranged from $250 to $5,000; the Fairfax County Park Foundation received one, for example, to install bicycle racks in a local park VDOT underscored its commitment to build more Park and Ride facilities to encourage HOV ridership, an environmental goal.
30
The project commenced in 2007 when VDOT signed a comprehensive development agreement with Fluor, a large engineering and construction services firm, and Transurban, a toll road owner and operator, brought in by Fluor to be part of the team. After a set of public meetings and environmental studies, the state approved the project. Construction began in 2008 with a fixed design-build contract of $1.4 billion. Throughout the construction phase VDOT kept the public informed through a special project newsletter and website. The private firms, Fluor and Transurban, also established a project website. Interested stakeholders had easy access to information about the partnership. Financing Mechanisms Funding for the project came from a variety of federal, state and private sources. These included tax exempt private activity bonds with a 40 year timeline ($589 million); a federal Transportation Infrastructure Finance and Innovation Act (TIFIA) loan with a 40 year timeline ($589 million) secured by the private parties; a commonwealth of Virginia grant ($409 million); VDOT change order funding ($86 million); interest income ($47 million); and private equity ($348 million). While VDOT would own the lanes, Transurban would operate them and receive its revenues from the tolls. This arrangement transferred key risks to the private sector. It also allowed the firm to keep rewards over a protracted period if a sufficient number of cars with less than three riders paid the tolls. Project Impacts Both VDOT and the private firms wanted the project to succeed but each entity defined success in different terms. VDOT's aim was to reduce congestion. The private firms wanted to generate revenue for their organizations. These aims could coincide or conflict under different circumstances. For example, if all commuters decided to pack three or more passengers into their cars before using the HOT lanes, VDOT would gain its objective of limiting congestion but Transurban would fail to sustain a revenue stream. To create a partnership the contract had to position the project as a win-win endeavor where both participants reached their goals. To this end the private partners received concession time of 80 years during which period VDOT agreed to not make any major changes to the free portions of the road without Transurban's approval. in addition, the VDOT-Transurban contract requires VDOT to pay Transurban 70% of lost toll revenue if the number of carpool (i.e., free) vehicles reaches at least 24% of vehicles going in one direction during the first 30 minutes of any days with 3,200 vehicles per hour on the road. As a VDOT manager remarked to me, "You need a true partnership. You need to compromise as you go along."
31
As the project is relatively new, this report can only report on preliminary impact findings. Virginia's Office of Transportation Public-Private Partnerships (2013) believes an important impact has been job creation related to the project. The Office estimates that about 20 per cent of Fairfax County's economic growth in 2009 resulted from the project, which supported 31,000 short and long term jobs. At the opening of the lanes, however, Transurban encountered problems securing its revenue stream. In the first six weeks, the company lost about $10 million as operating costs exceeded revenue. Two reasons may explain initial low usage. Drivers complained it was too difficult to get the E-Z pass which vehicles had to use on the HOT lanes. Many people evinced confusion about how to access the HOT lanes. However, drivers who did use the lanes appreciated the time they saved. Transurban quickly responded to the confusion. It put videos on its website explaining how to enter and leave the new lanes. In addition, it designated a free toll road week-end to attract first-time users. These measures spurred a 13% increase in use (Plater 2013). Yet even this traffic was only 36% of the use Transurban predicted for the lanes in 2007, when it entered the project. Although Transurban expects usage to increase as time progresses and customers become more familiar with lane policies, an important intervening event between 2007 and the present was the economic meltdown of 2008. The ensuing downturn meant that even by 2012-2013 employment and income levels had not returned to their 2007 base ("VA 495 Express Lanes" 2013). This affects the number of people who will pay the toll to avoid congestion. Lessons Learned From The Case The case suggests that several factors played a role in enabling the new lanes to open and are likely to play a role in any jurisdiction contemplating such a project. These factors include: 1. Leadership. In this case, political leadership was crucial. The project took off because of the PPTA act in 1995 and its subsequent amendments. This act had the strong support of various Virginia's governors. DOTs need to work closely with elected officials. Success comes with support from strong, popular leaders . 2. Win-win relationships with stakeholders. Public-private partnership projects succeed when both private and public actors see benefits to their own agendas from successful completion of the endeavor. In writing a contract, VDOT, Fluor and Transurban all had to understand each other's agendas. They had to write a contract that gave each entity a chance to meet its own goals. This obligation meant developing a contract that would pass muster with Virginia's voters as well as Fluor and Transurban's shareholders. Once the contract was written, the public and private actors had to try to create win-win relationships with other stakeholders, especially those who did not support the project at
32
the start. The private firms understood the importance of this outcome when then reached out to local environmental groups with a series of grants that would further the groups' agendas even though they had no other direct benefit to Fluor or Transurban. 2. Multiple Funding Sources. The project used multiple funding sources including debt and equity capital. Funds came from federal, state, and private sources. All the people I interviewed agree that without the addition of private funds the state would not have been able to build the project. 3. Appropriate Technology. If one innovation precipitated building the HOT lanes, it was Fluor's proposal to use median lanes rather than enlarging the highway from the outside. This tactic diminished the need to destroy private homes to enlarge the road and thus made the project politically acceptable. An important point to remember is that this idea came from the private sector. It might not have reached the table if Virginia had excluded private firms from submitting unsolicited proposals. Casting a wide net improves the chance of finding worthwhile ideas. Bringing new actors to the table facilitates learning about new perspectives .Public organizations and the community at large gain from getting ideas from new actors. 4. Economy. Projects are easier to assemble in a growing economy as existed in Virginia before 2008. Even in 2012 and early 2013, Transurban's revenues may have been impacted by the 2008 slowdown. The firm might not have agreed to the contract if it had been able to forecast the economic problems that were about to emerge. References Harrison, David. 2003, Oct. 22. Environmentalists Organize against HOT Lanes. Springfield Connection. Available at http://connection.membershipsoftware.org/article.asp?article=274482&paper=72&ci. Retrieved May 28, 2013. Levy, Sidney. 2011. Public-Private Partnerships: Case Studies on Infrastructure Development. Reston, VA: American Society of Civil Engineers. Little, Richard. 2011. Does Private Participation in the Provision of Infrastructure Improve Performance? Presented at American Society for Public Administration meeting, March 2011. Perez, Benjamin, Tiffany Barac and Peter Vovsha. 2012. Assessing Highway Tolling and Pricing Options, vol. I. NCHRP Report 722. Washington, DC: Transportation Research Board.
33
Plater, Roz. 2013, April 22. Express Lanes Could Be Testing Ground for Nation. ABC 7. Accessed at http://www.wja.com/articles/2013/04/express-fares-could-be-testing-ground-for-ni. Retrieved May 29, 2013. ----. 2013, Jan. 11. VA 495 Express Lanes Report Good Start after Six Weeks. TollroadsNews. Accessed at http://www.tollroadsnews.com/node/6353. Retrieved June 4, 2013. Virginia Office of Public-Private Partnerships. 2013. Legislative Fact Sheets. Richmond, VA: Office of Public-Private Partnerships.
34
CASE STUDY 8: Hudson County Open Space Tax (Hudson County, New Jersey)
Background The United States has had a long history with public funding of open space. In the 1960s to mid-1980s, funding for open space was accomplished primary by the federal Land and Water Conservation Fund (LWCF). In its present form, the LWCF Program provides matching grants to States and local governments for the acquisition and development of public outdoor recreation areas and facilities. The funding provided through this grant has averaged approximately $100 million per year. However, between 1996 and 1999 the annual appropriations decreased to a low of zero. Funding returned in 2000 ranging from $140 million in FY 2002 to $28.3 million in FY 2006. In response to the decreased funding, many state, county and municipal governments established new funding programs for open space preservation. New Jersey has funded open space grant and loan programs for 40 years including the Green Acres Program and the Farmland Preservation Program. In 1998, New Jersey voters approved a constitutional amendment to dedicate $98 million annual for ten years from the State’s General Fund for open space preservation, and authorized up to $1 billion in revenue bonds to finance open space. To simplify the process of obtaining state grants for open space, both the Green Acres and the Farmland Preservation programs established Planning Incentive programs which allowed local governments with a dedicated source of open space funding, such as an open space tax, and a formal open space or farmland preservation plan, to apply for grants in a manner similar to a credit line. Data from 2009 showed that all 21 counties in New Jersey have approved an open space plan which sets aside areas for public recreation use and/or protection of national, historic or agricultural resources. Table 10 shows the tax rates and annual tax collected by County in 2009. In addition to all 21 counties with an open space tax program, there were also 237 municipalities with open space programs.
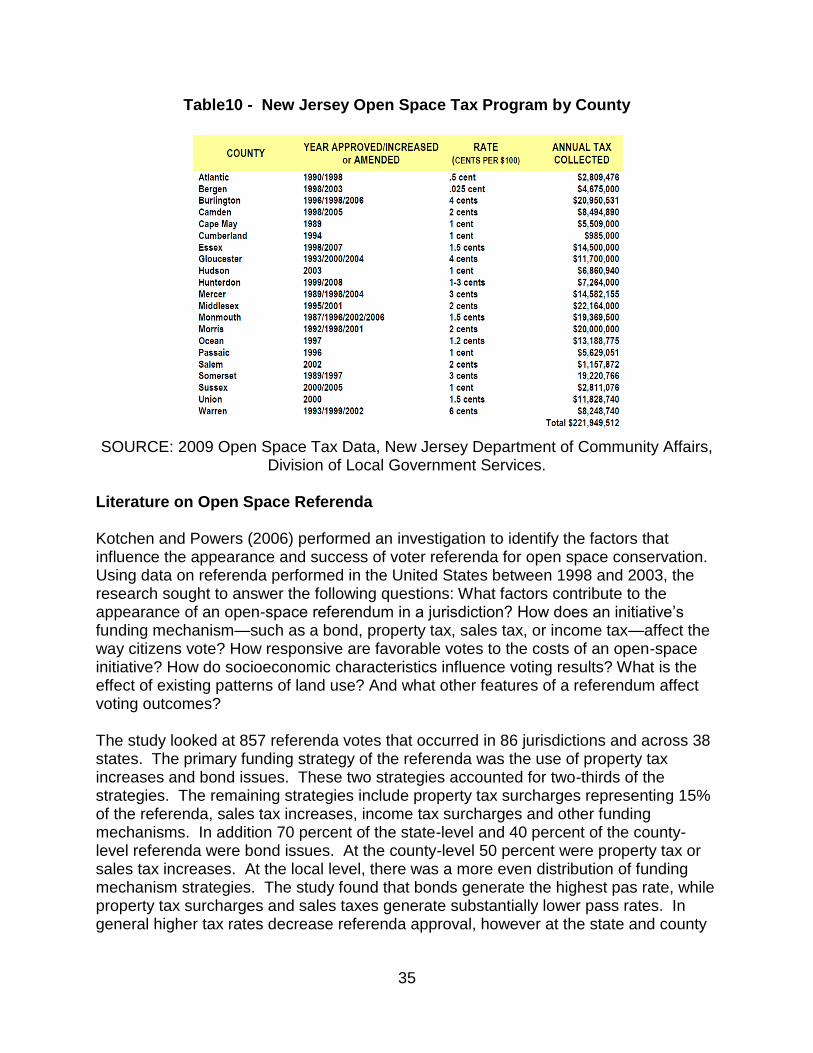
35
Table10 - New Jersey Open Space Tax Program by County
SOURCE: 2009 Open Space Tax Data, New Jersey Department of Community Affairs,
Division of Local Government Services. Literature on Open Space Referenda Kotchen and Powers (2006) performed an investigation to identify the factors that influence the appearance and success of voter referenda for open space conservation. Using data on referenda performed in the United States between 1998 and 2003, the research sought to answer the following questions: What factors contribute to the appearance of an open-space referendum in a jurisdiction? How does an initiative’s funding mechanism—such as a bond, property tax, sales tax, or income tax—affect the way citizens vote? How responsive are favorable votes to the costs of an open-space initiative? How do socioeconomic characteristics influence voting results? What is the effect of existing patterns of land use? And what other features of a referendum affect voting outcomes? The study looked at 857 referenda votes that occurred in 86 jurisdictions and across 38 states. The primary funding strategy of the referenda was the use of property tax increases and bond issues. These two strategies accounted for two-thirds of the strategies. The remaining strategies include property tax surcharges representing 15% of the referenda, sales tax increases, income tax surcharges and other funding mechanisms. In addition 70 percent of the state-level and 40 percent of the county-level referenda were bond issues. At the county-level 50 percent were property tax or sales tax increases. At the local level, there was a more even distribution of funding mechanism strategies. The study found that bonds generate the highest pas rate, while property tax surcharges and sales taxes generate substantially lower pass rates. In general higher tax rates decrease referenda approval, however at the state and county
36
levels the opposite effect was observed. Factors influencing referenda differ between the state-county level and the local level. The study also looked at New Jersey and Massachusetts to determine characteristics that influence where referenda were put up for a vote. The study found that referenda tend to occur in wealthier communities with greater population growth. Jurisdictions with more open space and recent open-space loss are more likely to have held a referendum. In addition jurisdictions with greater household incomes, home values, and home ownership rates also tend to hold a referendum vote. Open Space Tax in New Jersey In recent years, due to the economic climate, the open space tax has been challenged and is seeing changes. In Burlington County, the Board of Freeholders recently approved a property tax levy keeping the tax rate at the 4 cents per $100 of assessed property value (Cornegno, 2012). Much of the taxes collected are being used to maintain and develop the county’s expanded park system, rather than for open space acquisition. The remainder would go into the open space account to be distributed to the county’s new municipal park aid program. The changing approach to the uses of the open space tax comes as a result of decrease in property values. While Burlington County repurposed their open space tax, Morris County reduced its open space tax five years in a row. In 2007 the tax was set at 4.5 cents per $100 assessed value. The rate in 2012 is 1.25 cents per $100 assessed property value. The decrease is being described as a means of returning money to the residents of Morris County. Hudson County Open Space Tax Hudson County was the last county in New Jersey to approve an open space tax. In 2003, a referendum was passed allowing the county to establish an Open Space Recreation and Historic Preservation Trust Fund for the purpose of improving and expanding open space and recreational facilities while restoring historic and cultural resources. The tax was set at one cent per $100 assessed property value beginning in 2004. The tax drew between $6 and $7 million annually depending on the county’s ratable base, allowing the county to purchase land for ball fields, upgrade parks, build an amphitheater and help restore historic sites, including Harsimus Cemetery in Jersey City. In 2010, the Board of Freeholders voted to reduce the tax to half a cent with the new rates just enough to pay for debt service for the next year, with no additional awards to me made. The reduction in the tax was to reduce tax burden on its residents, especially in areas like Hoboken which had its county taxes increased annually due to the

37
declining real estate market. In 2012, the original tax was restored to one cent. Hoboken is the only municipality within the county to have its own open space tax.
38
Summary Nationwide between 1998 and 2000, voters designated more than $17.5 billion for open space protection, approving 85 percent of 459 state, county and local open space ballot measures. In most cases, state or local governments ask voters to approve special allocations, dedicated taxes, or bonding for open space preservation, either through binding or nonbinding referenda. Property owners increasingly recognize that preserved open space enhances property values and reduces the need for additional municipal services and infrastructure such as sewers, roads, schools and police that would be required if open lands were developed. This taxpayer support of funding for open space, born of both altruism and self-interest, is having a profound impact on the way open space preservation is accomplished in the United States. In recent years, many New Jersey counties and municipalities have, with voter approval, established dedicated open space taxes. Building consensus for such an open space tax usually begins as the brainchild of a core group. The core group has the legal, financial, public speaking and political skills and resources necessary to achieve passage of an open space referendum. Needed is an understanding of the community and its resources. This will arm organizers with the information they need to make their case and allow organizers to gauge community support and their chances for success. Public opinion polls may be necessary to hear what voters are thinking about the potential for an open space tax. The opinion poll would also be useful in determining what tax will be supported and affordable. Being successful in passing an open space tax requires building a coalition including the public, local officials and even potential opposition. Finally what is needed in passing an open space tax is to be able to tell the story through the use of public relations material. References Association of NJ Environmental Commissions (ANJEC), A Handbook for Public Financing of Open Space in New Jersey, December 2001. National Park Service, Land and Water Conservation Fund, http://www.nps.gov/ncrc/programs/lwcf/history.html, Accessed August 13, 2012. Kotchen, Matthew J. , Powers, Shawn M., Explaining the Appearance and Success of Voter Referenda for Open-Space Conservation, Journal of Environmental Economics and Management , Vol. 52, 2006, pp. 373–390.

39
Cornegno, Carol, Burlington County open space tax holds steady, CourierPostOnline, http://www.courierpostonline.com/article/20120809/NEWS01/308090026/Burlington-County-open-space-tax-holds-steady, Accessed August 14, 2012.
40
CASE STUDY 9: Hudson Bergen Light Rail Transit (LRT) (Hudson County, New Jersey)
Introduction Initiated in the late 1990s, Hudson Bergen Light Rail (LRT) is one of the pioneer guideway transportation projects in the US using Design-Build-Operate-Maintain (DBOM) through a private-public partnership arrangement. New Jersey Transit (NJ TRANSIT) is the owner of the project and there are some publications on the project. However, a close look at the PPP process and impact of the continuous expansion of the services warranted its selection as a case study in this particular research. Background After more than a decade of extensive planning and studies of the New Jersey Waterfront (Liu, Pendyala and Polzin, 1998; Liu, 1996; and Robins, et al. 1989), NJ TRANSIT entered into a Public-Private Partnership for the Hudson-Bergen Light Rail Transit (LRT) project in 1996. The contract awarded $1.1 billion to a joint venture known as 21st Century Rail. The mission of the team was to design and construct the LRT infrastructure, procure the equipment, operate the service, and maintain it for 15 years. The project scope was subsequently increased resulting in a $1.9 billion contract including 20 years of operations and maintenance. The Hudson-Bergen LRT marked the first Design-Build-Operate-Maintain (DBOM) project in the U.S. for a "transit" application, and was the first such contract awarded to a single entity. The Hudson-Bergen line has brought considerable commercial and residential development to portions of the Hudson River waterfront, helping to transform abandoned industrial neighborhoods into thriving communities. As shown in the figure attached below, the first segment of HBLRT, opened in 2000, connects Exchange Place in Hoboken and West Side Avenue and 34th Street in Bayonne. The second segment, opened between 2000 and 2005, extends the LRT service from Hoboken terminal to Tonnelle Ave in the north. And the southern extension to 8th Street in Bayonne opened in 2011. The Hudson Bergen LRT, made of 21 miles and 24 stations, was developed in multiple phases through a creative DBOM contract. A product of intensive planning, public participation and political cooperation, the HBLR is a testament to the value of investment in new transportation infrastructure. Serving 44,000 passengers daily, the Hudson Bergen LRT has provide user friendly, environmental friendly travel choices for northern jersey residents and sometimes, critical link to job accesses. As the north-south connector between Hudson and Bergen County, the HBLRT complements the PATH, an east-west transit distributor and direct connection to New York City. The HBLRT also provides connections to suburban commuter rail services, ferry services to NYC and many bus stops at various locations and access to various park-n-ride lots.
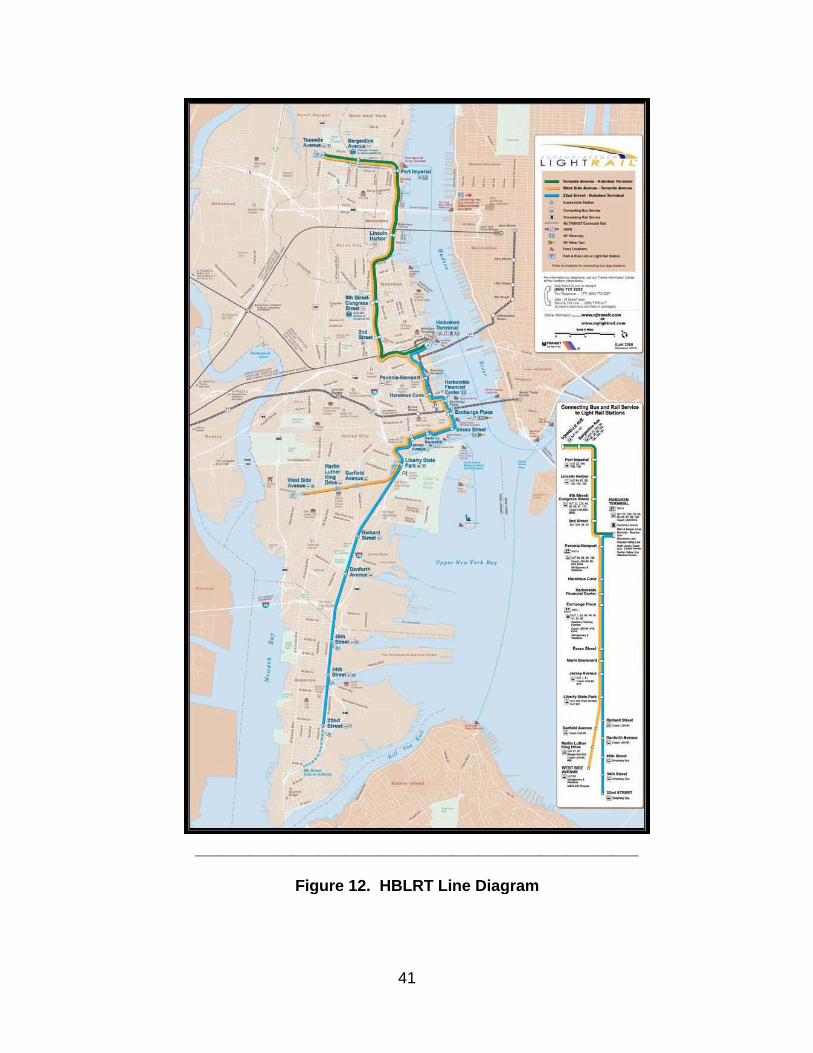
41
__________________________________________________
Figure 12. HBLRT Line Diagram
42
Motivation/Initiation Different from many rural or detraining urban areas, the Hudson River Waterfront was undergoing rapid redevelopment during the 1980s. The pace of development was so fast that NJ TRANSIT was faced with the possible loss of desperately needed transportation rights-of-way if quick action was not taken. In addition, the environmental permit review process required for waterfront development in New Jersey offered the opportunity for the state to dedicate transit easements and require developers to provide these easements as a mitigation measure for the heavy traffic congestion that development is expected to cause. To take advantage of this opportunity, NJDOT entered into negotiations with developers. As the easement preservation process was on going simultaneously with the UMTA alternatives analysis (AA) and draft environmental impact statement (EIS) requited by Urban Mass Transit Administration (UMTA, predecessor of Federal Transit Administration) in the region, several bus and LRT modes had to be considered in formulating easement agreements so as not to preclude future federal funding. Also, because developers retained air rights above the easements, NJDOT and NJ TRANSIT had to provide information to developers and approve air rights construction without a final transit way design in place. The more transparent process had made more information or more detailed information to many stakeholders, which has paved the way for the future joint venture formation for the Hudson Bergen LRT DBOM team. Details of the Partnership The public-private partnership (PPP) established in 1996 between NJ TRANSIT and 21st Century Rail Corporation was to design, build, operate, maintain (DBOM), and finance the HBLRT located in Hudson and Bergen counties in northern New Jersey. The 21st Century Rail team was a consortium led by Raytheon Infrastructure Services, which took responsibility for the design and construction of the system and the subsequent operation and maintenance of the vehicles for 15 years. Kinkisharyo USA was to procure, commission, and maintain the light rail vehicles and Itochu Rail Car was to provide project financing. The project scope was later modified to eliminate DBOM-contractor financing, change initial routes, and include 20 years of operations and maintenance, resulting in a final contract. The HBLRT contract became the nation's first DBOM contract, or "super tumkey" project for a mass transit system application, and was the first such contract awarded to a single contractor. The project was completed with a combination of federal and local funds.

43
Reduced Project Duration The DBOM process enabled by the PPP process has significantly shortened the construction period for Hudson Bergen LRT. As shown in the figure below, the HBLRT service was inaugurated in five years, which was less than half of the project period, 12 years, by traditional design-bid-build procedures.
_____________________________________________________________
Figure 13. HBLRT Schedule Shared Risks As the partnership has identified the total project cost in the early stages of the development and shared information and processes used to derive the costs, all stake holders has the satisfaction to share risks and reward. In this particular case, NJ TRANSIT shouldered the funding and income risk since all funding came from the public sectors, ranging from state transportation trust fund to federal earmarked program. NJ TRANSIT shares the income risk as it recovers the fare box, markets the services and promotes ridership. The private sector is responsible for the performance and cost risk due to the performance based payment structure and fixed price contracts. Operator responsible for all maintenance and personnel costs. NJ TRANSIT pays annual fee to Operator. Lower indirect costs include avoided costs attributable to the selection of a PPP. Indirect cost savings also result from the transfer of risk of operating and maintenance cost increases to a consortium. NJ Transit will pay the Hudson-Bergen Light Rail project’s DBOM consortium a guaranteed price in 1996 dollars for operation and maintenance of the line, subject to increases in the consumer price index (CPI) and other inflation indices for selected operating costs, including electricity. This insulates the agency from growth in operating costs for reasons other than inflation, and provides the operating consortium incentive to keep a lid on O&M cost escalation.
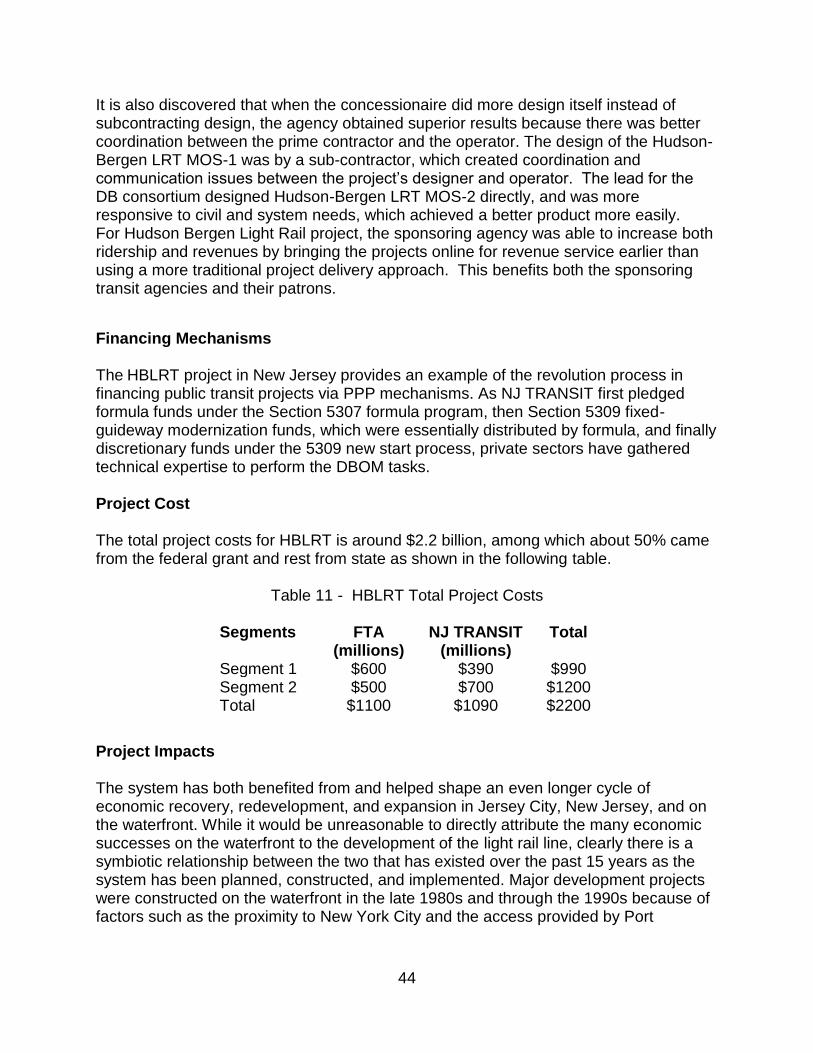
44
It is also discovered that when the concessionaire did more design itself instead of subcontracting design, the agency obtained superior results because there was better coordination between the prime contractor and the operator. The design of the Hudson-Bergen LRT MOS-1 was by a sub-contractor, which created coordination and communication issues between the project’s designer and operator. The lead for the DB consortium designed Hudson-Bergen LRT MOS-2 directly, and was more responsive to civil and system needs, which achieved a better product more easily. For Hudson Bergen Light Rail project, the sponsoring agency was able to increase both ridership and revenues by bringing the projects online for revenue service earlier than using a more traditional project delivery approach. This benefits both the sponsoring transit agencies and their patrons.
Financing Mechanisms The HBLRT project in New Jersey provides an example of the revolution process in financing public transit projects via PPP mechanisms. As NJ TRANSIT first pledged formula funds under the Section 5307 formula program, then Section 5309 fixed-guideway modernization funds, which were essentially distributed by formula, and finally discretionary funds under the 5309 new start process, private sectors have gathered technical expertise to perform the DBOM tasks. Project Cost The total project costs for HBLRT is around $2.2 billion, among which about 50% came from the federal grant and rest from state as shown in the following table.
Table 11 - HBLRT Total Project Costs
Segments FTA (millions)
NJ TRANSIT (millions)
Total
Segment 1 $600 $390 $990 Segment 2 $500 $700 $1200 Total $1100 $1090 $2200
Project Impacts The system has both benefited from and helped shape an even longer cycle of economic recovery, redevelopment, and expansion in Jersey City, New Jersey, and on the waterfront. While it would be unreasonable to directly attribute the many economic successes on the waterfront to the development of the light rail line, clearly there is a symbiotic relationship between the two that has existed over the past 15 years as the system has been planned, constructed, and implemented. Major development projects were constructed on the waterfront in the late 1980s and through the 1990s because of factors such as the proximity to New York City and the access provided by Port
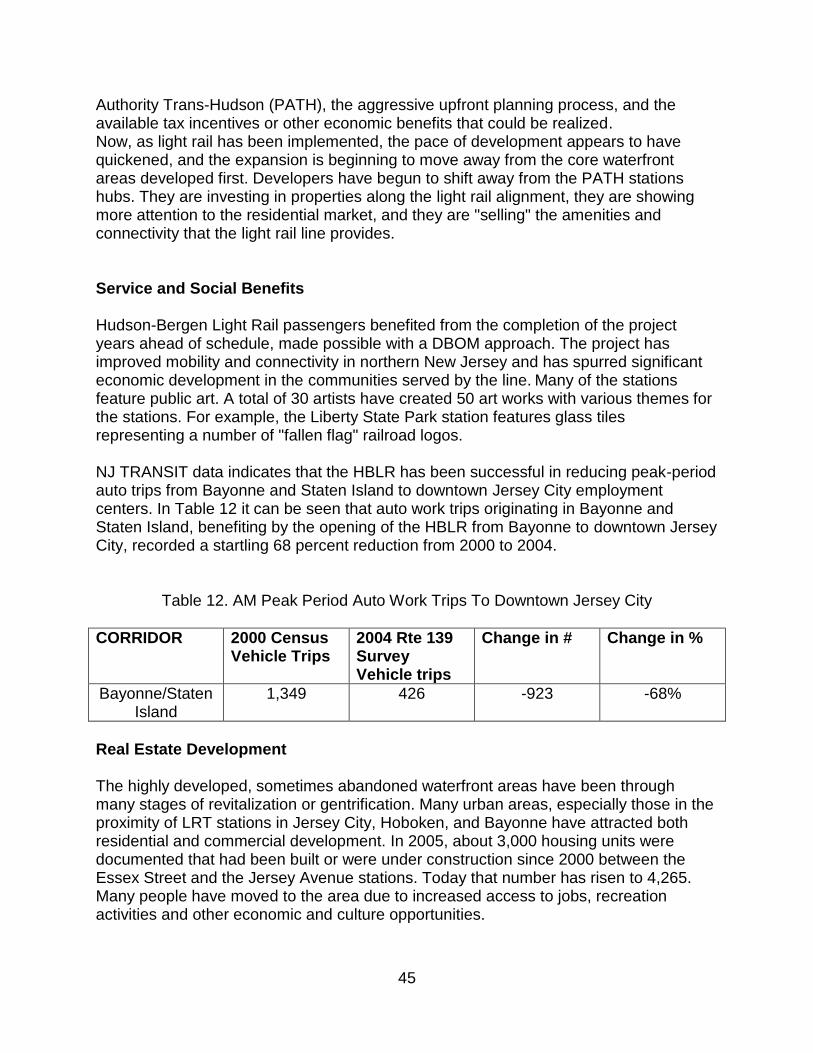
45
Authority Trans-Hudson (PATH), the aggressive upfront planning process, and the available tax incentives or other economic benefits that could be realized. Now, as light rail has been implemented, the pace of development appears to have quickened, and the expansion is beginning to move away from the core waterfront areas developed first. Developers have begun to shift away from the PATH stations hubs. They are investing in properties along the light rail alignment, they are showing more attention to the residential market, and they are "selling" the amenities and connectivity that the light rail line provides. Service and Social Benefits Hudson-Bergen Light Rail passengers benefited from the completion of the project years ahead of schedule, made possible with a DBOM approach. The project has improved mobility and connectivity in northern New Jersey and has spurred significant economic development in the communities served by the line. Many of the stations feature public art. A total of 30 artists have created 50 art works with various themes for the stations. For example, the Liberty State Park station features glass tiles representing a number of "fallen flag" railroad logos. NJ TRANSIT data indicates that the HBLR has been successful in reducing peak-period auto trips from Bayonne and Staten Island to downtown Jersey City employment centers. In Table 12 it can be seen that auto work trips originating in Bayonne and Staten Island, benefiting by the opening of the HBLR from Bayonne to downtown Jersey City, recorded a startling 68 percent reduction from 2000 to 2004.
Table 12. AM Peak Period Auto Work Trips To Downtown Jersey City
CORRIDOR 2000 Census Vehicle Trips
2004 Rte 139 Survey Vehicle trips
Change in # Change in %
Bayonne/Staten Island
1,349 426 -923 -68%
Real Estate Development The highly developed, sometimes abandoned waterfront areas have been through many stages of revitalization or gentrification. Many urban areas, especially those in the proximity of LRT stations in Jersey City, Hoboken, and Bayonne have attracted both residential and commercial development. In 2005, about 3,000 housing units were documented that had been built or were under construction since 2000 between the Essex Street and the Jersey Avenue stations. Today that number has risen to 4,265. Many people have moved to the area due to increased access to jobs, recreation activities and other economic and culture opportunities.
46
Another example is the construction activities at the 9th Street station in Hoboken, which has focused on the overhaul of the Monroe Center industrial building complex, creating new retail and gallery space on the first and second floors with artist studios on the third, fourth and fifth levels. The Monroe Center is adjacent and south of the HBLR station. In January 2007, the new upscale restaurant, Shades, opened in a portion of the ground level space. According to Barry Campbell, Director of Real Estate Development, there will four or five more retailers on Monroe Street; a 10,000 square foot theater scheduled to open in September; and, a child care center taking 8,000 to 10,000 square feet of space which will include a drop-off area and a play area. Development around the 9th Street Station in Hoboken also continues, but at a moderate pace compared to the Essex Street–Jersey Avenue corridor in Jersey City. However, the 9th Street station now ranks sixth in ridership, a 46.2 percent increase in the past year. No doubt new development projects have contributed to increase boarding’s, but the value of the station elevator to Congress Street at the top of the escarpment should not be overlooked. This connection provides the Jersey City Heights and southeastern Union City neighborhoods, at Congress Street, with immediate access to points along the Gold Coast and New York City via the HBLR (and PATH or ferries). On the other hand, NJ Transit discovered that its DBOM contract for the Hudson-Bergen LRT project did not adequately address the quality of service to the traveling public. While the consortium received a penalty or bonus for on-time performance, there were no incentives for station cleanliness or notification of customers of changes in service or other announcements, which became an issue. This experience highlights the need for detailed performance standards and proper incentives for performance. Summation of Factors As the first DBOM transit project in North America, HBLRT seemed have everything at work: strong support from then Governor Whitman, which ensured the funding allocation from the State Transportation Trust Fund. Excellent representation in congress, Senate Lautenberg and Congressman Menenduz helped to tap into various federal funding sources, which provided about 50 percent of the total project costs. Facilitated by the PPP, the project was fast tracked from “Alternative Analysis (AA) to contract award in two years. Managed under a single entity, 21st Century Rail, the construction phase was completed in 40 months. Environmental approval, full funding grant agreement and project award all took place in the same month. The continuous involvements of venders in the development of procurement, award criteria, contract terms and conditions, performance requirements, technical standards and cost drivers are critical to have the buy-in and trust of all stakeholders, which is the key to have the agreement signed in a very short time period. The HBLRT contract is unique that the O&M cost guaranteed for a specific level of service. Further incentives have been built into O&M requirements. Both private and public partners feel are protected during O&M phases: the owner is protected against windfall profits and private operator is protected from catastrophic loss. Another great
47
benefit for the private sector was to provide stability for the leading contractor, Raytheon Corporation, especially during the period of extreme corporate merging and acquisitions.
48
References Robins, M., J. Lutin, A. Harf, C. Ellis and V. Kikyla. 1989. “Integrating Light Rail Transit Into Development Projects on the Hudson River Waterfront”. Transportation Research Board Special Report No. 221. Liu, Rongfang, R. Pendyala, and S. Polzin. “Simulation of the Effects of Intermodal Transfer Penalties on Transit Use.” Transportation Research Record 1623, The Journal of Transportation Research Board, National Research Council, Washington, D.C., pp. 88-95, 1998. Peer Reviewed. Liu, Rongfang, Assessing Intermodal Transfer Disutilities. University of South Florida, 1996. Marks, Stephan D. 2000. Implementing an Urban Mass Transit System, Proceedings of 2000 APA National Planning Conference. Person, Lenore. The History of Hudson River Ferry Service. www.hudsonriver.com/ferry.htm Wells, Jan S. and Martin E. Robins. 2006. Hudson Bergen Light Rail Line Case Study in Communicating the Benefits of TOD by Cali Gorewitz and Gloria Ohland. Reconnecting America’s Center for Transit-Oriented Development. http://www.reconnectingamerica.org/public/practices
49
CASE STUDY 10: United Water Partnership (Hoboken, NJ)
Introduction In 1994, the City of Hoboken, under the County and Municipal Water Supply Act (N.J.S.A. 40A.31), entered into a public-private partnership agreement and operation, maintenance and management services agreement for the city’s municipal water system. The agreement was the first public-private partnership for water services in New Jersey. The initial agreement was for a period of 10 years. This agreement was later renegotiated to be a 20 year agreement. In the partnership the city retains ownership of the infrastructure and of the rate-setting responsibility. United Water is responsible for operating the city’s water supply, providing system maintenance and repairs, customer service, billing and collections, as well as providing 24-hour emergency service. United Water has partnerships with several municipalities across the county. As a subsidiary of the French company SUEZ ENVIRONNEMENT, United Water provides water and wastewater services to approximately 5.5 million people in the United States. The company owns and operates 16 water and wastewater utilities, operating 90 municipal and industrial water and wastewater systems through public-private partnerships and contract agreements. In recent months, the partnership has come into question in light of water main breaks that has continued to plague the city. In March and April of 2013, Hoboken sustained five water main breaks and leaks over an eight-day period. A sixth water main break occurred in May as a result of construction. The Mayor of Hoboken, Dawn Zimmerman, attributes these incidents to the partnership agreement made between the City and United Water in 1994. In that 30-year agreement, no provision was made for planning or funding of non-emergency infrastructure upgrades. Background For more than 100 years Hoboken operated its own water system. An aging system and the lack of an on-going capital improvement program left the city with $800,000 a year deficit. Rather than implement high rate changes, Hoboken looked for innovative financial solutions, which led to the public private partnership. Hoboken, like many municipalities have looked to public-private partnerships for its water and wastewater system. The National Association of Water Agreements states that more than 2000 water supply facilities from New York to California are operated in public-private partnerships. In New Jersey, Public-Private Partnership agreements for water supply and wastewater treatment systems are developed under the New Jersey Water Supply Privatization or the New Jersey Water Supply Public-Private Contracting Act. The New Jersey Water
50
Supply Privatization, which became effective in February 1985, established procedures that enabled municipalities to contract with private firms for the construction of water filtration systems and the provision of water supply services. The contract term was not to exceed 40 years with services to be provided including financing, designing, construction, operation, or maintenance, or combination of services, of a water supply facility, including a water filtration system, or for water supply services. The New Jersey Water Supply Public-Private Contracting Act, which was adopted in 1994, was intended to improve limitations of the previous Water Supply Privatization Act. The previous Act was found to include time consuming procedures and a regulatory framework that dissuaded private firms and local government units from entering into contracts. Both Acts provide a municipality with the authority to procure a water or wastewater utility project on a DB or DBO basis and allow for long-term contractual relationships. Hoboken-United Water Agreement In July 1994, United Water paid out to Hoboken $5.5 million for the agreement to manage its water supply. Three additional payments were made between 1996 to 2001, with a total payment of $13.2 million made by United Water to Hoboken. These funds were used to plug holes in the general budget, rather than make investments in the city’s infrastructure. Much of the water-bill revenue generated, or approximately $240 million over the life of the agreement, is provided to United Water who makes an estimated $100 million in profit. Under the current water agreement, United Water is obligated to invest $350,000 per year into Hoboken's water system for repairs and capital improvements. The majority of these funds, almost 80 percent, is spent on existing repairs, such as fixing water main breaks, leaving little money for improvements to the system. United Water has stated that over $3.2 million, or approximately $107,000, has been made in capital improvements over the life of the agreement. In July 2004, the Hoboken-United Water agreement was renegotiated with the agreement extended for another 10 years to 2024. The contract included an initial payment by United Water to Hoboken of $2.7 million with an additional $300,000 to further upgrade remote meter reading technology. The agreement maintained the level of funding in capital improvements of $350,000 per year found in the original contract. Water rates remained consistent with the rate structure that was currently in effect. After the water main breaks in March through May, 2013, the agreement between Hoboken and United Water came into question with Mayor Dawn Zimmerman critical of the short-sightedness of the original agreement to include more funding for improvements. Options available to the City of Hoboken included buying out the agreement between Hoboken and United Water, terminating the contract, which have a termination cost, or renegotiating a new agreement that provides for extensive investment in infrastructure. The City also sought to establish an infrastructure trust fund to ensure that revenue from water supply contracts be dedicated to infrastructure improvements. Also, the City will look into developing a 10 to 20 year master plan for upgrading the water distribution system.
51
In May 2013, the City reached an agreement with United Water where the water utility will pay for the costs of conducting a complete master plan of Hoboken’s water distribution infrastructure. The plan calls for providing a prioritized schedule for upgrading the City’s water distribution system. Funding for these capital improvements is expected to come from a renegotiated agreement with United Water. Literature on Water Utility Partnerships The United States General Accounting Office (GAO) performed a study examining: (1) how funds obtained from water and wastewater utilities compare with the costs of providing service; (2) how these utilities manage existing capital asses and plan for needed capital improvements; and (3) the factors influencing private companies to operate or own publicly owned water and wastewater facilities. To address the third goal, GAO obtained information from five private companies with privatization agreements. The privatization agreements used by the companies ranged from contracts to operate and maintain drinking water or wastewater facilities to agreements that provided ownership to the private company. The type of agreement has some impact on the business strategy of the private companies involved. Some place more emphasis on contract operations, while others focused on ownership or were interested in a private agreement because of the size or location of the utility. The study found for the companies studied, the most common form of privatization was contracting which typically involved a competition among private bidders to perform certain activities. In this agreement, the government or public entity remains the financier and has management and policy control over the quality of the services to be provided. In general, the most common type of public-private partnership in the field of drinking water and wastewater utilities was found to be operations and maintenance contracts covering 1 to 5-year periods. Another agreement type used is “design-build-operate” where the local government retains ownership of the utility and the contractor is responsible for operation and maintenance. Several criteria were cited as important for assessing the profitability of a privatization agreement between a private company and a water utility. Improving efficiency is a key factor in evaluating the profitability of a utility for privatization because this has potential impacts on the companies’ profits. Private companies can possess the financial and technical capabilities that may be lacking in public utilities. The proximity of the company to their other operations was also cited as part of the criteria for assessing privatization. Proximity becomes important as it enables technical experts to travel to the company’s locations at reasonable costs. Proximity also can allow the company to take advantage of economies of scale. The potential for system growth in terms of population served was also cited as a factors included in determining profitability. Projected population growth equates to a potential increase in customer base and additional revenues. The terms of operation and maintenance contracts also was found to be important. Longer time period covered by the contract enabled the company greater opportunity to recoup its investment. Finally, the potential need for capital
52
investment also impacted profitability or the type of contract private companies are willing to enter into. Utilities with needs for upgrades are not a deterrent for a private agreement, however, the private company would need to have an accurate understanding of the nature of any investments needed and this would need to be included in the contract. The study also reviewed state requirements or policies that can facilitate or impeded privatization agreements. The state of New Jersey, along with Connecticut, Indiana and Pennsylvania, were contacted as these states have laws that give state regulators the authority to provide for qualified utilities to acquire or take over “troubled” utilities with specific problems. Water Utility Partnerships in Other Municipalities Baynonne, New Jersey In December, 2012, the City of Bayonne entered into a joint venture with United Water and KKR, a global investment firm, for operation of the city’s water and wastewater system. Under the agreement, the Bayonne Municipal Utilities Authority (BMUA) maintains ownership of the water and wastewater system, and United Water operates the system under an operations and maintenance agreement. The 40-year water and wastewater concession included an initial payment to the BMUA of $150 million with further funding of $157 million that would be used over the life of the contract. KKR will fun 90% of the joint venture with United Water and will receive most of the water-bill revenue for the life of the contract. In addition to maintaining ownership, BMUA also provides oversight of the partnership, ensuring adherence to standards and customer service performance. BMUA also maintains control of rates, which are guided by a formula in the agreement. United Water and KKR are guaranteed a minimum payment regardless of the water usage. As part of the terms of the agreement, the joint venture eliminated the utility’s debt, set aside approximately $14 million over the first three years for capital improvements and provided Bayonne with access to United Water’s water expert. The agreement was hoped to lead to improvements in service reliability and water quality, while maintain rate stability. It is anticipated that the agreement will improve the city’s finance and allow investment in other services. In May, 2013, Moody’s Investors Service upgraded the Bayonne's credit rating from “negative” to "stable" citing the water partnership. Summary Public-Private Partnerships for operation and maintenance of water and wastewater facilities in the US have been both praised and challenged. The benefits cited from partnerships include: handling employee relations and benefits; providing the same level of service at a lower cost; assuming liability and risk for environmental compliance; recruiting and retaining operators; and purchasing materials in an expedited manner
53
(Cairo and Frangione, 2006). Some potential areas where partnerships can be improved are in the ability to reduce backlogs for preventive maintenance and in lowering prices. Partnerships in water and wastewater facilities, if done correctly, can have positive impacts on the environment, customers, the municipality and the employees. Many municipalities report regulatory compliance was achieved under the partnership than without a partnership agreement. Cost savings can also be achieved under a partnership agreement References Cairo, P. and Frangione, C. (2006) An Evaluation of Public-Private Partnerships for Water and Wastewater Systems. World Environmental and Water Resource Congress 2006: pp. 1-12. US GAO (2002), Water Infrastructure: Information on Financing, Capital Planning, and Privatization, GAO-02-764.
Public/Private Partnerships in Municipal Water and Wastewater Systems: Case Studies of
Selected Cities, The Urban Water Council - A Program of the U.S. Conference of Mayors.
http://www.usmayors.org/urbanwater/documents/hoboken.htm
54
CASE STUDY 11: New Jersey Transportation Development District Act 1989 (Brief Comments) New Jersey's Transportation Development District Act of 1989 created a means to make special provision for financing transportation improvements by charging businesses in an area for such improvements. The Act sought to accomplish this purpose by allowing county governing bodies to apply to the transportation commissioner to delineate a transportation development district (TDD) in the jurisdiction's boundaries. The applicants needed to show evidence of growth in their borders and the existence of a master plan which they followed. However, the Act failed to have a major impact because few governments participated. Only four counties applied for TDD status--Mercer, Atlantic, Hunterdon and Union. Three of these applications had negligible impact in the long run. Atlantic County simply designated two existing Transportation Improvement Districts (TID) as TDDs. Despite Hunterdon and Union County having their applications approved, neither developed an operational district. Only Mercer designated a new, operational TDD at the I-95 (295) corridor. A number of analyses have tried to explain this lack of interest. Some analysts say the TDD concept in general can be problematic because districts are limited to high growth areas and sometimes are cumbersome to form and administer (e.g., Williams 2006). Other analyses accept the viability of TDDs but criticize New Jersey's statute for making the costs associated with creating TDDs high for counties and not allocating a clearly defined funding source for county planning. Another cited problem with the 1989 Act is that it did not permit use of TDD funds for transit operating expenses. Because of this omission, the statute limited the range of solutions it could address (Transportation Policy Institute 2000). Broad-based Acts might elicit greater participation. Both analyses highlight the importance of writing statutes that take into account implementation issues at the administrative level and the varying needs of different local governments. References Williams, Kristina. 2006. Alternative Strategies for Improving Transportation Facilities. Raleigh, North Carolina: North Carolina Department of Transportation. Transportation Policy Institute. 2000. Regional Intergovernmental Transportation Coordinating Study: Interim Report. New Brunswick, NJ: RITCSC.
55
CASE STUDY 12: North/Clybourn Station (Chicago, Illinois)
Motivation/Initiation In 2010, Apple spent $3.9 million in renovating the North/Clybourn station on the Chicago Transit Authority’s Red line in anticipation of the opening of a new Apple store. Apple agreed to complete the refurbishment of the exterior of the station and landscape an unused bus driveway between the station and the new store. The bus driveway was converted into a public plaza complete with benches and a fountain. Chicago Transit Authority (CTA) completed the refurbishment of the platform level of the station and the interior of the station. Apple paid all costs of the exterior, interior, and platform refurbishment. Apple also paid the Authority’s costs for design and construction management for all portions of the station refurbishment project. Project Structure In return, Apple was given the rights to an exclusive lease of the plaza space for at least 10 years at no charge. The agreement includes four five-year options to extend the lease, a thirty day termination for default provision and an automatic termination of the lease if Apple’s store lease terminates. Apple was also given the ability to exclusively advertise within the station at rates set by CTA, and the option to purchase station naming rights, if CTA decides to sell these rights. Apple would be given the right of first refusal or 30 days to decide whether to accept the price before CTA could accept an alternate offer. Financing Mechanisms The partnership was accomplished through an ordinance approved by the Chicago Transit Board. According to the ordinance (No. 009-92), Apple would pay for construction work on the outside of the building, not to exceed $1,789,000. The company also would pay for the CTA’s design, construction management and actual construction costs, not to exceed $2,108,000 Project Impacts CTA intends to hire a consulting firm to help develop a “revenue-generating corporate sponsorship program” which would allow companies the naming rights to CTA train lines, train stations and bus routes. The consultant would determine the market value of the name rights. The consultant would engage in public bidding to select the winning proposal for station naming to assure transparency and increased competition. Although there are many benefits of this partnership, CTA did not solicit any bids or analyze the value of the agreement. Apple initiated the partnership and no other
56
companies were given the opportunity to bid. A need for greater transparency in future agreements has been identified. CTA’s Corporate Partnership In 2012, CTA initiated its Corporate Partnership program through a bid to sell naming rights and sponsorships of 11 rail stations. Partnership would provide signage showing the corporate name first along with the station's existing name. The logo of corporate sponsors would appear on CTA system maps and the sponsor given exclusive advertisement inside the station. The valuation for sponsorship will vary by station depending on location, ridership, marketability and other measures. The selection will be based on the company’s reputation and financial stability. Experience of Other Transit Agencies Other transit agencies have sold naming rights to stations or have issued requests for proposals for naming stations. The developer Forest City Ratner went into an agreement with the New York Metropolitan Transportation Authority (MTA) to add “Barclays Center” to the name of the Atlantic Avenue-Pacific Street subway station adjacent to the Barclays Center. In return for naming the station, MTA will receive $200,000 per year for 20 years. The renaming of the station was part of the infrastructure improvement that came with the construction of the Barclay Center. The developer, Forest City Ratner along with organizations neighboring the center including MetroTech and Atlantic Center Mall, agreed to finance the station at a cost of $76 million in return for the air rights owned by the MTA above the arena’s plaza. Forest City Ratner will use the air rights to one day construct a world-class commercial building. In another example of renaming a station, a proposal to rename the 77th Street subway station to honor the former New York Mayor Ed Koch was halted by the MTA. The reasons given provide information on the consideration given in renaming a subway station. The MTA considers renaming a station if it indicates a geographical feature that will be useful for customers and/or if a sponsor is willing to pay for naming rights. The Southeastern Pennsylvania Transportation Authority (SEPTA) sold the naming rights to its Pattison Station in Philadelphia to AT&T. The agreement involved the change of the station name from Pattison Station to AT&T Station at a cost of $5 million over 5 years. The partnership came from a long-standing relationship between AT&T and SEPTA where AT&T is the only wireless carrier providing coverage underground along the Broad Street and Market-Frankford lines. Pattison station was selected for renaming as it serves as a transit hub for passengers traveling to and from games and other sports and entertainment events. The cost of the agreement was influenced by the passenger traffic using the station and whether this form of advertisement was comparable to television advertising.
57
The Massachusetts Bay Transportation Authority (MBTA) sought to develop a plan to allow companies and major local institutions to append their names to subway stops at 11 of their stations. The added names would also appear on signs inside and outside of stations and on MBTA websites and maps. If all 11 stations found company support, the expected revenues would be approximately $18.4 million total a year or $147 million over 8 years, which would be the length of the naming contract. Development of such a plan requires approval by the State congress. In an amendment to the Transportation Finance Bill, the Senate approved a measure to permit the MBTA to sell to private companies the naming rights to subway and commuter-rail stations. Opponents of Selling Naming Rights Despite the added revenue that comes with selling naming rights, this practice has opponents. Some say this only leads to excessive advertisement on a publicly owned facility. Another objection is that in the long run, the revenues gathered are not as lucrative as indicated. With name changes come changes to existing maps whose costs are now part of the transit agency. When the new name replaces and existing name, with no reference to the previous name, this can cause confusing to riders and set a bad precedent. Although transit agencies state new names will be within good taste, the naming of sports stadiums have shown that naming rights can follow a slippery slope. Elements of a Successful Partnership What seems to make for a successful partnership in selling naming rights of stations is that the partnership provides not just a means of raising revenue for the transit company, but it also promotes the stations development. Partnering companies involved in the renovation or development of the station provided not just a monetary contribution but showed a willingness to participate with the community and to have the station represent the company. In the North/Clybourn station renaming, CTA did not solicit any bids or analyze the value of the agreement. Despite the success of the partnership, greater transparency would have eliminated concerns that the partnership was not in the best interest of the public. The experience of other transit agencies selling naming rights of stations demonstrate a great variety in the approaches and cost taken in naming a station. In general, the cost of the agreement is influenced by the passenger traffic using the station and whether the station was developed by the partner. To date, there have not been many transit agencies able to generate interest in naming rights of stations. Where naming rights have been sold has been at locations associated with large developments.