feasibility of monitoring techniques for substances
TRANSCRIPT

Presenting to
IEA GHG Monitoring Network Meeting,
Potsdam, 7-9th June, 2011
Linda StalkerSenior Geochemist
Cooperative Research Centre
for Greenhouse Gas
Technologies (CO2CRC)
Feasibility of monitoring techniques for substances mobilised by CO2 storage in geological formations
© CO2CRC
All rights reserved
Outline
• Project participants
– Key points of the project
– Previous work
• Results
– Pressure and physical effects
– Geophysics
– Biosensors
– Cations, anions and pH
– Hydrocarbon Sensors
– CO2 Sensors
• Conclusions
Sample only
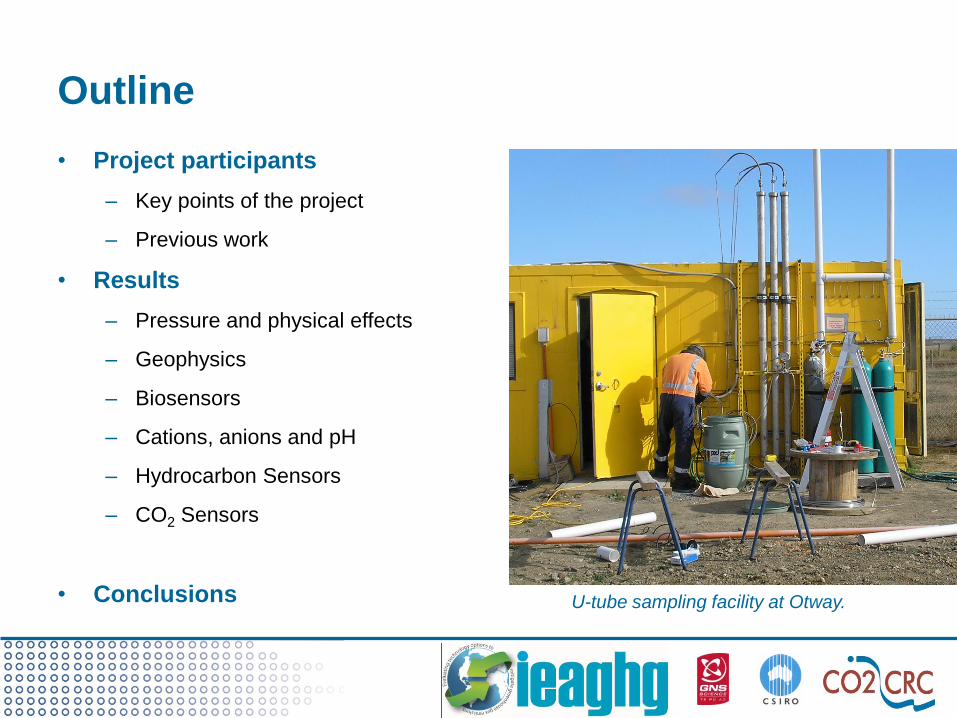
U-tube sampling facility at Otway.
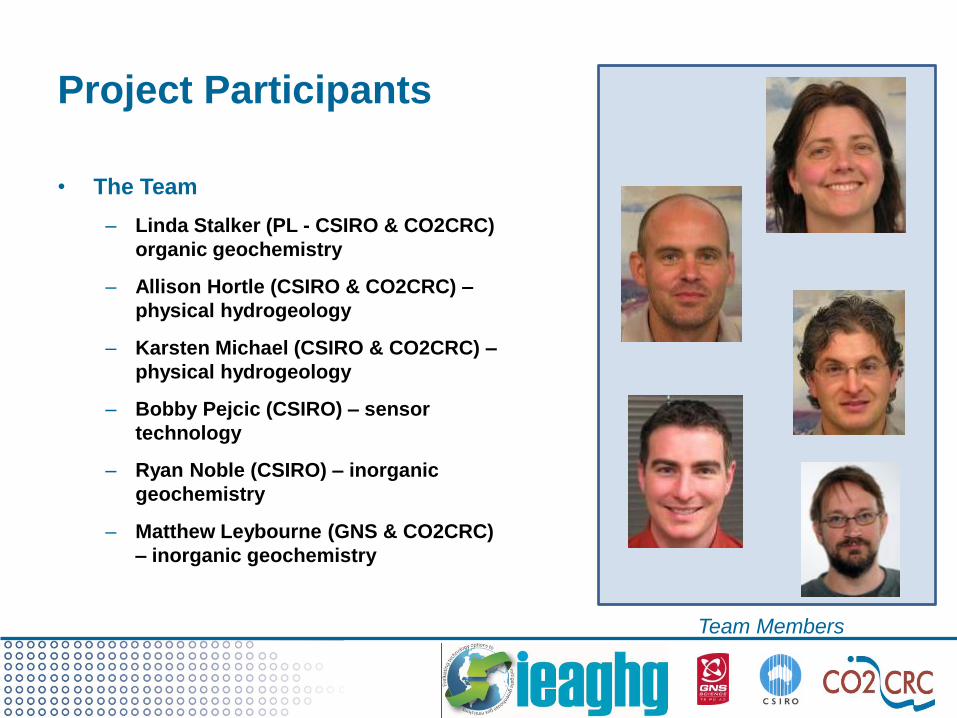
Project Participants
• The Team
– Linda Stalker (PL - CSIRO & CO2CRC)
organic geochemistry
– Allison Hortle (CSIRO & CO2CRC) –
physical hydrogeology
– Karsten Michael (CSIRO & CO2CRC) –
physical hydrogeology
– Bobby Pejcic (CSIRO) – sensor
technology
– Ryan Noble (CSIRO) – inorganic
geochemistry
– Matthew Leybourne (GNS & CO2CRC)
– inorganic geochemistry
Team Members
Sample only
Key points being covered in the project
– Flow effects
• e.g. pressure, thermal, flow, density
– Geochemical effects
• Dissolution, diagenesis or chemical alterations
– Shallow/surface effects
• Toxicity on biosphere or microbial effects
– Capture gas compositions
• Power plants, LNG, industrial sources
• Built on previous work “Downhole monitoring of chemical changes associated
with CO2 Storage” Ross et al, 2007, CO2CRC RPT07-0749
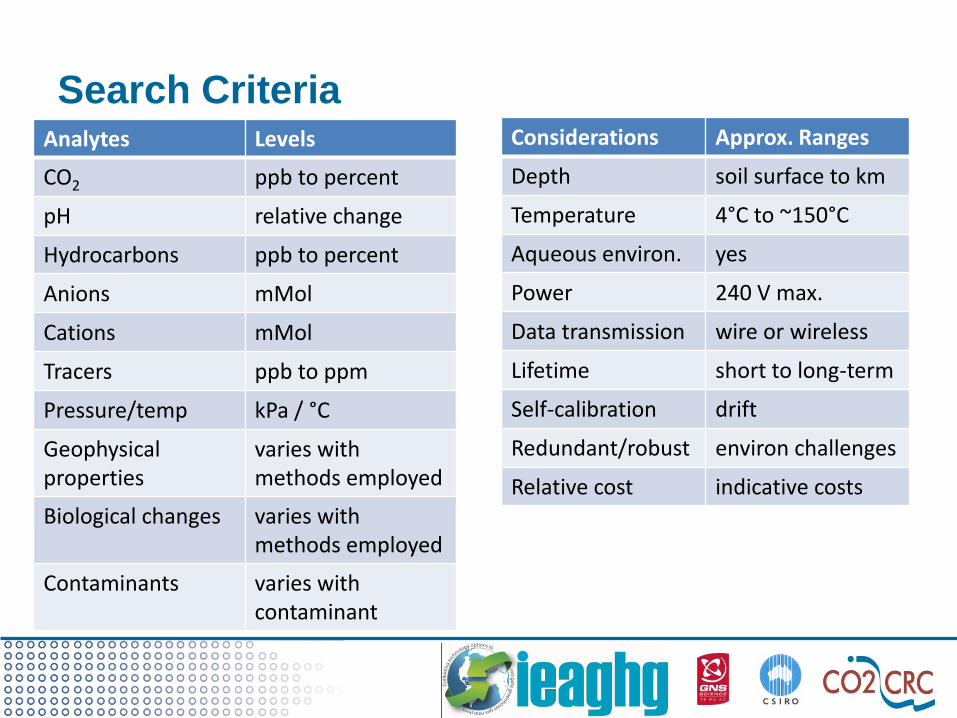
Search CriteriaConsiderations Approx. Ranges
Depth soil surface to km
Temperature 4°C to ~150°C
Aqueous environ. yes
Power 240 V max.
Data transmission wire or wireless
Lifetime short to long-term
Self-calibration drift
Redundant/robust environ challenges
Relative cost indicative costs
Analytes Levels
CO2 ppb to percent
pH relative change
Hydrocarbons ppb to percent
Anions mMol
Cations mMol
Tracers ppb to ppm
Pressure/temp kPa / °C
Geophysicalproperties
varies with methods employed
Biological changes varies with methods employed
Contaminants varies with contaminant

Methods Used• Literature Search
– ISI Web of Science
– ISI Derwent Innovations
Index
– others
• Case Study Reviews
– Pembina, Canada
– Ketzin, Germany
– Cranfield, USA
– Frio, USA
– Otway, Australia
©CO2CRC

Flow and physical effects
• The pressure pulse propagates to a
larger footprint than the CO2 plume
that generates it
• Increases coverage of
reservoir/aquifer monitored
• Many tools monitor changes
• Sensors (dependent on type)
+ equipment is increasingly robust
- data volumes & interpretation
increasingly difficult, need for more
complex models
• Multiport systems increase data
information types
• Instrument drift improving
• Wider use of fibre optics
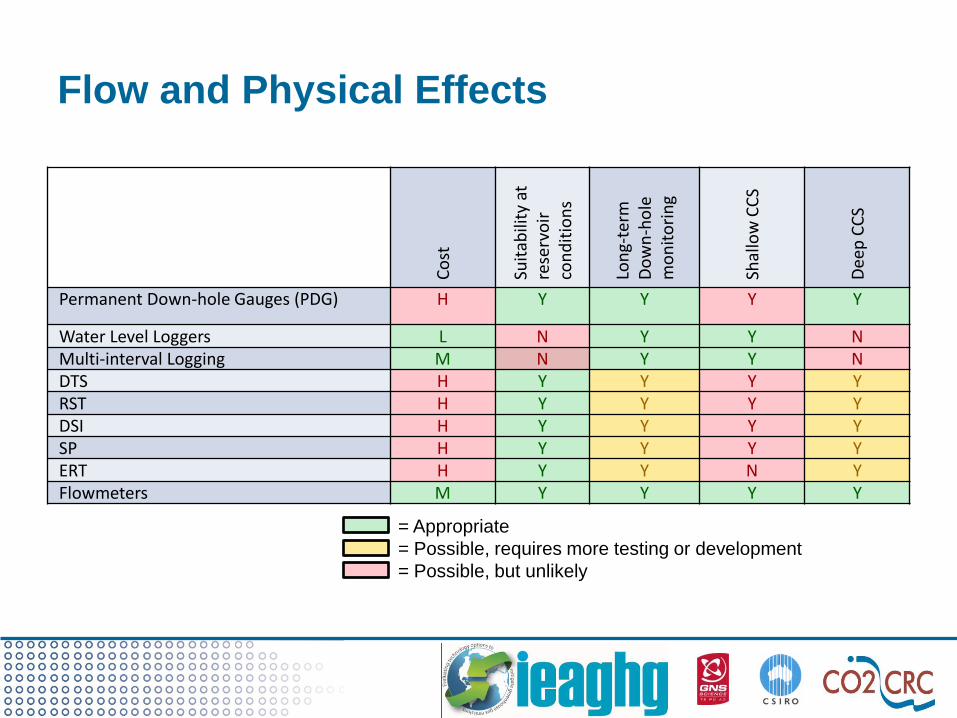
Flow and Physical Effects
Co
st
Suit
abili
ty a
t re
serv
oir
co
nd
itio
ns
Lon
g-te
rm
Do
wn
-ho
le
mo
nit
ori
ng
Shal
low
CC
S
Dee
p C
CS
Permanent Down-hole Gauges (PDG) H Y Y Y Y
Water Level Loggers L N Y Y NMulti-interval Logging M N Y Y NDTS H Y Y Y YRST H Y Y Y YDSI H Y Y Y YSP H Y Y Y YERT H Y Y N YFlowmeters M Y Y Y Y
= Appropriate
= Possible, requires more testing or development
= Possible, but unlikely

Geophysical
• For more detailed review refer
to IEA GHG “Quantification
Techniques for CO2 leakage”
• Focus on land-based tools and
those less covered by earlier
report
• Shallow groundwater changes
– Pressure, salinity increases, pH
reduction, metal mobilisation, Eh
reduction, temperature reduction
• Methods covered:
– Seismic methods, electromagnetics,
magnetotellurics, surface
deformation
– Other such as
• Magnetics, gravity, magnetic
resonance sounding, ground
penetrating radar

Geophysical
• Not widely used previously
– NMR (nuclear magentic
resonance) or MRS
– GPR (Ground
Penentrating Radar)
– Differential GPS
– Magnetics
• Airborne
• Ground
• Gradiometry
– Magnetotellurics/CSMT
Deep
Sh
allo
w
Plu
me lo
cati
on
/im
igra
tio
n
Fin
e-s
cale
pro
cesses
Leakag
e
Qu
an
tifi
cati
on
New
ad
dit
ion
3D/4D surface seismic
Time lapse 2D surface seismic
Multicomponent seismic
Boomer/Sparker
High resolution acoutstic imaging
Microseismic monitoring
4D Cross-hole seismic
4D VSP
Sidescan sonar
Multi beam echo sounding
Airborne magnetic
Magnetics* Ground magnetic
Magnetic gradiometry
Time lapse surface gravimetry
Time lapse well gravimetry
Surface EM
CSMT
Magnetotellurics
Sea bottom EM (CSEM)
Cross-hole EM/imaging
Permanenent borehole EM
Cross-hole ERT
ESP
Airborne hyperspectral imaging
Satellite interferometry
Airborne EM
Geophysical logs**
Pressure/temperature
Differential GPS
Tiltmeters
Magnetic Resonance Sounding
Borehole NMR
GPR - surface
GPR - borehole (tomography)
*Used to map faults/potential leakage points
** Geophysical logs included gamma, resistivity, neutron, gamma-gamma, induction and magnetic susceptibility
CSMT = Controlled Source Magnetotellurics
CSEM = Controlled Source ElectroMagnetics
Sonar Bathymetry
Gravimetry
Electrical/Electro-magnetic
Seismic Acoustic imaging
Well-based
Remote sensing
Others
Onshore only
Onshore & Offshore
Offshore only
Primary use Secondary use
New addition or change to table
Modified from Chadwick et al, 2007
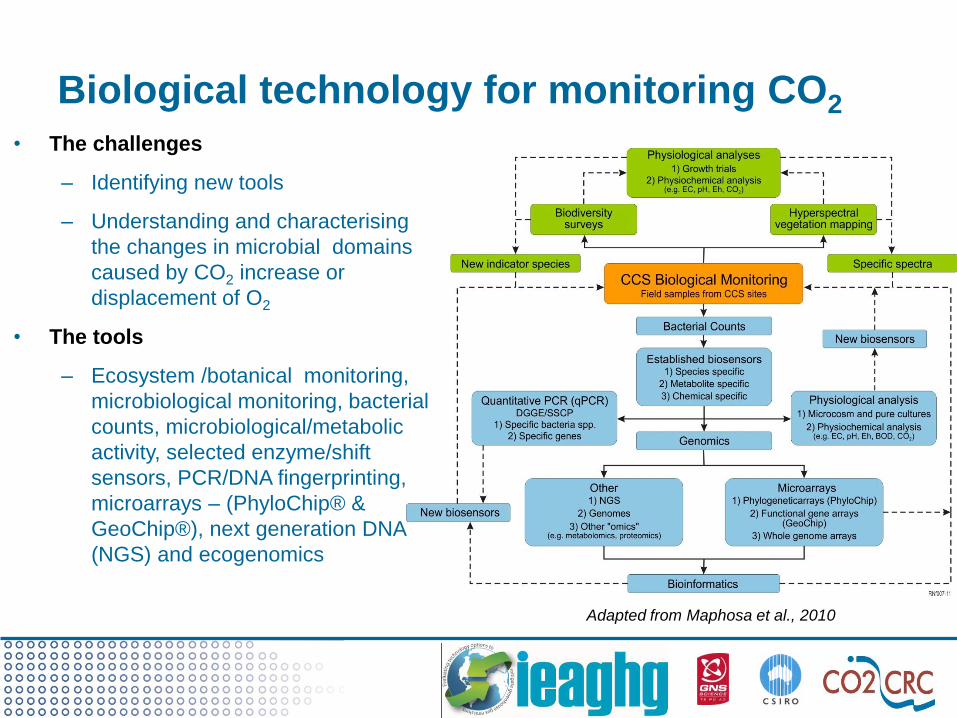
Biological technology for monitoring CO2
Adapted from Maphosa et al., 2010
• The challenges
– Identifying new tools
– Understanding and characterising
the changes in microbial domains
caused by CO2 increase or
displacement of O2
• The tools
– Ecosystem /botanical monitoring,
microbiological monitoring, bacterial
counts, microbiological/metabolic
activity, selected enzyme/shift
sensors, PCR/DNA fingerprinting,
microarrays – (PhyloChip® &
GeoChip®), next generation DNA
(NGS) and ecogenomics
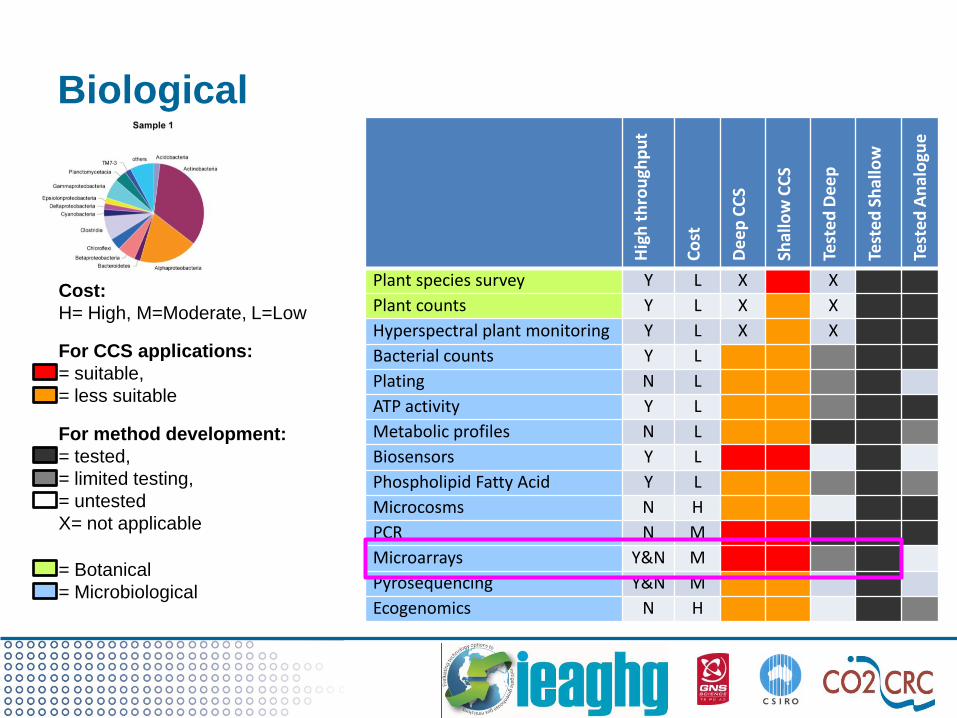
Biological
Hig
hth
rou
ghp
ut
Co
st
De
ep
CC
S
Shal
low
CC
S
Test
ed
De
ep
Test
ed
Shal
low
Test
ed
An
alo
gue
Plant species survey Y L X X
Plant counts Y L X X
Hyperspectral plant monitoring Y L X X
Bacterial counts Y L
Plating N L
ATP activity Y L
Metabolic profiles N L
Biosensors Y L
Phospholipid Fatty Acid Y L
Microcosms N H
PCR N M
Microarrays Y&N M
Pyrosequencing Y&N M
Ecogenomics N H
= Botanical
= Microbiological
Cost:
H= High, M=Moderate, L=Low
For CCS applications:
= suitable,
= less suitable
For method development:
= tested,
= limited testing,
= untested
X= not applicable
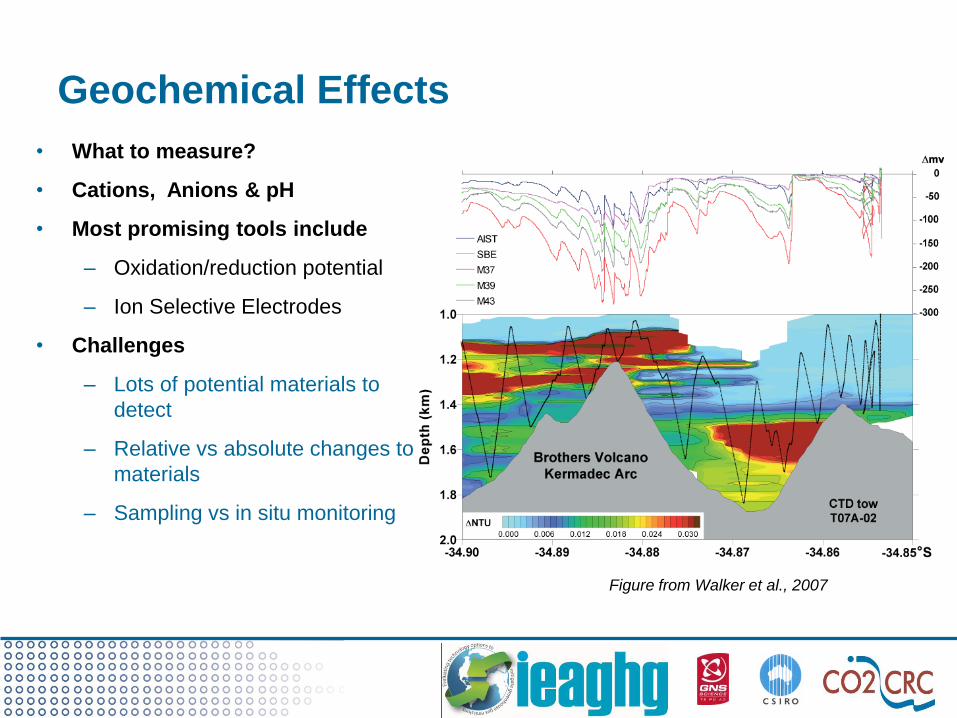
Geochemical Effects
• What to measure?
• Cations, Anions & pH
• Most promising tools include
– Oxidation/reduction potential
– Ion Selective Electrodes
• Challenges
– Lots of potential materials to
detect
– Relative vs absolute changes to
materials
– Sampling vs in situ monitoring
Figure from Walker et al., 2007

Hydrocarbons and Organics
• EOR/EGR relevance - CO2 as a
solvent
• Increased awareness of BTEX
mobilisation
• Capture gas contaminants
• Many tools out there
– Piezoelectric, chemiresistors,
IR, small scale sensors
• Tools are often non-selective
– More selective tools are less
robust (e.g. membranes)
– Drift and longevity are
untested
Hydrocarbon TransducerAnalytica
l range
Detection
limitComments
Various
aliphatic and
aromatic
compounds
Resistance NA
~100
ppmv
(gas)
Relatively cheap and
has a temperature
control feature.
Portable. Very little
information available of
selectivity
Various
aliphatic and
aromatic
compounds
Surface
acoustic waveNA ppb
Portable and compact.
Low power. Excellent
selectivity
Methane Near infrared10 ppm -
100 vol%~ppm
Portable. Fast response
time. Highly selective
Methane Near infrared NA ~100 ppm
Portable, rugged and
fast response time.
Highly selective
Various
aliphatic
hydrocarbons
Potentiometric
and
Resistance
NA ~ppm
Portable, rugged and
rapid response. Poor
selectivity.
Benzene,
toluene,
xylene
Resistance 1-10 ppm0.5 ppm
(toluene)
Portable and compact.
Low power. Affected by
humidity.

Hydrocarbons and Organics
Hig
h
thro
ugh
pu
t
Co
st
Suit
abili
ty a
t h
igh
te
mp
era
-tu
re&
pre
ssu
re
Do
wn
-ho
le
mo
nit
ori
ng
Gro
un
dw
ater
m
on
ito
rin
g
Shal
low
CC
S
De
ep
CC
S
Chemiresistor Y L Y
Potentiometer Y L Y
Quartz crystalmicrobalance
Y M
Surface acousticwave
Y M
Mid-infrared H
Near-infrared H
Fluorimeter Y H Y
Gas chromatography Y H X X X X X
Mass spectrometry Y H X X X X X
Cost:
H= High
M=Moderate
L=Low
Y = Yes
N = No
= has been tested
= has potential but requires
further testing
= untested
X= not applicable

CO2 sensing tools
• Update of report from 2007
• Increased interest in
– Optical (IR)
– Electrochemical (potentiometric)
tools
• Tools aim at
– Atmospheric research
– Vehicular/industrial/agricultural
processes
– Detection of dissolved CO2 in
water increasing
• Challenges of size, cost,
robustness, power and autonomy
still remain
From Barr et al., 2011
ZERT

Key Points
• Bad news
– This statement from Ross et al (2007) still applies “few suitable
sensing technologies … are available. … representing a significant
gap in technology … for large scale implementation of carbon capture
and storage”
– Data management and handling will be more problematic
• Good news
– “increasing number of tools … integrated multi-analyte sensors for real
time qualitative & quantitative analysis, along with data acquisition and
transfer. Some … are already relatively inexpensive, rugged, easily
miniaturised, low in power requirement and sensitive”.
– “Solid state devices … new generation pH probes … have the sort of
specifications required for deployment in deeper and more aggressive
environments”.

IEAGHG Monitoring Selection Tool
• Cross referencing with field trials essential
• Obtaining relevant data on tools deployed, depths, temperatures, duration
(etc.) all valuable information for assessing tools in the future
• Opportunities to deploy tools should be taken in all environments
Conclusions
• A range of maturity in different sensors and tools
– Geophysics is fairly mature – incremental changes to technology
– Biosensing – tested in other environments, only now testing in CCS
• The more rugged tools come from the petroleum industry
• Other tools are entering a ruggedization/miniaturisation phase for
deployment
• There is scope for developing multi-analyte tools in the future
• Field trials of tools and a database of the conditions and performance
is essential
• Data handling will be come a bigger issue due to volume of
information
• What we do with the assurance data is most important
Established & supported under the Australian Government’s Cooperative Research Centres Program
CO2CRC Participants
Supporting Partners: The Global CCS Institute | The University of Queensland | Process Group | Lawrence Berkeley National Laboratory
Government of South Australia | CANSYD Australia | Charles Darwin University | Simon Fraser University