feasibility study and alternatives analysis...
TRANSCRIPT

FEASIBILITY STUDY AND ALTERNATIVES ANALYSIS FOR
INTERNAL PHOSPHORUS REDUCTION IN CHINA LAKE
Prepared for: The Kennebec Water District
Prepared by:
August 2012
FEASIBILITY STUDY AND ALTERNATIVES ANALYSIS FOR INTERNAL PHOSPHORUS REDUCTION IN CHINA LAKE
Prepared for: The Kennebec Water District
Prepared by:
August 2012

i
FEASIBILITY STUDY AND ALTERNATIVES ANALYSIS FOR INTERNAL PHOSPHORUS REDUCTION IN CHINA LAKE
TABLE OF CONTENTS
EXECUTIVE SUMMARY .......................................................................................................ES-1
1.0 BACKGROUND INFORMATION ....................................................................................1
2.0 CHARACTERISTICS OF CHINA LAKE ..........................................................................3 2.1 CHINA LAKE OUTLET DAM AND WATER LEVELS .....................................................4 2.2 HYDROLOGY OF CHINA LAKE ...................................................................................6 2.3 WATER QUALITY OF CHINA LAKE .............................................................................7 2.4 CURRENT CHINA LAKE MANAGEMENT STRATEGIES ................................................9
3.0 ALTERNATIVES ANALYSIS .........................................................................................11 3.1 HYPOLIMNETIC WITHDRAWAL ...............................................................................11 3.2 CHEMICAL TREATMENT ..........................................................................................14 3.3 LAKE DRAWDOWN ..................................................................................................19
4.0 RECOMMENDATION .....................................................................................................24
5.0 REFERENCES ..................................................................................................................26
LIST OF TABLES
TABLE 1 MORPHOLOGY OF CHINA LAKE ................................................................................3 TABLE 2 ESTIMATED MEAN AND MEDIAN MONTHLY FLOWS FOR CHINA LAKE .....................6 TABLE 3 AVERAGE DESTRATIFICATION DATES (± ONE STANDARD DEVIATION) OF THE
BASINS IN CHINA LAKE ............................................................................................8 TABLE 4 EXTENT OF ANOXIA IN THE HYPOLIMNION OF CHINA LAKE .....................................8 TABLE 5 PHOSPHORUS LOADING MODEL RESULTS (KG YR-1) FOR CHINA LAKE ...................10 TABLE 6 PRELIMINARY DOSAGE REQUIREMENTS FOR CHINA LAKE .....................................16 TABLE 7 THE VOLUME AND CHANGE IN VOLUME OF CHINA LAKE FOR VARIOUS LAKE
LEVELS ...................................................................................................................20 TABLE 8 ESTIMATED EXPORT OF P FOR DIFFERENT LAKE LEVEL DRAWDOWN TARGETS ........23

TABLE OF CONTENTS (CONT’D)
ii
LIST OF FIGURES
FIGURE 1 STAGE-STORAGE CURVE FOR CHINA LAKE ..............................................................4 FIGURE 2 HISTORICAL LAKE LEVEL OBSERVATIONS MEASURED BY THE KENNEBEC WATER
DISTRICT ...................................................................................................................5 FIGURE 3 DRAWING OF THE KENNEBEC WATER DISTRICT INTAKES ......................................13 FIGURE 4 SCHEMATIC OF AN ALUM TREATMENT BARGE. COURTESY OF COOKE ET AL 2005 ..17 FIGURE 5 LENGTH OF TIME TO LOWER THE LAKE LEVEL FOR VARIOUS FLOWS ASSUMING NO
INFLOW TO CHINA LAKE .........................................................................................22
LIST OF APPENDICES
APPENDIX A PHOTOGRAPHS APPENDIX B HYDRAULICS APPENDIX C MORPHOLOGY AND HYDROLOGY APPENDIX D WATER QUALITY APPENDIX E OPINION OF PROBABLE COST

ES-1
EXECUTIVE SUMMARY
The Kennebec Water District (KWD) received a Source Water Protection Grant administered by
the Maine Drinking Water Program to determine if there is a feasible method to reduce internal
phosphorus (P) recycling in China Lake. Excess P in China Lake has been identified as the cause
of water quality degradation over the past few decades. The poor water quality in China Lake
causes increased production costs at the KWD treatment plant and decreases property values in
the watershed. The proposed methods for internal phosphorus reduction in this study considered
economic, regulatory, and environmental constraints. The three lake restoration techniques
investigated are hypolimnetic withdrawal using an existing KWD intake, chemical treatment
using alum, and optimizing the current lake level order to increase P export from China Lake.
The results of this study clearly show the benefit of both a new drawdown plan and alum
treatment. Hypolimnetic withdrawal, on the other hand, is not likely to significantly increase the
export of P from China Lake compared to surficial withdrawals. The reasons for hypolimnetic
withdrawal ineffectiveness include:
• Lack of hydraulic capacity without significant mechanical pumping. • The West Basin of China Lake does not have P concentrations in the hypolimnion that
are consistently high enough to warrant the capital costs of retrofitting the existing KWD intake.
• Post withdrawal treatment of the discharge is required due to noxious substances that accumulate in the hypolimnion.
Alum treatment would produce the largest reduction in internal P of any of the investigated
restoration techniques. Based on a preliminary dosing derived in this study, an internal P
reduction of 900 to 1850 kg yr-1 for the whole lake is expected. This would accomplish the
prescribed load reduction for China Lake in one dose. However, the $2.9 million opinion of
probable cost is high, even though the $710 to $1,460 per pound of P reduced is relatively
economical. Alternatively, just the East and North Basins can be treated at a substantial cost
savings and likely with similar effectiveness. The estimated load reduction is 545 to 1115 kg yr-1
which equates to a price of $450 to $920 per pound of P removed with the overall opinion of
probable cost at $1.1 million. The longevity of the treatment is expected to last at least 13 years
using previous case studies of other restorations and published sedimentation rates for China
ES-2
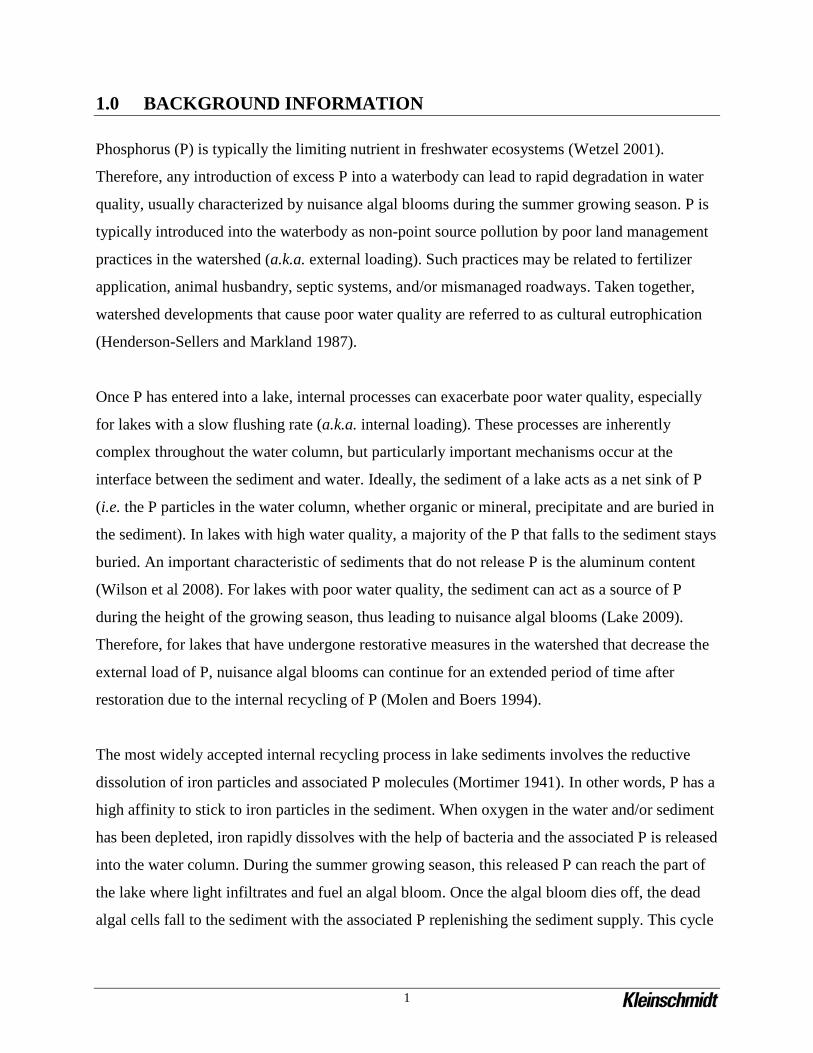
Lake. Therefore, alum treatment would likely be a highly effective way to reduce internal P
loading in China Lake.
A less effective restoration technique, but at no cost, is altering the drawdown of China Lake.
This study shows that by starting the drawdown in October instead of mid-November and
increasing the magnitude of the drawdown, export of P in China Lake can increase hundreds of
kilograms per year. According to the hydrology determined in this study, the average year has
enough flow during the winter and spring to refill China Lake with a surplus of thousands of acre
feet even if the lake is drained to the sill of the dam sluice gates. However, there is always a
slight risk of experiencing a drought year in which the lake would not totally refill if drained too
low. Therefore, the lake level should be monitored and flexible to maximize the export of P from
China Lake.
This study recommends changing the lake level order to start the drawdown the first of October
to an over winter lake level target of 191.6 feet NGVD which is 1.5 feet lower than the existing
lake level. This small change in lake level order will increase the export of P approximately 200
kg yr-1. This equates to around a fifth of the loading reduction goal for China Lake. Though this
is a significant amount of P reduction, starting the process of an alum treatment is also
recommended. This involves some minimal preliminary studies and substantial fundraising.
China Lake is a prime candidate for a successful alum treatment and if the increase in lake
drawdown does not result in substantial improvements in water quality, an alum addition will be
the most effective lake restoration strategy.
1
1.0 BACKGROUND INFORMATION
Phosphorus (P) is typically the limiting nutrient in freshwater ecosystems (Wetzel 2001).
Therefore, any introduction of excess P into a waterbody can lead to rapid degradation in water
quality, usually characterized by nuisance algal blooms during the summer growing season. P is
typically introduced into the waterbody as non-point source pollution by poor land management
practices in the watershed (a.k.a. external loading). Such practices may be related to fertilizer
application, animal husbandry, septic systems, and/or mismanaged roadways. Taken together,
watershed developments that cause poor water quality are referred to as cultural eutrophication
(Henderson-Sellers and Markland 1987).
Once P has entered into a lake, internal processes can exacerbate poor water quality, especially
for lakes with a slow flushing rate (a.k.a. internal loading). These processes are inherently
complex throughout the water column, but particularly important mechanisms occur at the
interface between the sediment and water. Ideally, the sediment of a lake acts as a net sink of P
(i.e. the P particles in the water column, whether organic or mineral, precipitate and are buried in
the sediment). In lakes with high water quality, a majority of the P that falls to the sediment stays
buried. An important characteristic of sediments that do not release P is the aluminum content
(Wilson et al 2008). For lakes with poor water quality, the sediment can act as a source of P
during the height of the growing season, thus leading to nuisance algal blooms (Lake 2009).
Therefore, for lakes that have undergone restorative measures in the watershed that decrease the
external load of P, nuisance algal blooms can continue for an extended period of time after
restoration due to the internal recycling of P (Molen and Boers 1994).
The most widely accepted internal recycling process in lake sediments involves the reductive
dissolution of iron particles and associated P molecules (Mortimer 1941). In other words, P has a
high affinity to stick to iron particles in the sediment. When oxygen in the water and/or sediment
has been depleted, iron rapidly dissolves with the help of bacteria and the associated P is released
into the water column. During the summer growing season, this released P can reach the part of
the lake where light infiltrates and fuel an algal bloom. Once the algal bloom dies off, the dead
algal cells fall to the sediment with the associated P replenishing the sediment supply. This cycle
2
can continue for many years after external nutrient load reductions have been accomplished, thus
maintaining poor water quality.
An important aspect of this internal P recycling process is the development of a stratified lake.
During the summer months in temperate climates, lakes form three layers in the water column:
an epilimnion, a metalimnion, and a hypolimnion. The epilimnion is the upper layer of the lake
that varies in temperature with the atmosphere, usually remains saturated with oxygen, has light
infiltrate the water column, and readily mixes during storm events. The metalimnion is the
transition zone between the upper and lower strata and typically is a zone of high biological
activity with both decomposition and production occurring. The hypolimnion is the bottom water
where temperature variation is minor, oxygen may become depleted, light does not infiltrate, and
the water remains stagnant. These zones typically remain separated from each other by thermal
density gradients during the summer. Because the hypolimnion remains separated from the other
parts of the lake, oxygen is depleted by decomposition and large amounts of P can accumulate.
The morphology of the lake is also important for this internal recycling process. For deep lakes,
the thermal stratification may be strong enough that the hypolimnetic and epilimnetic water do
not mix during the growing season. Therefore, even if the hypolimnion accumulates P during the
growing season, the P does not reach the epilimnion to fuel an algal bloom. Conversely, a
shallow lake may not develop strong stratification, but ephemeral stratification may accumulate
enough P released from the sediment such that when the lake experiences a mixing event, the
released P causes an algal bloom. Also, dilution is another factor, lakes with larger sediment to
water volume ratios are more likely to be influenced by sedimentary P dynamics.

3
2.0 CHARACTERISTICS OF CHINA LAKE
China Lake is one of the designated Great Ponds of Maine. The pond consists of three basins,
east, north and west. The East and North basins are heavily developed and lie in the towns of
South China and China, respectively. The west basin is, for the most part, undeveloped and lies
in the town of Vassalboro. China Lake is a large waterbody with a relatively small watershed
resulting in a slow flushing rate (Table 1 and Figure 1). The west basin has been the source of
water for the KWD since 1905 supplying Waterville and the surrounding area with drinking
water. In the 1980’s, the water quality in China Lake rapidly changed from good to poor with the
onset of annual nuisance algal blooms. The lake is currently listed as a 303(d) waterbody and a
total maximum daily load (TMDL) study was completed (MEDEP 2001). Because of this
dubious distinction, China Lake has been well studied and monitored over the past 30 years.
TABLE 1 MORPHOLOGY OF CHINA LAKE
PROPERTY MEDEP (2001) COLBY (2006) THIS STUDY Surface Area (mi2) 6.2 6.2 6.1 Watershed Area (mi2) 26.1 26.7 26.7 Volume (acre-ft) 98,922 97,286 102,564 Mean Depth (ft) 33 33.1 33.2 Maximum Depth (ft) 85 92.4 91.3 Flushing Rate (yr-1) 0.65-0.72 0.35 0.3 The discrepancies in Table 1 are likely due to the different bathymetric and GIS maps used to
derive computational inputs. The bathymetry used in this study and the Colby study was
measured by Professor Dan Buckley and his research associates from the University of Maine at
Farmington. The bathymetry used the TMDL study was measured by the Maine Department of
Inland Fisheries and Wildlife. Figure 1 shows the stage-storage curve for China Lake determined
using GIS tools during this study.

4
FIGURE 1 STAGE-STORAGE CURVE FOR CHINA LAKE 2.1 CHINA LAKE OUTLET DAM AND WATER LEVELS
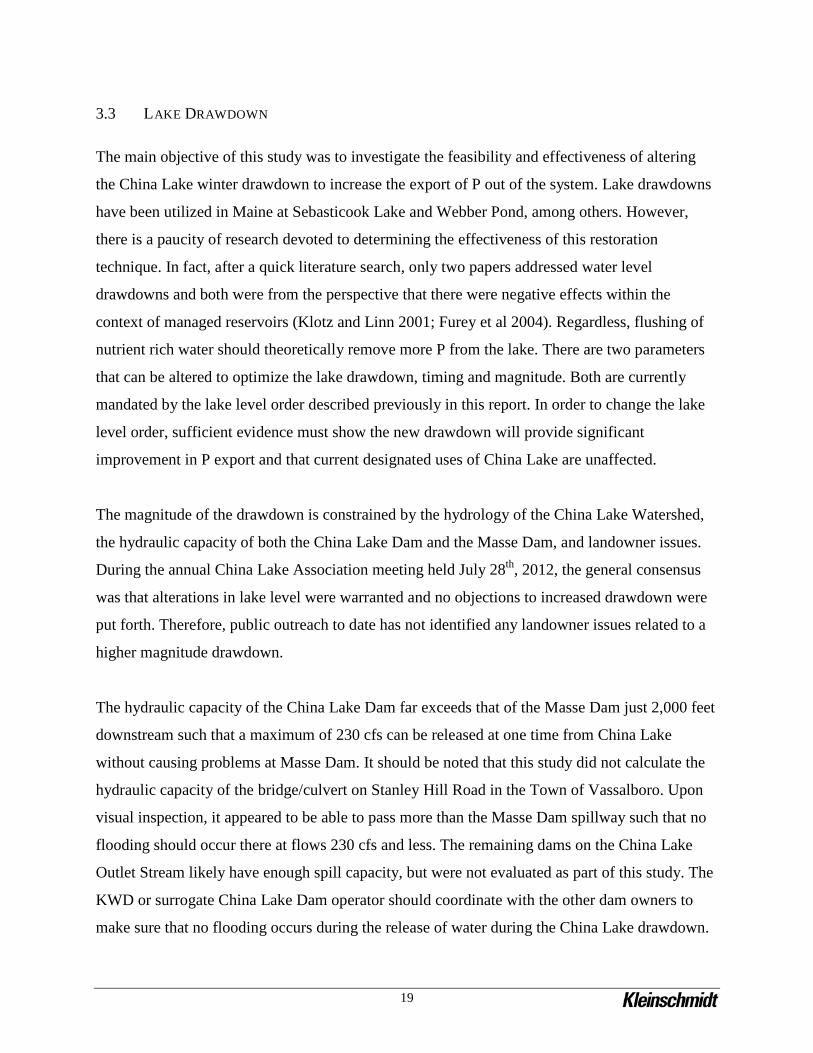
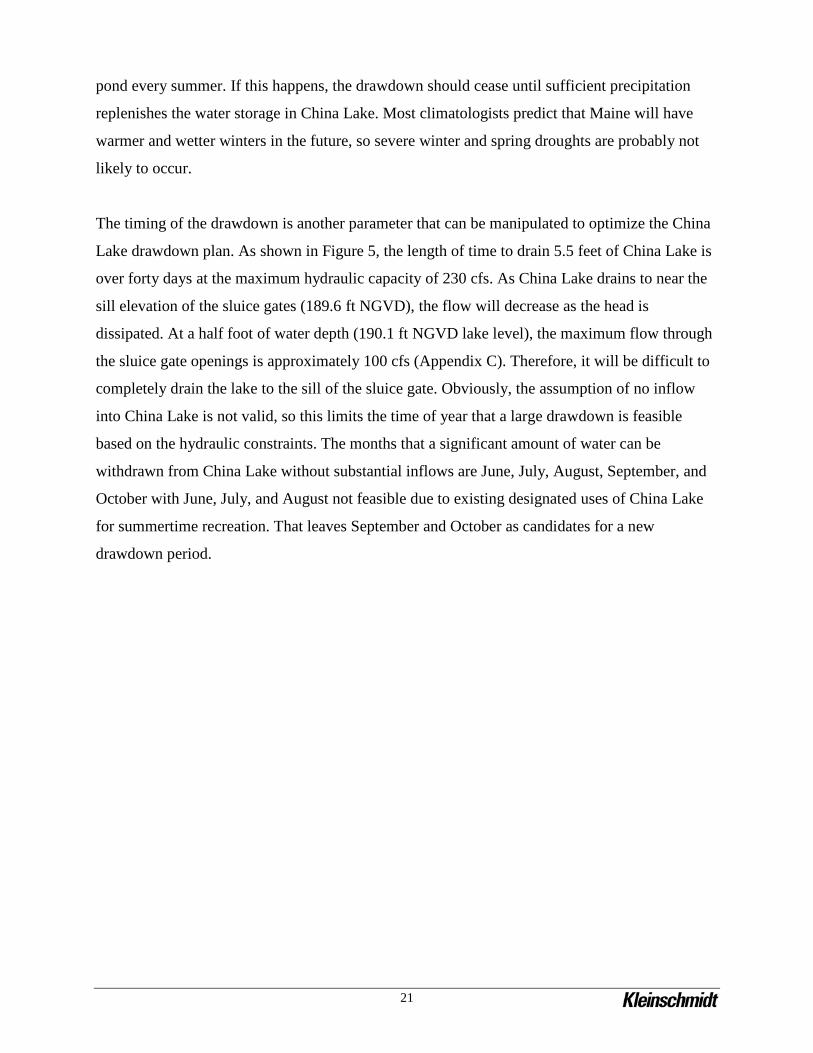
The water level of China Lake is controlled at the outlet dam on the west side of the West Basin
(Photograph 1 - Appendix A). The dam is a concrete gravity structure that has a 12.7 foot
spillway (Photograph 2 – Appendix A) and two sluice gates (Photograph 3 – Appendix A). The
total discharge capacity of the dam is approximately 670 cfs (Appendix B). The spillway
elevation is 194.6 feet (NGVD) which is the normal pond level. The China Lake outlet stream
passes five more dams before it discharges into the Sebasticook River near the confluence with
the Kennebec River. The next dam is the Masse Dam (Photograph 4 – Appendix A) which has
an estimated spillway capacity of 230 cfs (Photograph 5 – Appendix A), thus limiting the spill at
the China Lake outlet to the same flow unless necessary for public safety reasons in the Town of
Vassalboro.
0
20,000
40,000
60,000
80,000
100,000
120,000
100 110 120 130 140 150 160 170 180 190 200
Lak
e St
orag
e (a
cre-
ft)
Lake Level (NGVD)
5
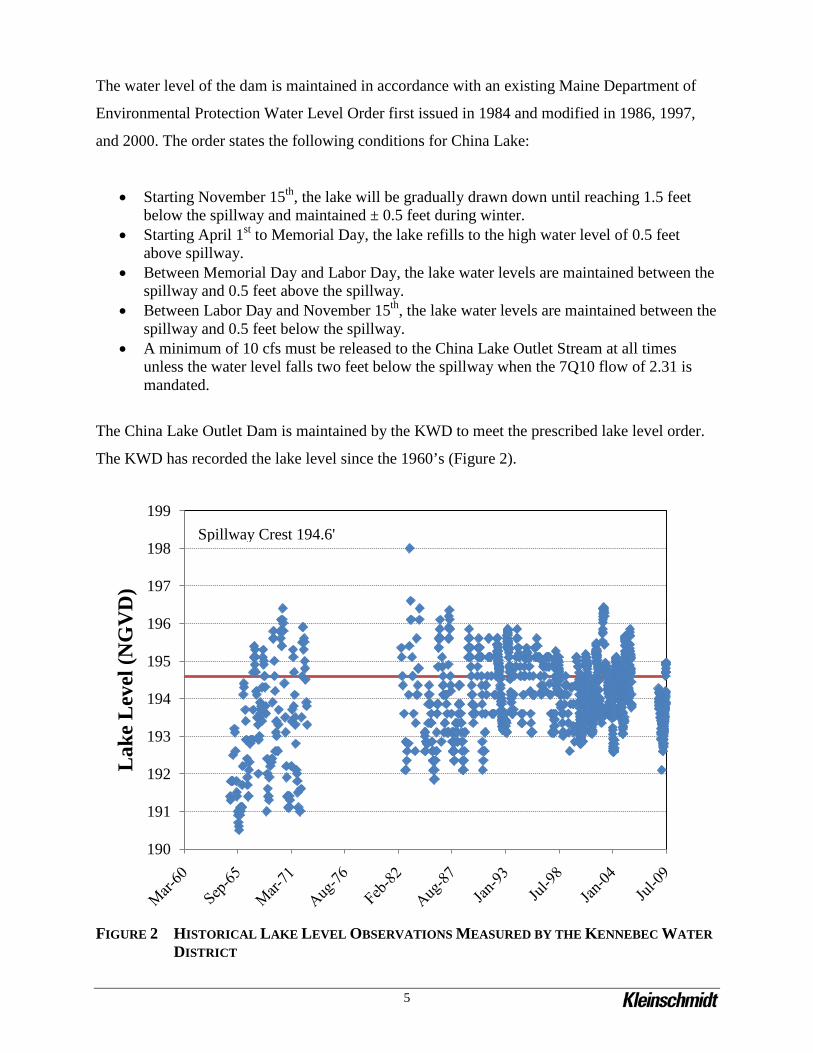
The water level of the dam is maintained in accordance with an existing Maine Department of
Environmental Protection Water Level Order first issued in 1984 and modified in 1986, 1997,
and 2000. The order states the following conditions for China Lake:
• Starting November 15th, the lake will be gradually drawn down until reaching 1.5 feet below the spillway and maintained ± 0.5 feet during winter.
• Starting April 1st to Memorial Day, the lake refills to the high water level of 0.5 feet above spillway.
• Between Memorial Day and Labor Day, the lake water levels are maintained between the spillway and 0.5 feet above the spillway.
• Between Labor Day and November 15th, the lake water levels are maintained between the spillway and 0.5 feet below the spillway.
• A minimum of 10 cfs must be released to the China Lake Outlet Stream at all times unless the water level falls two feet below the spillway when the 7Q10 flow of 2.31 is mandated.
The China Lake Outlet Dam is maintained by the KWD to meet the prescribed lake level order.
The KWD has recorded the lake level since the 1960’s (Figure 2).
FIGURE 2 HISTORICAL LAKE LEVEL OBSERVATIONS MEASURED BY THE KENNEBEC WATER
DISTRICT
190
191
192
193
194
195
196
197
198
199
Lak
e L
evel
(NG
VD
)
Spillway Crest 194.6'

6
2.2 HYDROLOGY OF CHINA LAKE
In this study, the hydrology of China Lake was determined using two different methods,
regression equations (Dudley 2004) and a drainage-discharge relationship using historical stream
gage data. The stream gage data used in this analysis was from Togus Stream (USGS
#01049550) in Togus, Maine. The period of record for this gage is October, 1981 to October,
1995. Review of the average annual discharge for each year of record showed a reasonable
distribution of dry and wet years such that the relatively short record is adequate for developing
flow duration curves for China Lake (Appendix C). The Togus gage was chosen based on
watershed size, watershed similarity (both have large storage ponds), and proximity to each other
(approximately 17 miles apart). The table below shows the monthly mean and median flow
values for China Lake using both methods with the gage data producing slightly drier summers
and wetter winters. The gage data from Togus Stream is likely more representative of the
hydrology of China Lake which stores water well during the winter months due to ice cover and
loses more water due to evaporation during the summer months. For this reason, the flows
determined by the drainage-discharge relationship were used for water budget calculations in this
study. Using the regression equation method, the 7Q10 flow for China Lake was 1.55 cfs which
is two thirds the mandated 7Q10 flow stated in the lake level order. The 7Q10 refers to the low
seven day stream flow for a reoccurrence interval of 10 years.
TABLE 2 ESTIMATED MEAN AND MEDIAN MONTHLY FLOWS FOR CHINA LAKE
MONTH REGRESSION EQUATION METHOD DRAINAGE-DISCHARGE METHOD MEAN (CFS) MEDIAN (CFS) MEAN (CFS) MEDIAN (CFS)
January 48.7 31.8 53.0 37.8 February 46.6 30.9 46.8 37.8 March 94.4 51.4 107.1 77.0 April 158.8 116.5 161.7 122.2 May 94.9 72.3 67.7 52.7 June 48.7 30.6 40.6 21.6 July 21.5 11.9 11.8 8.9 August 15.4 7.9 11.4 8.0 September 17.3 8.0 9.7 6.3 October 34.2 13.5 21.9 6.5 November 66.7 39.6 60.6 47.3 December 69.9 45.7 77.5 58.1

7
Based on the hydrology of China Lake, a water budget was determined for the watershed. Water
demands on China Lake are minor compared to the available inflow. The KWD withdraws
approximately 5.4 cfs from the lake to serve its customers and has the capacity to withdraw 18.6
cfs, if needed. The KWD is also mandated to maintain 10 cfs in the China Lake Outlet Stream to
preserve the functions of that ecosystem. Therefore, the water demands on China Lake total 15.4
to 28.6 cfs. Under these two scenarios, China Lake has a surplus of approximately 30,000 acre-ft
yr-1 under normal withdrawal conditions and 20,000 acre-ft yr-1 under maximum withdrawal
conditions (Appendix C).
2.3 WATER QUALITY OF CHINA LAKE
During the majority of the twentieth century, China Lake was known to have high water quality
and contained numerous cold water species of sport fish such as salmon and trout. Today, China
Lake experiences annual algal blooms and the hypolimnion of the lake is deprived of oxygen
(i.e. anoxic) for multiple weeks of the year, eliminating the availability of cold water habitat in
the lake during the summer months. Water clarity in China Lake, as measured by Secchi disc,
rarely exceeds 10 feet from August to October (Figure D1). On average, the water chemistry of
China Lake has color, conductivity, and alkalinity values of 88 SPU, 81 µS, and 17.3 mg L-1
CaCO3, respectively.
Appendix D contains plots of the variance in historical values of oxygen and temperature versus
depth for the three basins in China Lake during the growing season of May to October. The data
was organized by the Maine DEP and collected by numerous organizations starting in 1979.
Variance is a statistic describing how far a set of measurements is spread out. For example, the
temperature in the hypolimnion shows less variance than the epilimnion because the cold dense
water does not mix with the warm water above it. The hypolimnion of the West Basin remains
about 10°C (50°F) throughout the growing season and exhibits a hypolimnetic depth of greater
than 30 feet. In the East Basin and the North Basin the bottom water exhibit more historical
variation in temperature and the hypolimnetic depth is less defined, though greater than 30 feet is
the approximate start of the hypolimnion. The difference in basins is due to the distinct
morphologies (i.e. different volumes of water to heat and different propensities for wind induced
mixing). When the epilimnetic temperature is equal to the hypolimnetic temperature, the water
column mixes. This occurs during the fall (destratification) and spring of each year. Despite the
8
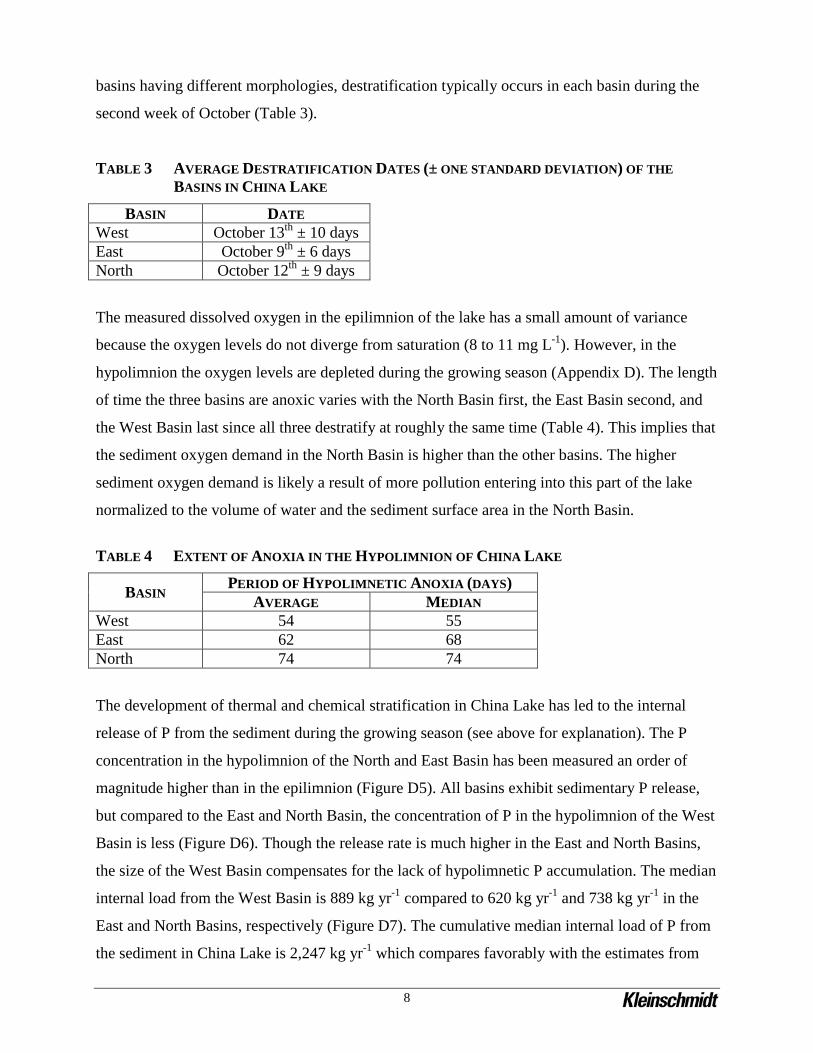
basins having different morphologies, destratification typically occurs in each basin during the
second week of October (Table 3).
TABLE 3 AVERAGE DESTRATIFICATION DATES (± ONE STANDARD DEVIATION) OF THE BASINS IN CHINA LAKE
BASIN DATE West October 13th ± 10 days East October 9th ± 6 days North October 12th ± 9 days
The measured dissolved oxygen in the epilimnion of the lake has a small amount of variance
because the oxygen levels do not diverge from saturation (8 to 11 mg L-1). However, in the
hypolimnion the oxygen levels are depleted during the growing season (Appendix D). The length
of time the three basins are anoxic varies with the North Basin first, the East Basin second, and
the West Basin last since all three destratify at roughly the same time (Table 4). This implies that
the sediment oxygen demand in the North Basin is higher than the other basins. The higher
sediment oxygen demand is likely a result of more pollution entering into this part of the lake
normalized to the volume of water and the sediment surface area in the North Basin.
TABLE 4 EXTENT OF ANOXIA IN THE HYPOLIMNION OF CHINA LAKE
BASIN PERIOD OF HYPOLIMNETIC ANOXIA (DAYS) AVERAGE MEDIAN
West 54 55 East 62 68 North 74 74
The development of thermal and chemical stratification in China Lake has led to the internal
release of P from the sediment during the growing season (see above for explanation). The P
concentration in the hypolimnion of the North and East Basin has been measured an order of
magnitude higher than in the epilimnion (Figure D5). All basins exhibit sedimentary P release,
but compared to the East and North Basin, the concentration of P in the hypolimnion of the West
Basin is less (Figure D6). Though the release rate is much higher in the East and North Basins,
the size of the West Basin compensates for the lack of hypolimnetic P accumulation. The median
internal load from the West Basin is 889 kg yr-1 compared to 620 kg yr-1 and 738 kg yr-1 in the
East and North Basins, respectively (Figure D7). The cumulative median internal load of P from
the sediment in China Lake is 2,247 kg yr-1 which compares favorably with the estimates from

9
other studies (MEDEP 2001, Colby 2006). It should be noted that these estimates were
calculated using KWD data for the East and North Basins and DEP data for the West Basin.
Because the KWD data does not account for the bottom four to seven meters of the hypolimnion
in the West Basin, the median internal P load determined from the KWD data of 483 kg yr-1 was
assumed to be an underestimation.
In 1999, a Master’s student at the University of Maine conducted a comprehensive study of the
West Basin (Pearce 2000). As part of the study, the chemistry of the hypolimnion was better
characterized than the traditional monitoring completed by the KWD and Maine DEP. Other
measured constituents that were released into the hypolimnion were hydrogen sulfide (~200 µg
L-1), iron (3.3 mg L-1), manganese (2.75 mg L-1), and arsenic (22.5 µg L-1). It is safe assume that
these constituents are also released from the sediments in the East and North Basin as well, likely
resulting in higher hypolimnetic concentrations than measured in the West Basin. Finally, the
chemical dynamics in the hypolimnion also can decrease the pH (i.e. increase the lake acidity) by
five times on average during the growing season. The average pH of the lake is 7.2, but the
average pH of the hypolimnion is 6.7.
2.4 CURRENT CHINA LAKE MANAGEMENT STRATEGIES
Both the Colby study (2006) and the TMDL study (MEDEP 2001), conducted a phosphorus
budget for the China Lake watershed. The studies utilized GIS tools to determine the land use
patterns in the watershed and applied phosphorus (P) export coefficients to quantify the external
load of P into China Lake in kg yr-1. Though the methods were similar, the studies utilized export
coefficients derived from different loading models. Regardless, the results from each study were
in good agreement (Table 5). The target restoration goal established in the TMDL study is 2830
kg yr-1 based on a P retention model and an in-lake P concentration of 15 ppb (MEDEP 2001).
As shown in Table 2, the external loads are less than the loading goal and the poor water quality
is likely a result of internal processes. However, it should be noted that there is inherent
uncertainty in these loading coefficients, so the model results should be viewed with trepidation
(Walker 2003).

10
TABLE 5 PHOSPHORUS LOADING MODEL RESULTS (KG YR-1) FOR CHINA LAKE
LOADING MEDEP (2001) COLBY (2006) LOW MEDIUM HIGH LOW MEDIUM HIGH
External n/a 2059 n/a 1210 2597 5716 Internal 1200 1876 2550 1604 2246 2567 Total 3259 3935 4609 2814 4843 8283
Since the start of the nuisance algal blooms and the listing of China Lake as a 303(d) waterbody,
numerous improvements in the watershed have been implemented to reduce the external load of
P into the lake. These projects include camp road improvements, erosion prevention measures,
education programs, and stormwater retrofits or enhancements. On average, these projects cost
about $3,500 per pound of P removed from external loading model for the lake (David Landry
personal communication).
China Lake has undergone numerous surveys to help identify future worksites in the watershed
including a comprehensive shoreline erosion survey, multiple wetland studies, a camp road
survey, and a septic system inventory. Also, the China Lake Association in collaboration with
the Kennebec Soil and Water Conservation District, the Kennebec Water District, and the China
Region Lakes Alliance has worked tirelessly in an attempt to improve the water quality of China
Lake. Through all these efforts, improvements in China Lake water quality have been realized.
However, the annual algal blooms continue and 40 to 50 % of the total P load in China Lake has
not been addressed by external load reductions.

11
3.0 ALTERNATIVES ANALYSIS
The objective of this study is to determine the best in-lake restoration strategy to reduce internal
loading of P in China Lake. Over the past century, the eutrophication of lakes and ponds all over
the world has led to the implementation of various restoration strategies including hypolimnetic
aeration/oxygenation, hypolimnetic withdrawal, mechanical circulation, sediment dredging,
biomanipulation, and lake drawdown (Schauser et al 2003). Biomanipulation is common in
European countries where long term studies have shown that improvements in water quality
typically last less than a decade (Sondergaard et al., 2007). Hypolimnetic aeration/oxygenation
and mechanical circulation have prohibitive operational and maintenance costs and require
elaborate designs with a limited success rate (Singleton and Little, 2006). Sediment dredging is
highly effective at removing phosphorus from the system, but comes at a high cost, economically
and environmentally. For these reasons, this study focused on hypolimnetic withdrawal,
chemical treatment, and lake drawdown.
3.1 HYPOLIMNETIC WITHDRAWAL
The concept of hypolimnetic withdrawal is simple. Instead of the lake outflow being controlled
at the water surface by a dam or a natural stream, a piping system is used to control the lake
outflow from the hypolimnion. For lakes that thermally stratify during the growing season when
the hypolimnion accumulates large amounts of P released from the sediment, a greater amount of
P can be removed from the system by withdrawing the nutrient-rich bottom waters instead of
surface water. This in-lake restoration technique was first used in Poland (Dunalska 2007) and is
utilized across Europe and North America (Nurnberg 1987). A review of over 50 case studies
with long term monitoring data showed that hypolimnetic withdrawal is an effective restoration
technique to reduce summer P concentrations in stratified lakes that have an adequate flushing
rate (Nurnberg 2007). Hupfer and Scharf (2002) concluded that the water retention time must be
less than or equal to five years for hypolimnetic withdrawal to be effective (i.e. flushing rate of
0.2 yr-1).
The hydrology of the China Lake watershed produces a flushing rate estimated between 0.3 to
0.72 yr-1 which should be adequate for significant hypolimnetic withdrawal (this study, Colby
2006, MEDEP 2001). As shown in Figure D2, the west basin of China Lake thermally and
12
chemically stratifies at a depth of 20 to 40 feet each year during the summer months. This
stratification is strong enough to withstand a substantial amount of withdrawal from the
hypolimnion without destabilizing the water column and significantly altering the heat budget of
the system. Even though the hypolimnions of each of the basins are not hydrologically linked,
the total volume in the hypolimnion in the West Basin is approximately 15,000 acre-ft assuming
a hypolimnetic depth of 30 feet which should be adequate to withdraw substantial amounts of
water from China Lake.
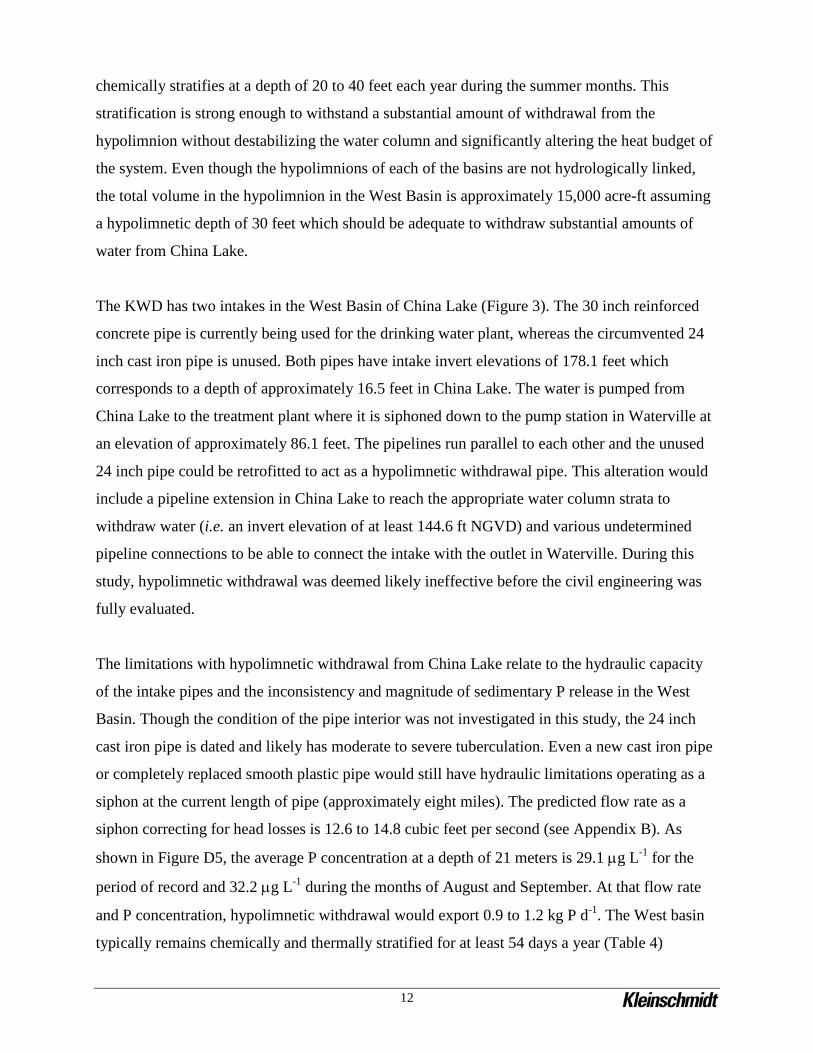
The KWD has two intakes in the West Basin of China Lake (Figure 3). The 30 inch reinforced
concrete pipe is currently being used for the drinking water plant, whereas the circumvented 24
inch cast iron pipe is unused. Both pipes have intake invert elevations of 178.1 feet which
corresponds to a depth of approximately 16.5 feet in China Lake. The water is pumped from
China Lake to the treatment plant where it is siphoned down to the pump station in Waterville at
an elevation of approximately 86.1 feet. The pipelines run parallel to each other and the unused
24 inch pipe could be retrofitted to act as a hypolimnetic withdrawal pipe. This alteration would
include a pipeline extension in China Lake to reach the appropriate water column strata to
withdraw water (i.e. an invert elevation of at least 144.6 ft NGVD) and various undetermined
pipeline connections to be able to connect the intake with the outlet in Waterville. During this
study, hypolimnetic withdrawal was deemed likely ineffective before the civil engineering was
fully evaluated.
The limitations with hypolimnetic withdrawal from China Lake relate to the hydraulic capacity
of the intake pipes and the inconsistency and magnitude of sedimentary P release in the West
Basin. Though the condition of the pipe interior was not investigated in this study, the 24 inch
cast iron pipe is dated and likely has moderate to severe tuberculation. Even a new cast iron pipe
or completely replaced smooth plastic pipe would still have hydraulic limitations operating as a
siphon at the current length of pipe (approximately eight miles). The predicted flow rate as a
siphon correcting for head losses is 12.6 to 14.8 cubic feet per second (see Appendix B). As
shown in Figure D5, the average P concentration at a depth of 21 meters is 29.1 µg L-1 for the
period of record and 32.2 µg L-1 during the months of August and September. At that flow rate
and P concentration, hypolimnetic withdrawal would export 0.9 to 1.2 kg P d-1. The West basin
typically remains chemically and thermally stratified for at least 54 days a year (Table 4)

13
equating to a total hypolimnetic withdrawal of 48.6 to 64.8 kg yr-1. During the same time period
and at the same flow rate, surface withdrawal would result in an export of 35.2 kg yr-1. This
differential, though a step in the right direction, is likely not significant enough to warrant the
initial capital costs of installing the necessary retrofits for the existing 24 inch unused intake.
FIGURE 3 DRAWING OF THE KENNEBEC WATER DISTRICT INTAKES The proposed hypolimnetic withdrawal system also has a few other issues. Considering the
existing 24 inch intake may require mechanical pumping to produce an effective flow rate, the
operation and maintenance costs of hypolimnetic withdrawal may add to the overall cost of the
project. Finally, the discharge from hypolimnetic withdrawal would likely involve obtaining a
National Pollutant Discharge Elimination System (NDPES) permit. Along with the P that gets
released by the sediment during the summer months, significant amounts of iron, sulfide, and
other contaminants of concern are also released. Therefore, the discharge would likely require
mitigation measures to avoid dumping poor quality water into a receiving water body. Though
this is likely not a major problem, it will add to the complexity of the project. Therefore, this

14
study concludes that there are too many outstanding issues relating to hypolimnetic withdrawal
using the KWD intake, to make it a preferred alternative.
3.2 CHEMICAL TREATMENT
One of the most common restoration techniques involves adding a chemical treatment to the lake
to immobilize the phosphorus (P) (Cooke et al 2005). This idea originated from drinking water
treatment methodology where iron (Fe) or aluminum (Al) salts are added as coagulants to clarify
the water. However, chemical treatments in lakes are more geared towards capping the sediment
and preventing the release of P during periods of hypolimnetic anoxia, than clarifying the water
column through precipitation. Because aluminum is not sensitive to changes in oxygen
concentration and Al has been shown to naturally immobilize sediment P (Lake et al 2007,
Wilson et al 2008), Al salts have been the preferred chemical treatment over the last few decades
(Egemose et al 2012). Due to its popularity of the restoration technique, various P
immobilization proprietary chemicals have been utilized including Phoslock and Z2G1 as well as
other naturally occurring substances like allophane (Egemose et al 2010, Gibbs et al 2011). Still
the most common Al salt used is aluminum sulfate [Al2(SO4)3*XH2O], though polyaluminum
chloride [AlxCl(3x-y)(OH)y] may also be used.
Aluminum sulfate can make the water acidic if not properly buffered by the lake. At acidic pH
(<5), aluminum becomes toxic to aquatic organisms. Therefore, during the initial chemical
treatments using alum, the aluminum dosage was determined based on the alkalinity of the lake
(Kennedy and Cooke 1982). Contemporary aluminum chemical treatments buffer the dosage
with sodium aluminate (or other bases or buffers) to avoid any pH issues during application.
Currently, two dosing methods based on P content are used to determine the aluminum necessary
to effectively reduce internal P loading. The first involves using the internal P release rate (mg
m-2 d-1) to determine the average mass of P released during the year and dosing at an Al:P molar
ratio of 5 to 10 (Cooke et al 2005). A second method entails determining the potential releasable
P in the sediment and applying a recommended dose based on Al:P molar ratios varying from 4:1
(Reitzel et al 2005) to 100:1 (Rydin and Welch 1999). Releasable P is defined as the fraction of
P in the sediment that is dissolved in the first two steps of a sequential extraction scheme
(Psenner et al 1988) relating to the ion-exchangeable and the reducible P species (Rydin and
Welch 1999) or the addition of a third step relating to organically-derived P (Reitzel et al 2005).

15
Alternatively, the aluminum dosage could reflect the conditions of lakes that naturally do not
release P from the sediment. A study in 2005 (Kopacek et al), determined that lakes with
characteristic sedimentary molar ratios of Al:Fe (3:1) and Al:P (25:1) did not exhibit sediment P
release. This was later substantiated with data from Maine Lakes including China Lake (Lake et
al 2007). In that study, sediment cores were collected in the West Basin of China Lake and the
top 2 cm was analyzed using sequential extraction methods (Psenner et al 1988) to determine the
P, Al, and Fe content. The results showed that the West Basin of China Lake had an average
Al:Fe ratio of 1.4 and an average Al:P ratio of 5. This clearly shows that the West Basin is too
aluminum deficient to adequately retain P in the sediment via that mechanism.
All evidence leads to the conclusion that China Lake is a prime candidate for chemical treatment
using aluminum-based salts. These include:
• Numerous loading determinations have shown that approximately 50% of the annual load of P in China Lake is from internal processes (this study, MEDEP 2001, Colby 2006);
• The flushing rate of China Lake is slow such that withdrawal methods have limitations; • China Lake is aluminum deficient in the sediment; • Strong thermal stratification favors successful chemical treatment, and • The deep basins are not prone to wind induced re-suspension of the aluminum floc.
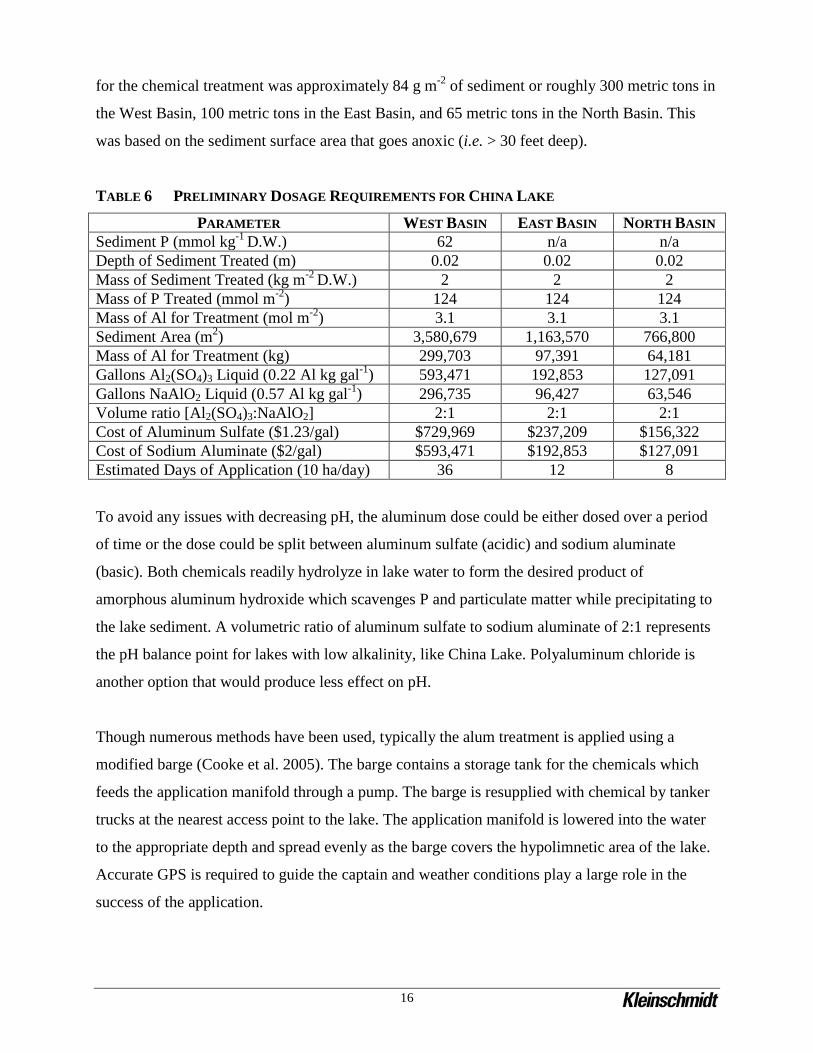
A preliminary estimate of the dosing requirements for China Lake is shown in Table 6. The
dosing was split into the three basins. The only sediment chemical data available to calculate the
dosage was from Lake et al (2007). In that study, the peak releasable P in the sediment was 62
mmol kg-1 on a dry weight basis for the West Basin. The East and North Basins still need to be
sampled to determine the appropriate dose (another sample from the West Basin would not be a
bad idea either). For curiosity sake, the West Basin releasable P concentration was used to
calculate doses for the other basins. The goal for the restoration is to treat the top two centimeters
of sediment by converting the releasable P concentration into a mass of P m-2 using a conversion
factor involving the porosity and bulk density of the sediment. The top two centimeters has been
shown to contain the majority of releasable P during the July period of the year (when the sample
was collected) regardless of lake trophic state (Lake 2009). Once the amount of P to be treated is
determined, the dosage on an area basis is determined. For this example, a molar ratio of Al:P of
25:1 was chosen, though as mentioned, this ratio changes from 4:1 to 100:1. The resulting dose
16
for the chemical treatment was approximately 84 g m-2 of sediment or roughly 300 metric tons in
the West Basin, 100 metric tons in the East Basin, and 65 metric tons in the North Basin. This
was based on the sediment surface area that goes anoxic (i.e. > 30 feet deep).
TABLE 6 PRELIMINARY DOSAGE REQUIREMENTS FOR CHINA LAKE
PARAMETER WEST BASIN EAST BASIN NORTH BASIN Sediment P (mmol kg-1 D.W.) 62 n/a n/a Depth of Sediment Treated (m) 0.02 0.02 0.02 Mass of Sediment Treated (kg m-2 D.W.) 2 2 2 Mass of P Treated (mmol m-2) 124 124 124 Mass of Al for Treatment (mol m-2) 3.1 3.1 3.1 Sediment Area (m2) 3,580,679 1,163,570 766,800 Mass of Al for Treatment (kg) 299,703 97,391 64,181 Gallons Al2(SO4)3 Liquid (0.22 Al kg gal-1) 593,471 192,853 127,091 Gallons NaAlO2 Liquid (0.57 Al kg gal-1) 296,735 96,427 63,546 Volume ratio [Al2(SO4)3:NaAlO2] 2:1 2:1 2:1 Cost of Aluminum Sulfate ($1.23/gal) $729,969 $237,209 $156,322 Cost of Sodium Aluminate ($2/gal) $593,471 $192,853 $127,091 Estimated Days of Application (10 ha/day) 36 12 8
To avoid any issues with decreasing pH, the aluminum dose could be either dosed over a period
of time or the dose could be split between aluminum sulfate (acidic) and sodium aluminate
(basic). Both chemicals readily hydrolyze in lake water to form the desired product of
amorphous aluminum hydroxide which scavenges P and particulate matter while precipitating to
the lake sediment. A volumetric ratio of aluminum sulfate to sodium aluminate of 2:1 represents
the pH balance point for lakes with low alkalinity, like China Lake. Polyaluminum chloride is
another option that would produce less effect on pH.
Though numerous methods have been used, typically the alum treatment is applied using a
modified barge (Cooke et al. 2005). The barge contains a storage tank for the chemicals which
feeds the application manifold through a pump. The barge is resupplied with chemical by tanker
trucks at the nearest access point to the lake. The application manifold is lowered into the water
to the appropriate depth and spread evenly as the barge covers the hypolimnetic area of the lake.
Accurate GPS is required to guide the captain and weather conditions play a large role in the
success of the application.

17
FIGURE 4 SCHEMATIC OF AN ALUM TREATMENT BARGE. COURTESY OF COOKE ET AL 2005
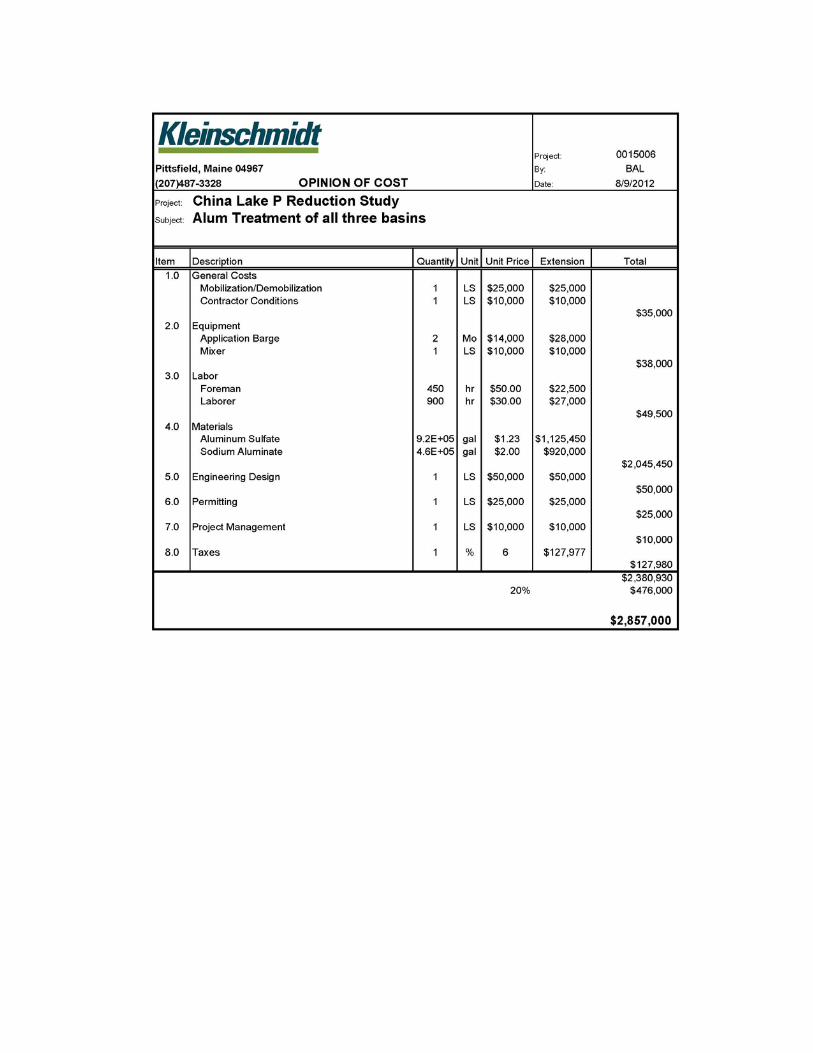
A preliminary opinion of probable cost was calculated for two scenarios involving the treatment
of all three basins and the treatment of just the East and North Basin (Appendix E). To perform a
chemical treatment on all three basins would cost approximately $2.9 million with a 20%
contingency. To treat just the East and North Basins would cost approximately $1.1 million with
a 20% contingency. Both costs include general costs, equipment, labor, materials, and indirect
costs (e.g. design, permitting, project management, and taxes). Monitoring was not considered
because the KWD already has an adequate monitoring program. Both opinions of probable cost
are large capital investments.
Over the past 40 years, there have been many treatments using aluminum-based chemicals to
restore lake water quality. Of those treatments, relatively few have published reports of
effectiveness. Only two treatments have occurred in Maine, one successful (Annabessacook
Lake) and one unsuccessful (Threemiile Pond) (Roy Bouchard personal communication). Welch
and Cooke (1999) compiled data from 12 case studies from 1970 to 1986 of well stratified lakes.
In seven of the lakes, internal loading of P was reduced and remained low for an average of 13
years. In all cases, at least a 40% reduction was accomplished in the first two years, though the
extent and longevity of the treatment varied. The highest percent reduction in internal loading
rate was 82%. Reductions in whole lake P were much more variable and were likely a function
of the extent of external loading reduction before and after alum treatment.

18
Assuming an alum treatment of China Lake falls within the historical effectiveness described
above; a reduction of internal P loading of approximately 900 to 1850 kg yr-1 (1985 to 4080 lb
yr-1) is expected based on median sediment P release rates for the whole lake. At a capital
investment of $2.9 million, this equates to approximately $710 to $1,460 per pound of P
removed. Compared to average cost of external load best management practices ($3,500 per lb P
removed), this is a long term investment that will pay off. Still, $2.9 million is a lot of money.
For that reason, dosing just the East and North Basin may be a better course of action. Under the
same assumptions, this treatment would result in a reduction of approximately 545 to 1115 kg yr-
1 (1200 to 2460 lb yr-1) costing approximately $450 to $920 per pound of P removal. The
obvious question with dosing just the East and North Basins relates to whether the whole lake
water quality will improve. Most likely, the greatest effect of internal P loading occurs in the
North and East Basins for the following reasons:
• The highest rate of external loading and hypolimnetic P accumulation occurs in these two basins, clearly shown in over two decades worth of data (Figure D5 and Figure D6)
• The hypolimnetic depth is shallower such that the released sedimentary P is much more likely to reach the epilimnion during the growing season
• Empirical data suggests that mixing events have entrained hypolimnetic water during the growing season, likely fueling algal blooms
• The West Basin hypolimnetic volume is so large that P concentrations do not get high enough to rapidly diffuse upwards
• The West Basins hypolimnetic depth is such that released sedimentary P likely does not reach the epilimnion in significant amounts during the growing season.
Therefore, the smart investment would be to treat the East and North Basin, monitor the results,
and re-evaluate if the West Basin seems to be a source of internal load that promotes algal
blooms during the growing season.
The length of time the alum treatment is effective can be assessed by analyzing the
sedimentation rate in China Lake. Before China Lake became eutrophic, the sedimentation rate
was measured at 1.4 mm yr-! (Sasseville and Norton 1975). If that sedimentation rate is accurate
for post-treatment conditions, then the dose of aluminum would be buried past 2 cm of sediment
in a little over 14 years. Therefore, it would be a good estimate that the dose of aluminum should
be effective for longer than a decade. Also, if external loadings have been adequately addressed,
then the resupply of P to the sediment will decrease such that the internal loading potential of
China Lake declines to the point where the waterbody shifts into another trophic state.
19
3.3 LAKE DRAWDOWN
The main objective of this study was to investigate the feasibility and effectiveness of altering
the China Lake winter drawdown to increase the export of P out of the system. Lake drawdowns
have been utilized in Maine at Sebasticook Lake and Webber Pond, among others. However,
there is a paucity of research devoted to determining the effectiveness of this restoration
technique. In fact, after a quick literature search, only two papers addressed water level
drawdowns and both were from the perspective that there were negative effects within the
context of managed reservoirs (Klotz and Linn 2001; Furey et al 2004). Regardless, flushing of
nutrient rich water should theoretically remove more P from the lake. There are two parameters
that can be altered to optimize the lake drawdown, timing and magnitude. Both are currently
mandated by the lake level order described previously in this report. In order to change the lake
level order, sufficient evidence must show the new drawdown will provide significant
improvement in P export and that current designated uses of China Lake are unaffected.
The magnitude of the drawdown is constrained by the hydrology of the China Lake Watershed,
the hydraulic capacity of both the China Lake Dam and the Masse Dam, and landowner issues.
During the annual China Lake Association meeting held July 28th, 2012, the general consensus
was that alterations in lake level were warranted and no objections to increased drawdown were
put forth. Therefore, public outreach to date has not identified any landowner issues related to a
higher magnitude drawdown.
The hydraulic capacity of the China Lake Dam far exceeds that of the Masse Dam just 2,000 feet
downstream such that a maximum of 230 cfs can be released at one time from China Lake
without causing problems at Masse Dam. It should be noted that this study did not calculate the
hydraulic capacity of the bridge/culvert on Stanley Hill Road in the Town of Vassalboro. Upon
visual inspection, it appeared to be able to pass more than the Masse Dam spillway such that no
flooding should occur there at flows 230 cfs and less. The remaining dams on the China Lake
Outlet Stream likely have enough spill capacity, but were not evaluated as part of this study. The
KWD or surrogate China Lake Dam operator should coordinate with the other dam owners to
make sure that no flooding occurs during the release of water during the China Lake drawdown.

20
Also, it is unknown whether there is another gate at Masse Dam that would increase the
hydraulic capacity.
One of the main issues raised by stakeholders regarding a large drawdown is the increased
probability that China Lake will not refill to the springtime lake level of 195.1 feet NGVD. The
China Lake watershed is small compared to the size of the lake therefore it was assumed that the
hydrology was insufficient to replenish the lake volume. According to both hydrologic methods
utilized in this study, there is enough flow in the winter and spring to compensate for a
drawdown to the sill elevation of the sluice gates assuming the drawdown is completed by
November 15th (Table 7). The water budget for the winter and spring is a surplus of 27, 683 acre-
ft under current conditions (i.e. 5.4 cfs for drinking water and 10 cfs minimum flow) and 22,446
acre-ft if the KWD was withdrawing water at maximum capacity (Appendix C). Therefore,
under the current conditions, if the lake was drawn down to the sill of the sluice gates, there
would still be a surplus of 6,304 acre-ft during the winter and spring. However, if the KWD was
withdrawing at maximum capacity, there would be a surplus of only 1,067 acre-ft which is
insufficient to compensate for the net loss of water during the summer and fall under the
maximum withdrawal scenario.
TABLE 7 THE VOLUME AND CHANGE IN VOLUME OF CHINA LAKE FOR VARIOUS LAKE LEVELS
LAKE LEVEL (NGVD) DEPTH (FT) VOLUME (AC-FT) CHANGE IN VOLUME
(AC-FT) 195.1 -0.5 104539 - 194.6 0 102564 1976 193.6 1 98612 5928 192.6 2 94660 9879 191.6 3 90744 13796 190.6 4 86952 17587 189.6 5 83161 21379
Not all years are average years for precipitation, therefore using the 75% and 95% exceedence
values from the winter and spring flow duration curves produced a surplus of 7,696 acre-ft and a
deficit of 238 acre-ft, respectively. Likewise, using the lowest recorded annual flow for the
Togus gage and prorating it to China Lake resulted in a surplus of approximately 8,108 acre-ft.
This suggests during drought years, China Lake may refill less than 2 feet or not at all from the
set drawdown elevation. Therefore, there is a slight risk that China Lake may not refill to normal
21
pond every summer. If this happens, the drawdown should cease until sufficient precipitation
replenishes the water storage in China Lake. Most climatologists predict that Maine will have
warmer and wetter winters in the future, so severe winter and spring droughts are probably not
likely to occur.
The timing of the drawdown is another parameter that can be manipulated to optimize the China
Lake drawdown plan. As shown in Figure 5, the length of time to drain 5.5 feet of China Lake is
over forty days at the maximum hydraulic capacity of 230 cfs. As China Lake drains to near the
sill elevation of the sluice gates (189.6 ft NGVD), the flow will decrease as the head is
dissipated. At a half foot of water depth (190.1 ft NGVD lake level), the maximum flow through
the sluice gate openings is approximately 100 cfs (Appendix C). Therefore, it will be difficult to
completely drain the lake to the sill of the sluice gate. Obviously, the assumption of no inflow
into China Lake is not valid, so this limits the time of year that a large drawdown is feasible
based on the hydraulic constraints. The months that a significant amount of water can be
withdrawn from China Lake without substantial inflows are June, July, August, September, and
October with June, July, and August not feasible due to existing designated uses of China Lake
for summertime recreation. That leaves September and October as candidates for a new
drawdown period.

22
FIGURE 5 LENGTH OF TIME TO LOWER THE LAKE LEVEL FOR VARIOUS FLOWS ASSUMING
NO INFLOW TO CHINA LAKE Two possible benefits should be considered when deciding when to drawdown China Lake; the
period of maximum epilimnetic P removal and the period of maximum removal of organic
matter. The removal of P is obvious in that the more P exported the less is available to cause
water quality issues. The export of organic matter is less obvious. Organic matter, particularly
fresh detritus from recent algal blooms, is optimal fuel for the bacteria in the sediment that can
lead to oxygen consumption and thus internal P loading. In theory, by removing massive
amounts of fresh organic matter, less sedimentation occurs and the oxygen consuming bacteria in
the sediment receive less organic matter fuel for decomposition and less particulate P to
replenish the sediment supply. There is very little consensus which of these factors is more
important, partly due to a lack of research.
During the available window to perform the China Lake drawdown, the water column fully
mixes. This typically occurs around the second week of October (Table 3). As predicted during
the month of October, the average P concentration increases from previous months likely due to
189
190
191
192
193
194
195
196
0 20 40 60 80 100 120
Lak
e L
evel
(NG
VD
)
Days
230 cfs
200 cfs
150 cfs
100 cfs

23
the mixing of nutrient rich hypolimnetic water with epilimnetic water (Figure D8). During
September, the average Secchi disc measurements are at the lowest suggesting this month is
optimal for removing the most organic matter (assuming Secchi readings are reflective of algal
blooms). However, the average Secchi disc measurement is only slightly higher in October, so
both months should export a large amount of algal biomass from China Lake. Because the
drawdown will take a substantial amount of time based on the hydraulic constraints,
encompassing the mixing period should be relatively easy. However, determining the exact date
of the turnover would be much more difficult (requiring time-consuming and expensive
modeling tools) and likely unnecessary. Therefore, performing the majority of the drawdown in
October represents the best timing to optimize P and organic matter export from China Lake.
Based on the current lake level plan, during the winter drawdown approximately 170 kg (375 lb)
of P is removed from China Lake. This is based on an average P concentration for the whole year
(17 µg L-1) because insufficient data is available for the month of November, and no data was
available for December. Also, the calculation assumes that the lake level is six inches above the
dam spillway crest. Therefore, 170 kg is likely a high estimate. Table 8 shows the export
potential for different lake level targets. This is based on the average P concentration in
September and October of 18 and 22 µg L-1. By timing the withdrawal in October and lowering
the winter lake level by 1.5 feet, an extra 200 kg (440 lb) of P are exported out of China Lake
each year.
TABLE 8 ESTIMATED EXPORT OF P FOR DIFFERENT LAKE LEVEL DRAWDOWN TARGETS
Lake Level (NGVD) Depth (ft) PSeptember (kg) POctober (kg) 195.1 -0.5 - - 194.6 0 44 54 193.6 1 132 161 192.6 2 219 268 191.6 3 306 374 190.6 4 390 477 189.6 5 475 580
Altering the China Lake drawdown would not cost any money other than the time spent
petitioning the Board of Environmental Protection to change the lake level order. As such, there
are no economic constraints to implementing a new lake drawdown plan.

24
4.0 RECOMMENDATION
The water quality of China Lake would benefit from altering the current lake level plan in timing
and magnitude. By starting the drawdown the first of October, China Lake can be drained four
feet from normal pond before November 15 assuming a net outflow of 200 cfs. Because 30 cfs is
exceeded only 20% of the time during the fall (Appendix C), a net outflow of 200 cfs will be
maintained 80% of the time with proper sluice gate operation without exceeding the hydraulic
capacity of the Masse Dam. Stage-discharge curves for various gate settings and lake levels are
provided in Appendix B. During a normal precipitation year and the current withdrawal demands
of China Lake, there should be no issue refilling China Lake during the winter and spring months
even if the lake is drained to the sill of the sluice gates. However, because there is a slight
possibility that a drought year could follow a drawdown, the winter lake level should be set at
191.6 feet NGVD which is 1.5 feet lower than the current lake level order. If over time China
Lake has difficulty refilling or spilling too much during the spring, the winter lake level should
be altered to either increase P export or increase the probability of refilling the lake. At the
suggested China Lake drawdown, an extra 200 kg of P will be exported from the system every
year. This is approximately one fifth the load reduction needed to reach the goal set in the TMDL
study (MEDEP 2001).
The benefit from flushing organic matter out of the system via lake drawdown is difficult to
gage. Published research is either inadequate or too controversial to estimate the effect this
removal of algal biomass would have on the overall trophic state of China Lake. However, in
theory, reducing the epilimnetic flux of algal biomass to the sediment should reduce the sediment
oxygen demand and may alleviate some of the anoxic conditions in the hypolimnion during the
following summer growing season.
Though the drawdown of China Lake would provide a significant increase in P export, the new
lake level plan, by itself, will likely not change the trophic state of China Lake. To reach the goal
outlined in the TMDL report, further work reducing external loading or a chemical treatment is
needed. At $1.1 million price tag, alum treatment would require isolating funding sources and
significant fundraising. However, as documented in this report, alum treatment is the most direct
way and, likely, most successful way of reducing internal P loading in China Lake. Because the
East and North Basins likely fuel algal blooms in China Lake more so than the West Basin,

25
limiting the treatment to these two basins will likely be effective for the whole lake. Initial
studies involving characterizing the sediments of China Lake, determining funding sources, and
permitting requirements should commence for alum treatment. Fundraising and designing an
alum treatment will likely take multiple years. In the meantime, implementing the new
drawdown plan should commence immediately.

26
5.0 REFERENCES
Colby College, 2006. "A Watershed Analysis of China Lake". Colby Environmental Assessment Team (CEAT) Watershed Study: China Lake. Paper 1. Downloaded from: http://digitalcommons.colby.edu/chinalake/1 Cooke, D.G., E.B. Welch, S.A. Peterson and S.A. Nichols, 2005. Restoration and Management of Lakes and Reservoirs. CRC Press, Boca Raton: 616 pp. Dudley, R.W., 2004, Estimating monthly, annual, and low 7-day, 10-year streamflows for ungaged rivers in Maine: U.S. Geological Survey Scientific Investigations Report 2004-5026, 22 p. Dunalska, J.A., Wisniewski, G. and C. Mientki. 2007. Assessment of multi-year (1956–2003) hypolimnetic withdrawal from Lake Kortowskie, Poland, Lake and Reservoir Management, 23(4): 377-387. Egemose, S., Reitzel, K., Andersen, F.O., and M.R. Flindt. 2010. Chemical Lake Restoration Products: Sediment Stability and Phosphorus Dynamics. Environmental Science and Technology. 44: 985-991. Egemose, S., de Vincente, I., Reitzel, K., Flindt, M.R., Andersen, F.O., Lauridsen, T.L., Sondergaard, M., Jeppeson, E., and H.S. Jensen. 2012. Changed cycling of P, N, Si, and DOC in Danish Lake Nordborg after aluminum treatment. Canadian Journal of Fisheries and Aquatic Science. 68: 842-856. Furey, P.C. , Nordin, R.N. and Mazumder, A. 2004. Water Level Drawdown Affects Physical and Biogeochemical Properties of Littoral Sediments of a Reservoir and a Natural Lake, Lake and Reservoir Management, 20(4): 280-295, Gibbs, M.M., Hickey, C.W., and D. Ozkundakci. 2011. Sustainability assessment and comparison of efficacy of four P-inactivation agents for managing internal phosphorus loads in lakes: sediment incubations. Hydrobiologia. 658: 253-275. Henderson-Sellers, B. Markland, H.R. 1987. Decaying Lakes: The Origins and Control of Cultural Eutrophication. New York, NY: John Wiley and Sons. Hupfer, M. and B.W. Scharf. 2002. VI-2.1 Seentherapie: Interne Massnahmen zur Verminderung der Phosphorkonzentration. P. 1-68. In C. Steinberg, W. Calmano, H. Klapper and R.-D. Wilken (eds.). Handbuch Angewandte Limnologie. ecomed- Verlag, Landsberg/Lech, Germany. Kennedy. R.H. and G.D. Cooke. 1982. Control of lake phosphorus with aluminum sulfate. Dose determination and application techniques. Water Research Bulletin 18: 387-404. Klotz, R.L. and Linn, S.A. 2001 Influence of Factors Associated with Water Level Drawdown on Phosphorus Release from Sediments, Lake and Reservoir Management, 17(1): 48-54.

27
Kopacek J., Borovec J., Hejzlar J., Ulrich K., Norton S., and A. Amirbahman. 2005. Aluminum control of phosphorus sorption in lake sediments. Environmental Science and Technology. 39: 8784-8789. Lake, B. A., Coolidge, K.M., Norton, S., and A. Amirbahman. 2007. Factors contributing to the internal loading of phosphorus from anoxic sediments in six Maine, USA, lakes. The Science of the Total Environment. 373: 534-541. Lake, B.A. 2009. Biogeochemical Phosphorus Cycling in the Sediments of Shallow Temperate Lakes. Doctoral Dissertation. Civil and Environmental Engineering, University of Maine, Orono, ME. Maine Department of Environmental Protection. 2001. China Lake East and West basins (Kennebec County, Maine) Final Total Maximum Daily Load Study. Augusta, Maine. Molen, D.T. and Boers, P.C.M. 1994. Influence of internal loading on phosphorus concentrations in shallow lakes before and after reduction of the external loading. Hydrobiologia. 275-276(1): 379-389. Mortimer, C.F. 1941. The exchange of dissolved substances between mud and water in lakes. Journal of Ecology. 29(2): 280-329. Nurnberg, G.K. 1987. Hypolimnetic withdrawal as a lake restoration technique. Society of Civil Engineers America. J. Environ. Eng. 113:1006-1017. Nurnberg, G.K. 2007. Lake responses to long-term hypolimnetic withdrawal treatments. Lake and Reservoir Management. 23: 388-409. Pearce A. 2000. Phosphorus Cycling in Maine Lakes: A Geochemical Study. Masters Thesis. Civil and Environmental Engineering, University of Maine, Orono, ME. Psenner R, Bostrom B, Dinka M, Pettersson K, Puckso R, Sager M. 1988. Fractionation of phosphorus in suspended matter and sediment. Arch Hydrobiol Suppl. 30:98–103. Reitzel, K., Hansen, J., Andersen, F.O., Hansen, K.S., and H.S. Jensen. 2005. Lake Restoration by Dosing Aluminum Relative to Mobile Phosphorus in the Sediment. Environmental Science and Technology. 39: 4134-4140. Rydin, E., and E.B. Welch. 1999. Dosing alum to Wisconsin lake sediments based on in vitro formation of aluminum bound phosphate. Lake and Reservoir Management. 15: 324-331. Sasseville, D.R. and S.A. Norton. 1975. Present and historic geochemical relationships in four Maine Lakes. Limnology and Oceanography. 20: 699-714. Schauser I., Lewandowski, J., and M. Hupfer. 2003. Decision support for the selection of an appropriate in-lake measure to influence the phosphorus retention in sediments. Water Research. 37: 801-812.

28
Singleton, V. L. and Little, J. C. 2006. Designing Hypolimnetic Aeration and Oxygenation Systems - A Review. Environmental Science & Technology, 40: 7512-7520. Walker, W.W. 2003. Consideration of Variability and Uncertainty in Phosphorus Total Maximum Daily Loads for Lakes. Journal of Water Resources Planning and Management. 129 (4): 337-344. Wetzel, R.G. 2001. Limnology: Lake and River Ecosystems. Third Edition. San Diego, CA: Academic Press Wilson, T.A., Norton, S.A., Lake, B.A., A. Amirbahman. 2008. Sediment geochemistry of Al, Fe, and P for two historically acidic, oligotrophic Maine Lakes. Science of the Total Environment. 404(2-3): 269-275. \\Eagle\Jobs\015\006\Docs\001 Feasibility Study and Alternatives Analysis Report.docx

APPENDIX A
PHOTOGRAPHS
PHOTOGRAPH 1 CHINA LAKE OUTLET DAM
PHOTOGRAPH 2 CHINA LAKE DAM SLUICE GATES

PHOTOGRAPH 3 CHINA LAKE DAM SPILLWAY
PHOTOGRAPH 4 MASSE DAM

PHOTOGRAPH 5 MASSE DAM SPILLWAY

APPENDIX B
HYDRAULICS
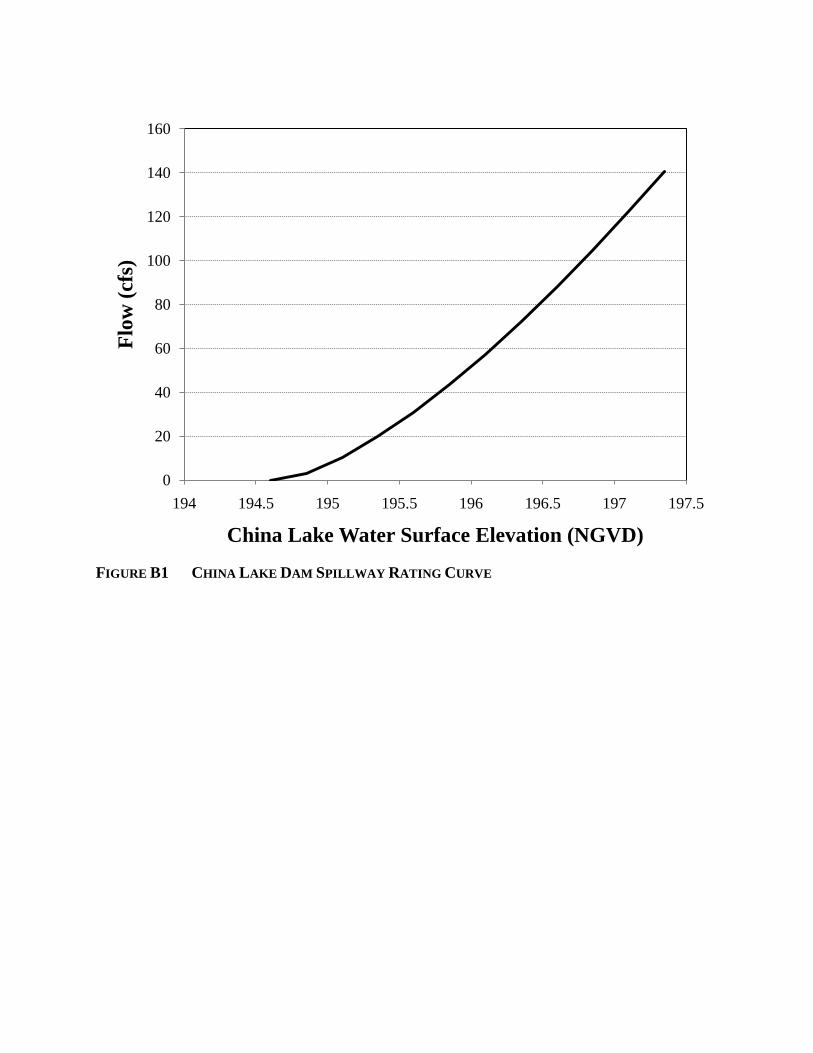
FIGURE B1 CHINA LAKE DAM SPILLWAY RATING CURVE
0
20
40
60
80
100
120
140
160
194 194.5 195 195.5 196 196.5 197 197.5
Flow
(cfs
)
China Lake Water Surface Elevation (NGVD)

FIGURE B2 CHINA LAKE DAM GATE DISCHARGES AT ORDINARY HIGH WATER (195.1
NGVD)
0
50
100
150
200
250
300
350
0 1 2 3 4 5
Dis
char
ge (c
fs)
Gate Opening (ft)
Gate 1 Gate 2

FIGURE B3 CHINA LAKE DAM GATE DISCHARGES AT NORMAL POND (194.6 NGVD)
0
50
100
150
200
250
300
350
0.0 0.5 1.0 1.5 2.0 2.5 3.0 3.5 4.0
Dis
char
ge (c
fs)
Gate Opening (ft)
Gate 1 Gate 2

FIGURE B4 CHINA LAKE DAM GATE DISCHARGES AT WINTER LAKE LEVEL (193.1 NGVD)
0
50
100
150
200
250
300
0.0 0.5 1.0 1.5 2.0 2.5 3.0
Dis
char
ge (c
fs)
Gate Opening (ft)
Gate 1 Gate 2

APPENDIX C
MORPHOLOGY AND HYDROLOGY

TABLE C1 CHINA LAKE MORPHOLOGY
LAKE LEVEL (NGVD) DEPTH (FEET)
SEDIMENT AREA (ACRE)
VOLUME (ACRE-FEET)
195.1 -0.5 3937 104539 194.6 0.0 3935 102564 191.8 2.8 3926 91578 188.5 6.1 3562 79142 185.3 9.3 3182 68379 182.0 12.6 2854 58468 178.7 15.9 2602 49507 175.4 19.2 2401 41281 172.1 22.5 2172 33720 168.9 25.7 1825 27286 165.6 29.0 1449 21915 162.3 32.3 1154 17652 159.0 35.6 941 14224 155.7 38.9 761 11437 152.5 42.1 612 9249 149.2 45.4 509 7412 145.9 48.7 420 5886 142.6 52.0 344 4635 139.3 55.3 276 3617 136.1 58.5 237 2802 132.8 61.8 202 2082 129.5 65.1 159 1487 126.2 68.4 120 1029 122.9 71.7 89 687 119.7 74.9 68 438 116.4 78.2 49 243 113.1 81.5 32 111 109.8 84.8 16 32 106.5 88.1 3 4 103.3 91.3 0 0
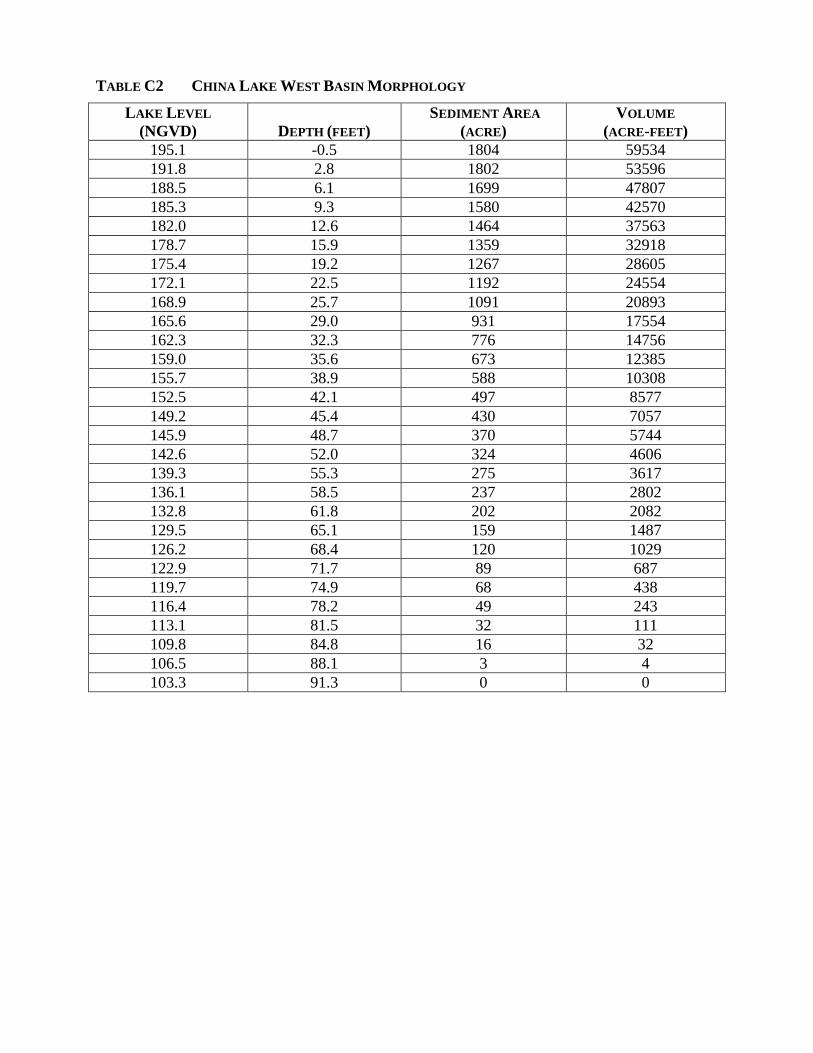
TABLE C2 CHINA LAKE WEST BASIN MORPHOLOGY
LAKE LEVEL (NGVD) DEPTH (FEET)
SEDIMENT AREA (ACRE)
VOLUME (ACRE-FEET)
195.1 -0.5 1804 59534 191.8 2.8 1802 53596 188.5 6.1 1699 47807 185.3 9.3 1580 42570 182.0 12.6 1464 37563 178.7 15.9 1359 32918 175.4 19.2 1267 28605 172.1 22.5 1192 24554 168.9 25.7 1091 20893 165.6 29.0 931 17554 162.3 32.3 776 14756 159.0 35.6 673 12385 155.7 38.9 588 10308 152.5 42.1 497 8577 149.2 45.4 430 7057 145.9 48.7 370 5744 142.6 52.0 324 4606 139.3 55.3 275 3617 136.1 58.5 237 2802 132.8 61.8 202 2082 129.5 65.1 159 1487 126.2 68.4 120 1029 122.9 71.7 89 687 119.7 74.9 68 438 116.4 78.2 49 243 113.1 81.5 32 111 109.8 84.8 16 32 106.5 88.1 3 4 103.3 91.3 0 0
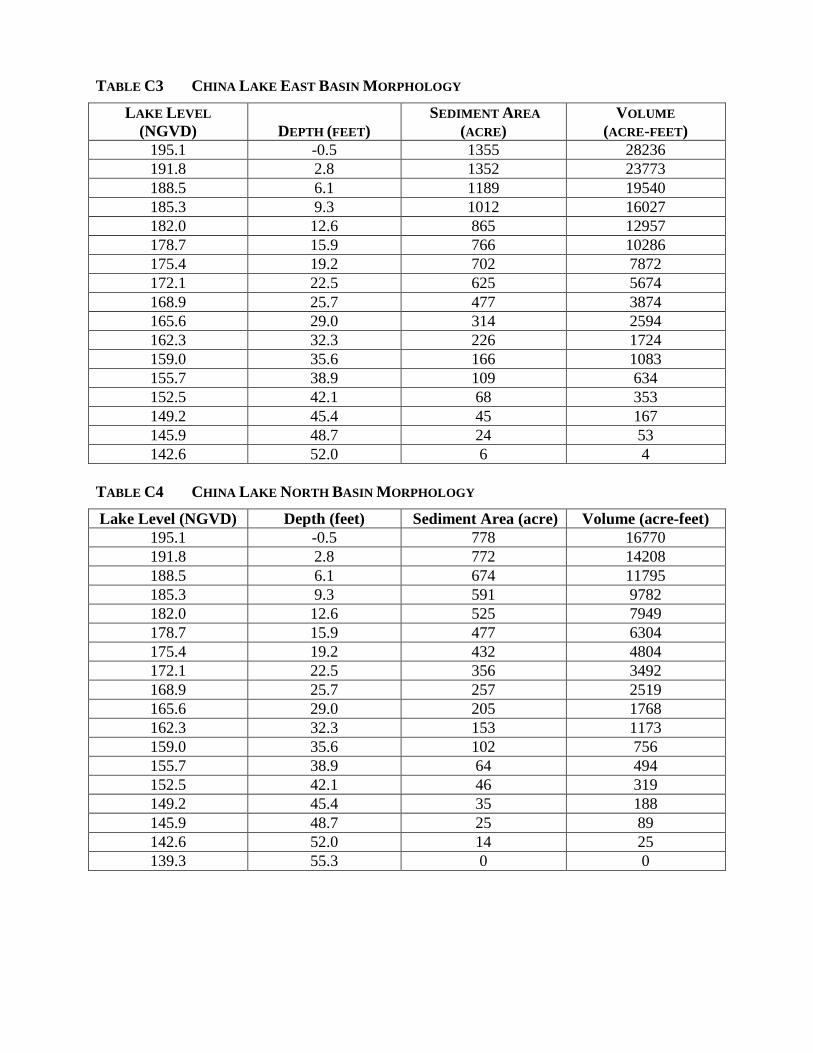
TABLE C3 CHINA LAKE EAST BASIN MORPHOLOGY
LAKE LEVEL (NGVD) DEPTH (FEET)
SEDIMENT AREA (ACRE)
VOLUME (ACRE-FEET)
195.1 -0.5 1355 28236 191.8 2.8 1352 23773 188.5 6.1 1189 19540 185.3 9.3 1012 16027 182.0 12.6 865 12957 178.7 15.9 766 10286 175.4 19.2 702 7872 172.1 22.5 625 5674 168.9 25.7 477 3874 165.6 29.0 314 2594 162.3 32.3 226 1724 159.0 35.6 166 1083 155.7 38.9 109 634 152.5 42.1 68 353 149.2 45.4 45 167 145.9 48.7 24 53 142.6 52.0 6 4
TABLE C4 CHINA LAKE NORTH BASIN MORPHOLOGY
Lake Level (NGVD) Depth (feet) Sediment Area (acre) Volume (acre-feet) 195.1 -0.5 778 16770 191.8 2.8 772 14208 188.5 6.1 674 11795 185.3 9.3 591 9782 182.0 12.6 525 7949 178.7 15.9 477 6304 175.4 19.2 432 4804 172.1 22.5 356 3492 168.9 25.7 257 2519 165.6 29.0 205 1768 162.3 32.3 153 1173 159.0 35.6 102 756 155.7 38.9 64 494 152.5 42.1 46 319 149.2 45.4 35 188 145.9 48.7 25 89 142.6 52.0 14 25 139.3 55.3 0 0

FIGURE C1 SPRING (APRIL 1ST TO MAY 31ST) FLOW DURATION CURVE FOR CHINA LAKE
FIGURE C2 SUMMER (MAY 31ST TO SEPTEMBER 1ST) FLOW DURATION CURVE FOR CHINA
LAKE
1
10
100
1000
10000
0% 10% 20% 30% 40% 50% 60% 70% 80% 90% 100%
Flow
(cfs
)
Percent Exceedence
1
10
100
1000
0% 10% 20% 30% 40% 50% 60% 70% 80% 90% 100%
Flow
(cfs
)
Percent Exceedence

FIGURE C3 FALL (SEPTEMBER 1ST TO NOVEMBER 15TH) FLOW DURATION CURVE FOR
CHINA LAKE
FIGURE C3 WINTER (NOVEMBER 15TH TO APRIL 1ST) FLOW DURATION CURVE FOR CHINA
LAKE
1
10
100
1000
0% 10% 20% 30% 40% 50% 60% 70% 80% 90% 100%
Flow
(cfs
)
Percent Exceedence
1
10
100
1000
0% 10% 20% 30% 40% 50% 60% 70% 80% 90% 100%
Flow
(cfs
)
Percent Exceedence

TABLE C5 CHINA LAKE ANNUAL FLOWS AND WATER BUDGET BASED ON THE TOGUS GAGE.
ANNUAL FLOWS TOGUS (CFS) CHINA (CFS)
1982 43.8 59.1
1983 52.4 70.8
1984 68.4 92.4
1985 19.7 26.6
1986 42.1 56.8
1987 34.5 46.6
1988 27.2 36.7
1989 40.4 54.5
1990 38.1 51.4
1991 54.0 72.9
1992 43.6 58.9
1993 33.4 45.1
1994 41.6 56.2
1995 38.9 52.5
Average Annual 55.8 cfs
Normal Surplus 29,215 ac-ft yr-1
Minimum Surplus 19,659 ac-ft yr-1
0.3
flushing rate (inflow/volume)
TABLE C6 SUMMARY OF SEASONAL WATER BUDGET SURPLUSES AND DEFICITS BASED ON
THE TOGUS GAGE
NORMAL MINIMUM
Winter 15873 12207
Spring 11810 10239
Summer 1336 -1047
Fall 1129 -808
Total 30148 20591

APPENDIX D
WATER QUALITY

FIGURE D1 Box plot of Secchi disc measurements by month in China Lake. The upper
and lower tails represent the maximum and minimum. The box represents the upper and lower quartiles of the data. The value in the box is the historical average Secchi reading for that month.
0
1
2
3
4
5
6
7
8
April May June July August September October
Dep
th (m
)
3.64.3
4.6
3.9
1.9 2.32.5

FIGURE D2 Plot of variance in historical temperature and dissolved oxygen values for the
West Basin of China Lake.
-90
-80
-70
-60
-50
-40
-30
-20
-10
00 5 10 15 20
Dep
th (f
t) in
Wes
t Bas
inVariance in historical values from May to October
Temperature
Dissolved Oxygen

FIGURE D3 Plot of variance in historical temperature and dissolved oxygen values for the
East Basin of China Lake.
-50
-45
-40
-35
-30
-25
-20
-15
-10
-5
00 5 10 15 20 25
Dep
th (f
t) in
Eas
t Bas
inVariance in Historical Values from May to October
Temperature
Dissolved Oxygen

FIGURE D4 Plot of variance in historical temperature and dissolved oxygen values for the
North Basin of China Lake.
-60
-50
-40
-30
-20
-10
00 5 10 15 20
Dep
th (f
t) in
Nor
th B
asin
Variance in Historical Values from May to October
Temperature
Dissolved Oxygen

FIGURE D5 Box plot of total phosphorus concentrations by depth in the basins of China
Lake. The upper and lower tails represent the maximum and minimum. The box represents the upper and lower quartiles of the data. The value in the box is the historical average phosphorus concentration. Note the y-axis is a logarithmic scale.
1
10
100
1000
North (7m) North (14m)
East (7m) East (14m) West (7m) West (14m)
West (21m)
Tota
l Pho
spho
rus (µg
L-1
)
16.8
86.3
16.9
51.9
16.6 19.329.1
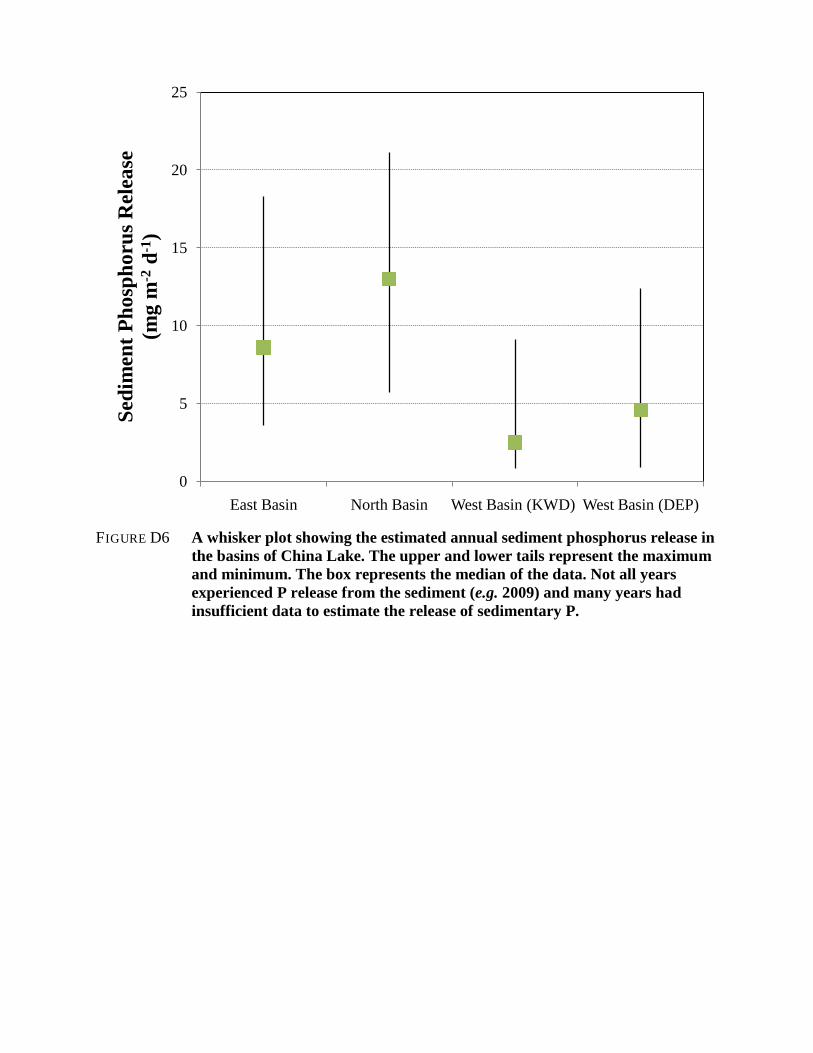
FIGURE D6 A whisker plot showing the estimated annual sediment phosphorus release in
the basins of China Lake. The upper and lower tails represent the maximum and minimum. The box represents the median of the data. Not all years experienced P release from the sediment (e.g. 2009) and many years had insufficient data to estimate the release of sedimentary P.
0
5
10
15
20
25
East Basin North Basin West Basin (KWD) West Basin (DEP)
Sedi
men
t Pho
spho
rus R
elea
se
(mg
m-2
d-1)
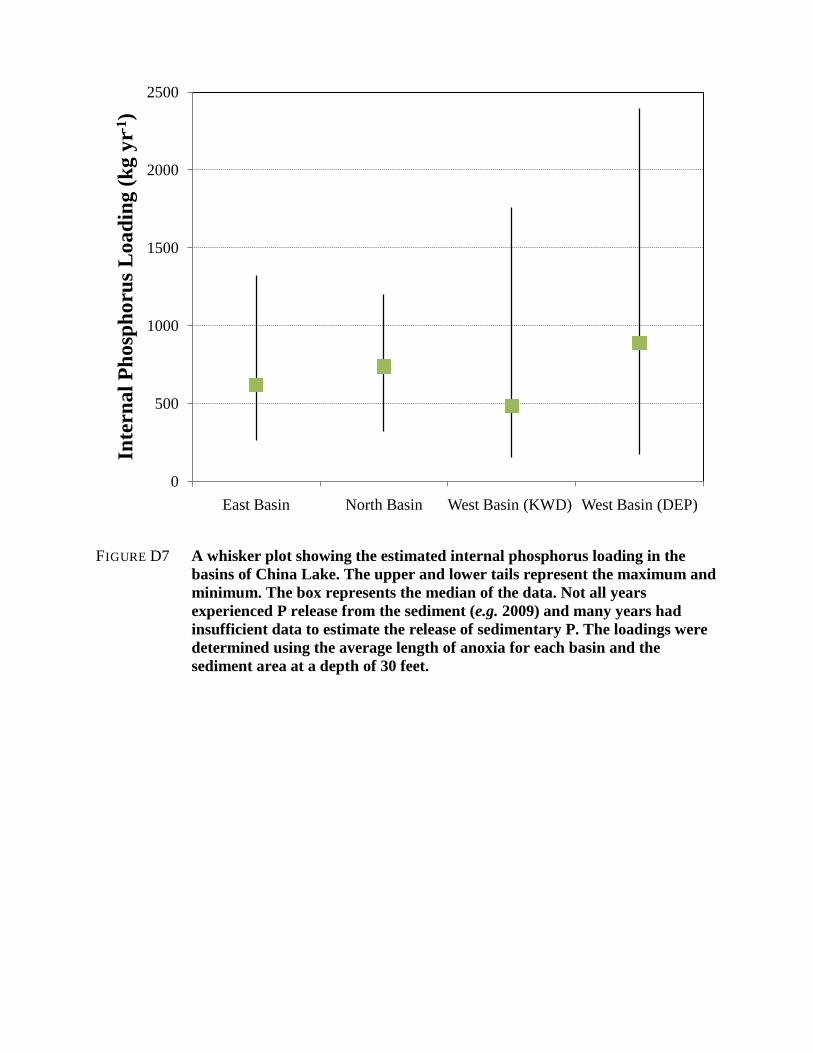
FIGURE D7 A whisker plot showing the estimated internal phosphorus loading in the
basins of China Lake. The upper and lower tails represent the maximum and minimum. The box represents the median of the data. Not all years experienced P release from the sediment (e.g. 2009) and many years had insufficient data to estimate the release of sedimentary P. The loadings were determined using the average length of anoxia for each basin and the sediment area at a depth of 30 feet.
0
500
1000
1500
2000
2500
East Basin North Basin West Basin (KWD) West Basin (DEP)
Inte
rnal
Pho
spho
rus L
oadi
ng (k
g yr
-1)

FIGURE D8 Box plot of total phosphorus concentrations by month in the West Basin of
China Lake. The upper and lower tails represent the maximum and minimum. The box represents the upper and lower quartiles of the data. The value in the box is the historical average phosphorus concentration.
0
10
20
30
40
50
60
May June July August September October
Tota
l Pho
spho
rus (µg
L-1
)
17 16 15 1618
22

APPENDIX E
OPINION OF PROBABLE COST