lake powell pipeline feasibility study · lake powell pipeline feasibility study ... b. pipeline...
TRANSCRIPT
.·
LAKE POWELL PIPELINE FEASIBILITY STUDY
WASHINGTON COUNTY WATER CONSERVANCY DISTRICT
Client Representative
Client Staff
MR. RON THOMPSON
MR. MORGAN JENSEN
Boyle Engineering Corporation & Alpha Engineering, Inc.
Project Manager ERIC LOVELESS, PE
Project Engineers NATHANIEL JONES, PE
BRENT GARDNER, PE
March, 1995
SL-W01-1 01-10
BOYLE/A~ha---------------------
Acknowledgments: Boyle Engineering Corporation would like to express its appreciation to the following individuals for their valuable input into this study.
Washington County Water Conservancy District
Client Staff Ron Thompson Morgan Jensen
Utah State Division of Water Resources
State Staff Larry Anderson Dennis Strong Shalaine Debernardi Benjamin Everitt
Bureau of Land Management, Arizona Strip District
BLM Staff Greg Taylor, Environmental Protection Specialist, Vermillion Resource Area
Dave Everett, Right-of-Way Specialist
Table of Contents Section 1 -Executive Summary ............................................................................ !
Section 2- Introduction ......................................................................................... 6
Section 3 -Evaluation Criteria ............................................................................ 11
A. System Hydraulics ..................................................................................... 11
B. Unit Costs ................................................................................................... 12
C. Interest Rates and Economic Life .............................................................. 17
D. Environmental Considerations ................................................................... 18
E. Geotechnical Considerations ...................................................................... 19
Section 4- Pipeline Alignment Evaluations ....................................................... 20
A. Preliminary Alignment ............................................................................... 20
B. Alignment Shortening ................................................................................ 21
C. Alternate Alignments ................................................................................. 23
D. Favored Alignment .......................... -: ......................................................... 29
Section 5 - Pump Stations ................................................................................... 31
A. Lake Powell Pump Station ......................................................................... 31
B. Cockscomb Pump Station .......................................................................... 35
C. Pump Station Costs .................................................................................... 36
Section 6- Hydrostation and Facilities .............................................................. .40
A. Continuous Power Generation (llMW Facility) ...................................... .40
B. Peaking Power Generation (33 MW Facility) ........................................... .41
Section 7- Results and Project Costs .................................................................. 43
A. Overview of Project Costs ........................................................................ .43
B. Pipeline Alignment Alternatives ............................................................... .43
C. Pipeline Diameter Alternatives ................................................................. .45
D. Pump Station Alternatives ......................................................................... 46
E. Hydrostation Alternatives and Power Rate Impacts .................................. .47
Appendix
Appendix A- Project Summary Sheets
Appendix B - Hydrostation O&M Cost Curve
Appendix C - St. George Electrical Rates
List of Figures
Figure
2-1
2-2
3-1
3-2
Washington County Projected M&I and Secondary_ Demands
Lake Powell Pipeline Facilities Location Map
Typical Hydraulic Profile
Base Pipe Costs - Open Terrain Projects
4-1 Lake Powell Pipeline Alignments and Site Photos
4-2 Lake Powell Pipeline Alignment Profiles
4-3 Lake Powell Pipeline Land Use Map
5-1
5-2
5-3
5-4
7-1
7-2
7-3
Lake Powell Minimum and Maximum End-of-Month Elevations
Lake Powell Elevation - Capacity Curve
North Lone Rock Road Pump Station Site
North Lone Rock Road Conceptual Lakeside Pump Station
Hydraulic Profiles Various Pipe Diameters
Hydraulic Profile of Low Cost One Pump Station Project on Flat Top Alignment
Hydraulic Profile of Refined Diameters w/ 33MW Hydrostation on South . Little Creek Mountain Alignment ·
Section 1 - Executive Summary
Introduction
The Washington County Water Conservancy District (WCWCD) commissioned the Lake Powell Pipeline Study to further investigate the feasibility of delivering Utah's Upper Colorado River water from Lake Powell to Washington County. The Lake Powell Pipeline is one of several water development projects being evaluated by WCWCD to accommodate Washington County's long-term trend of rapid growth. This rapid growth pattern, and forecast growth, are addressed in WCWCD's 1995 Purpose and Needs Study and 1994 Population Management Study.
This study is a reconnaissance-level engineering evaluation of the project facilities, operations, and costs of delivering water from Lake Powell to Washington County to enable WCWCD to determine whether a potentially feasible project exists. This evaluation is accomplished by identifying evaluation criteria; identifying project alternatives, including pipeline alignments, pumping and hydropower options; developing hydraulic operations, costs, and environmental impacts for each alternative; and then refining the more promising alternatives.
Evaluation Criteria
Evaluation criteria are presented to establish the hydraulic operations, cost, environmental and geotechnical issues which affect the identification and evaluation of project alternatives. System hydraulics include minimum system pressures and identification of hydraulic control points. A study flow of 60,000 AF /yr was established by WCWCD and the Utah Division of Water Resources (UDWR). Unit costs for the project's main cost components (pipelines and power rates) are selected by analyzing cost data from several similar pipeline projects and local power agencies to establish well founded unit costs. Interest rates for annualizing capital costs and facility life assumptions match the State of Utah's 1995 assumptions for economic analysis of capital improvement projects. General environmental and geotechnical considerations for developing and evaluating the alternative projects are also identified.
Pipeline Alignments
Pipeline alignments are identified and investigated relative to capital, O&M, and unit water costs, environmental impacts, geotechnical concerns, land use, ROW requirements, and other issues. Descriptions are presented of the alignments themselves and how each is impacted by the foregoing issues. The project alignment alternatives are then compared, weighing in their required pumping and hydrostation facilities, and a favored alignment is selected. Alternative alignments described in this report are listed below (and are illustrated in Figure 4-1 at the end of Section 4):
• Preliminary Alignment (identified by the Utah State Division of Water Resources in 1993) • Preliminary Alignment Shortening Alternatives
- Lost Springs Wash
Lake Powell Pipeline Study Final Report, March 1995
T~----
- Five Mile Mountain - The Cockscomb
• Sand Hollow to Cedar Ridge Alternatives - Frog Hollow/Highway 89 - South Little Creek Mountain
• Pipe Spring to Lost Spring Gap Alternative • Paria East Cove to Lake Powell Alternative • Pump Station Site Alternatives
- North Lone Rock Road - Glen Canyon Dam
• Tunnel Alternatives - Telegraph Flat Saddle Tunnel - Cedar Ridge Tunnel
Pump Stations
Pumping options are presented and analyzed. Cost estimates for alternative pumping options are developed. The pumping options include:
• A single 20 MW, 2300' lift, pump station at Lake Powell • Two 10 MW, 1150' lift, pump stations- one at Lake Powell and one 25 miles west of Lake
Powell • Alternate sites for the Lake Powell Pump Station
Special intake requirements to accommodate the large lake level fluctuations at Lake Poweil are discussed and a conceptual design is presented. Alternative pump station facilities are also described to meet these requirements. Power supply sources, energy rates, and puinping efficiencies are set forth and documented. Costs for each of the alternative pump station facilities are itemized.
Hydrostation Facilities
Two alternative hydrostation options are presented and evaluated. These are:
• an 11 MW, 1900' head continuous operation facility (24 hr/day) • a 33 MW, 1900' head peaking power facility (8 hr/day) w/ a regulating reservoir & upsized pipe.
The 11 MW facility is simple, low cost and clearly feasible. It recaptures about half of the pumping costs. The feasibility of the 33 MW facility'depends on the differential value between the average energy rate and the peak demand energy rate in Washington County. The two hydrostation facilities were evaluated for different power rate assumptions. Facilities for each hydrostation option are
Lake Powell Pipeline Study 2 Final Report, March 1995
J
described. Power supply sources, energy rates, generating efficiencies, and itemized capital costs are described and documented.
Results and Project Costs
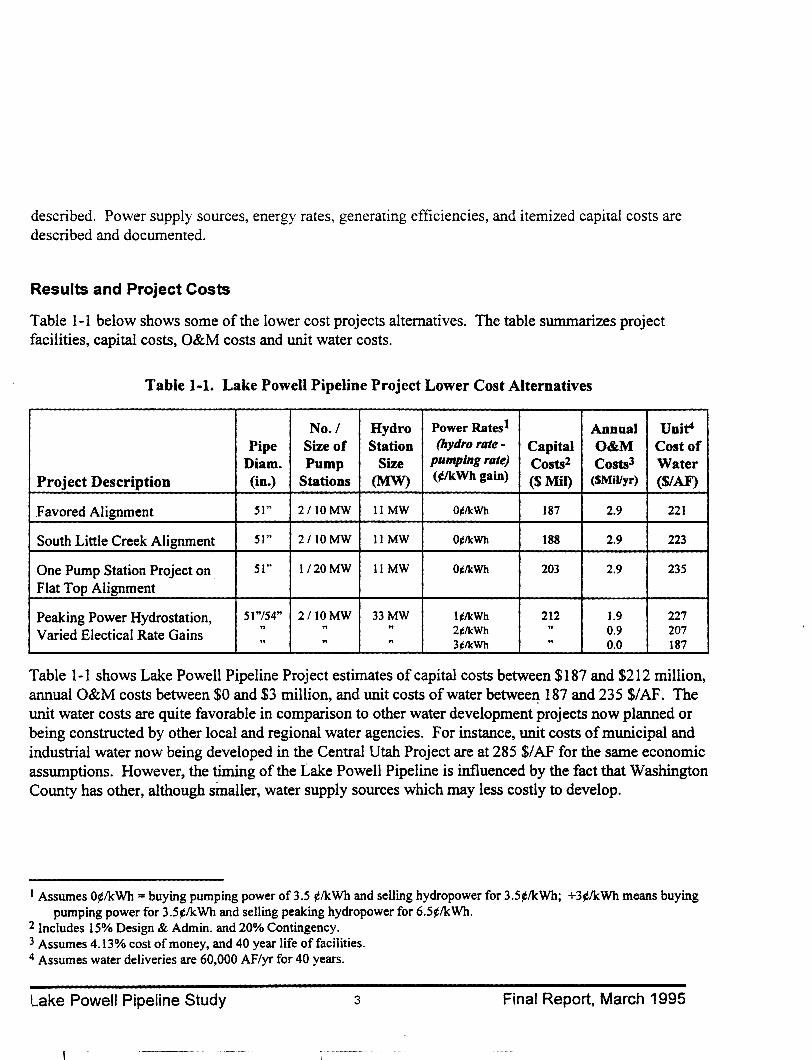
Table 1-1 below shows some of the lower cost projects alternatives. The table summarizes project facilities, capital costs, O&M costs and unit water costs.
Table 1-1. Lake Powell Pipeline Project Lower Cost Alternatives
No./ Hydro Power Rates 1 Annual Unit' Pipe Size of Station (hydro rate- Capital O&M Cost of
Diam. Pump Size pumping rate) Costs2 Costs3 Water Project Description (in.) Stations (MW) (¢/kWh gain) ($Mil) (SMillyr) (S/AF)
Favored Alignment 51" 2/10MW 11 MW 0¢/kWh 187 2.9 221
South Little Creek Alignment 51" 2/lOMW 11 MW 0¢/kWh 188 2.9 223
One Pump Station Project on 51" 1/20 MW IIMW 0¢/kWh 203 2.9 235
Flat Top Alignment
Peaking Power Hydrostation, 51 "/54" 21 lOMW 33MW 1¢/kWh 212 1.9 227
Varied Electical Rate Gains , , ,
2¢/kWh .. 0.9 207 .. , " 3¢/kWh " 0.0 187
Table 1-1 shows Lake Powell Pipeline Project estimates of capital costs between $187 and $212 million, annual O&M costs between $0 and $3 million, and unit costs of water betwee~ 187 and 235 $/AF. The unit water costs are quite favorable in comparison to other water development projects now planned or being constructed by other local and regional water agencies. For instance, unit costs of municipal and industrial water now being developed in the Central Utah Project are at 285 $/ AF for the same economic assumptions. However, the timing of the Lake Powell Pipeline is influenced by the fact that Washington County has other, although smaller, water supply sources which may less costly to develop.
1 Assumes 0¢/kWh =buying pumping power of3.5 ¢/kWh and selling hydropower for 3.5¢/kWh; +3¢/k:Wh means buying pumping power for 3.5¢/kWh and selling peaking hydropower for 6.5¢/kWh.
2 Includes IS% Design & Admin. and 20% Contingency. 3 Assumes 4.13% cost of money, and 40 year life of facilities. 4 Assumes water deliveries are 60,000 AF/yr for 40 years.
Lake Powell Pipeline Study 3
\
Final Report, March 1995
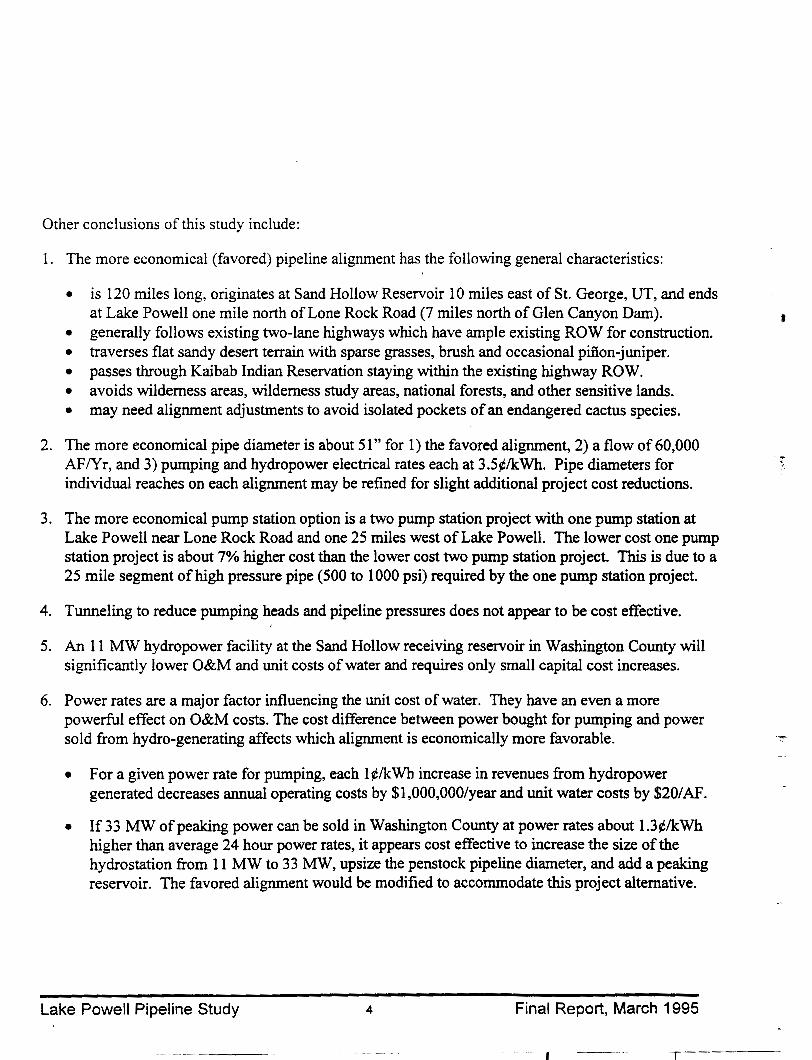
Other conclusions of this study include:
1. The more economical (favored) pipeline alignment has the following general characteristics:
• is 120 miles long, originates at Sand Hollow Reservoir 10 miles east of St. George, UT, and ends at Lake Powell one mile north of Lone Rock Road (7 miles north of Glen Canyon Dam).
• generally follows existing two-lane highways which have ample existing ROW for construction. • traverses flat sandy desert terrain with sparse grasses, brush and occasional pinon-juniper. • passes through Kaibab Indian Reservation staying within the existing highway ROW. • avoids wilderness areas, wilderness study areas, national forests, and other sensitive lands. • may need alignment adjustments to avoid isolated pockets of an endangered cactus species.
2. The more economical pipe diameter is about 51" for 1) the favored alignment, 2) a flow of 60,000 AF/Yr, and 3) pumping and hydropower electrical rates each at 3.5¢/kWh. Pipe diameters for individual reaches on each alignment may be refmed for slight additional project cost reductions.
3. The more economical pump station option is a two pump station project with one pump station at Lake Powell near Lone Rock Road and one 25 miles west of Lake Powell. The lower cost one pump station project is about 7% higher cost than the lower cost two pump station project. This is due to a 25 mile segment of high pressure pipe (500 to 1000 psi) required by the one pump station project.
4. Tunneling to reduce pumping heads and pipeline pressures does not appear to be cost effective.
5. An 11 MW hydropower facility at the Sand Hollow receiving reservoir in Washington County will significantly lower O&M and unit costs of water and requires only small capital cost increases.
6. Power rates are a major factor influencing the unit cost of water. They have an even a more powerful effect on O&M costs. The cost difference between power bought for pumping and power sold from hydro-generating affects which alignment is economically more favorable.
• For a given power rate for pumping, each 1 ¢/kWh increase in revenues from hydropower generated decreases annual operating costs by $1,000,000/year and unit water costs by $20/AF.
• If33 MW of peaking power can be sold in Washington County at power rates about 1.3¢/kWh higher than average 24 hour power rates, it appears cost effective to increase the size of the hydrostation from 11 MW to 33 MW, upsize the penstock pipeline diameter, and add a peaking reservoir. The favored alignment would be modified to accommodate this project alternative.
Lake Powell Pipeline Study 4 Final Report, March 1995
-- I
Appendix
The appendix includes project cost summary sheets for each of the project alternatives. A description of each component of the project cost summary sheet is presented followed by the summary sheets themselves. A copy of the US COE Hydrostation O&M costs planning curve is included, followed by a copy of the City of St. George's current electrical rates.
Lake Powell Pipeline Study 5 Final Report, March 1995
Section 2 - Introduction
Purpose and Scope
This study has been prepared for the Washington County Water Conservancy District (WCWCD) to evaluate the concept of delivering a portion of Utah's Upper Colorado River water from Lake Powell for use in Washington County, Utah. The concept is one of several projects identified by WCWCD to meet their anticipated water needs into the next century.
The scope of the study is to make a reconnaissance-level engineering investigation of project facilities, operations, and costs to enable WCWCD to determine whether a potentially feasible project exists. Facilities evaluated include alternative alignments for a 120-mile pipeline, alternative pump station sites and concepts, and alternative hydropower facilities. Operational concepts evaluated include alternative pipe diameters and pressures, pumping heads and power rates, hydropower operating concepts, and pressure control facilities. Project costs investigated include capital, operating and unit water costs.
Various legal, institutional and financial issues outside the scope of this study will also need to be addressed for the Lake Powell Pipeline project to go forward.
Report Outline
The foregoing section (Section 1) presented an executive summary of the feasibility study and its conclusions. The remainder of this report is organized as follows:
• Section 2- Introduction. Presents the purpose, scope and outline of the report. Gives the project background and setting, explains the basis of project need, overviews the project facilities and operations, and outlines the methodology used for evaluation of the project.
• Section 3 - Evaluation Criteria. Describes the hydraulic and the primary unit cost criteria utilized in evaluating various project concepts and alignments.
• Section 4- Pipeline Alignment Evaluations. Describes and evaluates alternative pipeline alignments relative to cost, environmental, soils, lands and right-of-way (ROW), and other issues.
• Section 5-Pump Stations. Describes and evaluates alternative locations and combinations of pumping stations. Describes the operating requirements and special facilities for each pump station.
• Section 6 - Hydrostation and Facilities. Describes alternative hydrostation sizes and their appurtenant facilities (i.e., regulating reservoir and upsized pipeline). Discusses their effects on project costs.
• Section 7- Results and Project Costs. Presents the results of the study with emphasis on the capital, operating and unit water costs for the various project alternatives.
Lake Powell Pipeline Study 6 Final Report, March 1995
-, 1 -
Background and Setting
Washington County has for some time been one of the fastest growing counties in the state ofUtah. In the last two years WCWCD has commissioned two studies in an attempt to quantify future population growth and the resultant municipal and industrial water demands. The Lake Powell Pipeline Study is an outgrowth of these past studies and is based on a projected future shortage of at least 60,000 AF/yr. of water. This quantity (60,000 AF/yr.), while having its basis in previous studies, was determined jointly by the Washington County Water Conservancy District and Utah State Division of Water Resources.
The Lake Powell Pipeline Project has been discussed in concept form for several years. It is included as a potential water supply project in the Purpose and Needs Study, now being finalized for WCWCD. In 1993 the Utah Department of Water Resources prepared an unpublished letter report identifying unit costs for the Lake Powell Pipeline project on a conceptual level. The project has also been identified by multiple agencies as a possible solution to water supply problems affecting the federal government and · various Indian tribes of southern Utah and northern Arizona.
Project Need
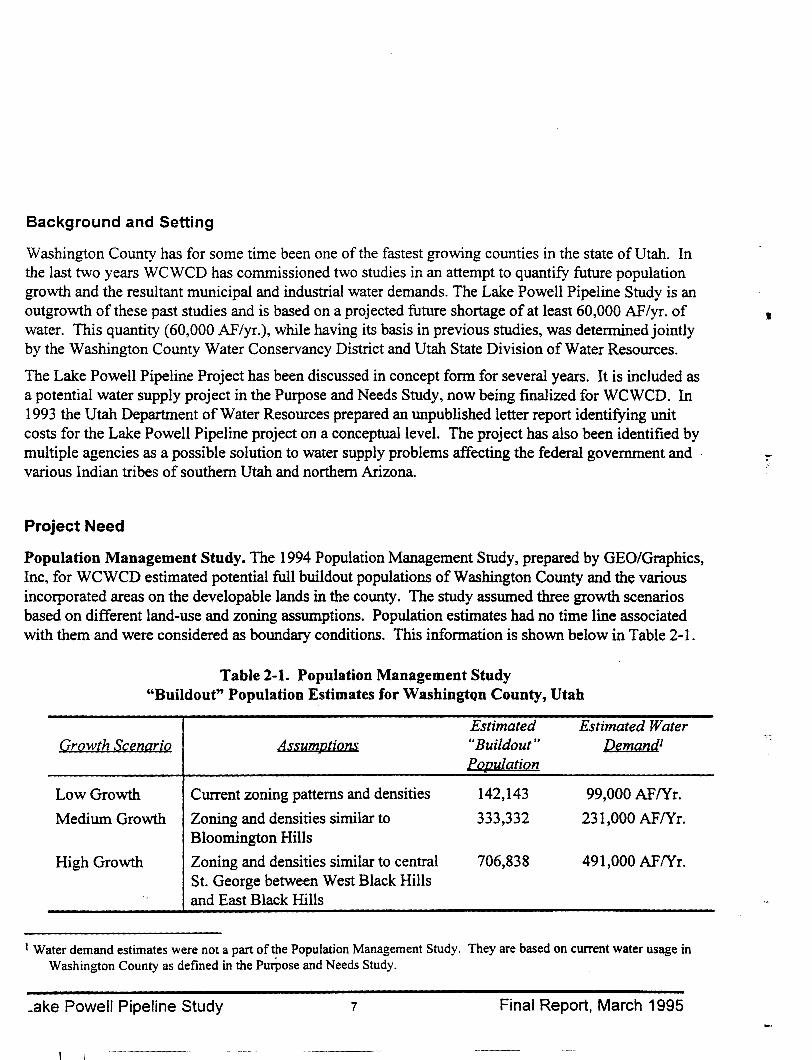
Population Management Study. The 1994 Population Management Study, prepared by GEO/Graphics, Inc, for WCWCD estimated potential full buildout populations of Washington County and the various incorporated areas on the developable lands in the county. The study assumed three growth scenarios based on different land-use and zoning assumptions. Population estimates had no time line associated with them and were considered as boundary conditions. This information is shown below in Table 2-1.
Table 2-1. Population Management Study "Buildout" Population Estimates for WashingtQn County, Utah
Estimated Estimated Water GrQw£h S.k.e.aa.riQ Assumplions "Buildout, Demaad1
Poi21J.latiQn
Low Growth Current zoning patterns and densities 142,143 99,000 AF/Yr.
Medium Growth Zoning and densities similar to 333,332 231,000 AF/Yr. Bloomington Hills
High Growth Zoning and densities similar to central 706,838 491,000 AF/Yr. St. George between West Black Hills and East Black Hills
1 Water demand estimates were not a part of the Population Management Study. They are based on current water usage in Washington County as defined in the Pur-Pose and Needs Study.
_ake Powell Pipeline Study 7 Final Report, March 1995
\
- J
I -----l
' ---1
300,000
250,000
- 200,000 .... ~ .......
LL c( -"0 c: C'iS
150,000
E Q)
c
100,000
50,000
::';_:~ hortl
FIGURE 2-1 PROJECTED WASHINGTON COUNTY M&l AND SECONDARY DEMANDS
Medium Growth Buildout Demand per Population Management Study <No Conservation) _ _ _ _ _ i 213,000
Medium Growth fNo Conservation)
MediJm Growth (With Conservation)
ouno Water ' ·v .. ,
Developed 16,000 AF/yr 1146,000
:;~gr~~t. Conversion 40,ooo AF /yr
A·::!'::::/.::::c:.:<:: .:.:i#.'£. :::.::: ::::::::<:.: .. :<;;,· •• :,.:·::::: : . . : : .•.. . : •..•..•. : · ·· · · ·'· ·.I 106 000 •
............ .;:·•:.···:·::.·':.·::.·:·:~::=;;;.~·:.·:··::.···:~···i'•i"'•'.·i······:·:·:::··:·::·:·.·:·:··.·.,..·i'·i:··:·;·······.······:··:···;·.·.·.;·.·.· .·.·.·.· .; ... · •i;·· .... · . . . . ' .· ... · ·i· ·.·. · .... ·.·1 84,000
-;,g;;;>::(;;;;';:i:';';;;;;:;.i:i;.;:.;::>ci:i:.:;.;:•;,:;:.:;•;:.(:.i;.c::;:•;;.;: ;.,:;:.;::.::; .. ;.;; .......... : , .. ·· .. ·••···· .·· .· · ... · ·. .· . . :./\ :; . ;: j 65,000
t6o.A#tyr·.·.·•
:f:(1j!f~liit; ~ ~ ~ ~ ~ ~ ~ ~ ~ ~ 2040
Year
. -)~Iii
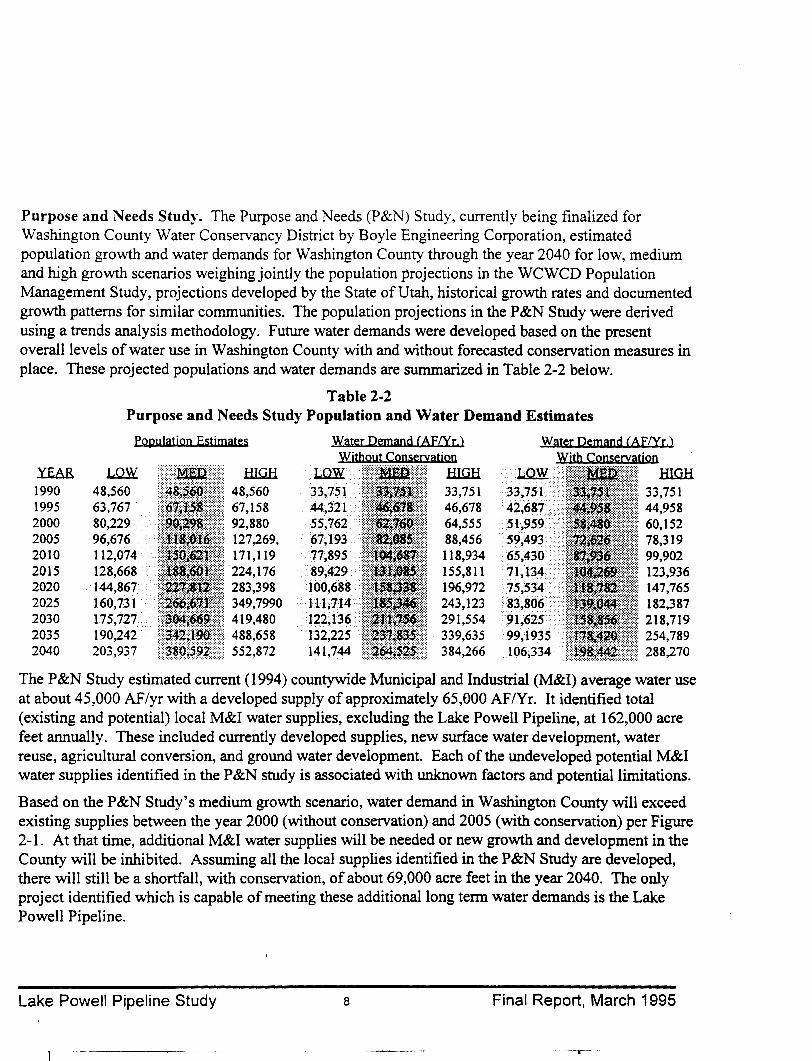
Purpose and Needs Study. The Purpose and Needs (P&N) Study, currently being finalized for Washington County Water Conservancy District by Boyle Engineering Corporation, estimated population growth and water demands for Washington County through the year 2040 for low, medium and high growth scenarios weighing jointly the population projections in the WCWCD Population Management Study, projections developed by the State of Utah, historical growth rates and documented growth patterns for similar communities. The population projections in the P&N Study were derived using a trends analysis methodology. Future water demands were developed based on the present overall levels of water use in Washington County with and without forecasted conservation measures in place. These projected populations and water demands are summarized in Table 2-2 below.
Table 2-2 Purpose and Needs Study Population and Water Demand Estimates
Population Estimates w~r O~mwul CAE!Yc,)
YEAR LmY: llliill 1990 48,560 48,560 33,751 33,751 .33,751··.·. 33,751 1995 63,767 67,158 44,321 46,678 42,687.·.····· 44,958 2000 80,229 92,880 55,762 64,555 51,959. 60,152 2005 96,676 127,269, 67,193 88,456 59,493 78,319 2010 112,074 171,119 77,895 118,934 65;430 99,902 2015 128,668 224,176 89,429 155,811 .71,134 •. · .. ·· 123,936 2020 144,867 283,398 ·wo,6ss 196,972 75,534······ 147,765 2025 160,731 349,7990 ·111,714 . 243,123 83,806./ . 182,387 2030 175,727 419,480 122,136 .• 291,554 91;62s·· 218,719 2035 190,242 488,658 .132,225 339,635 99,1935 254,789 2040 203,937 552,872 141,744 384,266 106,334 288,270
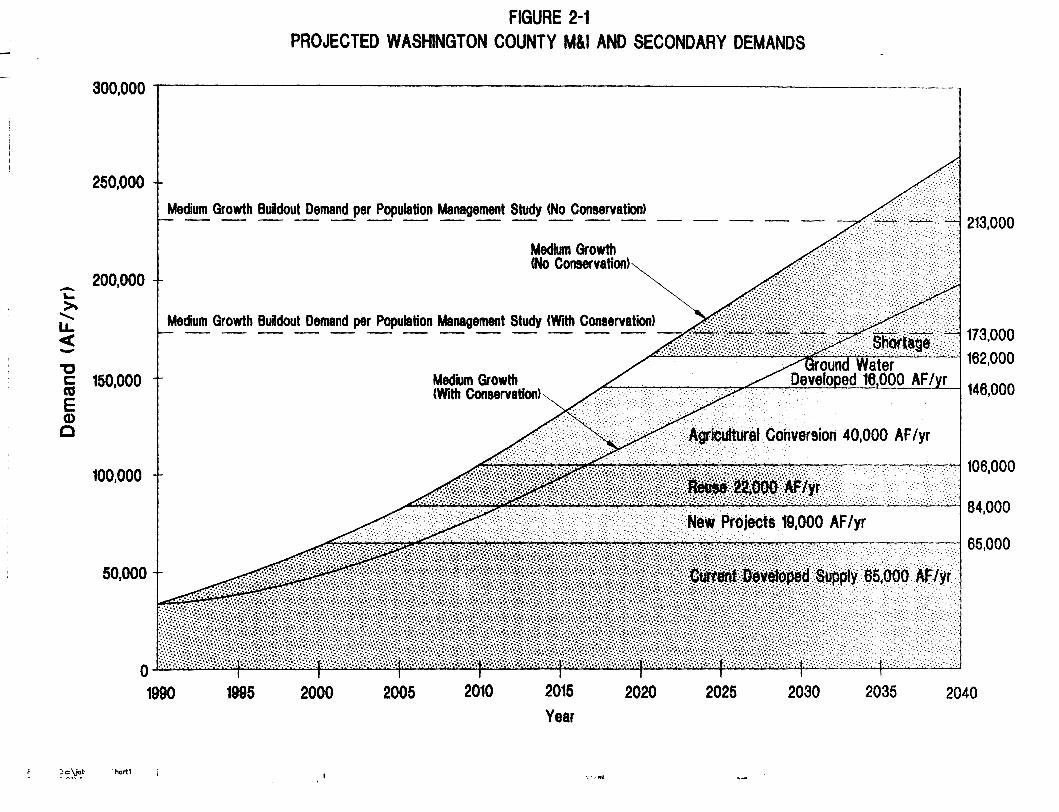
The P&N Study estimated current (1994) countywide Municipal and Industrial (M&I) average water use at about 45,000 AF/yr with a developed supply of approximately 65,000 AF/Yr. It identified total (existing and potential) local M&I water supplies, excluding the Lake Powell Pipeline, at 162,000 acre feet annually. These included currently developed supplies, new surface water development, water reuse, agricultural conversion, and ground water development. Each of the undeveloped potential M&I water supplies identified in the P&N study is associated with unknown factors and potential limitations.
Based on the P&N Study's medium growth scenario, water demand in Washington County will exceed existing supplies between the year 2000 (without conservation) and 2005 (with conservation) per Figure 2-1. At that time, additional M&I water supplies will be needed or new growth and development in the County will be inhibited. Assuming all the local supplies identified in the P&N Study are developed, there will still be a shortfall, with conservation, of about 69,000 acre feet in the year 2040. The only project identified which is capable of meeting these additional long term water demands is the Lake Powell Pipeline.
Lake Powell Pipeline Study 8 Final Report, March 1995
--y-
-
I
' ' <I ~~g z, ' I
I I
J I I
I I I
I I I
~-----
1MESQUITE
I I
' I
~"":~~ ~..::-.:::;::.-..:?.;:;_;_, ~.,.-,.;.... . ....-:-.. -_:-.t
.,-.~..::-~~~;.::]
~*~..:-~ ..... HEHRitvltl£ GARF1ELD ?,...::::_s::-.:;:1 ·----------1""·-·-·-·-·-·-·-·-·-·-·rwit-·-·-·-·-·-· ?-~
HOLLOW RES. &: HYDROSTATION 30f0'
PRESS. CONTROL. STA.
FIGURE 2-2. LAKE POWELL PIPELINE F ACILITES LOCATION MAP
!:• ... ..
:---..:~~ _:-., ,...;f::·~ v.>:::-.:.t .... , _ __..:1 ~
GLEN • ~rtJN (;.3
t«nONAl. RE:CRfAIION
AREA
SCALE: 1" = 100,000'
Overview of Lake Powell Pipeline Facilities
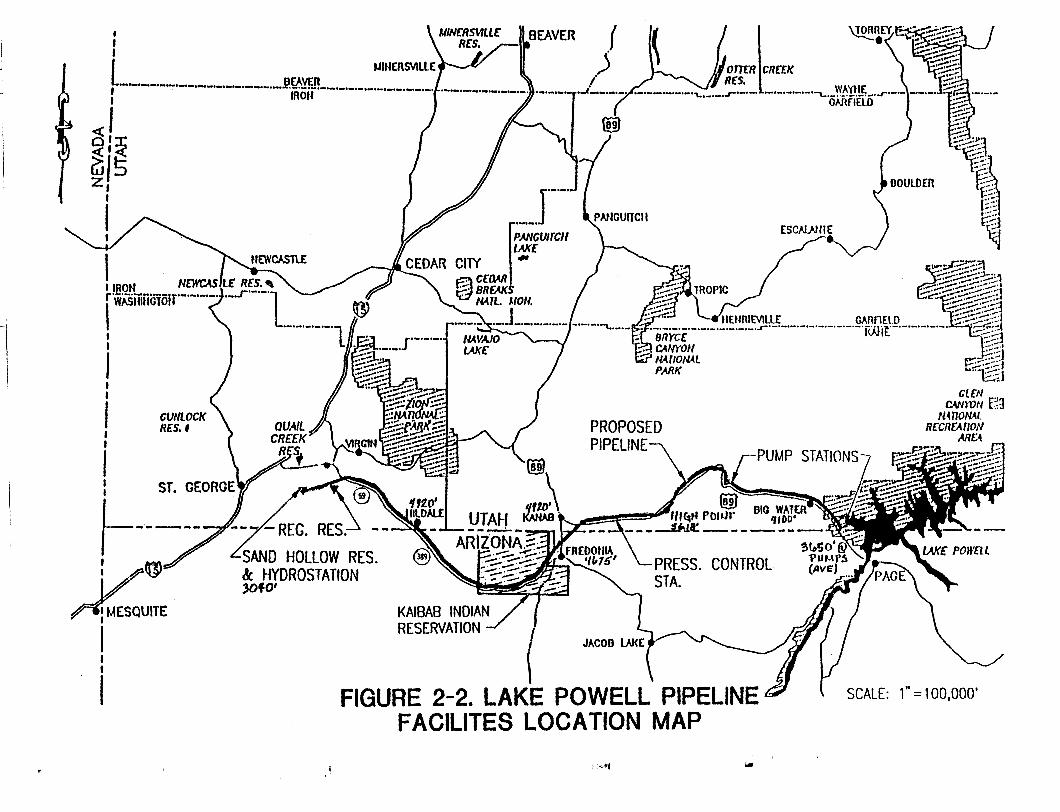
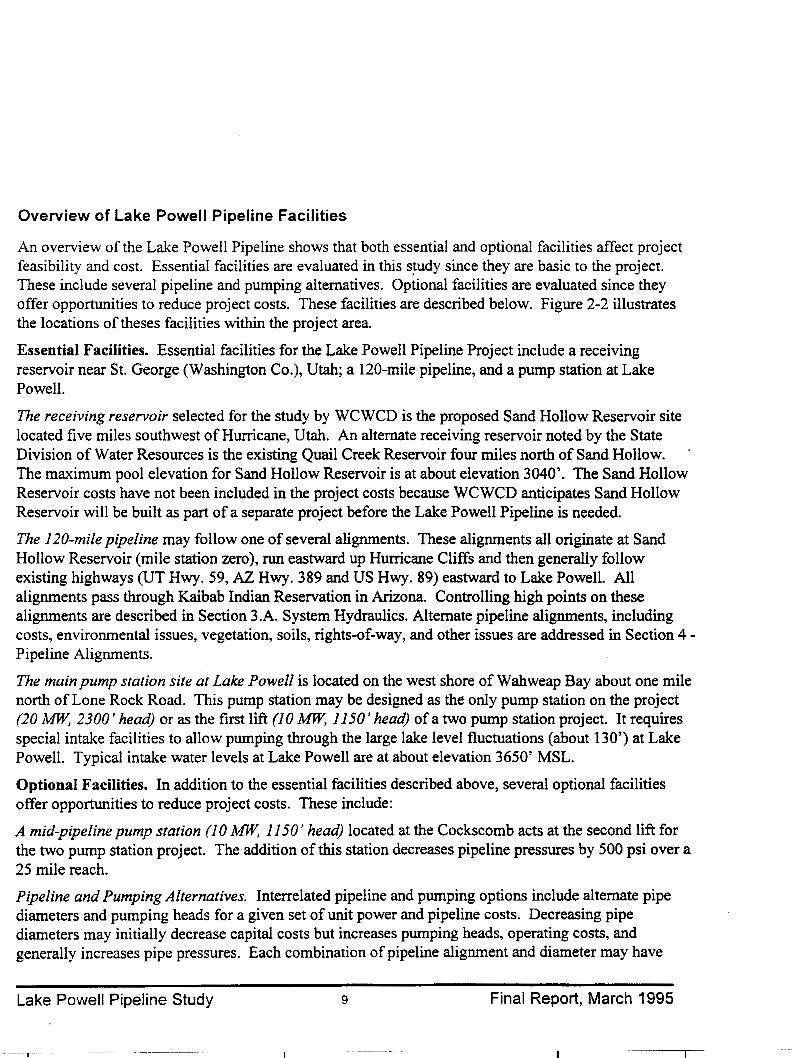
An overview of the Lake Powell Pipeline shows that both essential and optional facilities affect project feasibility and cost. Essential facilities are evaluated in this s~dy since they are basic to the project. These include several pipeline and pumping alternatives. Optional facilities are evaluated since they offer opportunities to reduce project costs. These facilities are described below. Figure 2-2 illustrates the locations of theses facilities within the project area.
Essential Facilities. Essential facilities for the Lake Powell Pipeline Project include a receiving reservoir near St. George (Washington Co.), Utah; a 120-mile pipeline, and a pump station at Lake Powell.
The receiving reservoir selected for the study by WCWCD is the proposed Sand Hollow Reservoir site located five miles southwest of Hurricane, Utah. An alternate receiving reservoir noted by the State Division of Water Resources is the existing Quail Creek Reservoir four miles north of Sand Hollow. The maximum pool elevation for Sand Hollow Reservoir is at about elevation 3040'. The Sand Hollow Reservoir costs have not been included in the project costs because WCWCD anticipates Sand Hollow Reservoir will be built as part of a separate project before the Lake Powell Pipeline is needed.
The 120-mile pipeline may follow one of several alignments. These alignments all originate at Sand Hollow Reservoir (mile station zero), run eastward up Hurricane Cliffs and then generally follow existing highways (UT Hwy. 59, AZ Hwy. 389 and US Hwy. 89) eastward to Lake Powell. All alignments pass through Kaibab Indian Reservation in Arizona. Controlling high points on these alignments are described in Section 3.A. System Hydraulics. Alternate pipeline alignments, including costs, environmental issues, vegetation, soils, rights-of-way, and other issues are addressed in Section 4-Pipeline Alignments.
The main pump station site at Lake Powell is located on the west shore ofWahweap Bay about one mile north of Lone Rock Road. This pump station may be designed as the only pump station on the project (20 MW, 2300' head) or as the first lift (1 0 MW, 1150' head) of a two pump station project. It requires special intake facilities to allow pumping through the large lake level fluctuations (about 130') at Lake Powell. Typical intake water levels at Lake Powell are at about elevation 3650' MSL.
Optional Facilities. In addition to the essential facilities described above, several optional facilities offer opportunities to reduce project costs. These include:
A mid-pipeline pump station (1 0 MW, 115 0' head) located at the Cockscomb acts at the second lift for the two pump station project. The addition of this station decreases pipeline pressures by 500 psi over a 25 mile reach.
Pipeline and Pumping Alternatives. Interrelated pipeline and pumping options include alternate pipe diameters and pumping heads for a given set of unit power and pipeline costs. Decreasing pipe diameters may initially decrease capital costs but increases pumping heads, operating costs, and generally increases pipe pressures. Each combination of pipeline alignment and diameter may have
Lake Powell Pipeline Study 9 Final Report, March 1995
--~-- r
I -
different high points that affect pumping head and pipe pressure, and therefore project costs. Thus, each pipeline and pumping alternative must be evaluated as a package with any associated optional facilities.
A hydroelectric generating facility (11 MW, 1900' head) operated 24 hours per day at the receiving reservoir may recapture part of pumping energy costs. This facility is the downstream control for the system. It controls the maximum pressure experienced by the "downstream" or western part of the pipeline by regulating the flow out of the pipeline.
An upsized hydrostation (33MW, 1850' head) and penstock with a regulating reservoir operated eight hours per day may recapture part or all the pumping energy costs by selling power at higher rates during peak demand periods. This facility regulates the flow both at the hydrostation and at the regulating reservoir. The regulating reservoir receives water over a 24 hour period and releases it over an 8 hour period when peaking power is in demand.
A pressure control station on the pipeline protects it from excessive pressures and velocities. It also allows for lower pressures in certain reaches of the pipeline.
Tunnels at the pipeline high points are evaluated for their potential to lower the pumping head and pipeline pressures and therefore life cycle costs.
Methodology
The methodology used to evaluate the engineering and cost issues for this project is as follows:
• identify evaluation criteria for project alternatives
• identify pipeline alignments, pump station options and hydrostation options
• develop hydraulics, project costs and environmental impacts of each alternative
• select and refine the more promising alternatives by iteratively performing the second and third steps above
The remainder of the report basically follows this format. Section 3, focuses on the evaluation criteria. Section 4 describes the alignment alternatives identified. Sections 5 and 6 address the hydraulic requirements, facility requirements, and costs (or revenues) of the pump stations and hydrostation facilities. Section 7 summaries the results and project costs of the various project alternatives described in section 4, 5 and 6, and presents conclusions and recommendations.
Lake Powell Pipeline Study 10 Final Report, March 1995
Section 3- Evaluation Criteria
The Lake Powell Pipeline Project was evaluated based on the criteria set forth in this section. System hydraulic criteria are set forth. Project costs, a major evaluation criteria, are documented. Interest rate, economic life, environmental, and geotechnical issues are also overviewed. This section is organized as follows:
A. System Hydraulics B. Unit Costs C. Interest Rates and Economic Life D. Environmental Considerations E. Geotechnical Considerations
A. System Hydraulics
Establishing proper system hydraulics is basic to developing not only a functionally practical system but also an appropriate project cost estimate. This subsection describes the hydraulic criteria and controls which affect the Lake Powell Pipeline Study. These include:
1. Hydraulic Criteria 2. Hydraulic Control Points
1. Hydraulic Criteria
Pipe Losses. The standard loss equation used for large diameter water supply pipelines is the Manning's equation with a loss coefficient ofn=O.OIIO per AWWA Manual of Practice (MOP-11). Two of the largest users of Colorado River water (Metropolitan Water District of Southern California and San Diego County Water Authority) have measured Manning's coefficients in their large diameter pipelines ( 48" to 1 08") consistently at n = 0.0105 with a blend of over 95% Colorado River water.! A Manning's "n" of 0.011 was selected for the study. The Manning's equation used is as follows:
1.49 Q = __ A Ro.67 8o.so
n where:
Q =flow in cubic feet per second (cfs) 1.49 = Manning's constant for English Units n ... Manning's loss coefficients (use 0.01 1)
A= Cross sectional area of the pipeline (in sq. ft) R =Hydraulic Radius of the Pipe= (pipe diam./4) S =slope of the hydraulic grade line
Minimum Pressures. The following minimum pressures have been used in this study:
• Minimum Pressure at High Points-I 0 psi • Minimum Pressure at Pump Station Intakes--4 psi
1 Interviews with SDCW A and MWD large diameter pipeline engineering staff.
Lake Powell Pipeline Study 11 Final Report, March 1995
~ _____j
I
,----1-f--
6000 1-
f--1-
5800 1-1----- ---f--
5600 1-1- r 1------ --1-1-
5400 1-
f--
5200 f----
1-
Esooo 1- l---f-.. -
- f-- .... """"' .. -···
0 4800 i= <1:
?~ 4600 ... J w
4400
4200
4000
.'1800
f--
v 1-1-
f---- f---- ------f--1-
f-· I f--f---- 1------f-- I 1-1- z -o ~ ~ I=
1- ~ 1--- (j) f-
11? f-- 0 1- a:: lL. 1- 0 ::J -->- -- (.)
1- :r: f-- w
j600
3400
1- z <5 f--
1- Ci: 1- a::
;:) 1- h.) :r 1-
3200 1-
f--
3000 =:'.!: j J_Q_1f)
-~N~D HOLLOW
I I I I U_l.J..I I I I I
0 10
nl£ NA~E:C:\JOBS\W01\POWELlJ PLOT DAT£:01\01\95
--~
1-- --f--
'. -- ~:;:;::,--
L.---- D ~-~-f-· -~ v ----~ ..... - 00 -1==-!==---- --· 1-. ID
v-- 1/ I ""' ~-----· l/) -- /'\. \ w
..:.J ....J
I' v "" ~""' I/_ 0 -a a::
~ ~ ~ 1-z
-·- ---1-(:,
~ -o
~ _,..,/ (.)
~ N
~- ../'-l/) w ---1-- --a:: lL.
w ;:) z :r (!l (j) 0 a_
---.-
--- --- ----- ~--
--- ---- ----_ ......................... , ... -···· "
;::-:-::.:·:· '"" ..... ..
~ f--) f--- -----
ID N ~ 0 .. ---0 v (.) z (j) ~ ~
~ _(.) tn-0
~
=i a_
----5 ~ ;:)
!Z ~ a_
0--- (j) -a_
z :r (!l-- 1-f--- f.-· ········ --~
I w
"•
--- _....... (j) 1-z
-- 0 a_
:r -(!l ZI ~::l .-< :ga.: 0~ _...__,
I·K
I I
I -0 z
~ : (j)
~ 0 < ~ ~- -~ -----1-ei: ~ z a:: ~ (!l
0 a_ (j) a::
~ B ~ 1----- f---- t-{3 -w
w a:: 1-(.) lL. .
--I-- -- _.__
&-- ....J ~ ~----<( ~
~ ~ i'i:-- -~ ---a_ lL.
t---- -----
v w > 0 (.) -
t-1-
~~ a_
['\
N: !\
~ ::::J
~:r: --1---- 1-- ----·- a::(!l <-o_:r:
---- f----· '-----1--·-'----1---· ---
------ ---· --··
LEGEND GROUND PROfllE ,6.1..0NG PIPEUNE
· -- ----- OPERATING HGL. 51" PIPE 60,000 M /Yr --!---- '---- f- ---
--·-- .. --OPERATING HGL. 51" PIPE 20.000 AF'/Yr -- ---- -- --- ------
II I I I.J II I I I ..,... I LU II II II I I I II I 1.11 I I I II I I I I 1. II I I I I I I I I LUl .. J~ll- LLLL Ul.J .. U.JJ.. II 1• I
90 lOll I I' 60 70 80 50 20 30 40 PIPE STATION (MILES)
WASHINGTON COUNTY
Water Conservancy District LAKE POWELL PIPELINE
TYPICAL HYDRAULIC PROFILE
I \ I
r I r . I, ~ I I
i• II
1•''1
'"
Ji
l 'li ,I
(I' I
J· ·I'
·, 1;
')1' I'
I I,
FIGURE 3-1
1-------
Minimum pressure criteria provides 25 feet of head in the pipe at pipeline high points. This keeps the pipe full and prevents vacuum pressures, excessive velocities and lining wear during flow changes. Minimum pump intake pressures assume vertical turbine pumps with 10' of water over pump bowls.
2. Hydraulic Control Points
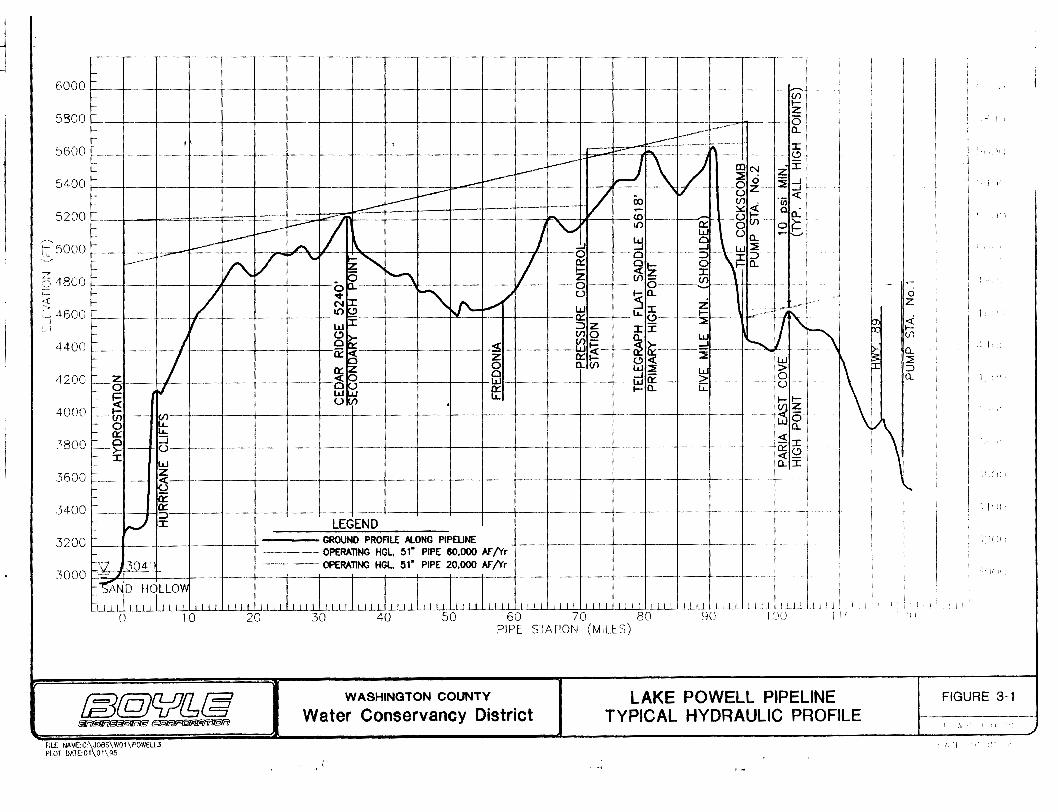
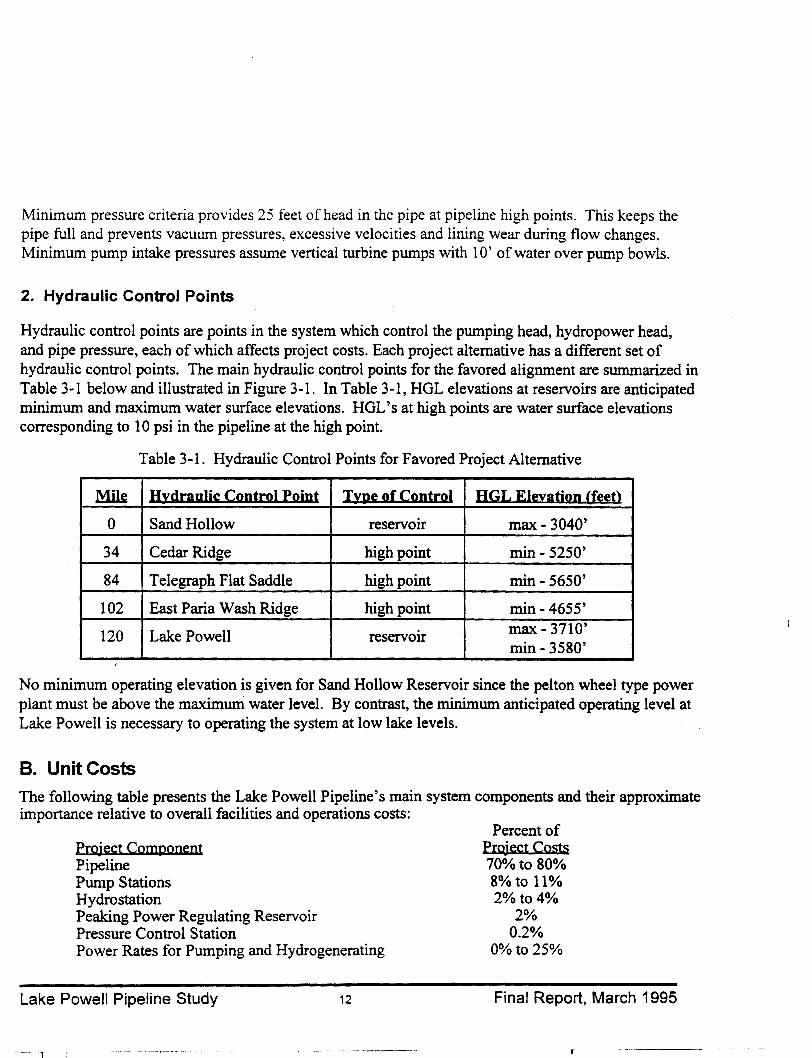
Hydraulic control points are points in the system which control the pumping head, hydropower head, and pipe pressure, each of which affects project costs. Each project alternative has a different set of hydraulic control points. The main hydraulic control points for the favored alignment are summarized in Table 3-1 below and illustrated in Figure 3-1. In Table 3-1, HGL elevations at reservoirs are anticipated minimum and maximum water surface elevations. HGL 's at high points are water surface elevations corresponding to 1 0 psi in the pipeline at the high point.
Table 3-1. Hydraulic Control Points for Favored Project Alternative
Mik IUdra:uli~ Cootml foiot TIP~ Q( Cootml HGL Elaatioo (fc~O
0 Sand Hollow reservoir max- 3040'
34 Cedar Ridge high point min- 5250'
84 Telegraph Flat Saddle high point min- 5650'
102 East Paria Wash Ridge highpoint min- 4655'
120 Lake Powell reservoir max- 3710' min- 3580'
..
No minimum operating elevation is given for Sand Hollow Reservoir since the pel ton wheel type power plant must be above the maximum water level. By contrast, the minimum anticipated operating level at Lake Powell is necessary to operating the system at low lake levels.
B. Unit Costs
The following table presents the Lake Powell Pipeline's main system components and their approximate importance relative to overall facilities and operations costs:
Project Component Pipeline Pump Stations Hydro station Peaking Power Regulating Reservoir Pressure Control Station Power Rates for Pumping and Hydrogenerating
Lake Powell Pipeline Study 12
Percent of Project Costs 70%to 80% 8%to 11% 2%to4%
2% 0.2%
Oo/oto 25%
Final Report, March 1995
Since unit pipe costs are by far the most important factor in project costs, they must be well founded. The basis for these unit costs is established in this section. The basis of the energy rates used in the study is also set forth. Other project components listed above have lump sum costs unique to this project and are set forth in Section 5 - Pump Stations and Section 6 - Hydrostation and Appurtenant Facilities.
1. Pipelines
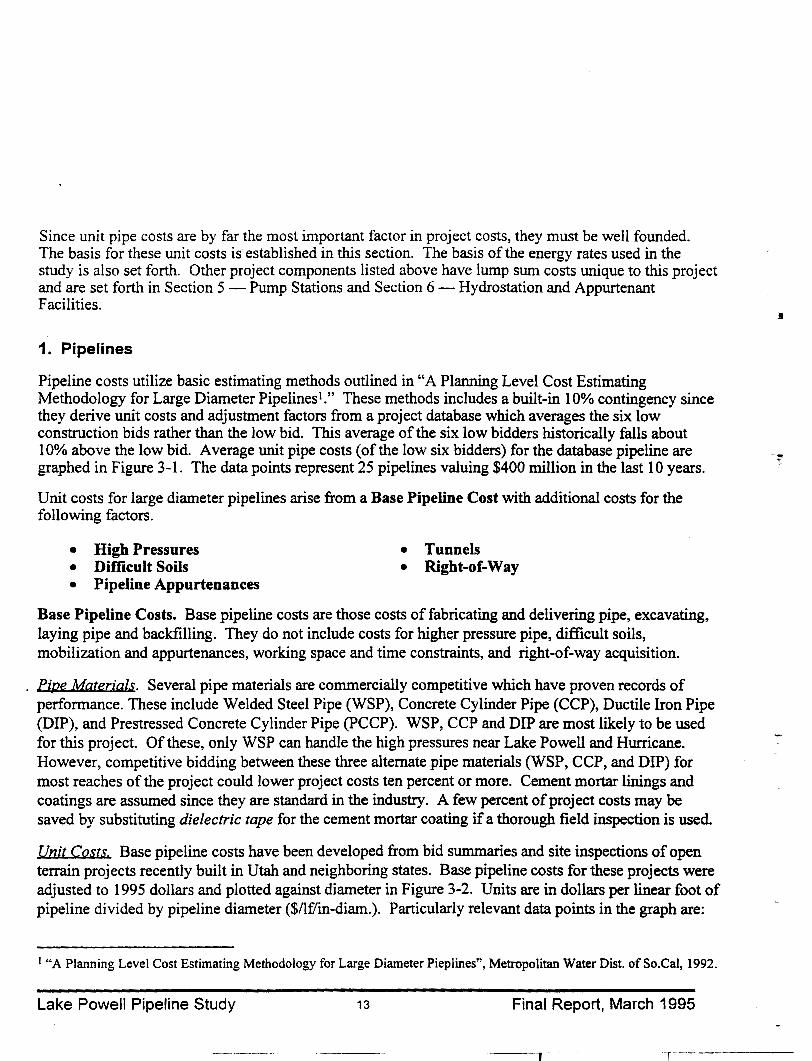
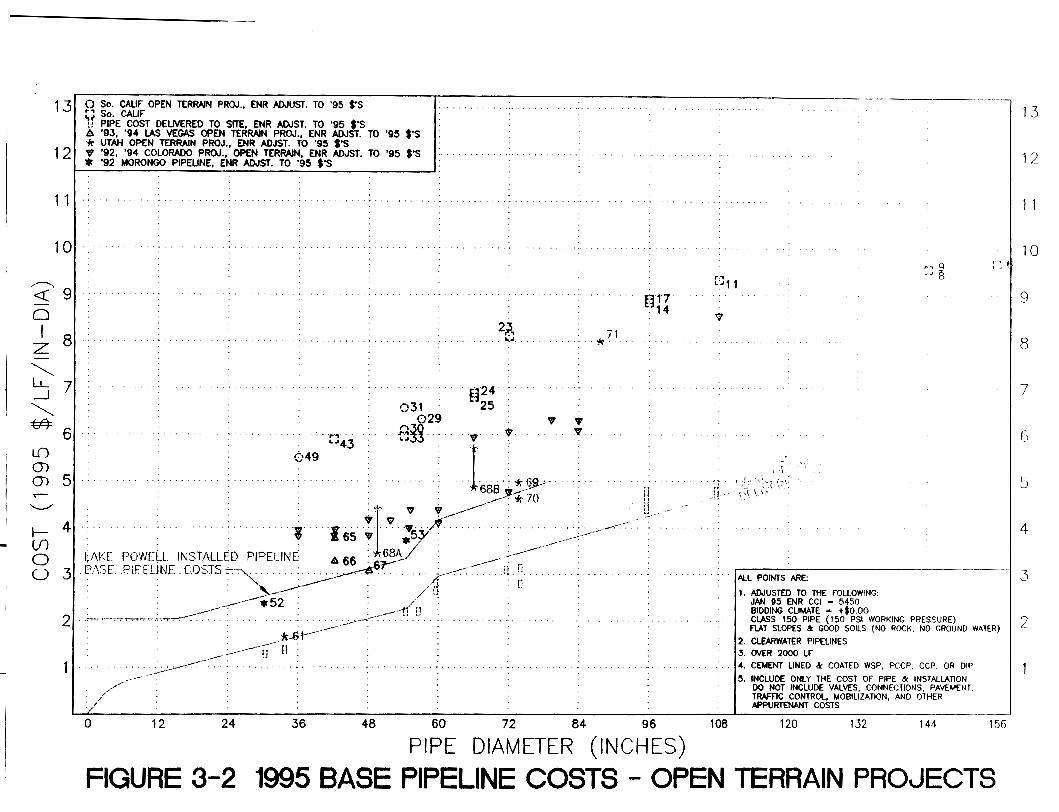
Pipeline costs utilize basic estimating methods outlined in "A Planning Level Cost Estimating Methodology for Large Diameter Pipelines'." These methods includes a built-in 10% contingency since they derive unit costs and adjustment factors from a project database which averages the six low construction bids rather than the low bid. This average of the six low bidders historically falls about 10% above the low bid. Average unit pipe costs (of the low six bidders) for the database pipeline are graphed in Figure 3-1. The data points represent 25 pipelines valuing $400 million in the last 10 years.
Unit costs for large diameter pipelines arise from a Base Pipeline Cost with additional costs for the following factors.
• High Pressures • Tunnels • Difficult Soils • Right-of-Way • Pipeline Appurtenances
Base Pipeline Costs. Base pipeline costs are those costs of fabricating and delivering pipe, excavating, laying pipe and backfilling. They do not include costs for higher pressure pipe, difficult soils, mobilization and appurtenances, working space and time constraints, and right-of-way acquisition.
Pipe Materials. Several pipe materials are commercially competitive which have proven records of performance. These include Welded Steel Pipe (WSP), Concrete Cylinder Pipe (CCP), Ductile Iron Pipe (DIP), and Prestressed Concrete Cylinder Pipe (PCCP). WSP, CCP and DIP are most likely to be used for this project. Of these, only WSP can handle the high pressures near Lake Powell and Hurricane. However, competitive bidding between these three alternate pipe materials (WSP, CCP, and DIP) for most reaches of the project could lower project costs ten percent or more. Cement mortar linings and coatings are assumed since they are standard in the industry. A few percent of project costs may be saved by substituting dielectric tape for the cement mortar coating if a thorough field inspection is used.
Unit Costs. Base pipeline costs have been developed from bid summaries and site inspections of open terrain projects recently built in Utah and neighboring states. Base pipeline costs for these projects were adjusted to 1995 dollars and plotted against diameter in Figure 3-2. Units are in dollars per linear foot of pipeline divided by pipeline diameter ($/lf/in-diam.). Particularly relevant data points in the graph are:
I "A Planning Level Cost Estimating Methodology for Large Diameter Pieplines", Metropolitan Water Dist. ofSo.Cal, 1992.
Lake Powell Pipeline Study 13 Final Report, March 1995
I
13
12
11
10
,.....---..... <( 9 0
~ 8 -~ LL 7 _j
~ ~6 L() (J)
(J) 5 .,...-~
f- 4 (f)
0 u 3
2
0 So. CAUF OPEN TERRAIN PROJ., ENR ADJUST. TO '95 $'S ~, So. CALIF ~f PIPE COST DELIVERED TO SITE, ENR ADJST. TO '95 $'S 1!:. '93, '94 LAS VEGAS OPEN TERRAIN PROJ., ENR ADJST. TO '95 $'S +;: UTAH OPEN TERRAIN PROJ., ENR AOJST. TO '95 $'S V '92, '94 COLORADO PROJ., OPEN TERRAIN, ENR ADJST. TO '95 $'S * '92 MORONGO PIPEUNE, ENR ADJST. TO '95 $'S
031
· .. 'r'1' .. r·~3>29 "'~ ' L.'..t . . ..
'f324 25
2~, . . L.:~.
v ' 'U-v
. . Las : ~ ffil-' · . I:A"[ POW< ., " -•I v v~: ____ Y*·?o
L"43 049
1:1:\SE PlP.F J~~-E INSTALL~D PIPE I . z 65 v . .,5. . . . - C.OSTS . JN£0 . * / · · ~
_- 1!:.66 :· 68AJ : 0 0
~;_; •• :---~fi1-- 0
,-
0
_.. . ......--- . . . . . -- .c---
o _,.~,~-r-~--- -_ ----------.52 0 : 0 0 ' ' ' {-"-.-:-: -- ' fj' n ---- 'i .• ..
..... . . /'' " '' 0 ' .:-:-·--~~---------r(l1 0 ••
: ---*-St·--"---------~--- r . _ __:..;_,,.-- .. --c-:--:' ' 1l t) 0 .. -· ---
I' /"
/',/
0 12 24 36 48 60 72
v _...,
0 *71
....--.-~·. ............
84
-n17 t:l14
H ~L
96
PIPE DIAMETER (INCHES)
~-,
L'"11
~
I 'i\
,, A ''"
: ~ f
,, r .l :·, . ~ ,,
fi
108
•,
ALL POINTS ARE:
1. ADJUSTED TO THE fOLLOWING: JAN 95 ENR CCI = 5450 BIDDING CLIMATE = +10.00 ClASS 15D PIPE (150 PSI WORKING PRESSURE) FV.T SLOPES &: GOOO SOILS (NO ROCK, NO GROUND WATER)
2. CLEARWATER PIPELINES
3. OVER 2000 Lf
4. CEMENT LINED &: COATED WSP, PCCP, CCP, OR OIP
5. INCLUDE ONLY THE COST Of PIPE & INSTALLATION 00 NOT INCLUDE VALVES, CONNECTIONS, PAVEMENT. TRAFfiC CONTROL, MOBILIZATION, AND OTHER APPURTENANT COSTS
120 132 144 156
FIGURE 3-2 1995 BASE PIPELINE COSTS - OPEN TERRAIN PROJECTS
13
1 2
11
10
I 9
8
7
G
s
4
3
2
Morongo Pipeline. The 70-mile long 30" and 54" pipeline was in sandy soils by a desert highway in southeast California, '92. WSP, CCP and DIP were bid as alternate materials (points 52 and 53). Of the projects in the database, this is the most similar to the Lake Powell Pipeline. Differences are that: I) Utah has lower labor rates than Morongo, 2) potential weather delay costs are slightly higher for the Lake Powell Pipeline than in the Morongo desert, 3) pipe shipping costs are higher for the Lake Powell Pipeline (shipping is seven hours from most plants while Morongo shipping was one hour). All factors considered, the Base Pipeline Cost data most appropriate for use in this study is the 70-mi/e 30" and 54" Morongo Pipeline (points 52 and 53 in Figure 3-2) with slight modifications as identified in the commentary on other database pipelines below. In using this data, it is assumed that an extensive price competition plan, similar to the one used on the Morongo project, will also be used on the Lake Powell Pipeline.
St. George and North Utah Pipelines. The 1980, 9-mile long 48" to 66" Quail Creek Pipeline mostly in lava rock, with high steel prices that year (phantom points above 68A and 68B). After adjusting for lava rock unit costs are closer (solid points 68A and 68B) to the Morongo Pipeline. The 1987, 1 0-mile long 30" to 36" St. George Pipeline (point 61) has unusually low installation costs. It is smaller diameter and not considered representative of the Lake Powell Pipeline costs. Since the St. George data is 8 to 15 years old the ENR Construction Cost Index inflation adjustments are very rough. In any case, the St. George pipeline data straddles the Base Pipeline Costs line in Figure 3-2. Two 1-mile long segments of the 75" Ogden Canyon Pipeline (Northern Utah) built~ above ground wl a mortar cap in 1993 and 1994 (points 69 and 70) are the basis of the upper end of the Base Pipeline Costs line.
Las Vegas Pipelines. Three recent (1993 and 1994) 2-mile long 30" to 48" projects in sandy soils near Las Vegas (points 65 to 67) have similar soils, drier weather, smaller diameters, and shorter lengths than the Lake Powell Pipeline. These unit costs are likely to be slightly higher than the Lake Powell Pipeline project since Las Vegas has higher labor rates (installation costs). The 48" pipeline (1994) is considered representative of the Lake Powell Pipeline unit costs for the same diameters and is the basis of the Base Pipeline Costs line for that pipe diameter in Figure 3-2. This puts unit costs for a 51-inch pipeline at about 3. 2 $/lf/in-diam. for the Lake Powell Pipeline.
Colorado Pipelines and Other Data. Three recent (1992 and 1994) 10-mile long 36" to 84" open terrain projects in Longmont and Durango, CO, '92 to '94 (blue inverted triangle points). These are anticipated to have higher unit costs due several factors including cement slurry bedding (adds 10%), some groundwater, and slightly higher labor rates. The other data is higher cost open terrain pipelines primarily in California with one (point 71) in Utah County, UT.
High Pressures. At pressures under 150 psi, pipe cylinders are typically at minimum thickness. At pressures over 150 psi, pipe cylinders begin to require strengthening. This is normally accomplished by thickening the cylinder or adding reinforcing wires. When pressures exceed about 350 psi WSP becomes
Lake Powell Pipeline Study 14 Final Report, March 1995
the only practical pipe material to use and price competition drops off while cylinder thickness continues to increase. For pressures over 350 psi, high strength steels are used in WSP to minimize cylinder thickness and life cycle costs. These steels are more flexible and require flexible linings and coatings (such as epoxys and dielectric tapes) rather than cement mortar.
For these reasons, there is a slight and incremental adjustment in unit costs as pressures rise from 150 to 350 psi. As pressures exceed 350 psi, unit costs increase more rapidly with pressure increases. The following equation is developed from the bids, unit prices and pressure classes in the Morongo Pipeline, bids for several other projects, and published pressure-cost relationships1:
[Pressure Class - 150 psi] x [Diam. (in)]"'0.5 For pressures 150 to 350 psi, Add** =
1600
[Pressure Class- 250 psi] x [Diam. (in)]/\0.5 For pressures over 350 psi, Add** =
800
***Unit Costs in dollars per linear foot per diameter inch ($/lflin-diam)
Difficult Soils. Added costs for difficult soils are derived from a compilation of several bid summaries, site visits to those projects, and several cost estimating manuals (Means, Richardson, McMillen, and others) which estimate unit earthwork costs for pipeline construction. Difficult soils have been classified into four general categories with add-ons to base pipeline unit costs as follows:
General Soil Classification
• Good Soils • Marginally Rippable Soils • Rock Requiring Blasting • High Groundwater
Add-On (Saf/jn-diam)
+$0.00 +$0.30 +$0.80 +$0.30
Pipeline Appurtenances. Appurtenance costs include paving, traffic control, air valves, blow-offs, cathodic protection, mobilization, hydroseeding, and other functions normally associated with pipeline construction. For projects similar to the Lake Powell Pipeline, appurtenance costs typically represent about five percent of the overall pipeline construction cost2
I "A Planning Level Cost Estimating Methodology for Large Diameter Pipelines", Metropolitan Water Dist. ofSo.Cal, 1992. 2 Ibid.
Lake Powell Pipeline Study 15 Final Report, March 1995
Tunnels. A completed pipeline in a tunnel is about three times more expensive per foot than an equal diameter pipeline in open terrain1• This unit cost assumes relatively easy tunneling conditions. For extensive groundwater, hard rock, or mixed face (mixed soft and hard materials at the tunnel face) throughout the tunneling, actual unit prices will be higher. Based on this data, unit costs for tunneled pipelines were set at 12 $/lf/in-diam. for soft soils, no groundwater, and diameters 48" to 54"; and 20$/lf/in-diam. for hard rock and diameters at about 70".
Right-of-Way. Project costs associated with rights-of-way are of two types: 1) impacts of ROW width on construction costs, and 2) cost of acquiring new ROW. These are described below.
ROW Widths Impact Costs. Where insufficient working room (right-of-way width) is available, construction operations are congested, daily pipe installation decreases, and bids increase. For pipe diameters of 48" to 66", a construction width of 70 to 100 feet is desirable to minimize construction costs in open terrain. Construction widths less than 70 feet may begin to affect construction costs. Construction widths less than 25 feet typically increase costs by 20 percent or more, particularly where traffic and other factors congest the working area.
ROW Acquisition Costs. Since right-of-way acquisition costs are low in the study area, it is very cost effective to provide an unencumbered right-of-way width of at least 70 feet. Where the pipeline follows existing highways (except Utah Hwy 59), 70 feet of unencumbered right-of-way is already available between the roadway pavement and fenceline. Where the pipeline diverges from established rights-ofway, unit costs for right-of-way have been assumed at $2,000 per acre with a 100 foot construction rightof-way ($4.60 per linear foot). Since the construction ROW cost of departing from existing highways is very small, the pdmary ROW considerations are environmental and institutional (i.e., acquisition, permitting and mitigation in Indian, private and public land).
2. Power Rates
Power rates are of two types: 1) the cost of purchasing power for the pump stations in Kane County 2) the revenue from selling power from the hydrostation in Washington County.
Power Rates for Pump Stations. Garkane Power is the largest supplier of power in Kane County where both pump stations for the favored alternative are located. They sell wholesale power for loads of 10MW to 20MW.at a rate of3.5 to 4.0 ¢/kWh depending on peaking and other factors. Both pump
I "Water Systems Construction Cost Estimating", City of San Diego Water Masterplan, 1991. & "A Planning Level Cost Estimating Method for Large Diameter Pipelines", Metropolitan Water Dist. of So. Cal., 1992.
Lake Powell Pipeline Study 16 Final Report, March 1995
. J
stations are assumed to operate continuously. Consequently the power rate used for purchasing power for both pump stations is 3.5 ¢/kWh.
Power Rates from Hydrostation. Standard power rates were obtained from the City of St. George which is the main power supplier in Washington County. These rates have been included in the Appendix. Their energy plus demand charges add up to a power rate of 3.4 to 3.6 ¢/kWh with no peaking factor charges. The City of St. George purchases power for about 0.1 to 0.5 cents per kilowatthour less than they sell it to their wholesale customers. However, there is a markup for users which have high peaking factors on their loads. When these markups are accounted for, it is reasonable to assume that power generated at Sand Hollow can be sold at the same wholesale power rates (3.5 cents/kWh) currently published by the City of St. George. Thus, 3.5 ¢/kWh was used for power revenues generated at Sand Hollow.
Peaking Power Rates for Hydrostation. Although peaking rates from power generation are not included in the scope of this study, the impacts of different power rates were evaluated to determine their impact on project costs. This evaluation is discussed in the Section 7 - Results and Project Costs.
C. Interest Rates and Economic Life
Interest Rates. Interest rates used for planning studies vary significantly for water agencies in the southwestern U.S. The State of Utah currently uses a 4.13% interest rate for economic evaluation of capital improvement projects. Southern California agencies (SDCW A and MWD) currently use 6.5% to 7.0%. Central Utah WCD is currently using 3.22% for their CUP water projects. This wide range in interest rates arises from a number of factors which will not be addressed herein. However, unit water costs vary significantly with this assumption. For comparing the Lake Powell Pipeline costs with those of other projects the interest rate assumptions for each project must be weighed in.
Based on the State of Utah's formula for economic evaluation of capital improvement projects, a 4.13% interest rate is used for annualizing capital costs on this study.
Economic Life. The State ofUtah's planning level assumptions for the economic life ofCIP facilities were the primary basis of selecting the economic life of the Lake Powell Pipeline Project. The State generally uses an economic life for pipelines and pump stations of 50 and 20 years respectively. Since over 80% of the capital costs of this project arise from pipelines and less the 20% from pump stations and hydrostations, the weighted economic life of this project is about 46 years. However, for simplicity a 40 year life was used as an average for all project facilities. This is about 4% more conservative than the 46 year life.
Lake Powell Pipeline Study 17 Final Report, March 1995
D. Environmental Considerations
Since the project site appears relatively environmentally benign (the vast majority of the project is within existing desert highway rights of way), detailed environmental evaluations were not included in the scope of this study. However, some information has become available during the course of the study which is overviewed in the following paragraphs and discussed throughout the report. This information was weighed in selecting a favored alignment where alternative alignments had similar costs. Environmental considerations include land use designations, vegetation, endangered species pointed out by BLM representatives, and potential agency involvement required for the project to move forward.
Land Use Designations. The project facilities traverse the following types of designated land uses:
BLM Administered Public Lands, State (UT & AZ) Lands and Private Lands. The vast majority of the pipeline alignments traverse BLM administered, state and private lands. These land use designations are considered low impact.
Indian Reservation Land. All of the alternate alignments pass through the Kaibab Indian Reservation. However, the favored alignment has less impact since it stays within the existing AZ Hwy 389 ROW where it crosses the Kaibab Indian Reservation. This land use designation is considered to have a moderate impact, except where the pipeline stays in existing ROW which is considered to have a moderately low impact.
Wilderness Areas, Wilderness Study Areas, National Forests, Parks and Monuments. None of the alternate alignments pass through Wilderness Areas, Wilderness Study Areas, National Forests, Parks and Monuments. These areas are considered to have high environmental impact.
Glen Canyon National Recreation Area. Both Lake Powell Pump Station alternates require construction within this recreation area. This is not deemed to be a project limiting constraint (low impact), however, some measures may be required to provide facilities which are aesthetically compatible with the recreation area
Mapping reviewed as part of this study includes Arizona Strip District Maps (Figure 4-3) and BLM Surface Management Status Maps ('83-Kanab, 87'-Smoky Mt., and '83-St. George)
Cultural Resources and Threatened and Endangered Species. Any of the pipeline alignments not currently used for farming, highway, or other improvements may need to be surveyed for cultural resources and threatened and endangered species prior to design and construction.
Endangered Cactus Species. The BLM has identified one listed endangered species in the project area lying northwest of Fredonia. Although the favored alignment passes through this area, the BLM has indicated the cactus species (Pedio Cactus Sileri, or sometimes called Siler Pincushion Cactus) grows in
Lake Powell Pipeline Study 18 Final Report, March 1995
\ I
isolated pockets and they do not anticipate a problem circumventing these small pockets with minor alignment changes. No other endangered species or cultural resources have been identified within the project area.
Agency Involvement for Environmental Issues. The following agency involvement and permitting may be needed for development of this project.
•
• • •
Agency
Utah Department ofNatural Resources
US Army Corps of Engineers US Fish and Wildlife Service State Historic Preservation Officer
E. Geotechnical Considerations
Involvement
- Water Rights - Wildlife Resources for T &E species - 404 permitting if riparian wetlands are affected - Section 7 Consultations for T &E species - Cultural Resources
Detailed geotechnical investigations were not a part of this study. However, based on a review of the mapping and a site visit (traversing the main alignments), the primary geotechnical issues on the projects appear to be the cost impacts of surface rock formations, faulting, and potentially expansive soils.
Cost Impacts. The additional costs associated with blasting, excavating and backfilling a trench in rock are identified in the forgoing "Unit Costs" subsection. The cost impacts of possible expansive soils or faults along the alignments are anticipated to be very minor.
Faulting. Although there are faults crossing the alignment, it is common practice to design large diameter pipelines across major faults with essentially no cost impact to the project.
Potentially Expansive Soils. The mapping identifies potentially expansive soils in several short reaches of the project. Expansive soils have been.mapped over about 1 mile of the favored alignment (per Utah Geologic and Mineral Survey, Geologic Hazards Map, Bulletin 124, 1989). Although it is not within the scope of this report to perform detailed investigations of these issues, severely expansive soils may require pipeline realignments or additional maintenance costs if differential settlement along the pipeline is large.
Geologic Mapping. The geologic mapping reviewed as part of this study includes:
• Utah Geological and Mineral Survey, Map ofWashington County, Bulletin 70, '1970. • Utah Geological and Mineral Survey, Map ofKane county, Map 121, Bulletin 124, 1989.
Lake Powell Pipeline Study 19 Final Report, March 1995
Section 4 - Pipeline Alignment Evaluations
This section describes several pipeline alignments alternatives which were identified and evaluated for cost reduction opportunities. A preliminary pipeline alignment was identified in 1993 by the Utah Division of Water Resources (UD WR). This alignment remained within existing road right of way to minimize environmental impacts. Alternate alignments were identified in a kickoff meeting for this study with WCWCD, UDWR, Boyle Engineering Corporation and Alpha Engineering participating. Meeting attendees then drove the project site, viewed most of the favored alignment and portions ofthe alternate alignments. Soils, vegetation, and topography were noted and photographed. The Bureau of Land Management (BLM) participated in the site visit and later identified one area where an endangered plant species is located along the favored alignment.
The alignments identified were then researched and analyzed for capital costs, O&M costs, and more generally for potential environmental impacts and geotechnical issues (geotechnical mapping was not included in the report due to its volume). Land use was also checked for each alignment (this mapping is included at the end of the section as Figure 4-3).
After the alignment alternatives were evaluated (in conjunction with their pumping and hydrostation facilities), a favored alignment was selected. This favored alignment is described at the end of this section. This and the other alignments are shown in plan (Figure 4-1) and profile (Figure 4-2) at the end of this section. Photos of representative terrain on these alignments are a part of Figure 4-1. Alignments described in this section include:
A. Preliminary Alignment B. Alignment Shortening Alternatives
• Lost Spring Wash • Five Mile Mountain • The Cockscomb
C. Alternate Alignments • Sand Hollow to Cedar Ridge • Pipe Spring to Lost Spring Gap • Paria East Cove to Lake Powell • Pump Station Intake Alternates • Tunnel Alternates
D. Favored Alignment
A. Preliminary Alignment
The preliminary alignment (shown in black in Figure 4-1) was identified by UDWR in 1993. It originates at Quail Creek Reservoir, follows State Hwy 59 (UT) and State Hwy 389 (AZ) from Hurricane, UT to Fredonia, AZ, then north to Kanab and east to Lone Rock Road on US Hwy 89, and ends at Lone Rock Road and Lake Powell.
Lake Powell Pipeline Study 20 Final Report, March 1995
1
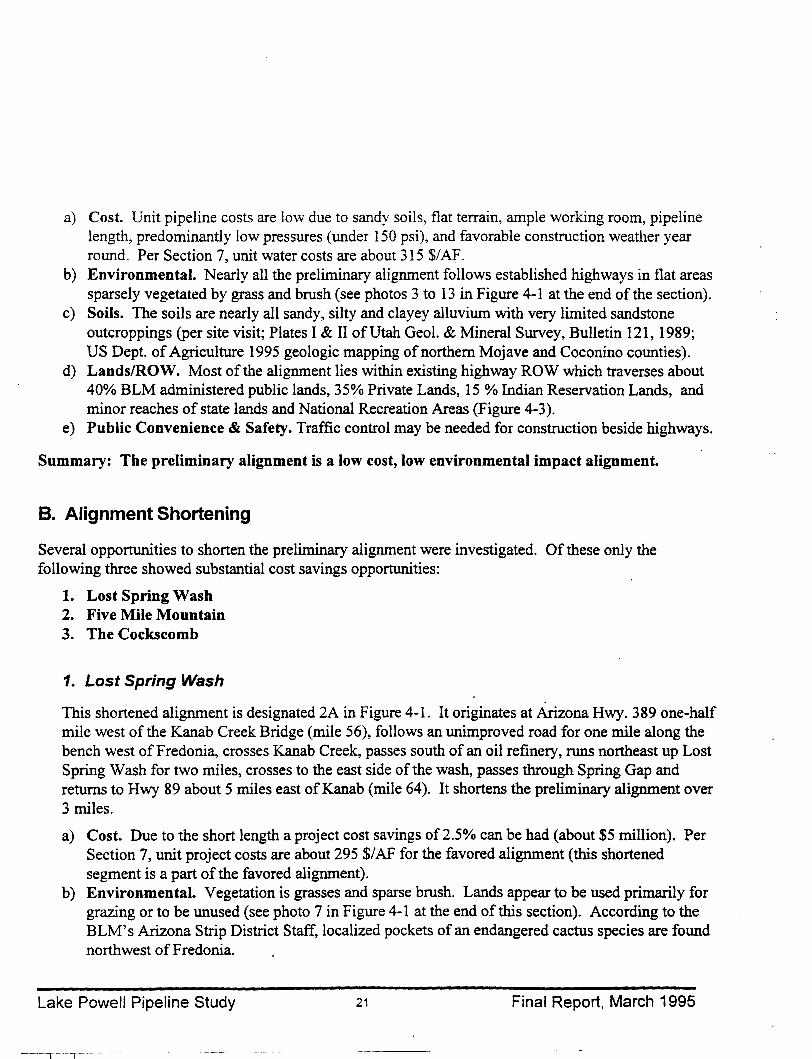
a) Cost. Unit pipeline costs are low due to sandy soils, flat terrain, ample working room, pipeline length, predominantly low pressures (under 150 psi), and favorable construction weather year round. Per Section 7, unit water costs are about 315 $/AF.
b) Environmental. Nearly all the preliminary alignment follows established highways in flat areas sparsely vegetated by grass and brush (see photos 3 to 13 in Figure 4-1 at the end of the section).
c) Soils. The soils are nearly all sandy, silty and clayey alluvium with very limited sandstone outcroppings (per site visit; Plates I & II ofUtah Geol. & Mineral Survey, Bulletin 121, 1989; US Dept. of Agriculture 1995 geologic mapping of northern Mojave and Coconino counties).
d) Lands/ROW. Most of the alignment lies within existing highway ROW which traverses about 40% BLM administered public lands, 35% Private Lands, 15% Indian Reservation Lands, and minor reaches of state lands and National Recreation Areas (Figure 4-3).
e) Public Convenience & Safety. Traffic control may be needed for construction beside highways.
Summary: The preliminary alignment is a low cost, low environmental impact alignment.
B. Alignment Shortening
Several opportunities to shorten the preliminary alignment were investigated. Ofthese only the following three showed substantial cost savings opportunities:
1. Lost Spring Wash 2. Five Mile Mountain 3. The Cockscomb
1. Lost Spring Wash
This shortened alignment is designated 2A in Figure 4-1. It originates at Arizona Hwy. 389 one-half mile west of the Kanab Creek Bridge (mile 56), follows an unimproved road for one mile along the bench west of Fredonia, crosses Kanab Creek, passes south of an oil refmery, runs northeast up Lost Spring Wash for two miles, crosses to the east side of the wash, passes through Spring Gap and returns to Hwy 89 about 5 miles east of Kanab (mile 64). It shortens the preliminary alignment over 3 miles.
a) Cost. Due to the short length a project cost savings of2.5% can be had (about $5 million). Per Section 7, unit project costs are about 295 $/AF for the favored alignment (this shortened segment is a part of the favored alignment).
b) Environ-mental. Vegetation is grasses and sparse brush. Lands appear to be used primarily for grazing or to be unused (see photo 7 in Figure 4-1 at the end ofthis section). According to the BLM' s Arizona Strip District Staff, localized pockets of an endangered cactus species are found northwest of Fredonia.
Lake Powell Pipeline Study 21 Final Report, March 1995
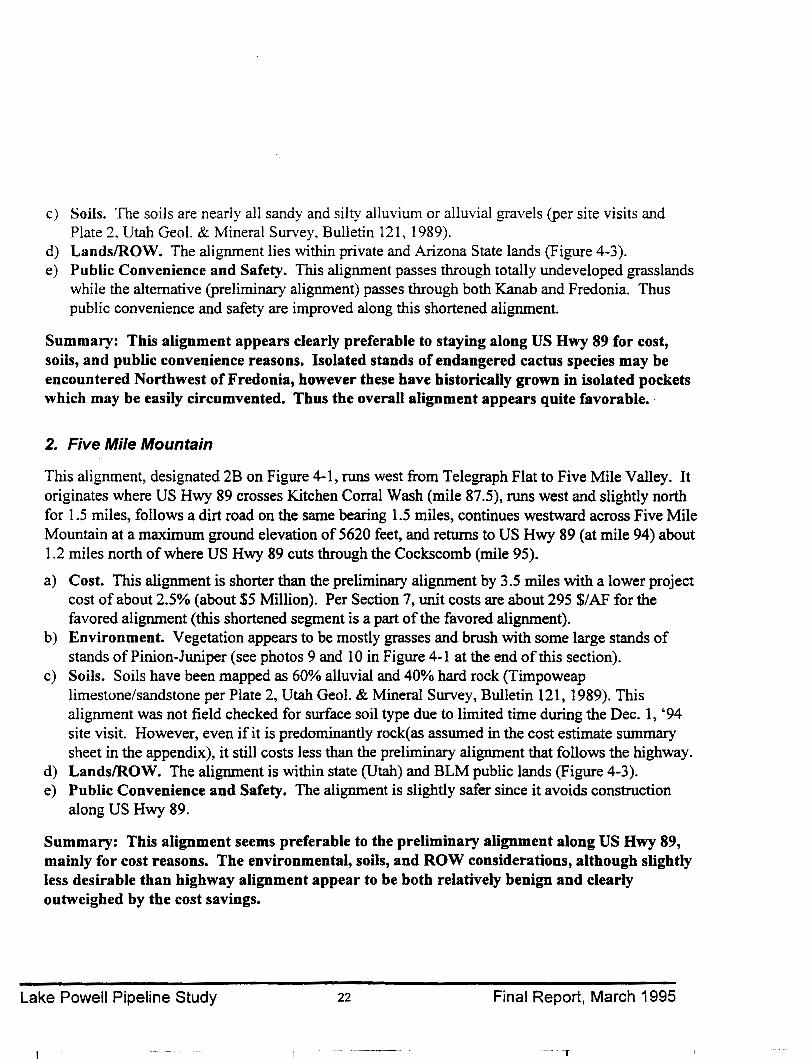
c) Soils. The soils are nearly all sandy and silty alluvium or alluvial gravels (per site visits and Plate 2, Utah Geol. & Mineral Survey, Bulletin 121, 1989).
d) Lands/ROW. The alignment lies within private and Arizona State lands (Figure 4-3). e) Public Convenience and Safety. This alignment passes through totally undeveloped grasslands
while the alternative (preliminary alignment) passes through both Kanab and Fredonia. Thus public convenience and safety are improved along this shortened alignment.
Summary: This alignment appears clearly preferable to staying along US Hwy 89 for cost, soils, and public convenience reasons. Isolated stands of endangered cactus species may be encountered Northwest of Fredonia, however these have historically grown in isolated pockets which may be easily circumvented. Thus the overall alignment appears quite favorable. ·
2. Five Mile Mountain
This alignment, designated 2B on Figure 4-1, runs west from Telegraph Flat to Five Mile Valley. It originates where US Hwy 89 crosses Kitchen Corral Wash (mile 87.5), runs west and slightly north for 1.5 miles, follows a dirt road on the same bearing 1.5 miles, continues westward across Five Mile Mountain at a maximum ground elevation of5620 feet, and returns to US Hwy 89 (at mile 94) about 1.2 miles north of where US Hwy 89 cuts through the Cockscomb (mile 95).
a) Cost. This alignment is shorter than the preliminary alignment by 3.5 miles with a lower project cost of about 2.5% (about $5 Million). Per Section 7, unit costs are about 295 $/AF for the favored alignment (this shortened segment is a part of the favored alignment).
b) Environment. Vegetation appears to be mostly grasses and brush with some large stands of stands of Pinion-Juniper (see photos 9 and 10 in Figure 4-1 at the end of this section).
c) Soils. Soils have been mapped as 60% alluvial and 40% hard rock (Timpoweap limestone/sandstone per Plate 2, Utah Geol. & Mineral Survey, Bulletin 121, 1989). This alignment was not field checked for surface soil type due to limited time during the Dec. 1, '94 site visit. However, even if it is predominantly rock(as assumed in the cost estimate summary sheet in the appendix), it still costs less than the preliminary alignment that follows the highway.
d) Lands/ROW. The alignment is within state (Utah) and BLM public lands (Figure 4-3). e) Public Convenience and Safety. The alignment is slightly safer since it avoids construction
along US Hwy 89.
Summary: This alignment seems preferable to the preliminary alignment along US Hwy 89, mainly for cost reasons. The environmental, soils, and ROW considerations, although slightly less desirable than highway alignment appear to be both relatively benign and clearly outweighed by the cost savings.
Lake Powell Pipeline Study 22 Final Report, March 1995
--~-,
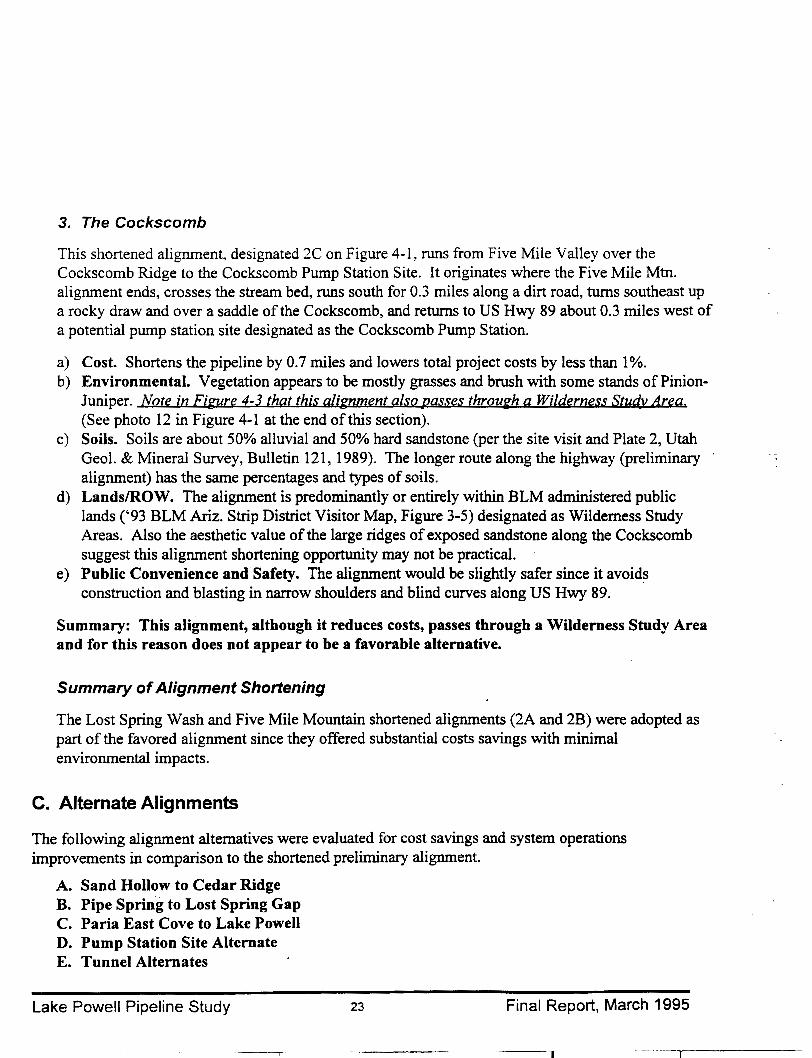
3. The Cockscomb
This shortened alignment, designated 2C on Figure 4-1, runs from Five Mile Valley over the Cockscomb Ridge to the Cockscomb Pump Station Site. It originates where the Five Mile Mtn. alignment ends, crosses the stream bed, runs south for 0.3 miles along a dirt road, turns southeast up a rocky draw and over a saddle of the Cockscomb, and returns to US Hwy 89 about 0.3 miles west of a potential pump station site designated as the Cockscomb Pump Station.
a) Cost. Shortens the pipeline by 0. 7 miles and lowers total project costs by less than 1%. b) Environmental. Vegetation appears to be mostly grasses and brush with some stands of Pinion
Juniper. Note in Figure 4-3 that this alignment also aasses through a Wilderness Study Area. (See photo 12 in Figure 4-1 at the end ofthis section).
c) Soils. Soils are about 50% alluvial and 50% hard sandstone (per the site visit and Plate 2, Utah Geol. & Mineral Survey, Bulletin 121, 1989). The longer route along the highway (preliminary alignment) has the same percentages and types of soils.
d) Lands/ROW. The alignment is predominantly or entirely within BLM administered public lands ('93 BLM Ariz. Strip District Visitor Map, Figure 3-5) designated as Wilderness Study Areas. Also the aesthetic value of the large ridges of exposed sandstone along the Cockscomb suggest this alignment shortening opportunity may not be practical.
e) Public Convenience and Safety. The alignment would be slightly safer since it avoid~ construction and blasting in narrow shoulders and blind curves along US Hwy 89.
Summary: This alignment, although it reduces costs, passes through a Wilderness Study Area and for this reason does not appear to be a favorable alternative.
Summary of Alignment Shortening
The Lost Spring Wash and Five Mile Mountain shortened alignments (2A and 2B) were adopted as part of the favored alignment since they offered substantial costs savings with minimal environmental impacts.
C. Alternate Alignments
The following alignment alternatives were evaluated for cost savings and system operations improvements in comparison to the shortened preliminary alignment.
A. Sand Hollow to Cedar Ridge B. Pipe Spring to Lost Spring Gap C. Paria East Cove to Lake Powell D. Pump Station Site Alternate E. Tunnel Alternates
Lake Powell Pipeline Study 23 Final Report, March 1995
----,
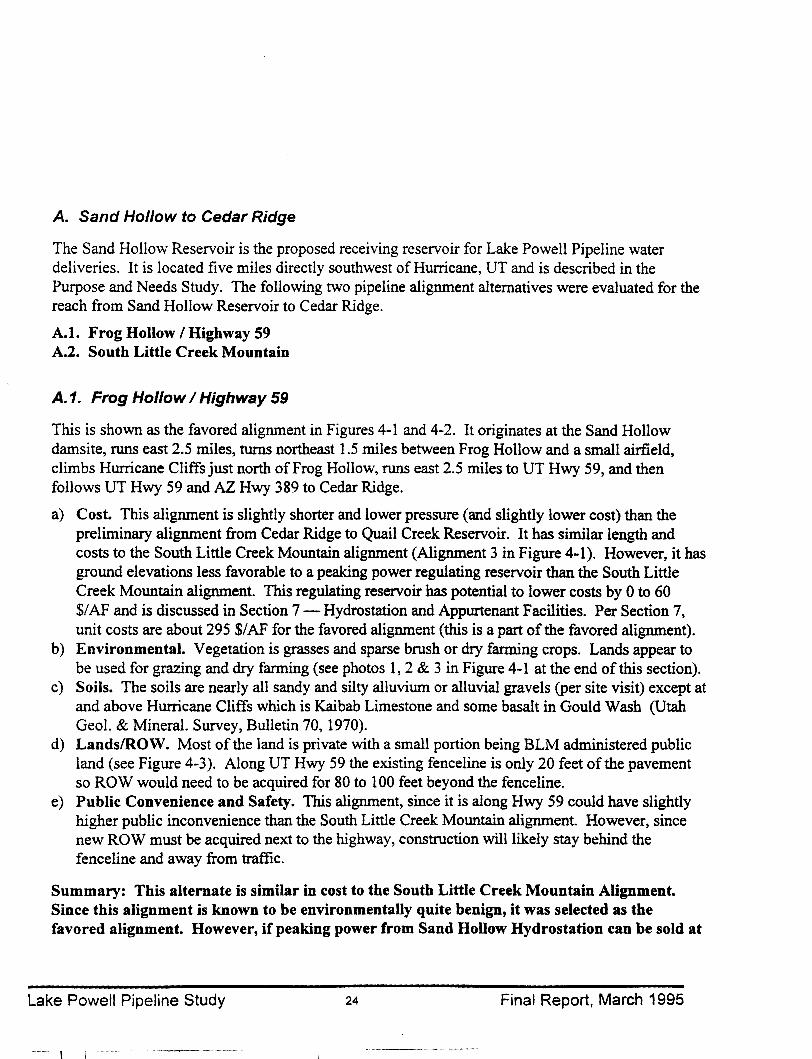
A. Sand Hollow to Cedar Ridge
The Sand Hollow Reservoir is the proposed receiving reservoir for Lake Powell Pipeline water deliveries. It is located five miles directly southwest of Hurricane, UT and is described in the Purpose and Needs Study. The following two pipeline alignment alternatives were evaluated for the reach from Sand Hollow Reservoir to Cedar Ridge.
A.l. Frog Hollow I Highway 59 A.2. South Little Creek Mountain
A. 1. Frog Hollow I Highway 59
This is shown as the favored alignment in Figures 4-1 and 4-2. It originates at the Sand Hollow damsite, runs east 2.5 miles, turns northeast 1.5 miles between Frog Hollow and a small airfield, climbs Hurricane Cliffs just north of Frog Hollow, runs east 2.5 miles to UT Hwy 59, and then follows UT Hwy 59 and AZ Hwy 389 to Cedar Ridge.
a) Cost. This alignment is slightly shorter and lower pressure (and slightly lower cost) than the preliminary alignment from Cedar Ridge to Quail Creek Reservoir. It has similar length and costs to the South Little Creek Mountain alignment (Alignment 3 in Figure 4-1). However, it has ground elevations less favorable to a peaking power regulating reservoir than the South Little Creek Mountain alignment. This regulating reservoir has potential to lower costs by 0 to 60 $/ AF and is discussed in Section 7 - Hydrostation and Appurtenant Facilities. Per Section 7, unit costs are about 295 $/AF for the favored alignment (this is a part of the favored alignment).
b) Environmental. Vegetation is grasses and sparse brush or dry farming crops. Lands appear to be used for grazing and dry farming (see photos 1, 2 & 3 in Figure 4-1 at the end of this section).
c) Soils. The soils are nearly all sandy and silty alluvium or alluvial gravels (per site visit) except at and above Hurricane Cliffs which is Kaibab Limestone and some basalt in Gould Wash (Utah Geol. & Mineral. Survey, Bulletin 70, 1970).
d) Lands/ROW. Most of the land is private with a small portion being BLM administered public land (see Figure 4-3). Along UT Hwy 59 the existing fenceline is only 20 feet of the pavement so ROW would need to be acquired for 80 to 100 feet beyond the fenceline.
e) Public Convenience and Safety. This alignment, since it is along Hwy 59 could have slightly higher public inconvenience than the South Little Creek Mountain alignment. However, since new ROW must be acquired next to the highway, construction will likely stay behind the fenceline and away from traffic.
Summary: This alternate is similar in cost to the South Little Creek Mountain Alignment. Since this alignment is known to be environmentally quite benign, it was selected as the favored alignment. However, if peaking power from Sand Hollow Hydrostation can be sold at
Lake Powell Pipeline Study 24 Final Report, March 1995
--- \ \~
one or two cents/kWh higher than power purchased for pumping, the South Little Creek Mountain Alignment appears more economical due to a favorable site for a peaking reservoir.
A.2. South Little Creek Mountain Alignment
This alternate, designated 3 on Figures 4-1 an 4-2, originates at the Sand Hollow damsite runs directly east for 1 mile, turns slightly south for 2.5 more miles, ascends Hurricane Cliffs at the north end of Grass Valley, runs south for 1.5 miles to a small bowl at elevation 5000', continues south between Hurricane Cliffs and Little Creek Mt. for 4.5 miles, then turns southeast for 24 miles passing south of Lost Spring Mountain to Cedar Ridge. It crosses Cedar Ridge about 2 miles south of AZ Hwy 389 and then continues directly eastward rejoining AZ Hwy 389 at mile 39.
a) Cost. This alternate is the same length as the favored (Frog Hollow I Hwy 59) alignment and appears to be similar in cost (unit costs are about 296$/AF per Section 7). However, it also has ! more favorable opportunities to develop peaking power for the Sand Hollow Hydrogenerator which may have unit costs between 260 $/ AF and 300 $/ AF depending on peaking power energy revenue assumptions described in Sections 6 and 7.
b) EnvironmentaL Vegetation is grasses and sparse brush. Lands appear to be used for grazing (see photo 3A in Figure 4-1 at the end of this section).
c) Soils. The soils are predominantly sandy and silty alluvium or alluvial gravels per Alpha Engineering site visit, Utah Geol. & Mineral. Survey, Bulletin 70, 1970).
d) Lands/ROW. The alignment lies about half in private land, about half in BLM administered public land, and potential in one or two sections of Utah state land (see Figure 4-3).
e) Public Convenience and Safety. This alignment is remote and avoids public inconvenience.
Summary: This alignment appears to have several favorable costs savings opportunities, the most significant of which is its potential for developing peaking power by adding a reservoir between Hurricane Cliffs and Little Creek Mountain.
B. Pipe Spring to Lost Spring Gap
This alternate, designated 4 on Figures 4-1 and 4-2, lies predominantly within the Kaibab Indian Reservation. It originates in the Kaibab Indian Reservation on AZ Hwy 389 three miles west of Pipe Spring (at mile 40.5), runs northeast for 2.4 miles, tunnels northeast 0.5 miles through a sandstone ridge, passes some existing wells, passes south of the town of Kaibab, and runs northeast along a dirt road for 2 miles to Point Spring. It then diverges gently eastward from the dirt road, runs northeast following the Honeymoon Trail for 6.5 miles to Wolf Spring, continues east-northeast for four miles to the Utah-Arizona state line, leaves the Kaibab Reservation, follows the Utah side of the state line 2 miles eastward, passes south of Kanab Airport, crosses Hwy 89, runs along the Utah side of the state line 2.9 miles and then returns to the preliminary alignment at Lost Spring Gap (mile 61.3).
Lake Powell Pipeline Study 25 Final Report, March 1995
IT--
a) Cost. This alternate is the same length as the favored alignment which follows Hwy 389 and the Lost Spring Wash shortening, but averages 270' lower head (117 psi) over 22 miles. This translates to lower unit costs of about 291$/ AF per Section. Although it requires removal of some pinion juniper, it is saves 1.5 percent of project costs ($3 million). Per Section 7, unit costs are about 291 $/ AF.
b) Environmental. The primary environmental constraints are that the pipeline alignment follows the historic honeymoon trail and passes through the Kaibab Indian Reservation. For these two reasons it is not a preferred alignment despite it's lower cost. Vegetation appears to be mostly grass and brush with about 30% pinion-juniper (see photo 5 in Figure 4-1 at the end of this section).
c) Soils. Soils were not field verified due to the remote areas, however, existing mapping shows predominantly alluvial formations with some reaches of possible sandstone. (Plate 1, Utah Geol. & Mineral Survey, Bulletin 121, 1989; and unpublished 1995 US Dept. of Agriculture geologic survey for Mohave Co., AZ).
d) Lands/ROW. The alignment requires purchase of extensive ROW's on the Kaibab Indian Reservation. Due to lack of information the ROW costs on the Indian Reservation have been assumed to be the same as pipeline ROW acquisition on private, state and federal lands. However, there may be additional cost and institutional issues in acquiring the ROW and maintaining the pipeline on Indian land. The favored alignment by contrast remains within the AZ Hwy 389 fenced ROW for through the Indian reservation (75% of it length) and in predominantly private land for the rest (see Figure 4-3).
e) Public Convenience and Safety. This higher elevation alignment would be slightly safer due to its avoidance of the highway.
Summary: Despite it's lower cost, this alignment follows the historic honeymoon trail and passes through the Kaibab Indian Reservation. This creates potential environmental and institutional roadblocks. The favored alignment by contrast stays within the highway ROW the full length of the Indian Reservation.
C. Paria East Cove to Lake Powell
As part of this study, the option of a project with just one pump station was investigated. For a single pump station at Lake Powell, the preliminary alignment (along US Hwy 89) includes 30 miles of pipeline with pressures between 500 and 1,000 psi (1,200 to 2,300 feet of head). Since pipe at these pressures is very expensive, an alternate alignment was developed to reduce the cost of the one pump station alternative. The Flat Top alignment from Paria East Cove to Lake Powell (designated alignment 5 in' Figures 4-1 and 4-2) is this alternate.
This alignment originates on US Hwy 89 two miles east of the Paria River, diverges from Hwy 89 southeastward 2.5 miles, joins and generally follows a dirt road for 3 miles southeastward, then
.ake Powell Pipeline Study 26 Final Report, March 1995
\
continues following this road eastward 5 miles across the "Flat Top" region, runs southeast 2.5 miles following the dirt road through a gentle saddle to a point 0.7 miles north of the state line (at about elev. 5600), then turns directly east for 1.5 miles descending a steep rock slope for 0.8 miles, runs east northeast just north of Studhorse Point 3 miles to where it rejoins US Hwy 89 (mile 118.2).
a) Cost. This alternative lengthens the pipeline by 0.5 miles, but decreases pressures (compared to the highway alignment with one pump station) by an average of300 psi for 15.5 miles. Project costs savings over the highway alignment with one pump station are about $8 million or 4% of project costs, with unit costs at about 314 $/AF per Section 7.
b) Environmental. Vegetation is grasses and sparse brush (see photo 14 in Figure 4-1 at the end of this section) with occasional pinion juniper stands above 5200 feet. Lands appear to used for grazing. Pipeline construction on the steep sandstone slopes 5 miles west of Lake Powell may detract from their aesthetics.
c) Soils. The soils in East Cove, along Flat Top and east of the steep sandstone slope are generally sand and gravel alluvium (per Plate II of Utah Geol. & Mineral Survey Bulletin 121, 1989). The site visit revealed several location in the Flat Top area which had thin bands (generally less than 12") of sandstone at the surface. The 0.8 mile long steep rock slope 5 miles west of Lake Powell is hard limestone and sandstone (per Plate II, Utah Geol. & Mineral Survey, Bulletin 121, 1989).
d) Lands/ROW. This alternate is entirely within state and BLM administered federal lands with about 50% of the alignment in each (see Figure 4-3).
e) Public Convenience and Safety. his alignment avoids 15 miles of construction along Highway 89. However, it should be noted that there is about 150 feet of width (per field visit) between US Hwy 89 pavement and fenceline available for construction in this reach, thus there is no appreciable difference in the construction safety.
Summary: This alignment appears preferable to the highway alignment for a one pump station option, however, as will be shown in Section 6, the two pump station option along the highway is still more cost effective due to lower pipe costs from lower pressures.
D. Alignments to Alternate Pump Station Sites
Since two alternate locations for a pump station at Lake Powell were investigated, the pipeline alignments to each were also evaluated. These alignments are named for the pump station site they end at. These are North Lone Rock Road and for Glen Canyon Dam. The pump stations and sites themselves are described in Section 5 - Pump Stations.
ke Powell Pipeline Study 27 Final Report, March 1995
J
D. 1. North Lone Rock Road
This alignment, designated as the favored alignment in Figures 4-1 and 4-2, shortens the preliminary pipeline alignment to the North Lone Rock Road pump station site. It originates at US Hwy 89 at mile 117.5 and runs east, northeast 2.4 miles to the tip a peninsula (at elevation 3700') located about 1 mile north ofLone Rock Road. Photo 15 (in Figure 4-1 at the end ofthis section) shows the Lone Rock Road beach looking southeast (the pump station site was not accessible by driving for a photo). This pump station site has a relatively steep slope into the lake down to an elevation of about 3560' (see Figure 5-3). The cost of this alignment is lower than the preliminary alignment due to its shorter length. The vegetation is sparse grasses and desert brush. From viewing the road cuts and the erosion at gullies, the soils appeared to be about 10 to 15 feet of alluvium atop sandstone. Lands are within the Glen Canyon Recreation Area. The recreation area lands closer to the lake are administered by the US Bureau of Reclamation. Public convenience is about the same for this alignment as it is for the preliminary alignment.
Summary: This alternative is favored over the Glen Canyon Dam alternate due to a cost savings of about 4% of project costs ($8 million).
D.2. Glen Canyon Dam
The alignment to the Glen Canyon Dam pump station site (see photo 16 in Figure 4-1 at the end of this section) it designated as alignment 6 in Figures 4-1 and 4-2. It originates at mile 117.5, follows US Hwy 89 3.0 miles to the Arizona state line, continues southeast for 5.5 miles along US Hwy 89, leaves the highway about 1 mile north of Glen Canyon Dam and ends at a small cove 0.5 miles upstream of the dam. This alignment is 6.2 miles longer than the North Lone Rock Road alignment and costs about $10 million more (or 5% more of project costs). Although the pump station site is better, it does not come close to compensating for the $1 0 million additional cost for piping. There appears to be little environmental or public convenience difference between this alignment and the North Lone Rock Road alignment. Soils are predominantly alluvial along US Hwy 89 with hard sandstone at the pump station site. Construction can be generally kept within the fenceline adjacent the highway 89 which lies entirely with Glen Canyon National Recreation Area Lands.
Summary: This is more expensive than the North Lone Rock Road alignment due to 6 miles of extra pipe.
. ....
Lake Powell Pipeline Study 28 Final Report, March 1995
E. Tunnel Alternates
Tunnels were investigated at two locations along the preliminary alignment to determine the potential for reducing project costs. The tunnel locations investigated, Telegraph Flat (mile 76 to 79) and Cedar Ridge (mile 34), are at the two hydraulic high points common to all alignments.
E.1. Telegraph Flat Saddle
This tunnel option was investigated for various lengths (2 to 5 miles, mile 79 to 84) and depths (30' to 300') depending on the differential value between power bought at Lake Powell and power sold at St. George. The tunnel did not appear to be cost effective at any of the diameters, flows or power rates evaluated. This is partly due to the favored pipeline alignment diverging from US highway 89 and following old highway US 289 at this saddle. The old highway passes through the lowest point on the saddle (elev 5618') while US 89 has a maximum elevation of about 5708 feet, thus the old highway alignment lowers the high point on the project by about 90 feet without tunneling.
E.2. Cedar Ridge
A tunnel was also investigated at this secondary hydraulic control point. However, due to the relatively flat saddle at this point and the hydraulic location of the Telegraph Flat Saddle; it did not appear cost effective to tunnel, regardless of pipe diameter.
Summary: In order to lower the maximum operating pressures for the system piping, tunnels would be required at both the Telegraph Flat and the Cedar Ridge locations. This does not appear to be cost effective. ·
D. Favored Alignment
Based on the several alignment alternatives discussed in this section a favored alignment was identified and is shown in Figure 4-1, with a profile in Figure 4-2. The favored alignment predominantly follows the preliminary alignment with five exceptions which generally shorten the pipeline or lower high points. This favored alignment was selected for a variety of reasons with cost being the predominant factor where there was not a strong environmental preference. However, in one case (South Little Creek Mountain), it appears that future investigation of electrical peaking power rates may prompt a reevaluation of which alignment is favored. Costs for the favored alignments and others are summered in Section 7 - Results and Project Costs.
Lake Powell Pipeline Study 29 Final Report, March 1995
\ I
Figure 4-1 - Site Photos and Lake Powell Pipeline Alignments
Figure 4-1 includes the following:
1. Representative site photographs, and
2. A location map which identifies the following:
• Locations of Alternative Alignments
• Locations and Directions of Site Photographs (hexagonal boxed numbers)
• Pump Station and Hydrostation Sites
• Regulating Reservoir Sites (for 33MW Hydrostation) and Pressure Control Station Site
• Receiving Reservoir (Sand Hollow) Site
Lake Powell Pipeline Study 30 Final Report, March 1995
I

Photo 1 rv1ile 0 Looking East at Hurricane Cliffs from within Sand Hollow Res. (Mollies Nipple in Background)
Photo 2 Mile 4 Looking East at Hurricane Cliffs
Photo 3 Mile 8 Looking West at the back side of Hurricane Cliffs (Mollies Nipple in Background)
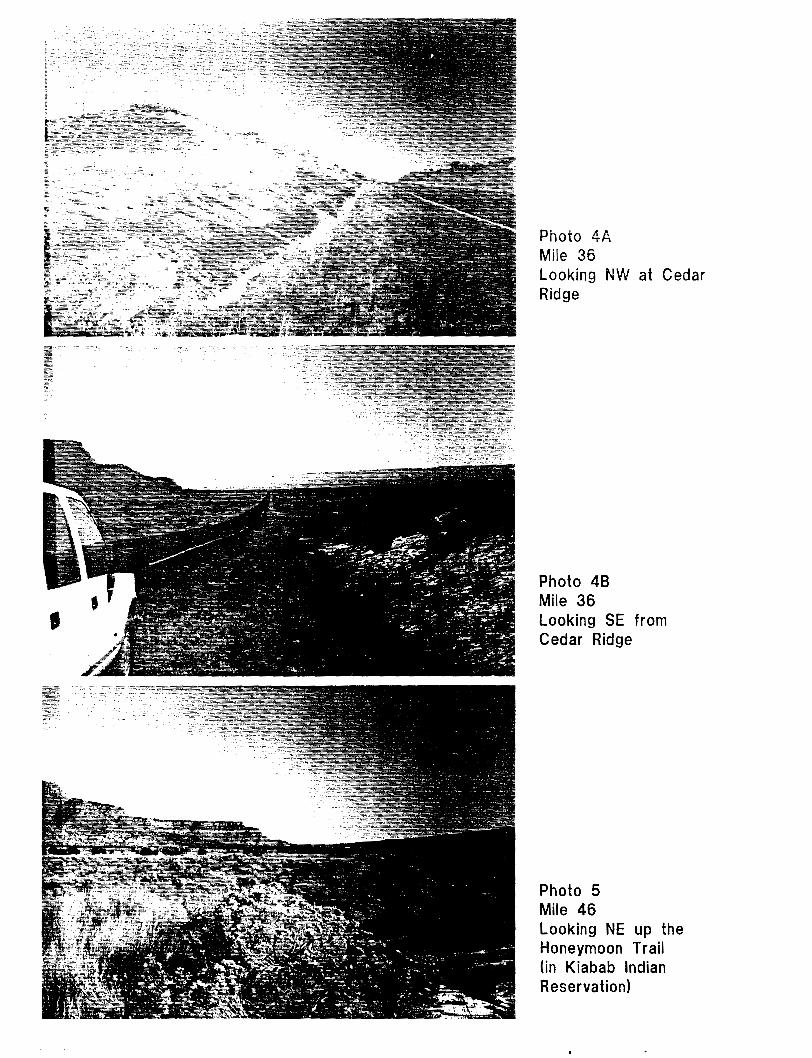
Photo 4A Mile 36 Looking NW at Cedar Ridge
Photo 48 Mile 36 Looking SE from Cedar Ridge
Photo 5 Mile 46 Looking NE up the Honeymoon Trail (in Kiabab Indian Reservation)
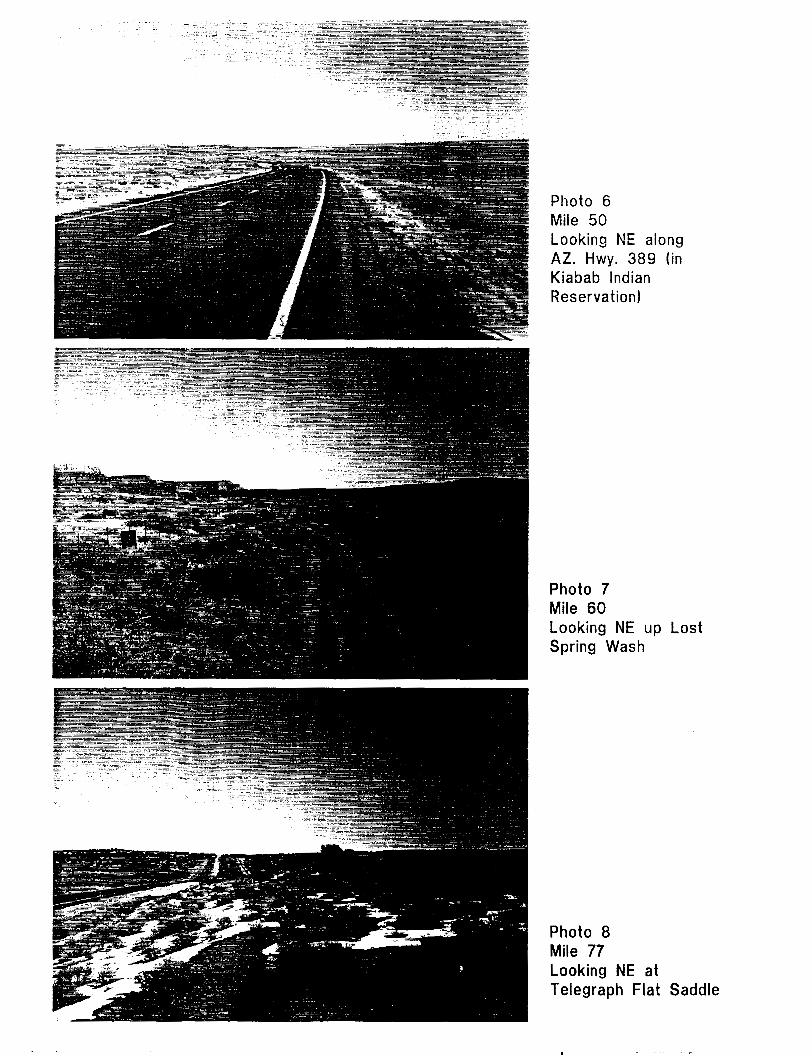
Photo 6 Mile 50 Looking NE along AZ. Hwy. 389 (in Kiabab Indian Reservation)
Photo 7 Mile 60 Looking NE up Lost Spring Wash
Photo 8 Mile 77 Looking NE at Telegraph Flat Saddle
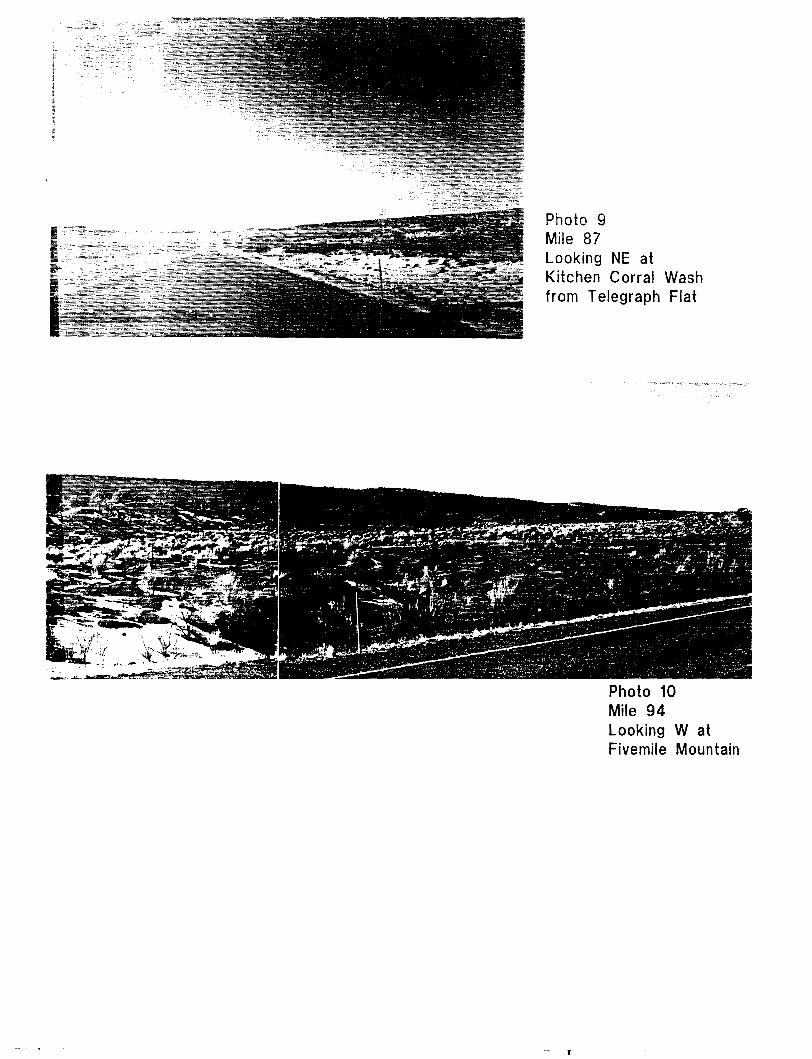
Photo 9 Mile 87 Looking NE at Kitchen Corral Wash from Telegraph Flat
Photo 10 Mile 94 Looking W at Fivemile Mountain
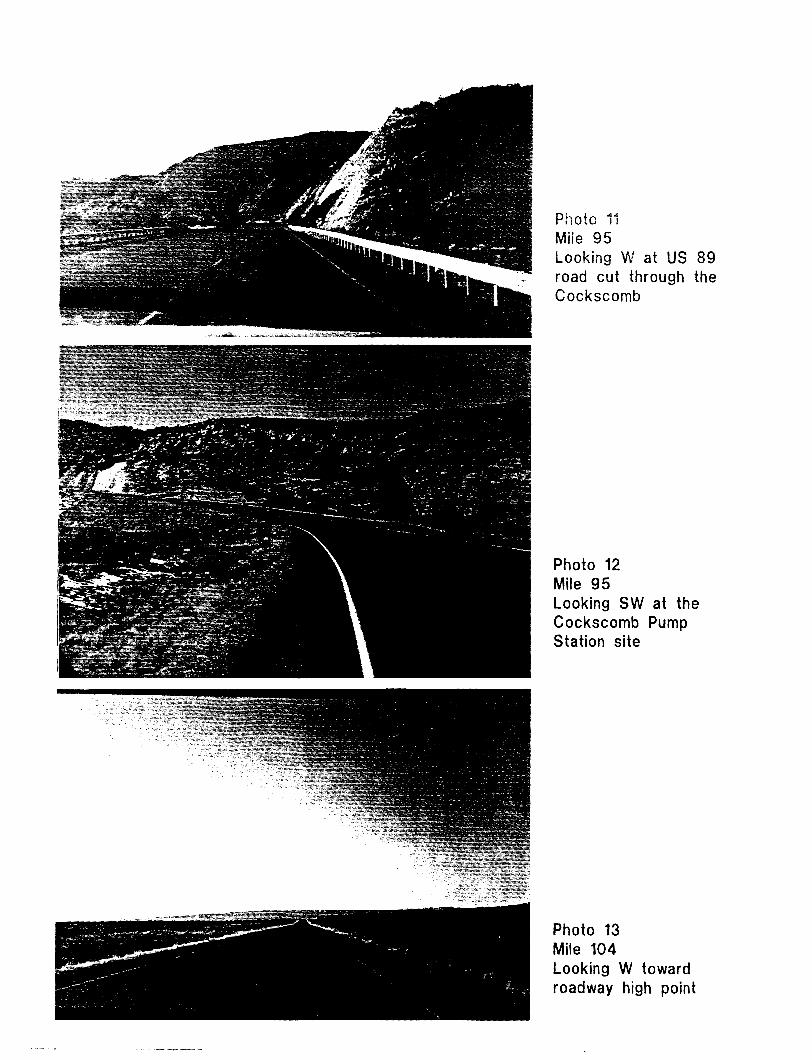
Photo 11 Mile 95 Looking W at US 89 road cut through the Cockscomb
Photo 12 Mile 95 Looking SW at the Cockscomb Pump Station site
Photo 13 Mite 104 Looking W toward roadway high point
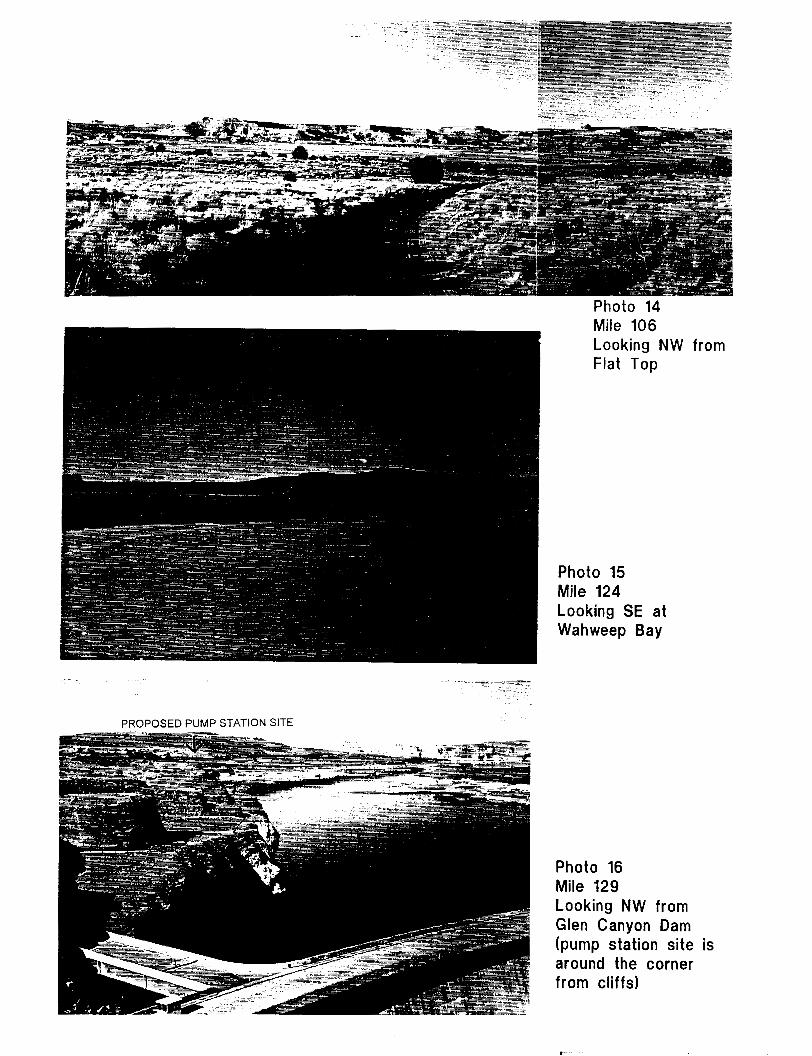
PROPOSED PUMP STATION SITE
Photo 14 Mile 106 Looking NW from Flat Top
Photo 15 Mile 124 Looking SE at Wahweep Bay
Photo 16 Mile 129 Looking NW from Glen Canyon Dam (pump station site is around the corner from cliffs)
r
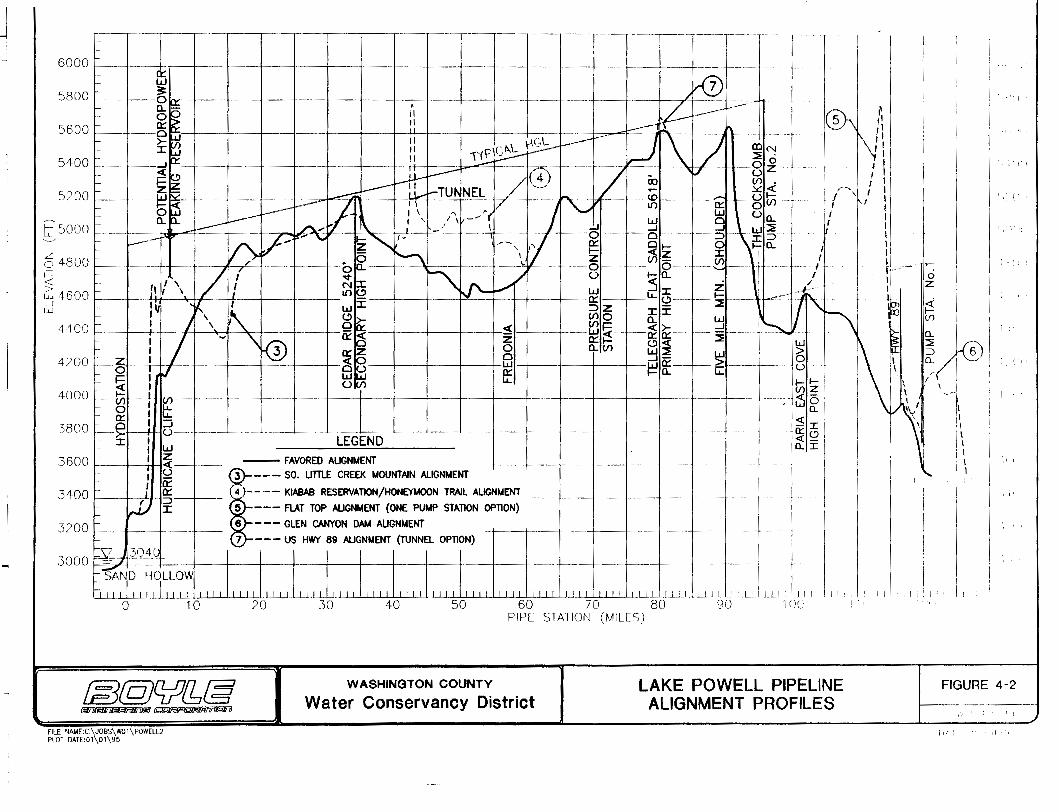
6000 ~= ~-=rl ~, - -,-, r-- ~----r~~-~-~~-- -- --
r a:: ~ 1--- w 7 5800 r -~~~--- __ • _ __ ~-t_:.::=-------
r a....-.; II --~-1- 0;;:;: II :..--
5600 ~ --:5):: --,------- ll -- l..-------~K -~- r---- , r- >- II c;L ·
5400 l--- r------~ ~~ _ :: 1iS~~--~~ __ ~ ___ / ~--------~ "'zo <( ---- ,., / u ~ i= ~ / { 4) 00 (/) .
5200,_ --~~- ___ -. ~--- _u,....-:--TUNNEL / '"· ~.o.. (() ____ -:::: ~G~-'(/)< 1-'!:.;; -·- ~I- I '- 1/ L "\. . 1,{) 0::: 0 1--- 0~~ ---- I I " _~',- - W U
~ r Q_ ' I I -~ I W a~~ a_ t;:: 5000 ~--r----- _ ~ ---------- t>--_.. \ _1 - -
1 I cS cS ----S W §5
~----- f'>/- "' ~ ""'I ~ -, f/ a:: a 1-' o ~ a.. ~ - ""'-- \ 1-' <( z :t: -"---- - 0 \ z (/) (/) I I
I I
I~ 't ,, ,, 1~1\ I I I I I I ,., r 1 I f \ I
I 1 I I I I I
I I I I I c:::, 4800 1---------
7 + -- 0 a.. - - ,_______0 -- - 6-- ----._
1- I- I ...,. '--"'- I u 1-0.
:;; ~ If / \ I ~ G '\.J'-/ W _:5 :C Z w 4600 1 ---1-- - - -0:::-~ ..... 0---- -- ~ d t- 1
111 f.-.. ~~~ w:C ::>z :c:f
r ' 0>- (/)O a.. w r- I ' a (f)- _J 4400 ---~-~------I ------- --$-- ---~-------W~--:5le-- --,---- I i I - "-@ o:::Q z 0:::1-' LL-LL- :::!;
tjfhl I I
~~
~
I
r I J a:::Z 0 0.(.1) ~~ W 4200 r-z I _ ;:!i R fa _ I- ,----~ Q: ___ ~
Q 1 f./ w~ a:: -r- ~-'a.. ..._ ~ ~ I U(f) lL.
4000 f--Ul~-t- (f) _ ---~ I __ -+----+---------+---~-----,__ 0 I lL. r-- 0::: I lL.
),13 00 --~ _ _J_ d- -- __ __j______ _j_ __j_ --+---+--:c I w ~G~D
r I -3600 r=-- I ~- __ -FAVORED ALIGNMENT + --~--+-------+-+---
- 1 ~ ~---SO. UTTLE CREEK MOUNTAIN ALIGNMENT
3400 r 1 ~ 4 ----- KIABAB RESERVATION/HONEYMOON TRAIL ALIGNMENT
::: ~ ~ 5 ---FlAT TOP AUGNMENT (ONE PUMP STATION OPTION)
3200 I-- 6 ---GLEN CANYON DAM AUGNMENT '---- 7 --- US HWY 89 AUGNMENT (TUNNEL OPTION)
3000 ~ .JD:lQ I I I_ I I I I I I I --+-------+---- t--~---
----+-----
w 6 u ~--' ~--' I (f)Z ;56
a.. ~I o::l? <C-0. I I
I I
I
' I
I
i I I
!
I
ci z
- i
~ I
I 'I
]
a..~ i' :::!; .
~ 6) -- I I I I
- ~! ~, I, II
I\ I I : \ I I
I
,I
I'
- ~>AND HOLLOW
llLJ~l~L~I I I I I I I I I I I I I 1 1 1 U_LI 1 1 It 1 1 1 It 1 1 1 It 1 1 1 It 1 1 1 It 1 1 1 It 1 1 1 I u 1 1 l1 1 1 1 ILllD_LU 1 II 1 I 1 LU.LLLU LLI 1 1 1 1 ! 1 1 1 I I I I I I: 1 I 'I I, I
10
@@C!z/1!1@ FILE NAME:C:\JOBS\WOI\POWELL2 PLOT OATE:Ol\01\95
20 30 40 50 60 10 BO 90 /(IU 1 1' PIPE STATION (MILES)
WASHINGTON COUNTY
Water Conservancy District LAKE POWELL PIPELINE
ALIGNMENT PROFILES FIGURE 4-2
jl:
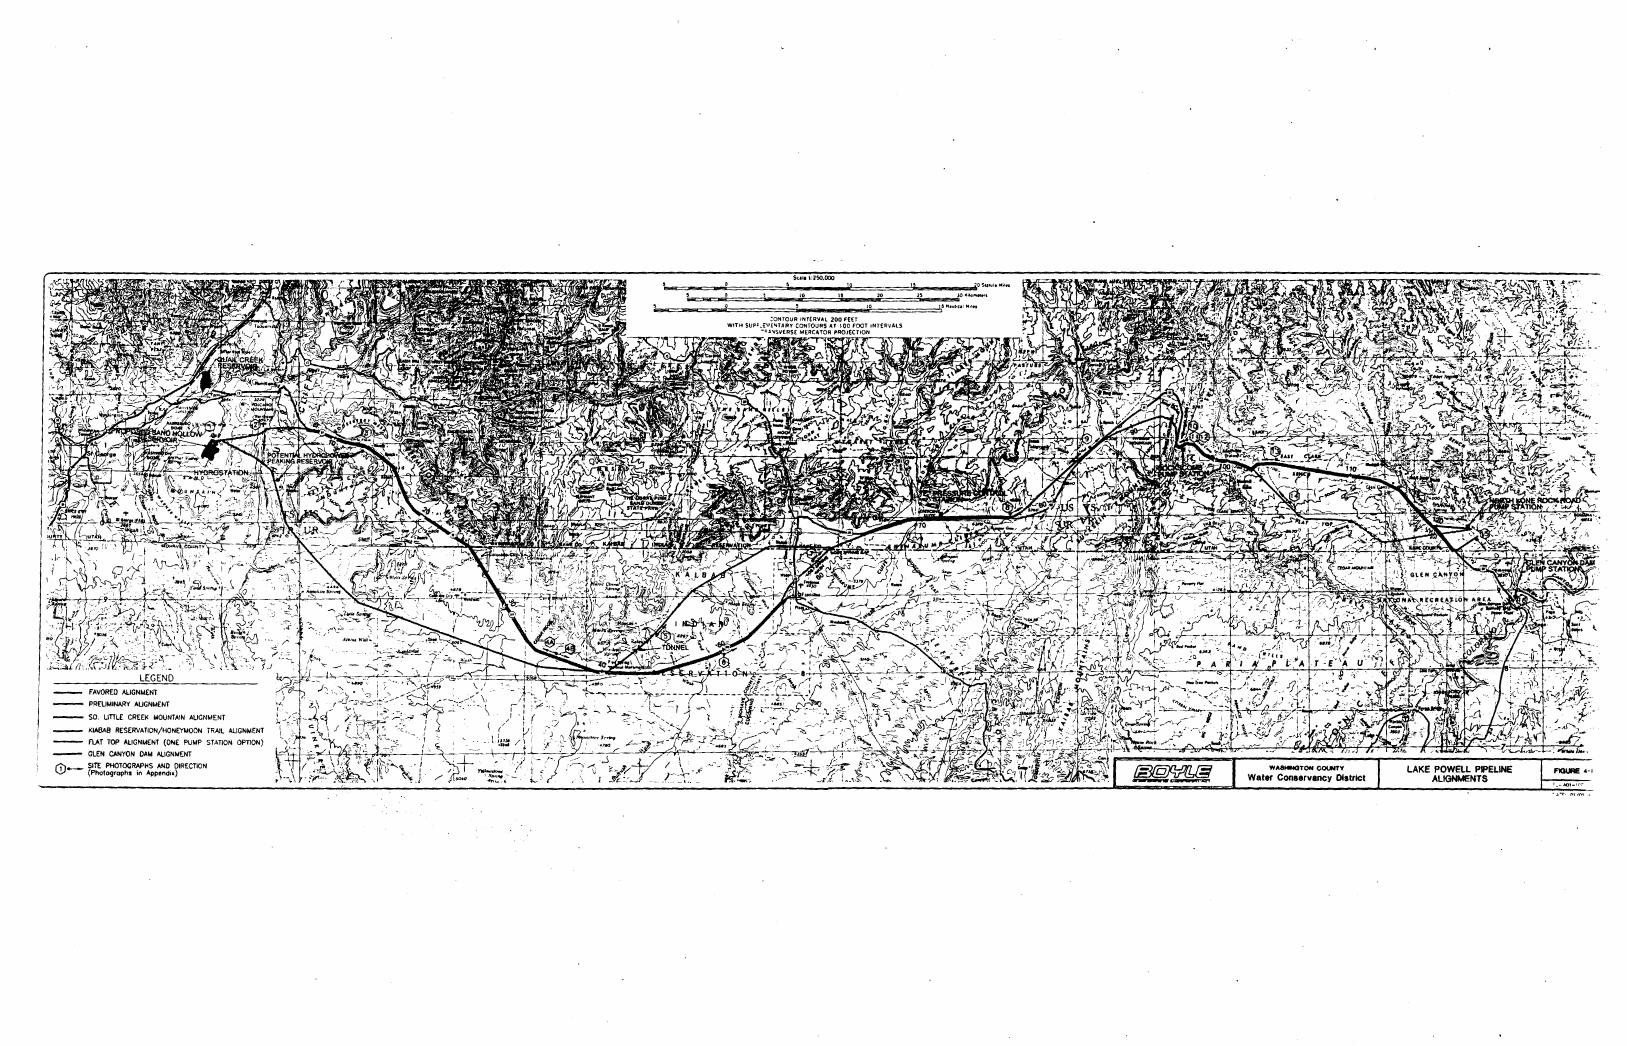
LEGEND FAVORED ALIGNMENT
PRELIMINARY ALIGNMENT
SO. LITTLE CREEK MOUNTAIN ALIGNMENT
KIABAB RESERVATION/HONEYMOON TRAIL ALIGNMENT
FLAT TOP ALIGNMENT (ONE PUMP STATION OPTION)
GLEN CANYON DAM ALIGNMENT
1"7'>_ SITE PHOTOCRAIPHS AND DIRECTION '-V (Photographs in Appendi•)
SU'- 1:250.000 10 5 0SUo1..,ttl'loiQ
'5 0 ~ 10 \'5 20 15 JC ll.liOinll.n
S 0 5 10 5Niwi•U1Mo1H
;_-M:J1-H':'"
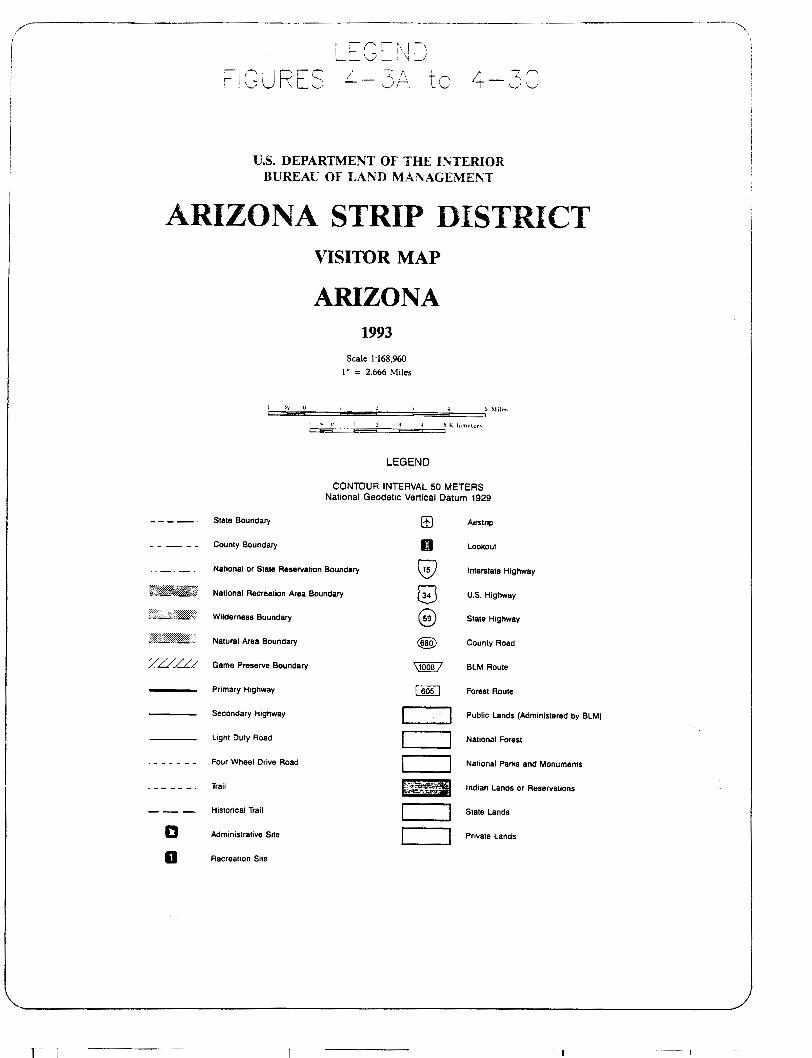
to 4 -," "'' - '--") \ . ./
U.S. DEPARTMENT OF THE II"TERIOR BUREAL OF LAND MANAGEME!\T
ARIZONA STRIP DISTRICT
State Boundary
County Boundary
VISITOR MAP
ARIZONA 1993
Scale 1:168,960
I" = 2.666 Miles
::1 =:E''::li::l =::::E::=3::::=::i==::3::=:::J5 1\ilvm..tcr~
LEGEND
CONTOUR INTERVAL 50 METERS National Geodetic Vertical Datum 1929
(±]
Ill
Airstrip
Lookout
National or State Reservation Boundary 8 0 @
Interstate Highway
··:-:;:-: :··-:·:·:-;.:-:·:~:=·· .... •· ;;::;;;::~~=~::~·=:~:
National Recreation Area Boundary
Wilderness Boundary
Natural Area Boundary
/ U il/. Game Preserve Boundary
Primary Highway
Secondary Highway
Light Duty Road
Four Wheel Drive Road
Trail
Historical Trail
D Admmostrative Site
D Recreation Site
U.S, Highway
State Highway
@0 County Road
BLM Route
Forest Route
Public Lands (Administered by BLM)
National Forest
National Parks and Monuments
[~;tD Indian Lands or Reservations
State Lands
Pnvate Lands
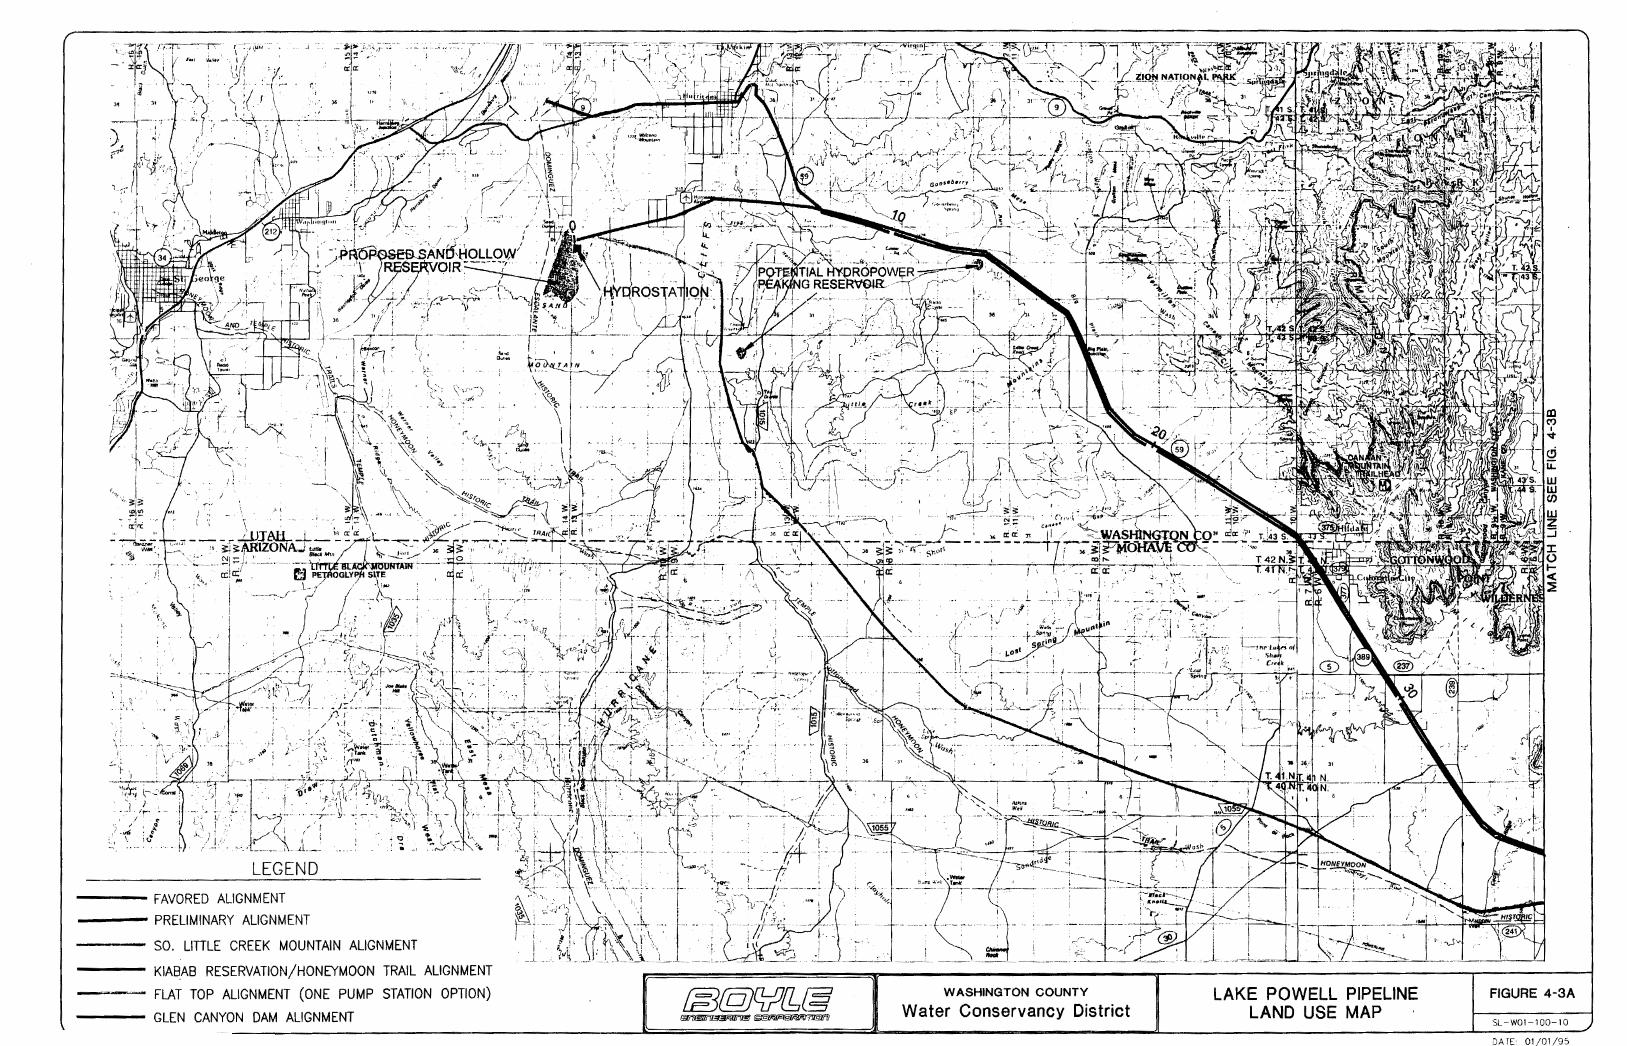
~
,J!
"I. " )----"f ~-: ,' -'' '
' ' ~ rl q,..
~-- (!J·~:\·. _,
-'· (,~
\ : .. I
/ . ·"" . I \ \ <.J"
, , I I . I ;
- .~.L__:
LEGEND
FAVORED ALIGNMENT
PRELIMINARY ALIGNMENT
-;.
SO. UTILE CREEK MOUNTAIN ALIGNMENT
\'\1"-\ ', .;'rl. _j
""" ""'-
' . rz ",-r ~-j~-. """' --·- - .. • lo, t
"~\~~-~-
•, I
~._, ___ '_1
1 ·~ 1\ 0 I -;_~J 1!
r --~ -- J
' ! L. I .;,-: I lol\i L ---
KIABAB RESERVATION/HONEYMOON TRAIL ALIGNMENT
FLAT TOP ALIGNMENT (ONE PUMP STATION OPTION)
GLEN CANYON DAM ALIGNMENT
-' -:~~~--;-:: ( .
-- \•;~·-_,-i .. • I
! ~ -: (-", I - •• - ~t·> ,_
.... l I
-~ ,,· /-< L.... .
I . I - , )· I l '--,-_-:...,...
';--- - ..... ;-·-/ ;.;~. -----1 I I ' ' ' ' -···-r ..,_
@@C!?r1@ El'nlalnl=:i3J::":II?lYtiiR 1
---___ ! -----
i 1\ . _.. ... r ~.l ~
:v '
WASHINGTON COUNTY
Water Conservancy District
!D (')
I
'lfc-W'~'rM~ Af1 1 ff I -.:t fiLN l~r;:::....J.~'/,iti.~---+- <!)
u:: :~.,~';!;;.J.~_:;-~'>,')L.Jl{J{~~s~ I w ~:Ml9_ ,d( l'~;~r'""'t:t~J.:a;~~iS L1l
LAKE POWELL PIPELINE LAND USE MAP
en w z
t-ci:J ;:;,>~;o.~,.,.J:
·"' '"'""' - ~.,-:-rO .........,....~"'1-
< tklf'!L ~ <.!LJ.'$l ~
"'-'C!WII4JI:RNml
FIGURE 4-3A
SL -W01-100-1 0
DATE: 01/01/95
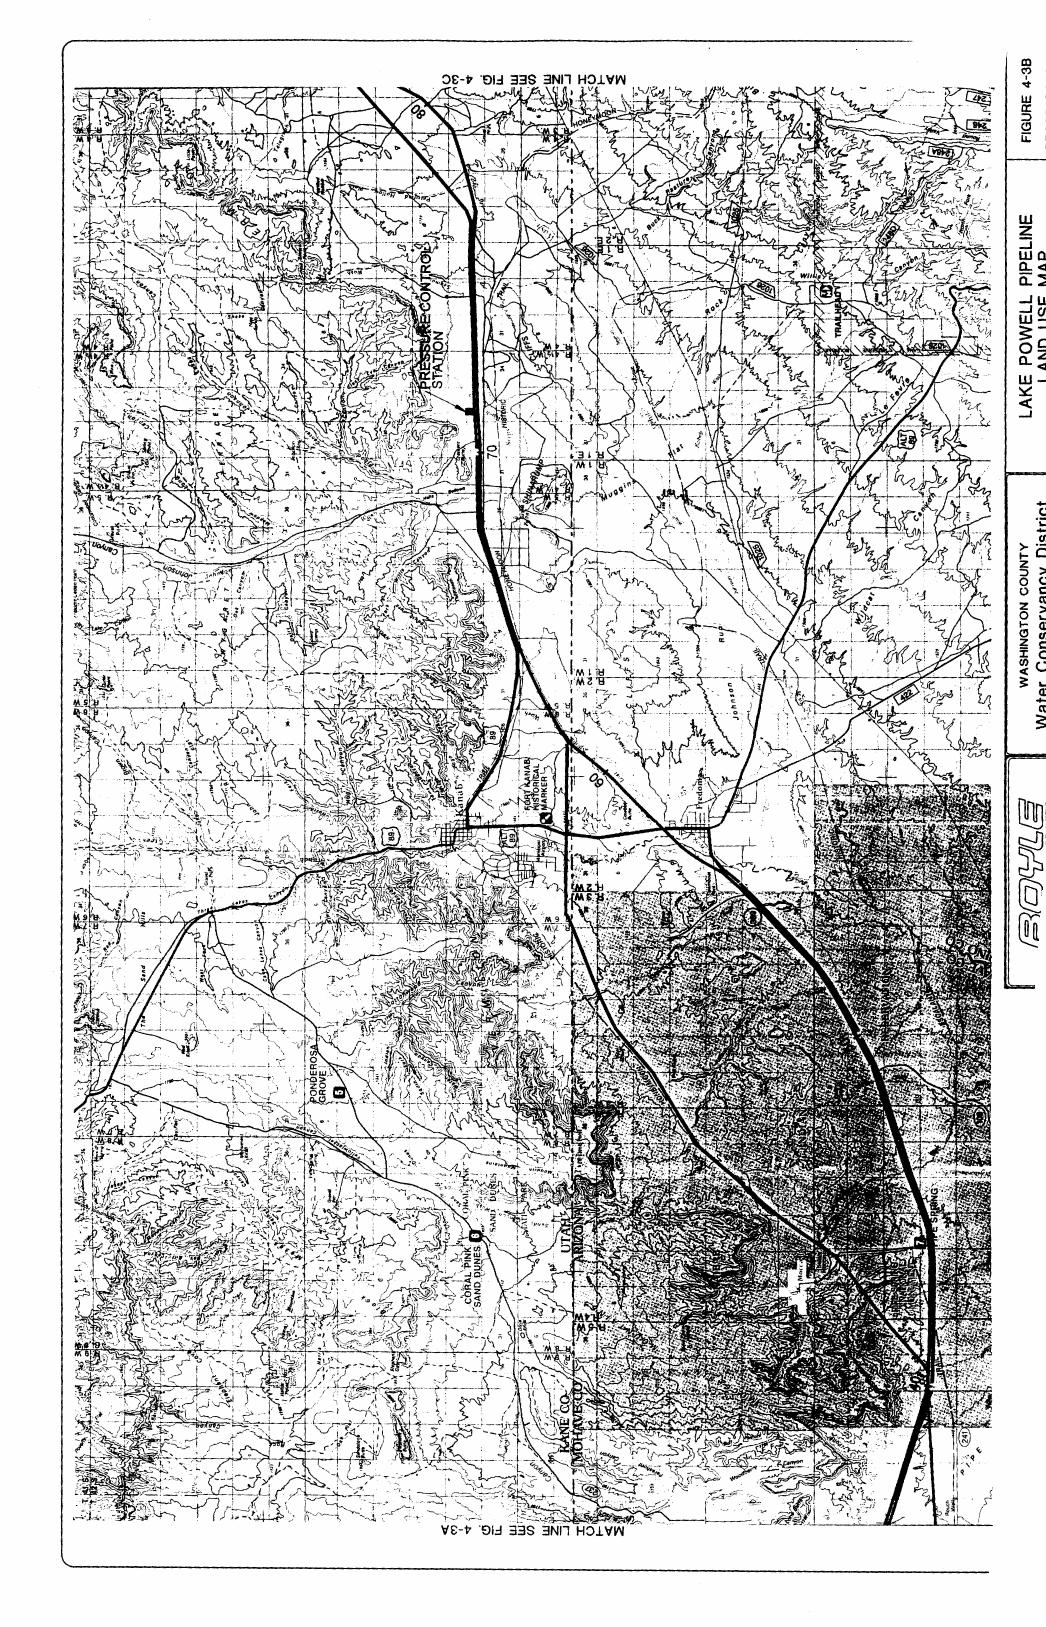
·(
III C')
I
~
UJ cc :::> <!)
u:
-.2 .... -> .~ t-0 §~ 0 0 0 c: z a:J 0 ~ ..... Q) ~ U) z c: :E 0 ~(.) ~ ....
Q) -a:J
3:
0 "' ~ I '-
0 E 0
' I E 0 s: ~ I ....
....! <t (f) c
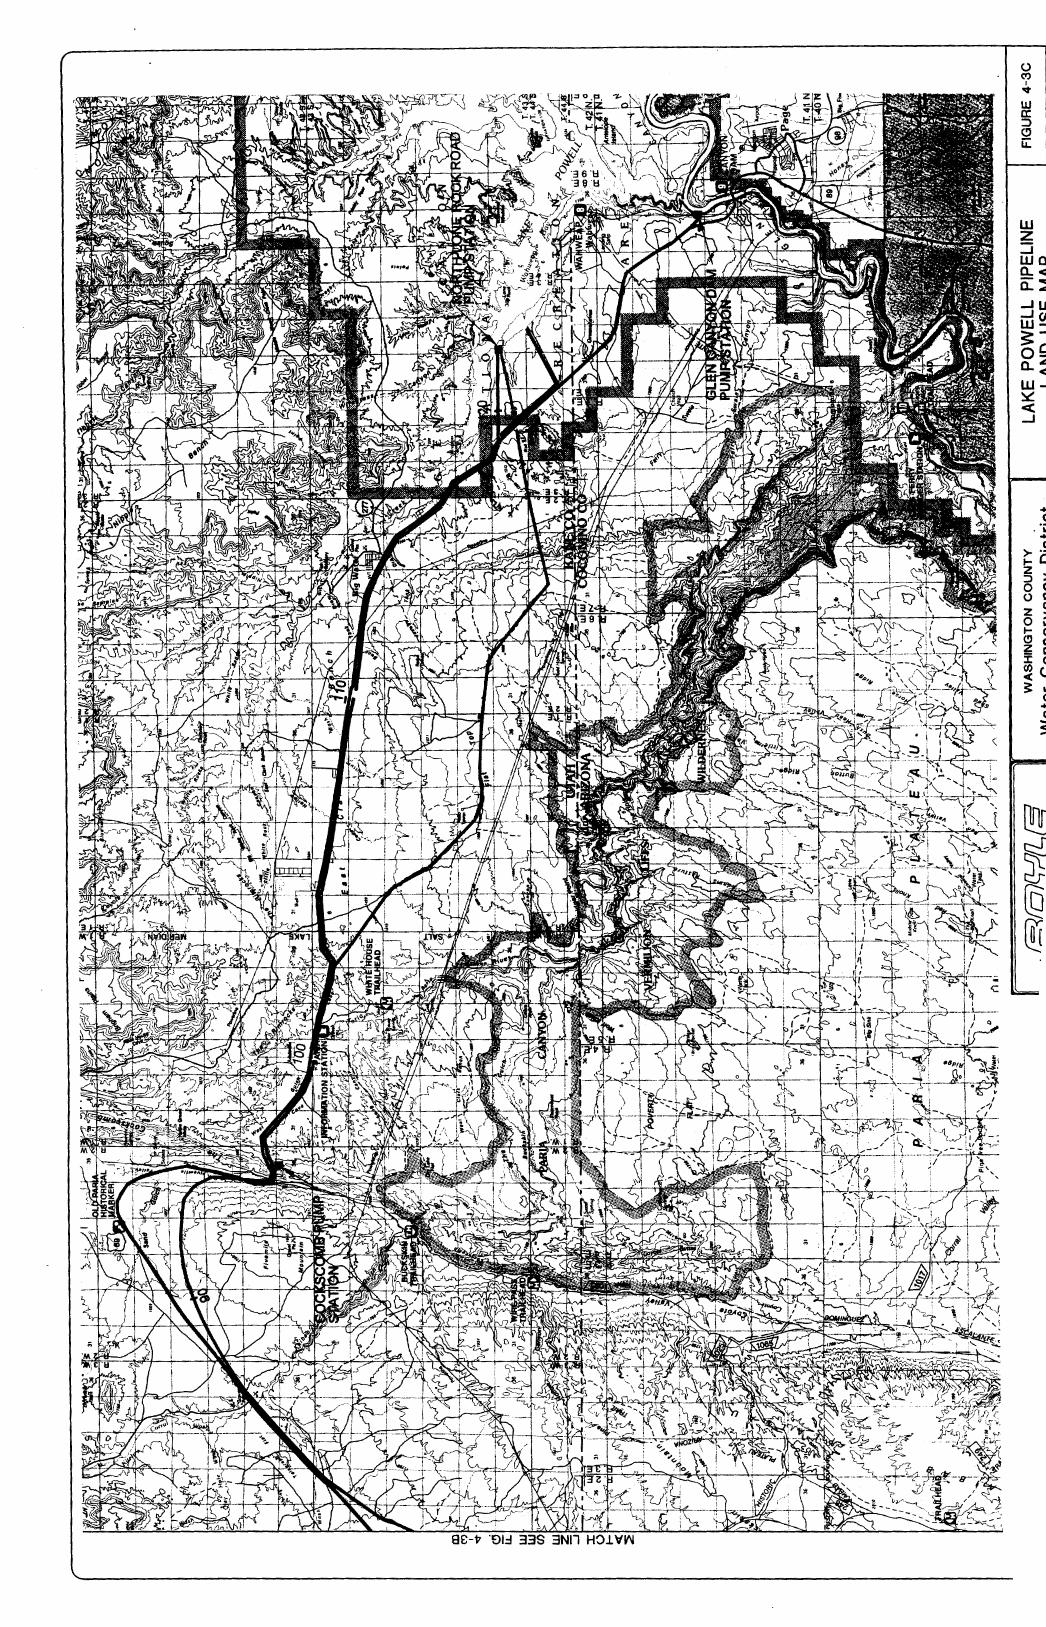
0 0 C') I I v 0
0
UJ I a: 0 j ~ I (!)
i:i: -' (/)
-.2 . \.... ..... (/)
~c ~ >-0 0 0 c:: z ro 0 c: ..... Q) (!) UJ
~ c:: Cf.l 0 <u ~ \....
(]) -a:l
3:
Section 5 - Pump Stations
The Lake Powell Pipeline Project requires pumping over 2200 feet of head (20 MW of pumping) to deliver water to Washington County. This can be accomplished by one, two or more pump stations. The options of three or more pump stations were not investigated in this study due to 1) the high cost of housing and providing power to the sites of three or more·pump stations; and, 2) the already reasonably low pipe pressures on the two pump station option. In order to compare the costs of the one and two pump station options, it is necessary to define the sites, facilities and operating requirements of each pump station, generate appropriate costs, and then couple these with the associated piping costs.
All project alternatives require at least one pump station at Lake Powell. This station has been called the Lake Powell Pump Station. Similarly, all two pump station options use the same secondary pump station location. This is has been named the Cockscomb Pump Station. The costs and facilities of these pump stations are discussed for different operating conditions and pump station site. A cost analysis is made of the concepts of one vs. two pump stations. Lastly pump station efficiencies are addressed. This section is organized as follows:
A. Lake Powell Pump Station B. Cockscomb Pump Station C. Pump Station Costs
A. Lake Powell Pump Station
The Lake Powell Pump Station facility requirements and site options are discussed in the following subsections:
1. Lake Intake Water Surface Elevations 2. Lake Intake Types and Facilities 3. Lake Powell Pump Station Site Options
1. Lake Intake Water Surface Elev~tions
Lake Powell is operated primarily as a long term water supply storage facility and will be drawn down during extended periods of drought. Therefore it is important to establish an appropriate minimum intake elevation for the Lake Powell Pump Station. The Lake Powell water surface elevations affect: 1) pumping energy costs; 2) the extent and elevation of intake piping which affects the 3) choice of pump station sites and therefore 4) the length of pipe.
The maximum and minimum End of Month Lake Elevations for each year are plotted in Figure 5-1. The average lake elevation since filling has been about 3665'. The period since 197 4, when the lake first reached over 70% of its capacity, has an average elevation of about 3660'. However, since demands on
Lake Powell Pipeline Study 31 Final Report, March 1995
--I -

----MINIMUM ~ MAXIMUM ""':·.,-, -----------'=============-----------
•··co: ,_, ----------------~----=-~ --...---------
·~·
l -~-<II!! I ...... I ., .. .. I
. /' ~' (
11880-Lal<e J / Powell is first
FHied
• I !
Proposed Mm1mum ....
lntal<e Level 3.580 Feet
.. ·~ .
·~
7-YI!!ar Drought )
'· '
'Of
i
~ ! ! ! ! ~ ~ ~ ~ ~ ~ ~ ~ ~ € ~ i ! ! ! ~ m ~ ' ~ ' ~ ! i ~ YEAR
Figure 5-1 Lake Powell Minimum & Maximum End-of-Month Elevations
__.__Million Acre Feet of Water
0+---~----~--~----~----~---r----r---~----~---, 3500 3520 3540 3560 3580
I Lake 3600 3620 3640 3660 Elevation I
Figure 5-2. Elevation - Capacity For Lake Powell
3680 3700
'
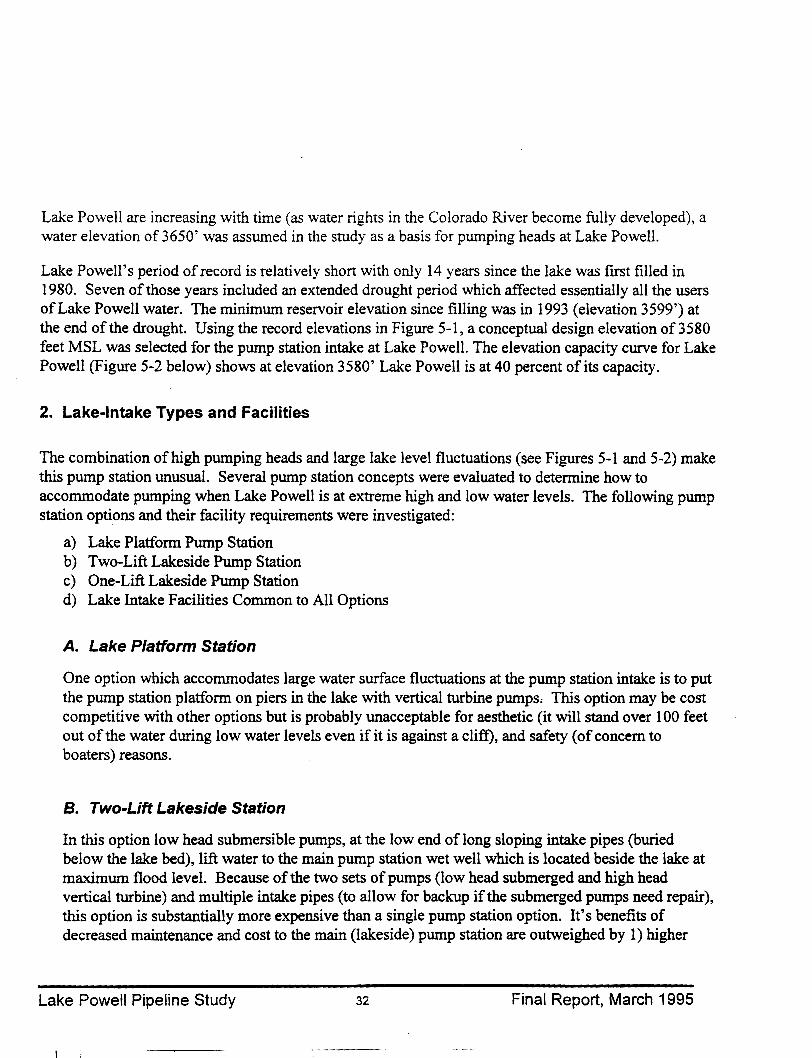
Lake Powell are increasing with time (as water rights in the Colorado River become fully developed), a water elevation of 3650' was assumed in the study as a basis for pumping heads at Lake Powell.
Lake Powell's period of record is relatively short with only 14 years since the lake was first filled in 1980. Seven of those years included an extended drought period which affected essentially all the users of Lake Powell water. The minimum reservoir elevation since filling was in 1993 (elevation 3599') at the end of the drought. Using the record elevations in Figure 5-1, a conceptual design elevation of3580 feet MSL was selected for the pump station intake at Lake Powell. The elevation capacity curve for Lake Powell (Figure 5-2 below) shows at elevation 3580' Lake Powell is at 40 percent of its capacity.
2. Lake-Intake Types and Facilities
The combination of high pumping heads and large lake level fluctuations (see Figures 5-1 and 5-2) make this pump station unusual. Several pump station concepts were evaluated to determine how to accommodate pumping when Lake Powell is at extreme high and low water levels. The following pump station options and their facility requirements were investigated:
a) Lake Platform Pump Station b) Two-Lift Lakeside Pump Station c) One-Lift Lakeside Pump Station d) Lake Intake Facilities Common to All Options
A. Lake Platform Station
One option which accommodates large water surface fluctuations at the pump station intake is to put the pump station platform on piers in the lake with vertical turbine pumps, This option may be cost competitive with other options but is probably unacceptable for aesthetic (it will stand over 100 feet out of the water during low water levels even if it is against a cliff), and safety (of concern to boaters) reasons.
B. Two-Lift Lakeside Station
In this option low head submersible pumps, at the low end of long sloping intake pipes (buried below the lake bed), lift water to the main pump station wet well which is located beside the lake at maximum flood level. Because of the two sets of pumps (low head submerged and high head vertical turbine) and multiple intake pipes (to allow for backup if the submerged pumps need repair), this option is substantially more expensive than a single pump station option. It's benefits of decreased maintenance and cost to the main (lakeside) pump station are outweighed by 1) higher
Lake Powell Pipeline Study 32 Final Report, March 1995
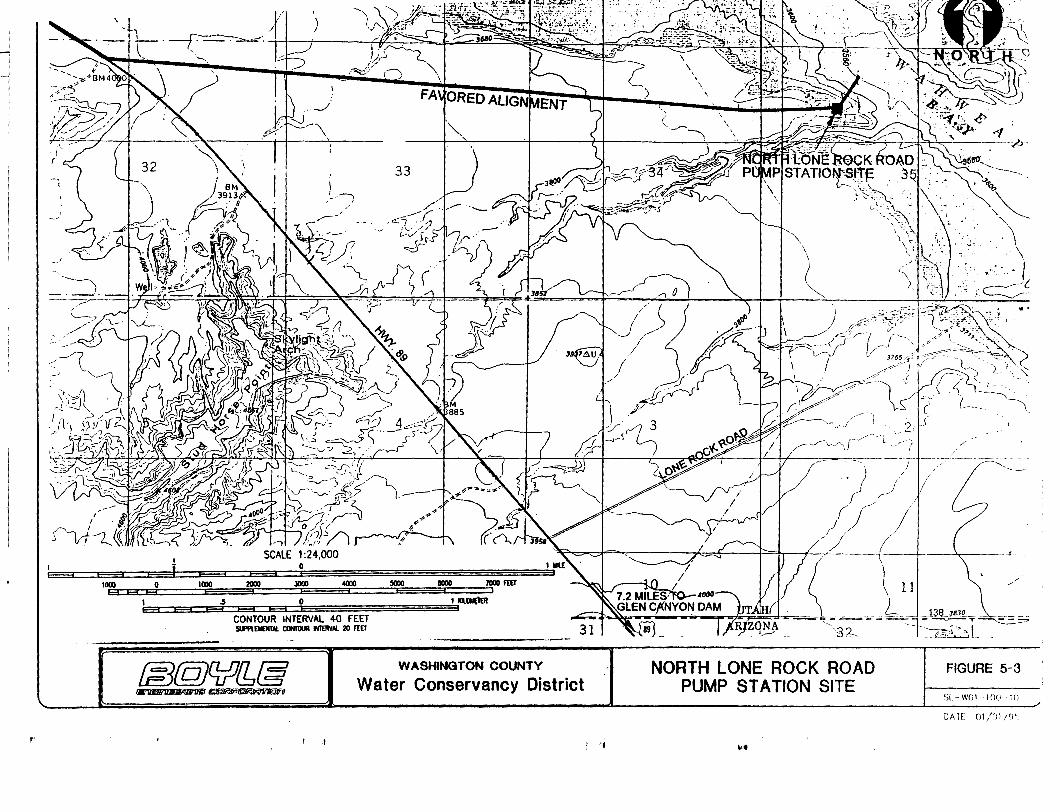
, . .,
I 1 i 0
1000 0 1000 2000 lOOO 4000 DJO 11000 7000 mT
I .5 0 I D..OII;ltR ea F3 ea EH E3
CONTOUR INTERVAL 40 FEET SII'I'UIIEIITN. CONrOUR IITERI'AI. 20 f[[f
@@C}flf1@ ~~
WASHINGTON COUNTY
Water Conservancy District
I
NORTH LONE ROCK ROAD PUMP STATION SITE
1•11
/ ./
FIGURE 5-3
SL- WOl I 00 1r i
DATE. 01/01/'1',
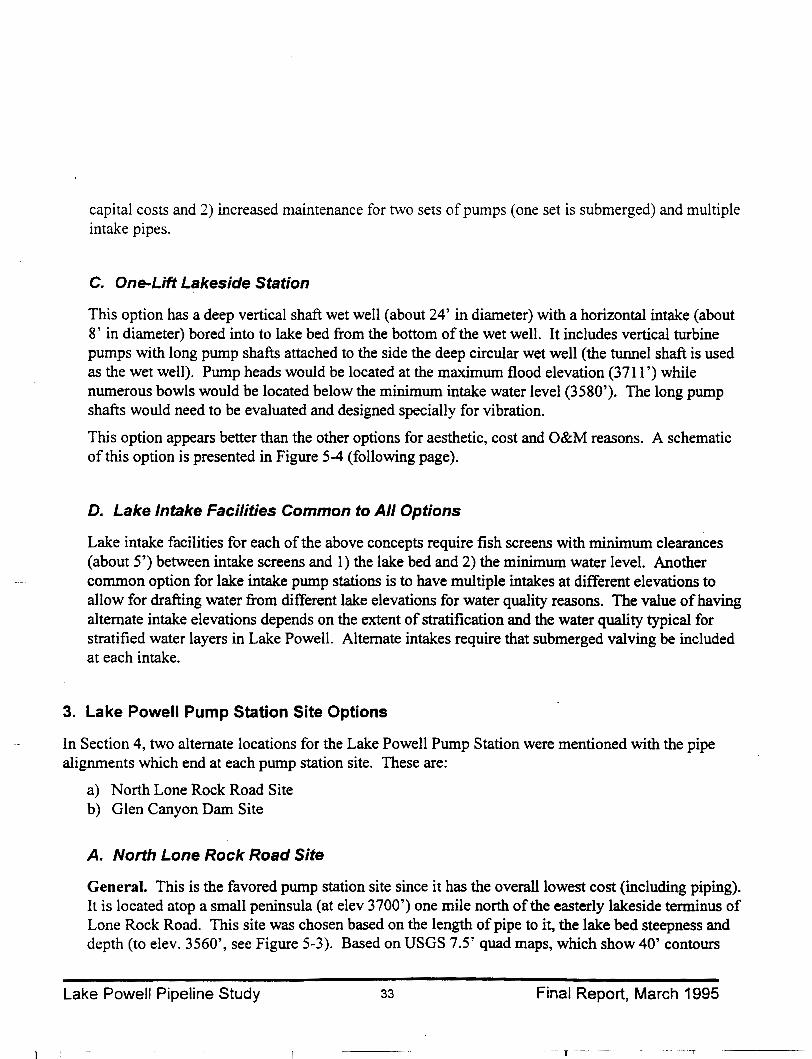
capital costs and 2) increased maintenance for two sets of pumps (one set is submerged) and multiple intake pipes.
C. One-Lift Lakeside Station
This option has a deep vertical shaft wet well (about 24' in diameter) with a horizontal intake (about 8' in diameter) bored into to lake bed from the bottom of the wet well. It includes vertical turbine pumps with long pump shafts attached to the side the deep circular wet well (the tunnel shaft is used as the wet well). Pump heads would be located at the maximum flood elevation (3711 ')while numerous bowls would be located below the minimum intake water level (3580'). The long pump shafts would need to be evaluated and designed specially for vibration.
This option appears better than the other options for aesthetic, cost and O&M reasons. A schematic of this option is presented in Figure 5-4 (following page).
D. Lake Intake Facilities Common to All Options
Lake intake facilities for each of the above concepts require fish screens with minimum clearances (about 5') between intake screens and 1) the lake bed and 2) the minimum water level. Another common option for lake intake pump stations is to have multiple intakes at different elevations to allow for drafting water from different lake elevations for water quality reasons. The value of having alternate intake elevations depends on the extent of stratification and the water quality typical for stratified water layers in Lake Powell. Alternate intakes require that submerged valving be included at each intake.
3. Lake Powell Pump Station Site Options
In Section 4, two alternate locations for the Lake Powell Pump Station were mentioned with the pipe alignments which end at each pump station site. These are:
a) North Lone Rock Road Site b) Glen Canyon Dam Site
A. North Lone Rock Road Site
General. This is the favored pump station site since it has the overall lowest cost (including piping). It is located atop a small peninsula (at elev 3700') one mile north of the easterly lakeside terminus of Lone Rock Road. This site was chosen based on the length of pipe to it, the lake bed steepness and depth (to elev. 3560', see Figure 5-3). Based on USGS 7.5' quad maps, which show 40' contours
Lake Powell Pipeline Study 33 Final Report, March 1995
- T
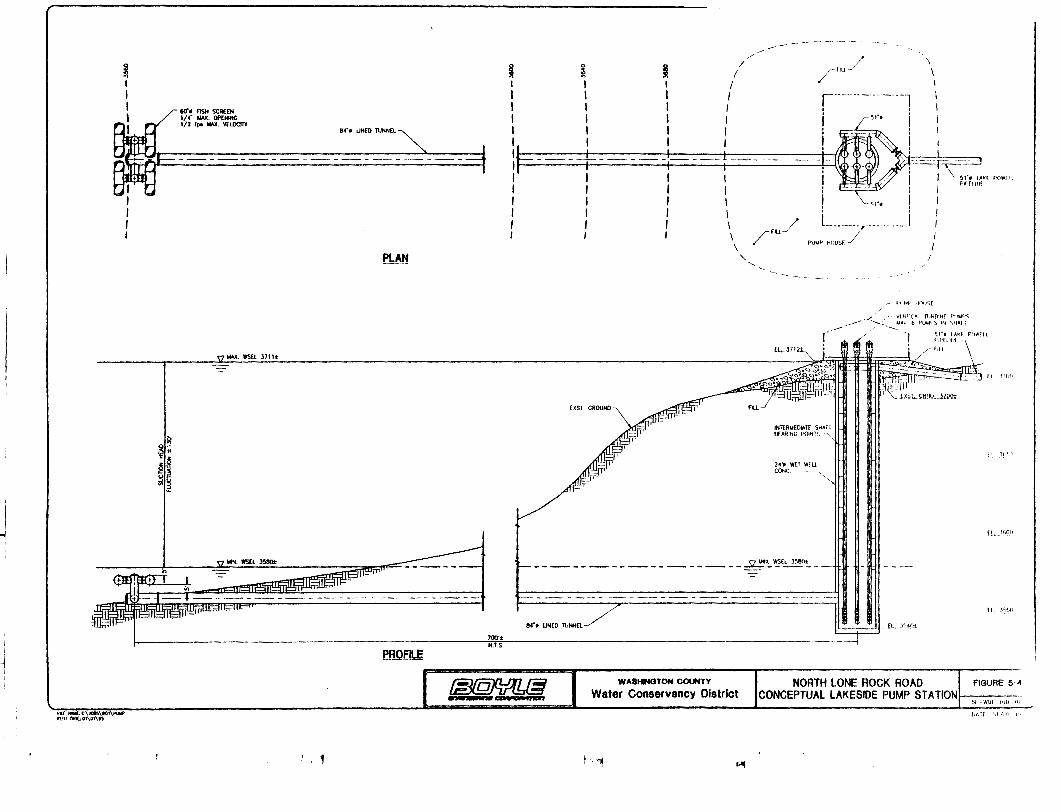
l
~ I
iJJ'. +M:c:.\.108$\.0i\Pi.II.IP l'l01 M1t;OI\0'\'M
1:1 g-..
u It
611'• FISH SCREEN 1/4" MAX. OPENINC 1/2 lpo IIAlC. VELOCI1l
WJ(. ftStl J711t
--=
""'· WSI:L 358<lt
84•1 UH£0 1\JNNEl
eYH
EBQf!LE 700't N.f.S.
//
~ ~ I / I I I I
/"'"'~/· I I I 1 ~-----------~ I I I I , , I I I I j __£_'"' j
I I I 1 I · · I lf=- I - -l---}-- ---- -i-1 . /~ - , II II:~
I I I I j " ' j \ I I I I : - :
~l"f I_.AI<[ POWfll Pll'flltlf
I I I l I ".' I I I I I : : I I I l / L _____ T ______ _j 1 1 1 \ /ru /
\ PU~P HOUSf -
' ..__
I'III,IP IVlU';[
EXST. GROUND
INTiRMED~T£ St-t-'fl BORI~lG I>OlNl~ ~--,,
24'11 WU WEU COHC ----..,
'·,
---------------------- ~":.~£~0~--=-
84•f UNED l\JNNn
,./ /- VIHIKAI nJ~[liNf F'11t.APS , -- ~-::_ ~ 1.4111 b PUI.AI'~ ~~~ ',HA.Il ..___
fL J',~Qt
S1"• \.l.l(f POWHI rw£LlHI
/-fill
H ~:[10
~ I ~f, ' I I
q H'>Oit
(I ''J',il
~ WASHINGTON COLWTY
Water Conservancy District NORTH LONE ROCK ROAD FIGURE 54
CONCEPTUAL LAKESIDE PUMP STATION!------- SL -I';IJI \tJI) H1
OIIH 111/1\1,
i ·-·~ ....
into the inundated lake area, an intake tunnel about 550' to 700' long is needed to allow pumping down to lake elevations of 3560' (see Figure 5-4).
This pump station site, although more remote than the Glen Canyon site is located on a peninsula which is visible from the lake and surrounding shorelines. Consideration should be given to putting the pumps station partially below grade (below the maximum flood level) and grading the dirt up around the sides ofthe station so it blends into the surrounding environment.
Soils. Soils below this site are mapped as moderately hard sandstones with some uncemented alluvial materials (Utah Geologic & Mineral Survey Map 121, Plate 2, Bulletin 124, 1989). Tunneling costs will be affected by the localized materials. Due to the high hydrostatic heads, an earth pressure balance tunneling machine will likely be required to perform the tunneling with pipe sections being placed closely behind the tunneling machine heading. The vertical tunneling shaft which would be converted to a deep wet well will likely require extensive dewatering and some blasting depending on the local soils formations.
Power to the Site. Getting power to this site will require the construction of new power lines, presumably from the power lines which run northwest from Glen Canyon Dam to the pump station site. It is assumed the new power lines will originate at the main power lines about 10 miles northwest or the dam, follow another power line northward two miles to pipe alignment 5 and then follow this alignment five miles eastward to the North Lone Rock Road Pump Station site. It is assumed the construction cost of the power lines will be in the order of 0. 7 million with 5 miles of the power line alignment not following existing power easements. Most of this five miles will be within the Glen Canyon National Recreation Area. A new electrical substation will be required near the pump station. The visual impact of the substation may be partly mitigated by putting it in the 40' deep wash which passes just south of this pump station site.
Summary: This is the favored Lake Powell Pump Station site since it provides for pumping down to lake a lake level of 3560' and clearly has a lower cost than the other Lake Powell Pump Station options.
B. Glen Canyon Dam Site
General. This pump station site is located 0.6 miles north of the dam in a small cove at about elevation 3740' adjacent to a sandstone cliff which drops 500' to the bottom of the reservoir. This pump station location would be less expensive to construct on a platform hung off the rock cliff. However, this might be considered aesthetically unsightly, particularly since there are large numbers of tourists at th~ dam site. To decrease the visual impact at this site may involve a pump station similar to the North Lone Rock Road concept shown in Figure 5.4. The pumphouse site could be excavated (blasted) down to elevation 3710, a large diameter (24') shaft would be excavated down
Lake Powell Pipeline Study 34 Final Report, March 1995
T
about 170' vertically into the rock, and then a tunnel bored with an earth pressure balance system out to the face of the submerged lake cliff.
Soils. The soils at this location are uniformly hard sandstones which would require blasting.
Power to Site. Power for this pump station site would logically come from the adjacent Glen Canyon Dam, either directly or by a power exchange agreement. The short power line requirements (less than 1 mile) would not likely be environmentally a concern since this area is now traversed by several large power lines already.
Summary: The extra 6 miles of pipe length with this alternative adds about five times more cost than is saved by this alternative's easier site conditions. Thus, this site is not favored for cost reasons.
B. Cockscomb Pump Station
General. The Cockscomb Pump Station provides the mid-pipeline lift for the favored two pump station option. The Cockscomb Pump Station site is located at the east side of the hard sandstone ridge known as The Cockscomb (mile 96.2) and about 24 miles from the North Lone Rock Road Pump Station. The area north of US Hwy 89 at the Cockscomb is designated Wilderness Study Area, thus the south side of the highway may be a more appropriate site for this pump station and forebay reservoir. ·
The high discharge heads and relatively constant suction pressure at the Cockscomb Pump Station are well adapted to vertical turbine pumps. Since this facility is a long distance from the Lake Powell Pump Station, a forebay reservoir, located at about elevation 4600' is assumed in the cost estimate to 1) keep pumps from cycling on and off too frequently and 2) to relieve surges on the pipeline at the suction side of the pump station.
Soils. Soils at the Cockscomb Pump Station site are hard sandstones to the west and alluvial deposits to the east (per Utah Geological and Mineral Survey, Bulletin 121, 1989). Depending on the final location of the facility, both sandstones and alluvium could be encountered in excavating the forebay reservoir and the pump can holes.
Power to Site. Power to the site will likely come from the Garkane power lines which run north and south on the other side of the Cockscomb ridge one mile east of the pump station (up Five Mile Valley). Other large power lines are located 3 miles to the south which might be used if the closer power lines are at capacity.
Summary: Thi~ is the mid-pipeline pump station in the favored two pump station project. Alternatives to this pump station site were investigated but not comparable since this site was dearly the lower cost site for a two pump station alternative due to its low pipeline pressures and its nearby power lines.
Lake Powell Pipeline Study 35 Final Report, March 1995
,-
C. Pump Station Costs
Pump station costs on this project are affected by basic pump station facilities, high pressures, power requirements, lake intake and wet well facilities, operations and maintenance, and pumping efficiency. This subsection describes the basis of those costs and then includes itemized summaries of the main cost components of each pump station. It is organized as follows:
1. Basic Pump Station 2. High Pressure and Surge Control 3. Power to the Site 4. Lake Intake and Wet Well 5. O&M Costs, Energy Costs and Pumping Efficiencies 6. Pump Station Cost Summaries
1. Basic Pump Station
The basic pump station components are very similar to a typical municipal water supply pump station, including the costs. These include pumps, controls and instrumentation, sitework, inlet and outlet piping, the pumphouse, and often emergency power backup. The costs of these components are related to the total flow capacity of the pump station and generally follow the following equation (derived from several pump station cost estimating methods1) for pumping heads of generally less than 600'(300 psi):
For standard head (<300 psi) pump stations:
Basic Pump Station Cost= $40,000 x (GPM/100)'75
where: GPM = pump station flow capacity in gallons per minute
2. High Pressures and Surge Control
Most pump stations have total pumping heads (TDH) lower than 700 feet (or 300 psi). These stations use standard pipe, valves, flanges, surge equipment, and pumps. When pump stations exceed about 300 to 350 psi they require mostly specially fabricated valves, flanges, pumps and other equipment. This affects costs. For pump stations with heads over 700 feet, a high pressure factor is added to the base pump station cost. For the Lake Powell Pipeline pump stations, with heads at about 1150', this pressure based factor increases the base pump station cost component about 30% over that of standard pump stations.
I "Pump Station Design", Sanks, Bosserman, et al, 1989., & "Water Supply and Transmission Report", City of San Diego Drinking Water Quality Improvement Program, 1993. "Water Systems Construction Cost Estimating", City of San Diego Water Masterplan, 1991.
Lake Powell Pipeline Study 36 Final Report, March 1995
Start up and shutdown (particularly abrupt power outages) of pumps can cause significant water hammer in the high pressure pipelines. This can be dissipated with either air release valves, surge tanks, elevated stand pipes (which vent to atmosphere) or a combination of these. Although elevated stand pipes may be feasible in a few project alternatives, most situations will require air vacuum valves and/or large pressurized surge (hydropneurnatic) tanks. For the flows (82 cfs), velocities (6 fsp) and heads (11 00') on this project, several large surge tanks may be required to attenuate surges in the pipeline. These may cost about $800,000 per pump station. Air and vacuum valves are an integral part of the pipeline and are accounted for in the pipeline appurtenance cost multiplier.
3. Power to the Site
The cost of electrical power lines and substations for delivering power to a remote pump station site are a large percent of the pump station costs. Large overhead power transmission lines cost about $100,000 · per mile according to the City of St. George and UP&L/Pacificorp electrical transmission line engineers. Substations for pump stations of this size typically cost about $650,000 each for 10 to 20 MW substations according to the City of St. George.
4. Lake Intake and Wet Well (Lake Powell Pump Station)
Several pump station lake intake alternatives have been evaluated comparatively on projects with lake intakes similar to the Lake Powell Pump Station.1 The lower cost, lower maintenance, pump station type for these similar projects involved vertical turbine pumps with long shafts and several bowls. The pump bowls were located within either individual casings or a common deep circular wet well. A 1orizontal pipe or tunnel located at or near the minimum lake level delivered water from the lake to the vet well (or pump cans). For the Lake Powell Pump Station, this type of facility would involve a deep about 160') wet well and a long submerged horizontal intake tunnel to allow pumping at the lower
i '
nticipated lake levels. A schematic of such a facility is shown in Figure 5-4. ~
he cost of the wet well, submerged horizontal tunnel, screens, valving and operating equipment is •out $3 million depending on the pump station site conditions. The wet well is unusually deep sardless of which pump station location (North Lone Rock Road or Glen Canyon Dam) is used. •wever, the submerged horizontal tunnel is much shorter at the Glen Canyon Dam location due to the ep rock face into the lake next to the pump station.
olumbia River McNary Pump Station", for Agrinorthwest, (study & design) by Boyle Engineering Corp., 1991; 1ke Hodges Pump Station & Pipeline", for City of San Diego, (study) by Boyle Engineering Corp., 1994; "EB Project, (study and design) by Boyle Engineering Corp .I, 1990.
Powell Pipeline Study 37 Final Report, March 1995
\ I
5. O&M Costs, Energy Costs, and Pumping Efficiency
O&M Costs. Operations and maintenance costs are derived from multiple studies including the design text "Pumping Station Design", engineering experience, and a study published by ASCE on pump station O&M costs!. The former cites life cycle O&M costs as having a value equal to 5 to 12 percent of total construction cost. This translates to an annual O&M cost of about is about 0.4 to 1.0 percent of construction costs. This generally agrees with the ASCE Journal study which listed several pump stations (similar in size to the Lake Powell Pump Station) with O&M costs between 0.3 and 1.0 percent of construction costs2. Consequently, annual O&M costs for pump stations were set at 1% of pump station construction costs.
Energy Costs. A major cost factor in the Lake Powell Pipeline Project is the cost of electricity at the Lake Powell and Cockscomb Pump Stations. The power rates for both pump stations will likely be the wholesale rates ofGarkane Power which is the main power agency in Kane County, UT where both pump stations on the favored alignment are located. Garkane's wholesale power rates for users this size are currently at about 3.5 cents/kWh. Since the largest power supplier in neighboring Washington County also has similar wholesale rates (3.5 cents/kWh), this value was used as the cost of energy at all pump stations.
Pumping Efficiencies. Since the head fluctuation for each of the stations is not excessive (15% of TDH), system pumping efficiencies are assumed at 85%. This is the efficiency recommended by the US Corps of Engineers Hydropower manual for planning level studies which involve high head pumping in pumped storage projects3. This efficiency applies to projects with high heads (over 800 feet) and low head fluctuations (minimum to maximum head fluctuation are about 15% of maximum head).
lumping Station Design", Sanks, Bosserman, et al, pg 709, 1989. •umping Plant Operation & Maintenance Costs", ASCE Journal of Irrigation & Drainage, pg 37-58, Dec 1965. tydropower Engineering and Design", Engineer Manual, US Army Corps of Engineers, p. 7-31, 1985.
e Powell Pipeline Study 38 Final Report, March 1995
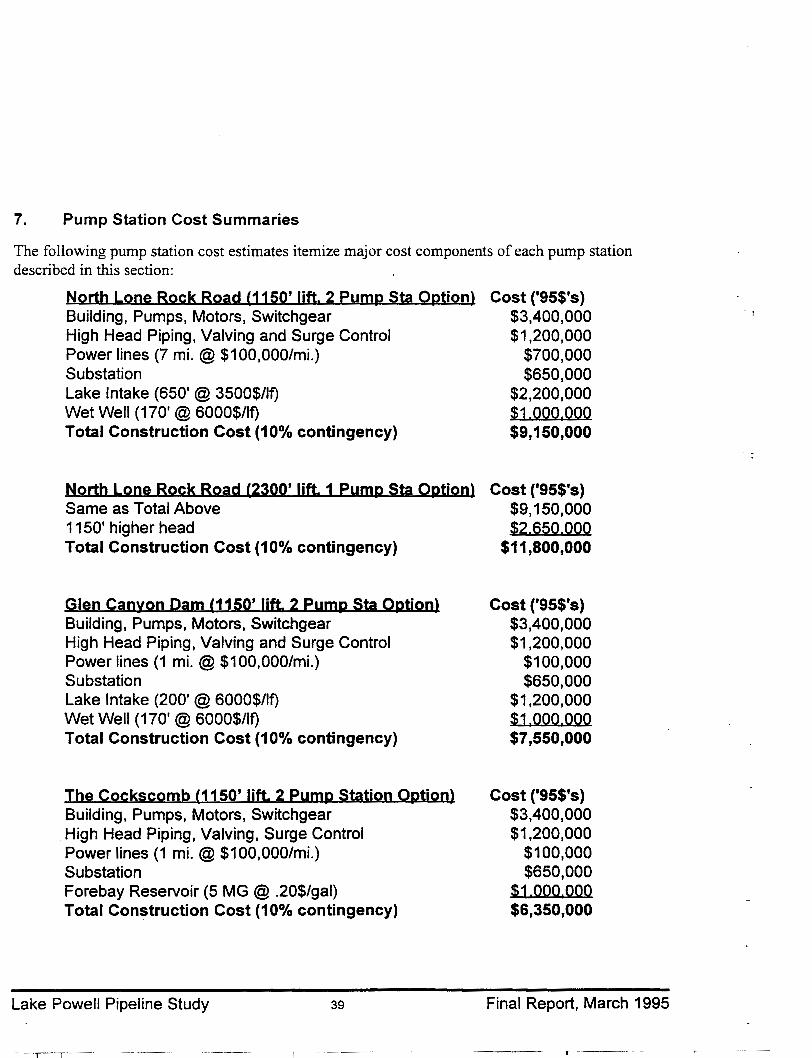
7. Pump Station Cost Summaries
The following pump station cost estimates itemize major cost components of each pump station described in this section:
North Lone Rock Road (1150' lift. 2 Pump Sta Option) Building, Pumps, Motors, Switchgear High Head Piping, Valving and Surge Control Power lines (7 mi.@ $100,000/mi.) Substation Lake Intake (650' @ 3500$/lf) Wet Well (170' @ 6000$/lf) Total Construction Cost (10% contingency)
North Lone Rock Road (2300' lift. 1 Pump Sta Option) Same as Total Above 1150' higher head Total Construction Cost (10% contingency)
Glen Canyon Dam (1150' lift. 2 Pump Sta Option) Building, Pumps, Motors, Switchgear High Head Piping, Valving and Surge Control Power lines (1 mi.@ $100,000/mi.) Substation Lake Intake (200' @ 6000$/lf) Wet Well (170'@ 6000$/lf) Total Construction Cost (10% contingency)
The Cockscomb (1150' lift. 2 Pump Station Option) Building, Pumps, Motors, Switchgear
. High Head Piping, Valving, Surge Control Power lines (1 mi.@ $100,000/mi.) Substation Forebay Reservoir (5 MG @ .20$/gal) Total Construction Cost (1 0% contingency)
Lake Powell Pipeline Study 39
Cost ('95$'s) $3,400,000 $1,200,000
$700,000 $650,000
$2,200,000 $1.000,000 $9,150,000
Cost ('95$'s) $9,150,000 $2.650.000
$11 ,800,000
Cost ('95$'s) $3,400,000 $1,200,000
$100,000 $650,000
$1,200,000 $1.000.000 $7,550,000
Cost ('95$'s) $3,400,000 $1,200,000
$100,000 $650,000
$1,000.000 $6,350,000
Final Report, March 1995
.-----------
Section 6- Hydrostation and Facilities
The hydrostation has been located beside Sand Hollow Reservoir at about elevation 3040' (the high water level of that proposed reservoir). Since the hydrostation is near the elevated terrain above Hurricane Cliffs, there are opportunities for designing the hydrostation as a peaking power facility. Normal operating heads are between 1750' and 2000' feet. These heads require a pelton wheel type turbine. This section describes the facilities, operations and costs for two alternate hydrostation concepts.
The key planning level issue for the hydrostation is the power rates (or power rate differentials) which apply through the 40 year life of the project. If, over the life of the project, peaking power can be sold in Washington County at rates substantially higher than average wholesale power rates, system operating costs might be entirely eliminated by designing the hydrostation as a peaking facility. This would involve adding a regulating reservoir atop Hurricane Cliffs, running the hydrostation only during the peak energy demand period of energy demand, and capturing higher power rates for the same energy generated. Thus, the two hydrostation concepts evaluated in this section are:
A. Continuous Power Generation (llMW Facility) B. Peaking Power Generation (33MW Facility)
A. Continuous Power Generation (11 MW Facility)
Hydrostation Facilities. This facility is quite small and compact. It includes a single 4' diameter pel ton wheel turbine and generator, piping, valving, controls, a powerhouse, a substation, and about a mile of power lines. Since the facilities are so simple and compact, and operating heads are so high, the unit construction costs are very low relative to other hydrogenating facilities with similar electrical generating capacity.
Operations. Operating the hydrostation as a continuous power generation facility (24 hours per day at 83 cfs and a constant head) is simple and reliable. Flows (and therefore upstream pressures) are 1
regulated by the valving which is typically part of the turbine unit therefore no additional bypass piping and pressure reducing facilities are needed. Surges are also regulated by the turbine unit. Thus the turbine itself would be used to maintain a backpressure on the system and keep the pipeline full of water back to the high points in the system.
2ke Powell Pipeline Study 40 Final Report, March 1995
Capital Costs. Total capital costs for the 11 MW (24 hr/day) continuously operating hydrostation are about $4,100,000 per the breakdown below.
11 MW Hydrostation Turbine, Generator, Switchgear Powerhouse, Piping, Valving, Lake Outlet Substation Power Lines (1 mi.@ $100,000/mi.)
Total
$2,100,000 $1,250,000
$650,000 $100.000
$4,100,000
\nnual O&M Costs. Annual operations and maintenance costs (not including energy revenues) are set tt 3% of construction costs ($120,000/yr). This is higher as a percentage of construction costs than most tydroelectric facilities. However, it is slightly below the US COE Hydropower Engineering and Design lfanual operation costs curve in the Appendix.
:enerating Efficiencies. Generating efficiencies for the heads (1750' to 2000') and head fluctuations ess than 15% ofTDH) on this station are likely in the 85% range (manufacturers indicate optimum IIbine/generator efficiencies at 88%). However, the US Corps of Engineers Hydropower Engineering td Design Manuals recommend using 82% for planning studies. Thus an 82% efficiency was used for e hydrostation.
. Peaking Power Generation (33 MW Facility)
fdrostation Facilities. The peaking power hydrostation (33 MW) has essentially the same mponents as the smaller facility (11 MW) just described. However, it also requires an elevated :ulating reservoir and upsized piping between the hydrostation and the regulating reservoir. Although re are other sites for an elevated regulating reservoir, none is so close to the hydrostation and at the >ropriate elevation (5000') and size (110 acre feet) as a site four miles south of Frog Hollow and one e east of Hurricane Cliffs (this reservoir site favors the South Little Creek Mountain pipeline ~ent). This peaking power hydrostation would also require a larger pipe (in the order of 69" meter to keep velocities below 1 0 feet per second) for the 6 miles between the regulating reservoir the 3 3 MW hydrostation.
erations. Flows delivered at 83 cfs to the elevated regulating reservoir would be collected over a 24 r period and then released at 249 cfs to generate power over an 8 hour period. Flows at the rostation would be regulated by the valving at the turbine unit. Flows at the regulating reservoir ht also be regulated at the inlet to the reservoir to avoid over pressurizing, draining the upstream t1g or overflowing the regulating reservoir.
~ Powell Pipeline Study 41 Final Report, March 1995
\ I
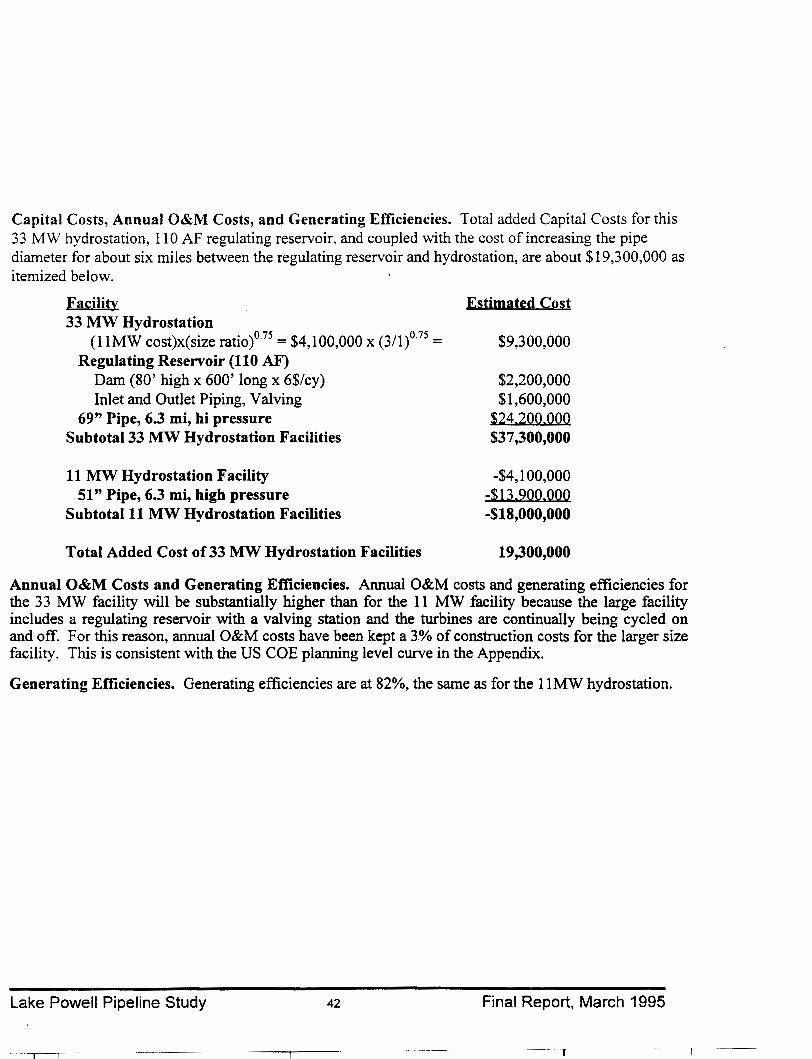
Capital Costs, Annual O&M Costs, and Generating Efficiencies. Total added Capital Costs for this 33 MW hydrostation, 110 AF regulating reservoir, and coupled with the cost of increasing the pipe diameter for about six miles between the regulating reservoir and hydrostation, are about $19,300,000 as itemized below.
Facility 33 MW Hydrostation
(llMW cost)x(size ratio)0.75 = $4,100,000 x (3/1)0
·75
=
Regulating Reservoir (11 0 AF) Dam (80' high x 600' long x 6$/cy) Inlet and Outlet Piping, V alving
69" Pipe, 6.3 mi, hi pressure Subtotal 33 MW Hydrostation Facilities
11 MW Hydrostation Facility 51" Pipe, 6.3 mi, high pressure
Subtotalll MW Hydrostation Facilities
Total Added Cost of33 MW Hydrostation Facilities
Estimated Cost
$9,300,000
$2,200,000 $1,600,000
$24.200.000 $37,300,000
-$4, 100,000 -$13.900.000 -$18,000,000
19,300,000
Annual O&M Costs and Generating Efficiencies. Annual O&M costs and generating efficiencies for the 3 3 MW facility will be substantially higher than for the 11 MW facility because the large facility includes a regulating reservoir with a valving station and the turbines are continually being cycled on and off. For this reason, annual O&M costs have been kept a 3% of construction costs for the larger size facility. This is consistent with the US COE planning level curve in the Appendix.
Generating Efficiencies. Generating efficiencies are at 82%, the same as for the llMW hydrostation.
Lake Powell Pipeline Study 42 Final Report, March 1995
Section 7 - Results and Project Costs
A. Overview of Project Costs
An overview of this section shows that estimated costs for the favored project alternatives are:
Table 7-1. Overview of Lake Powell Pipeline Project Costs
Capital Costs1
Unit Water Costs1,2.J,4
Annual O&M Costs1'4
Assumptions: I) 60,000 AF/yr, 2) 4.13% tnterest, 3} 40 yr hfe, 4) the lower unit costs assume hydropower is sold at peaking electrical rates 3¢/kWh higher than power rates for pumping
$187 to $212 Million
187 to 223 $/ AF
$0 to $3 millionlyr
These unit water costs are below those of other local and regional M&I water projects currently being planned and constructed. For instance, Central Utah Water Conservancy District (CUWCD) engineers indicate planning costs for CUP M&I water are at about 285 $/AF for similar assumptions (4.13%, 40 yr life). Las Vegas and southern California M&I water projects, now in planning or construction, are typically over 300 $1 AF for these interest rate assumptions.
This section summarizes evaluation results, project costs and environmental issues associated with each of the project options investigated. These include:
A. Overview of Project Costs B. Pipeline Alignment Alternatives C. Pipeline Diameter Alternatives D. Pump Station Alternatives E. Hydrostation Alternatives and Power Rate Impacts
A detailed one page breakdown of the costs for each project alternative is included in the Appendix.
3. Pipeline Alignment Alternatives
stimated project costs and potential environmental concerns for each pipeline alignment alternative bulated below. Profiles for the alternate alignments are shown in Figure 4-2. Tabulated costs assume ~ following facilities and electrical rates:
• Two Pump Stations (at North Lone Rock Road and the Cockscomb) • A 51" Diameter Pipe (for the full length of the project) • An 11 MW Hydrostation • Pumping Power Costs ~d hydropower Revenues are 3.5 ¢/kWh
~ Powell Pipeline Study 43 Final Report, March 1995
\ \
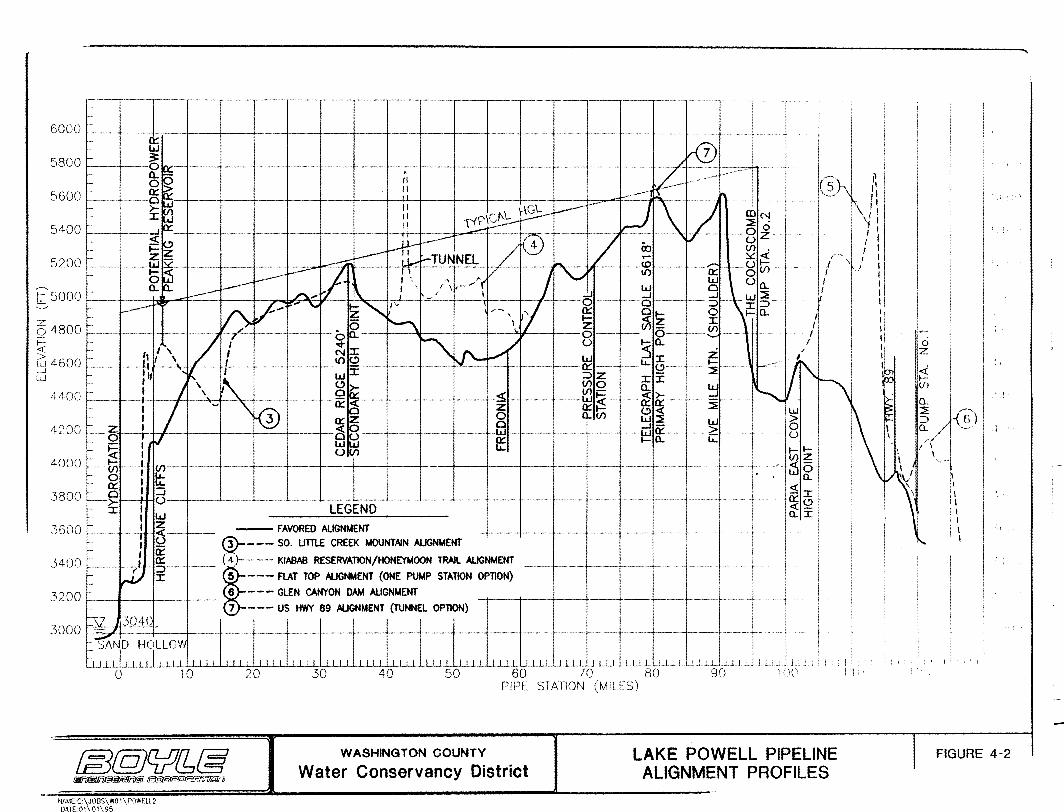
6000
;--- ---~-r~ ---- --~~-~- -~-~-~--~---------------- ~----~~
~-~~- ----- ~- 1--- ~---- ~-~- ~------~ ~~----~--
5800
5600
5400
5200
L ---~~ __ ---h-- __ __ _ -~kD, __ (l. ~ ;, . . • k .-- ~
- ~ II ---- ---- C~)\ 1\ 0 ~-+-- --c--- ----.l.L --1--• •-'" D --~-- n •~ I'\~~ >- U \1 L l.--- -- ~ I I II 11 f\L ~- Ill N I I
II ~~;;__;;- ~ 0 \1 I c---- c-----1 · -- ~--0 z _ 1 I
-_______ ffi _-. __.- ~;...TUNNEL /' ~'--' t... ~ ~ ~ r. , / l
Esooo
$~ --fl-- '4) / • 0 1 I
,_ -- 1- :.--- ~ 1 \ J '\.._; -- -~ -Q:: ~ -- <.> (f) - / . / I 0 1---- I \ ' '"( / W 8 1 I
i- £l. ,.--- """' \ I ' I\,--" W 0 0.. t I f.-~-- ,. _l I ..:.J -1 -1 ~ I -- __ V ~,.., "" ,_"I'· ~~ o----r---o-----:::>-~-~:::>- 1
6 4800 r -- V> ,...... Z ...-~, ' e: 01- 0 f- 0.. I 11
_. 0 "'-'\. l Z ~~ ~ I q r-- -- ,, , , / / -~ ~ '""J'-.~..,..~ 8 ~--~- ---~ 6:-- ---~ --- / 1 :~ ~ Lu 4600 # ' i "''-' "' .._x ,___ f -~- -,,, If-.. ~,- --------wi___ ~z----- Q·--- ~---- '"""'- \~ ~_j
LcJ
4400
.3200
3000
<1-200
I \ 0~ VlO II W 1\ - I I \ 0 (f)- a.. _J ,---r--~ --- -12 <( ---::!;i-~- -W ~- -~ &;--t--- -- """"'- .
I V- " "~ 0 Z ~~ <( :0 ~~ ~ I 3 0 O..Vl 0 w ~ o::z w~ > . ~~5-+ ~ -----~ 8---~ e jj 12- --- ~ n ~- ~ 8 \ - - 1 w4) o:: ,_a.. u.. , ~ I ()(/) I.J.. ,_,_ I - ,_ c---+ (/) ~ -:g I ~ - ----- ----r- - -- ~ : L5 ~ .I
-·· 0:: I U... - 0 I :::J :S;I ,......_>- H u -- ----~-- ---- --~~-~- ~- --- -- ~ o:: o r:= :r I w LEGEND ct I ,... __ --t ~- -- -FAVORED ALIGNMENT --- --- -- -- --- - ~- I - 1 5::? <»---- SO. UTTL£ CREEK MOUNTAIN ALIGNMENT
,- 0:: ~ j 0:: (4 }-- ··- --- KIABAB RESERVATION/HONEYMOON TRAIL ALIGNMENT s---W,. j!---I~ ~ --- flAT 1\lP ltJGNioiENT (ONE PUIIP STATION OI'TIOI<) --~~-- -- - --- - - - -
r- 6 --- GLEN CANYON DAM AUGNMENT -!----- --1----t----~-+ .. ~~
t-- 7 --- US HWY 89 AUGNMENT (TUNNa OP110N) ¥j[,JP·tf:.
-- --~- ---- ~-~ -- --- .. - ..
4000
3800
3600
3400
; SANID HC,LLO\!. U...LLI _ 1 1 1 1 1 1 I I I I I I I I I I I I I I I I I I I I ! I I ! I I I I I I I I I I ! I I I ! I 1J LJ.LU I I I I I I I I LLLLI,-~.LLJ L I
0 10 20 40 60 70 80 I It 9() I 1 1(1 30 50 PIPE STATION (MILES)
@@C!zfl~§ WASHINGTON COUNTY
Water Conservancy District LAKE POWELL PIPELINE ALIGNMENT PROFILES ~~~lf!IJI77J
NAME:C\JOBS\ WO I\POWEll2 O~T£:01\01\95
0 z
~ (f) I
~/~1 '( I
I I \
·'\ ~ :I (I 1\ :I . I i \ ' '
I I
I I :I' I I!
I
1 ~ I
FIGURE 4-2
~
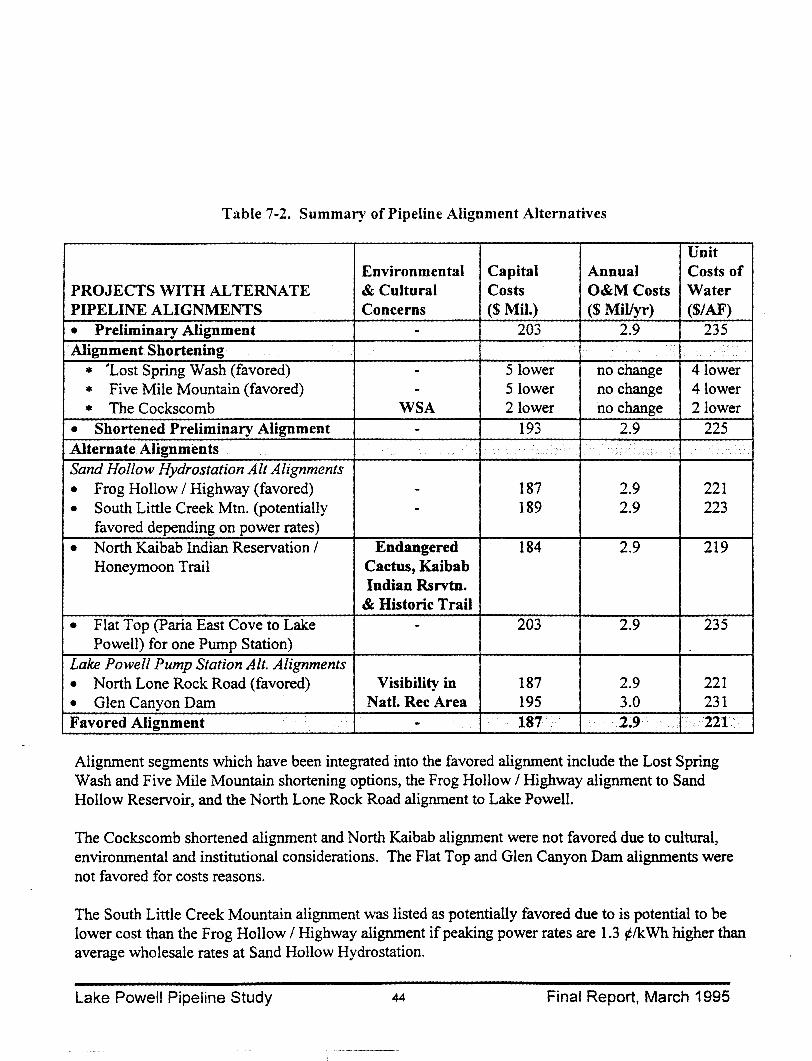
Table 7-2. Summary of Pipeline Alignment Alternatives
Unit Environmental Capital Annual Costs of
PROJECTS WITHAL TERNATE & Cultural Costs O&MCosts Water PIPELINE ALIGNMENTS Concerns ($Mil.) ($ Millyr) ($/AF)
• Preliminary Alignment - 203 2.9 235 Alignment Shortening
* 'Lost Spring Wash (favored) - Slower no change 4lower
* Five Mile Mountain (favored) - 5 lower no change 4lower
* The Cockscomb WSA 2lower no change 21ower
• Shortened Preliminary Alignment - 193 2.9 225 Alternate Alignments Sand Hollow Hydrostation Alt Alignments
• Frog Hollow I Highway (favored) - 187 2.9 221
• South Little Creek Mtn. (potentially - 189 2.9 223 favored depending on power rates)
• North Kaibab Indian Reservation I Endangered 184 2.9 219 Honeymoon Trail Cactus, Kaibab
Indian Rsrvtn. & Historic Trail
• Flat Top (Paria East Cove to Lake - 203 2.9 235 Powell) for one Pump Station)
Lake Powell Pump Station Alt. Alignments
• North Lone Rock Road (favored) Visibility in 187 2.9 221
• Glen Canyon Dam Natl. Rec Area 195 3.0 231 Favored Alignment - 187 2.9 221•··
Alignment segments which have been integrated into the favored alignment include the Lost Spring Wash and Five Mile Mountain shortening options, the Frog Hollow I Highway alignment to Sand Hollow Reservoir, and the North Lone Rock Road alignment to Lake Powell.
The Cockscomb shortened alignment and North Kaibab alignment were not favored due to cultural, environmental and institutional considerations. The Flat Top and Glen Canyon Dam alignments were not favored for costs reasons.
The South Little Creek Mountain alignment was listed as potentially favored due to is potential to be lower cost than the Frog Hollow I Highway alignment if peaking power rates are 1.3 ¢/kWh higher than average wholesale rates at Sand Hollow Hydrostation.
Lake Powell Pipeline Study 44 Final Report, March 1995
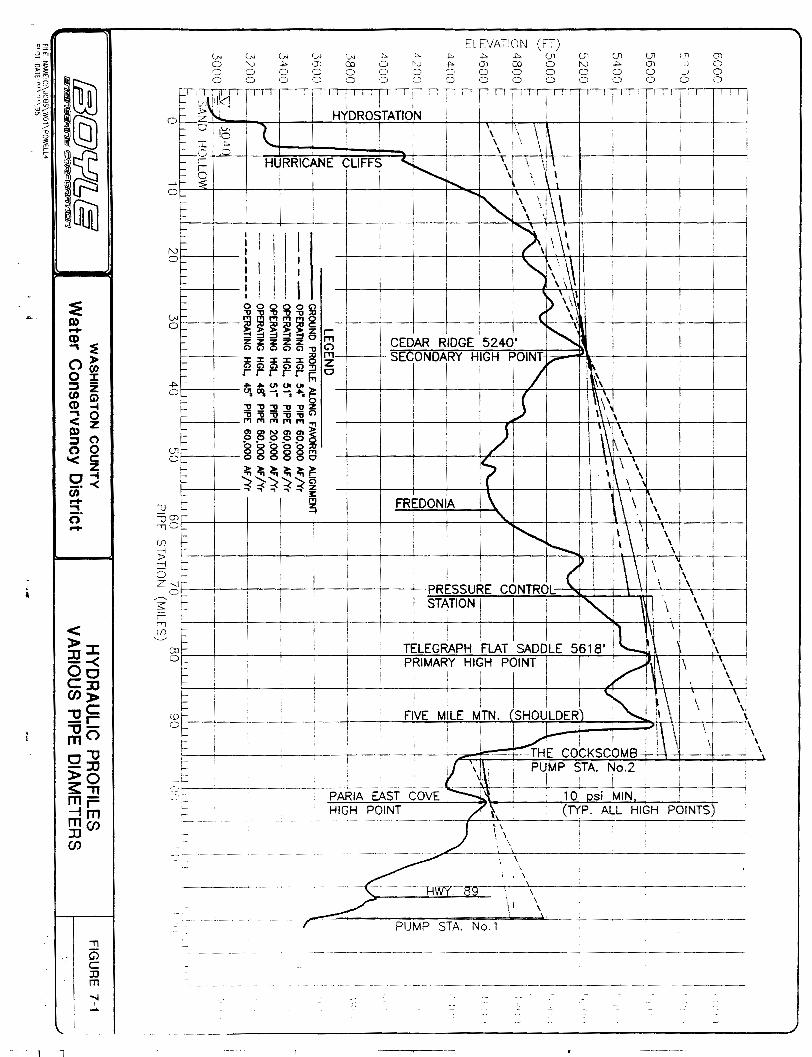
l
~ D) -<D .., ~ o> 0 ~ ~ -(h z <D ~ .., 0 < z D) ~ 0 0 0 '< c z o-t -· -< (h -.., o· -
, G5 c: II m "'-.!
I -
ELEVATION (FT) (.N (.N 0 :v 0 0 0 0
JJ +-0 0
(.N Q)
0 0
I I I
<..N +> "'" +> +> (X) 0 ~J +> ())
0 0 0 0 0 0 0 C) ~ 0
i ! I , I I
I I
I I
PARIA EAST COVE ~'\ HIGH POINT / \~
---~~~~---~--~--~--
\\ ' \
+> (_]1 (X) 0 0 0 0 0
I I , I 1 I
(_)1 N 0 0
I
(_)1 (_)1
+> Q)
0 0 0 0
I I I
l 1 I
10 osi MIN '
( ~,
'J :_; 0
I
(TYP. ALL HIGH POINTS
())
0 0 0
. I
I
I I
I
I !
~~~~~--------- - ----~ ---~---~ -~·~---------------------------
-- f!Wl'.-8'9
\ \ \
: ' \
ti i
\ \ \ --= ___../'
:_:_- -----~----- /..,--=:;'=====;P~U"':7M~P~S~T"'"A~. "':'N"""'o=."""'1 =-=.,k_-------~--------
I
I I
I I
- - ~ --- --~------------------------------.,..,
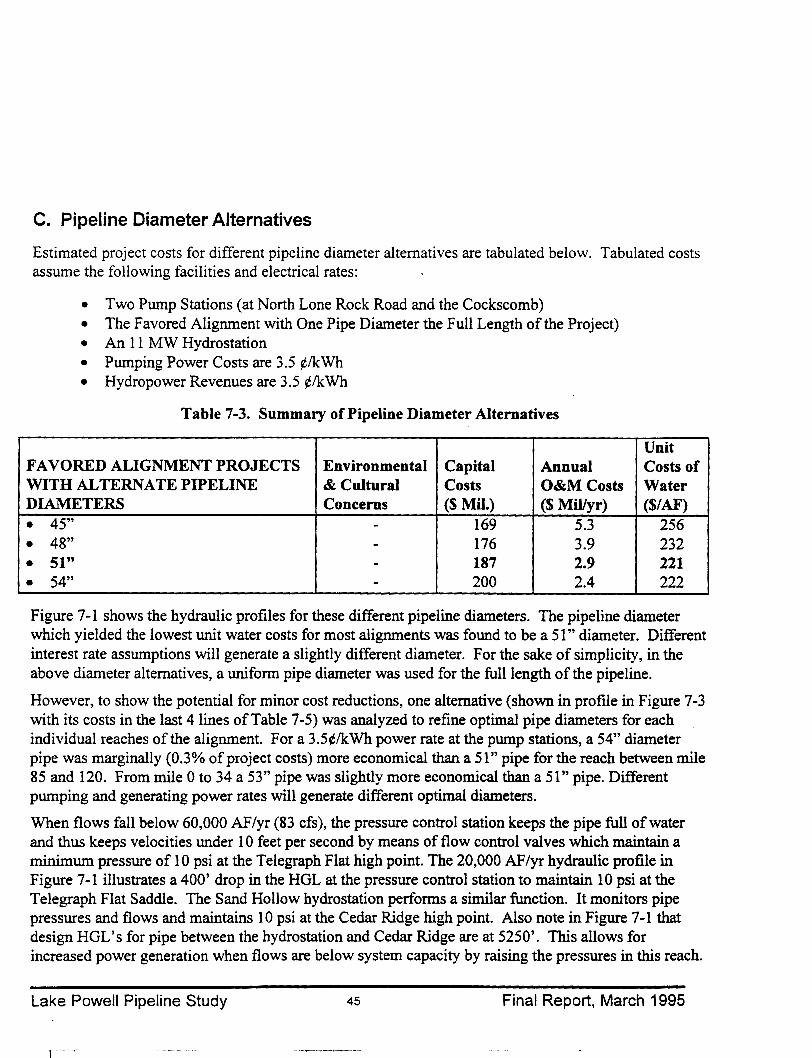
C. Pipeline Diameter Alternatives
Estimated project costs for different pipeline diameter alternatives are tabulated below. Tabulated costs assume the following facilities and electrical rates:
• Two Pump Stations (at North Lone Rock Road and the Cockscomb) • The Favored Alignment with One Pipe Diameter the Full Length of the Project) • An 11 MW Hydrostation • Pumping Power Costs are 3.5 ¢/kWh • Hydropower Revenues are 3.5 ¢/kWh
Table 7-3. Summary of Pipeline Diameter Alternatives
Unit FAVORED ALIGNMENT PROJECTS Environmental Capital Annual Costs of WITHAL TERN ATE PIPELINE & Cultural Costs O&MCosts Water DIAMETERS Concerns ($Mil.) ($ Millyr) ($/AF)
• 45" - 169 5.3 256
• 48" - 176 3.9 232
• 51" - 187 2.9 221 • 54" - 200 2.4 222
Figure 7-1 shows the hydraulic profiles for these different pipeline diameters. The pipeline diameter which yielded the lowest unit water costs for most alignments was found to be a 51" diameter. Different interest rate assumptions will generate a slightly different diameter. For the sake of simplicity, in the above diameter alternatives, a uniform pipe diameter was used for the full length of the pipeline.
However, to show the potential for minor cost reductions, one alternative (shown in profile in Figure 7-3 with its costs in the last 4lines of Table 7-5) was analyzed to refine optimal pipe diameters for each individual reaches of the alignment. For a 3.5¢/k.Wh power rate at the pump stations, a 54" diameter pipe was marginally (0.3% of project costs) more economical than a 51" pipe for the reach between mile 85 and 120. From mile 0 to 34 a 53" pipe was slightly more economical than a 51" pipe. Different pumping and generating power rates will generate different optimal diameters.
When flows fall below 60,000 AF/yr (83 cfs), the pressure control station keeps the pipe full of water and thus keeps velocities under 10 feet per second by means of flow control valves which maintain a minimum pressure of 10 psi at the Telegraph Flat high point. The 20,000 AF /yr hydraulic profile in Figure 7-1 illustrates a 400' drop in the HGL at the pressure control station to maintain 10 psi at the Telegraph Flat Saddle. The Sand Hollow hydrostation performs a similar function. It monitors pipe pressures and flows and maintains 10 psi at the Cedar Ridge high point. Also note in Figure 7-1 that design HGL 's for pipe between the hydrostation and Cedar Ridge are at 5250'. This allows for increased power generation when flows are below system capacity by raising the pressures in this reach.
Lake Powell Pipeline Study 45 Final Report, March 1995
-r
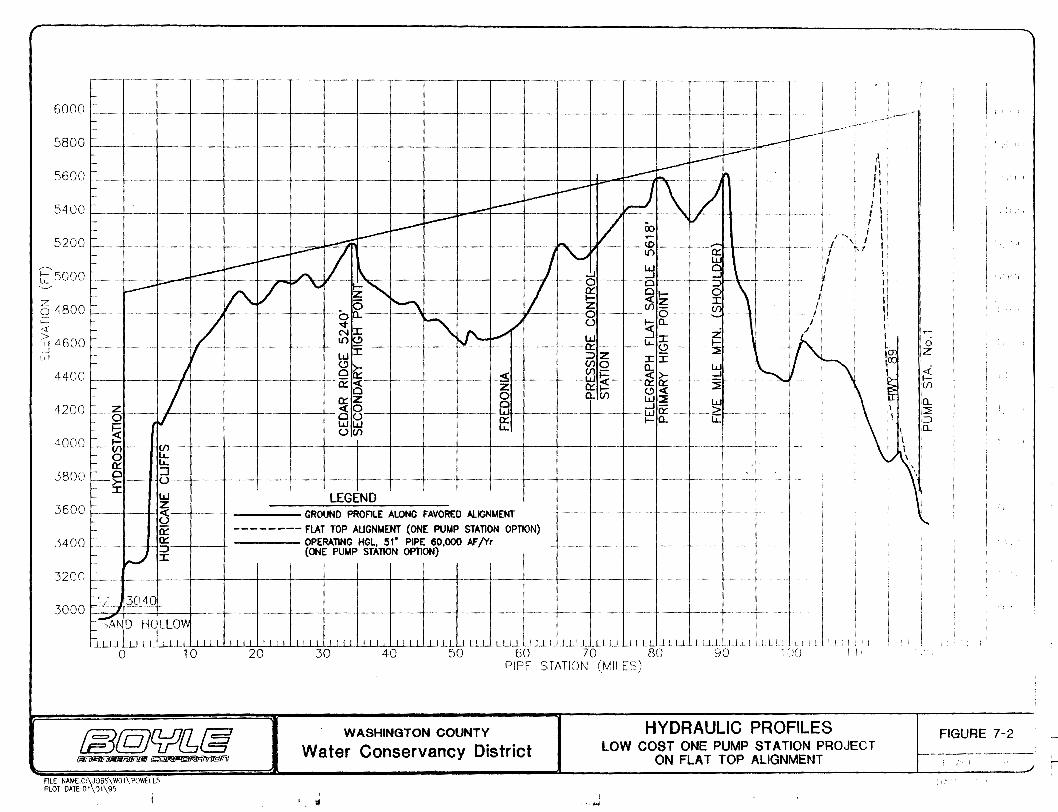
·~·- ·r-- ·---r-- -~------r··-~· ~-----r-- ---,.----------..---- 1--- -T-- --- ·---
~ I
6000 r·---5800
---l-----1----+--+- --1--t--- I I +--+---+---+--~---~---- ·-·* .~--~--·
5600W_l __
::::[1_~
-~- .. -r' ,, ,, It I I I I I I
, I I I 1
/ ···,l ! I I I' .I J I I ~
I I
7 I g 4800 \! f;;: If > w ,, LJJ 4600 --0::- -- II J ~z 1~
~0 ~: ~-4400 --W~-0::1-' Q_(/)
4200 f=._ -~- -- --+- -·-~
4000 t t:; - (/) -- ---l-0 1.1.. a:: ~
.3800 -§2 -- d---+----+----+------t--t-- +-!-----+------+----~+--
--·· ----+---- --···~ -- --- -
---- +---::r:
-~--
~j~j LEGEND 3 600 ~---~ --l-J() · GROUND PROFILE ALONG FAVORED ALIGNMENT Ci:: --------FlAT TOP AUGNMENT (ONE PUMP STATION OPTION)
3400 L-----t----.f.-t~ OPERATING HGL, 51" PIPE 60,000 AF/Yr ~ lr-/ II (ONE PUMP STATION OPTION)
-·---- +----+---- ---+- -----
-+-------+ - -+---
3200 1 1 -----+- 1----- -~+---+---+-----------+-------t---·-- ~---
~'?~7
(\!)g l I I 3000~ ':!.··- -~- l---1- +----+---+---+-----+--+------~0 HOLLOW
f I' I
I I
I I I, I I I II I I I I I I I_ LL.LLLJ I I I I I I I I I I I I I I I I I I I I I I I I I lllllllll111111111.lLLUJ.u.J..Llu I 1 .LLll.LLLJ L/ .LJ J 1 LJ I I I I I I II I I
0 10
@@qjlf1§ FILE NAME:C:\JOBS\W01\POWHL5 PLOT OATE:Ol\01\95
i
... ,...,_._,..,...,...,,,.,,
20 30 40 su 60 70 80 90 I f)': I I I' PIPE SfATION (MILES)
WASHINGTON COUNTY
Water Conservancy District
I II ~ , .. ""'
HYDRAULIC PROFILES LOW COST ONE PUMP STATION PROJECT
ON FLAT TOP ALIGNMENT
10 (z
~~ (/)
(L
::2 ~ (L
'
!
J!
I I I
FIGURE 7-2
1•1 II r-
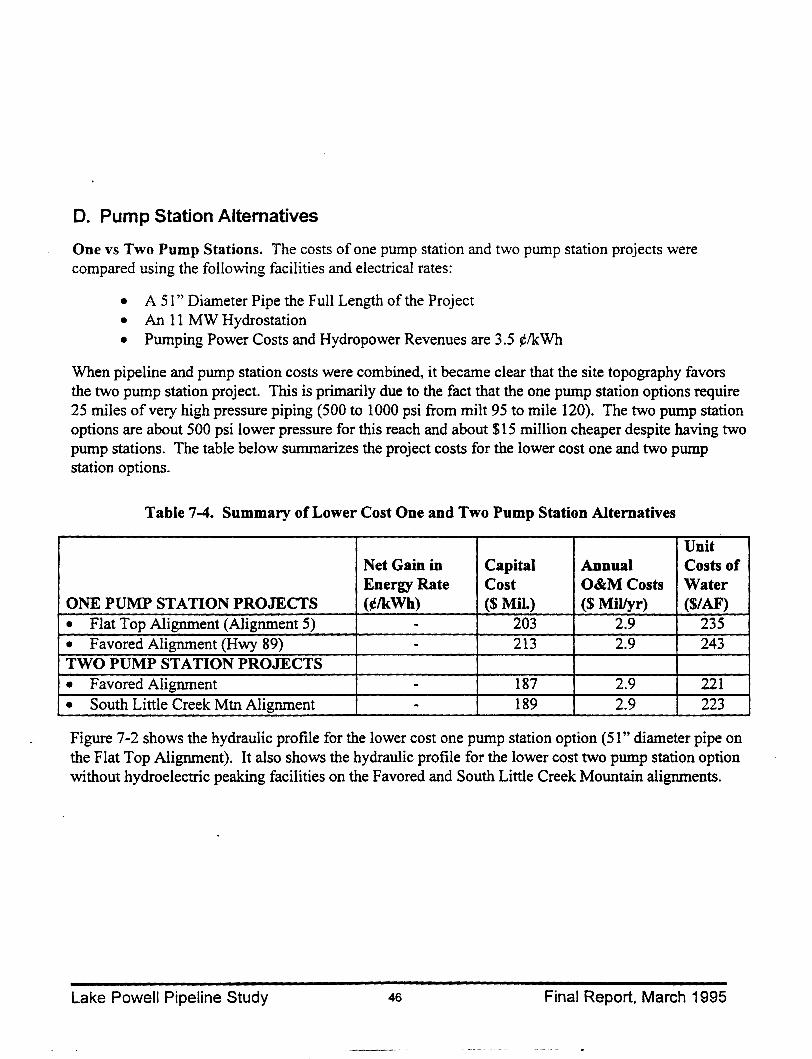
D. Pump Station Alternatives
One vs Two Pump Stations. The costs of one pump station and two pump station projects were compared using the following facilities and electrical rates:
• A 51" Diameter Pipe the Full Length of the Project • An 11 MW Hydrostation • Pumping Power Costs and Hydropower Revenues are 3.5 ¢/kWh
When pipeline and pump station costs were combined, it became clear that the site topography favors the two pump station project. This is primarily due to the fact that the one pump station options require 25 miles of very high pressure piping (500 to 1000 psi from milt 95 to mile 120). The two pump station options are about 500 psi lower pressure for this reach and about $15 million cheaper despite having two pump stations. The table below summarizes the project costs for the lower cost one and two pump station options.
Table 7-4. Summary of Lower Cost One and Two Pump Station Alternatives
Unit Net Gain in Capital Annual Costs of Energy Rate Cost O&M Costs Water
ONE PUMP STATION PROJECTS (¢/kWh) ($Mil.) ($ Millyr) ($/AF)
• Flat Top Alignment (Alignment 5) - 203 2.9 235
• Favored Alignment (Hwy 89) - 213 2.9 243 TWO PUMP STATION PROJECTS
• Favored Alignment - 187 2.9 221
• South Little Creek Mtn Alignment - 189 2.9 223
Figure 7-2 shows the hydraulic profile for the lower cost one pump station option (51" diameter pipe on the Flat Top Alignment). It also shows the hydraulic profile for the lower cost two pump station option without hydroelectric peaking facilities on the Favored and South Little Creek Mountain alignments.
Lake Powell Pipeline Study 46 Final Report, March 1995
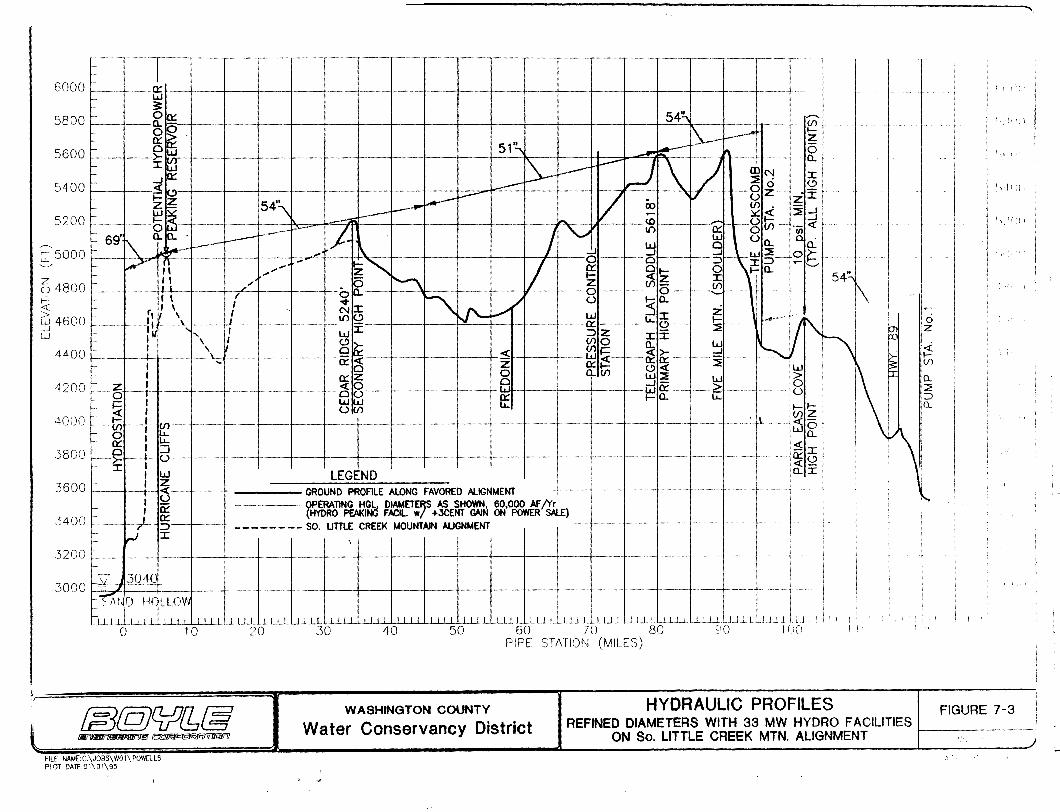
l
6000
5800
5600
5400
5200
[sooo
~ 4800 F <t:
~ 4600 w
4400
4200
4000
3800
3600
3400
3200
3000
~~~-~~
I t--
-f--- t---0::
LLJ ;t Oo::
-- --0.. oo a::> oo:: >-w :c!iJ -10::
~- f----<( i=~ Z-
---w::.:::
--tsi5 69' a.a.·
1\ ~ !r'*--~-~).' II '-
r- II 1---- --~--1-~- ----
I \ r I \ I \
t---ft~--~ •" ' \ I \
t--~ ---~----~~----- --'1.-.... I I
z I --o --t- -~-
- t= I
;! I t----L (/) ----(/)
0 'u.. 0:: ILL. 0 I:::J
~-~>- i--+-u-- ---- :c I
IW t- I Z -- ---.-- <(
t!:2 t- I 0:: t-
-' 0:: 1----t- ,.T?. r---~
--~.::.ct-1(
I- :. t..t:Jo- f·trJLt.oY. 1-ll~~LU I I I I I
0 10
- --,--- ~--,--- -~
t---~- --~~- -----
54'; ,....... ----·- ---- l-~ (j)
~-- ----··"" f-z
51~ ~- 6 .... ~--·-
~
~ \ ) -0..
ID "! J: ~
- ---- 1--0 0 <.:)
'' ~~ v J (.) z- zi 54\ i---·"' ix> (j)
~ ~--~ ---- -- .- ::.::: -- _: ___ ... - .J. ---- ;--v (l) -- (.)
_J
I() 0:: 0 (j) -- ·- <( ~--- w (.) ~ .
... \ ..:.J w g a. 0..
f---5 - _w :::ii 0(: ~~ "' L 0
c--- t-- -- :::> :::>--,...... ~ g: J: .- '-"'
0 ~ ~ 1- a.
54'!, . f.-(/ --c, ~--~ --- ---~ ~ 5- --~ t----- ! I
0.. ! I I '<t r'\ ,I 0 I ~@ lf'-~ W ~ J: z I I·
v~ i ~ _Lt.. ji - -- f-- -- - --f---· --- ~ -~ - 0:: -- (.!)--I WJ: :::> z J: x J C) >- (/) 0 ------ Q~---1---- ~H---- -- f{l ~-t---~ &:-0:: Cl z 0:: tn (.!) <(
o::z 0 0.. ~ ~ ----- ---------- -- C§IR - ,__ -- --->----t- 8 0: -- ----w wjW a:: 1- 0.. (.)(}) lL.
-~- 1------- ---- -- ·~--- --- --1---- ---~
1--- -- f----
--~ ,,;IIIII"""""""'
u. ~~ t--=
~
LLJ -- ~ -~~-- --
LL.
~ ~ - -
. ~ .
1\1 1 I tr
~ ~ 0 (.)
I
~--~-- I (.f)Z
o::o ' <(_ I
0 z
~ (/)
0... ::2 ::> Q
LEGEND O..:t: I
I X GROUND PROFILE ALONG FAVORED ALIGNMENT - -- - --- --- ,------ t--- ~
-·-~--·~-- ~ERATING HGL DIAMET~ f.S SHOWN, 60,000 Af/fr HYORO PEAI<ING F'ACIL. w +3CENT GAIN ON POWER SALE)
--------SO. UTTLE CREEK MOUNTAIN AUGNMENT --- 1----- r---·- -~-- f-- ---
·. ------- ~""- ---·--- -·--- t---
-- --- -~ ---- -- ---- ---
I II I I I ILJ_ I I I I I I I I I I I I I I I I I I I I I I I IJ_U_UJJLiLUJ....LUJ j_JJ_j_ .LLLl ~I.JJ 1 I I I' I J I I
20 30 40 50 60 70 80 1"::10 II I() I!
PIPE STATION (MILES)
HYDRAULIC PROFILES
...,
I . '"I I I
I,, I·,
' 11.1
'.I
I
i;
: II I
'I ',i I
FIGURE 7-3 @@r!zjl{1§ ~~
WASHINGTON COUNTY
Water Conservancy District REFINED DIAMETERS WITH 33 MW HYDRO FACILITIES I ON So. LITTLE CREEK MTN. ALIGNMENT ~-----, .. -. -
FILE NAtJE:C:\JOBS\WOI\POWHL6 PLOT DATE:01\01\95
-
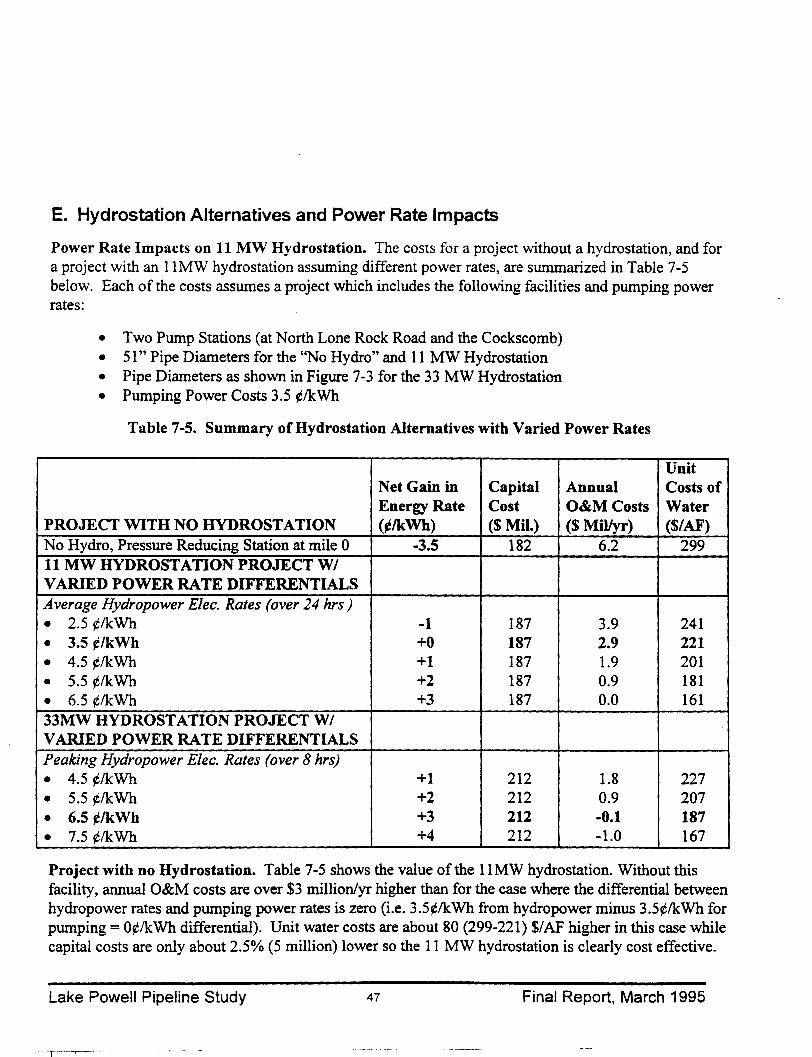
E. Hydrostation Alternatives and Power Rate Impacts
Power Rate Impacts on 11 MW Hydrostation. The costs for a project without a hydrostation, and for a project with an llMW hydrostation assuming different power rates, are summarized in Table 7-5 below. Each of the costs assumes a project which includes the following facilities and pumping power rates:
• Two Pump Stations (at North Lone Rock Road and the Cockscomb) • 51" Pipe Diameters for the "No Hydro" and 11 MW Hydrostation • Pipe Diameters as shown in Figure 7-3 for the 33 MW Hydrostation • Pumping Power Costs 3.5 ¢/kWh
Table 7-5. Summary ofHydrostation Alternatives with Varied Power Rates
Unit Net Gain in Capital Annual Costs of Energy Rate Cost O&MCosts Water
PROJECT WITH NO HYDROSTATION (¢/kWh) ($Mil.) ($ Millyr) ($/AF) No Hydro, Pressure Reducing Station at mile 0 -3.5 182 6.2 299 11 MW HYDROSTATION PROJECT W/ VARIED POWER RATE DIFFERENTIALS Average Hydropower Elec. Rates (over 24 hrs)
• 2.5 ¢/kWh -1 187 3.9 241
• 3.5 ¢/kWh +0 187 2.9 221
• 4.5 ¢/kWh +1 187 1.9 201 • 5.5 ¢/kWh +2 187 0.9 181
• 6.5 ¢/k\Vh +3 187 0.0 161 33MW HYDROSTATION PROJECT WI VARIED POWER RATE DIFFERENTIALS Peaking Hydropower Elec. Rates (over 8 hrs)
• 4.5 ¢/kWh +1 212 1.8 227
• 5.5 ¢/kWh +2 212 0.9 207
• 6.5 ¢/kWh +3 212 -0.1 187
• 7.5 ¢/k\Vh +4 212 -1.0 167
Project with no Hydrostation. Table 7-5 shows the value of the llMW hydrostation. Without this facility, annual O&M costs are over $3 million/yr higher than for the case where the differential between hydropower rates and pumping power rates is zero (i.e. 3.5¢/k:Wh from hydropower minus 3.5¢/k:Wh for pumping= 0¢/kWh differential). Unit water costs are about 80 (299-221) $/AF higher in this case while capital costs are only about 2.5% (5 million) lower so the 11 MW hydrostation is clearly cost effective.
Lake Powell Pipeline Study 47 Final Report, March 1995
11 MW Hydrostation and Power Rate Impacts. Based on the current published wholesale power rates from Garkane Power and the City of St. George, it appears that the power costs for the pump stations will be about 3.5¢/kWh and the power revenues from the llMW hydrostation will be about 3.5¢/kV/h. Thus, the differential power rates appear to be at 0.0¢/k\Vh. However, other hydropower revenue rates were checked for their impact on project costs. These are presented in Table 7-5. Note that for each 1¢/k\Vh increase in hydropower rates over pumping power rates, unit water costs drop by about 20 $/AF and operating cost drop by about $1 million/yr.
33 MW Peaking Power Hydrostation. The potential exists for including peaking power facilities as part ofthe hydrostation. The hydraulic profile for such an option is shown in Figure 7-3. If power can be sold during an 8 hour peaking period at rates about 1.3¢/k\Vh (interpolated from data in Table 7-5 above) higher than they are during an average 24 hour period, it appears unit costs of water may be lowered further by designing the hydrostation as a peaking facility. Note in Table 7-5 that a 1¢/kWh increase in revenues from peaking power (over average power) slightly increases unit water costs but significantly lowers operating costs (by $1 million/yr). If peaking power can be sold at 3¢/kWh higher rate than average power, system operating costs essentially go to zero.
The 33 MW peaking hydrostation appears to be a promising option to reduce operating costs, and possibly unit water costs. The 33 MW facility would constitute less than a third of the total electrical load, or half of the peaking load, now in Washington County. It would be a much smaller percentage of Washington County's total electrical load in the 15 to 40 year future when it would be in operation.
Lake Powell Pipeline Study 48 Final Report, March 1995
Appendix
Appendix A - Project Summary Sheets
A one-page project summary sheet was prepared for each project alternative. Each cost summary sheet includes a detailed itemization of pipeline hydraulic operations and cost components by mile station. A description of for each column of data shown in these cost summary sheets is included below. This is followed by a set of the project summary sheets:
Pipeline Costs and Hydraulic Gradients Columns and Data Descriptions
Station (miles) Pipe Diam (in) Vel. (fps) HGL slope(%) Base Pipe Cost
($/If/in)
Ground Elev (ft) HGL Elev (ft)
Ave Press. (psi)
Add for Hi Press Add for Rock
Add for Grdwtr
Slope Mult.
Appurt. Mult.
Unit Pipe. Cost
The pipeline station in miles from Sand Hollow Reservoir. The inside diameter of the pipeline in inches. The flow velocity in the pipeline in feet per second. The slope of the HGL (Hydraulic Grade Line). The basic cost of fabricating and installing the pipe in dollars per linear foot of pipe divided by pipe diameter in inches. This value increases with diameter and comes from the Lake Powell Pipeline cost line in Figure 3-2. This (and other itemized costs) includes a built-in 10% contingency. The ground elevation at the station identified in column 1. The elevation (in feet) of the HGL at the station identified in column I. This column shows operating HGL's when the project is at design flow (60,000 AF/yr, or, in one case, at 20,000 AF/yr as identified at the top of that sheet). It includes HGL's at the hydraulic control points including high points, pump stations, the hydrostation and the pressure reducing station. This is the basis for the hydraulic gradients in Figures 3-1, 4-2, 7-1, 7-2, and 7-3. The average pipe pressure (in pounds per square inch) between the same line and the previous line stations identified in column 1. The unit cost (in dollars per linear foot per inch diameter) added for high pressures. The unit cost (in dollars per linear foot per inch diameter) added for rock or marginally rippable soils. The unit cost (in dollars per linear foot per inch diameter) added for anticipated high groundwater conditions (based on site visit). The Slope Multiplier which multiplies all previous values (base cost and additions for pressure, rock and groundwater) by a ratio which increases costs for steep slopes. The Appurtenance Multiplier which multiplies all previous values (including the slope multiplier) by a ratio which accounts for valving, traffic control, mobilization, paving, dust control, reseeding, and other items needed for the construction of the pipeline. The unit cost (in dollars per linear foot per inch diameter) for the pipeline which includes all construction costs.
ake Powell Pipeline Study 49 Final Report, March 1995
RIW Cost The unit cost per linear foot of easement purchased. This assumes a 1 00' wide easement and easement acquisition costs at $2000 per acre).
Reach Cost The total construction and easement cost, in 1995 dollars, between the same line and the previous line stations identified in column 1.
Annualized Costs Annualized costs are included for the pipeline, pump station, and hydrostation construction cost totals and for energy and O&M costs '
Pipeline Cost Totals The total construction and easement cost of the pipeline.
Pump Station(s) and Hydrostation Costs and Totals
Energy Costs Cost of electrical energy (or, for the Hydrostation, revenue from electrical energy) in cents per Kilowatt hour. Three categories of energy rates have been assumed (average daily rate, off-peak, and on-peak) with the average rate being used in all cases except where the operations alternative is specifically identified as a peaking operation, in which case the peak rate equals the average rate.
Capital Costs The construction cost for the pump station or hydrostation (includes a 10% built-in contingency).
O&M Costs The cost of operating and maintaining the pump station or hydrostation (excluding energy costs).
~egulating Resrv'r The cost of the regulating reservoir (used in the Peaking hydrostation alternatives).
'roject Totals Sum of construction costs for pipeline, pump stations, hydrostation and other facilities, add 15% for design and administration, and an additionallO% for added contingencies for a project total about 35% above documented construction costs.
nit Water Costs Annualized unit water costs divided by design flow (60,000 AF/yr). tJerating Costs Annualized operating costs at design flow (60,000 AF/yr) including energy and
O&M.
Powell Pipeline Study 50 Final Report, March 1995
I \
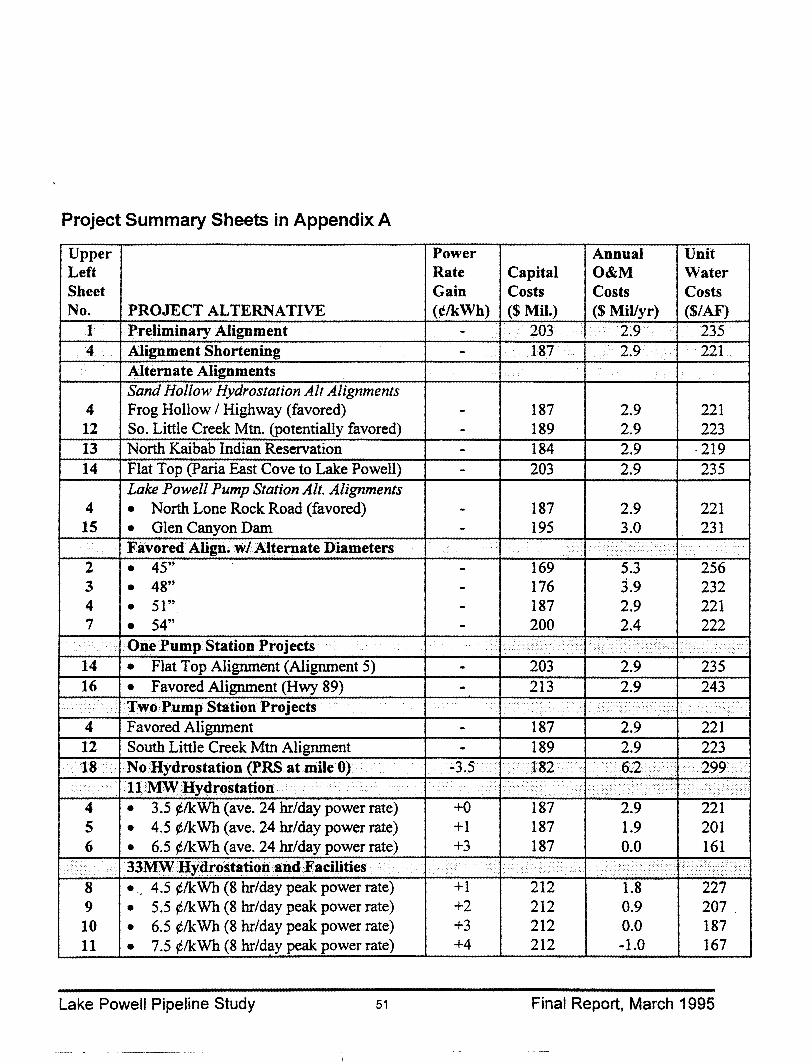
Project Summary Sheets in Appendix A
Upper Power Annual Unit Left Rate Capital O&M Water Sheet Gain Costs Costs Costs No. PROJECT ALTERNATIVE (¢/kWh) ($Mil.) ($ Millyr) ($/AF)
1 Preliminary Alignment - 203 2.9 235 4 Alignment Shortening - 187 2.9 221
Alternate Alignments Sand Hollow Hydrostation Alt Alignments
4 Frog Hollow I Highway (favored) - 187 2.9 221 12 So. Little Creek Mtn. (potentially favored) - 189 2.9 223 13 North Kaibab Indian Reservation - 184 2.9 ·219 14 Flat Top (Paria East Cove to Lake Powell) - 203 2.9 235
Lake Powell Pump Station Alt. Alignments 4 • North Lone Rock Road (favored) - 187 2.9 221 15 • Glen Canyon Dam - 195 3.0 231
Favored Align.·w/ Alternate Diameters ..
2 • 45" - 169 5.3 256 3 • 48" - 176 3.9 232 4 • 51" - 187 2.9 221 7 • 54" - 200 2.4 222
One Pump Station Projects l .c I -•. · .. 1-·• ..
14 • Flat Top Alignment (Alignment 5) - 203 2.9 235 16 • Favored Alignment (Hwy 89) - 213 2.9 243
·· Two Pump Station Projects 4 Favored Alignment - 187 2.9 221 12 South Little Creek Mtn Alignment - 189 2.9 223 18 Nq Hydrostation (PRS at mile 0) -3.5 182 62 299
·11 MWHydrostation . . :.· ._•I• : .. · .. • · ..... I -·: .. :•
·--·-
4 • 3.5 ¢/kWh (ave. 24 br/day power rate) +0 187 2.9 221 5 • 4.5 ¢/kWh (ave. 24 br/day power rate) +1 187 1.9 201 6 • 6.5 ¢/kWh (ave. 24 br/day power rate) +3 187 0.0 161
...... __ ·_. 33MWHydrostation and Facilities . _·.· .. . .. .·· · ... . ............ -_.._
8 •. 4.5 ¢/kWh (8 br/day peak power rate) +1 212 1.8 227 9 • 5.5 ¢/kWh (8 br/day peak power rate) +2 212 0.9 207. 10 • 6.5 ¢/kWh (8 br/day peak power rate) +3 212 0.0 187 11 • 7.5 ¢/kWh (8 br/day peak power rate) +4 212 -1.0 167
Lake Powell Pipeline Study 51 Final Report, March 1995
\ \
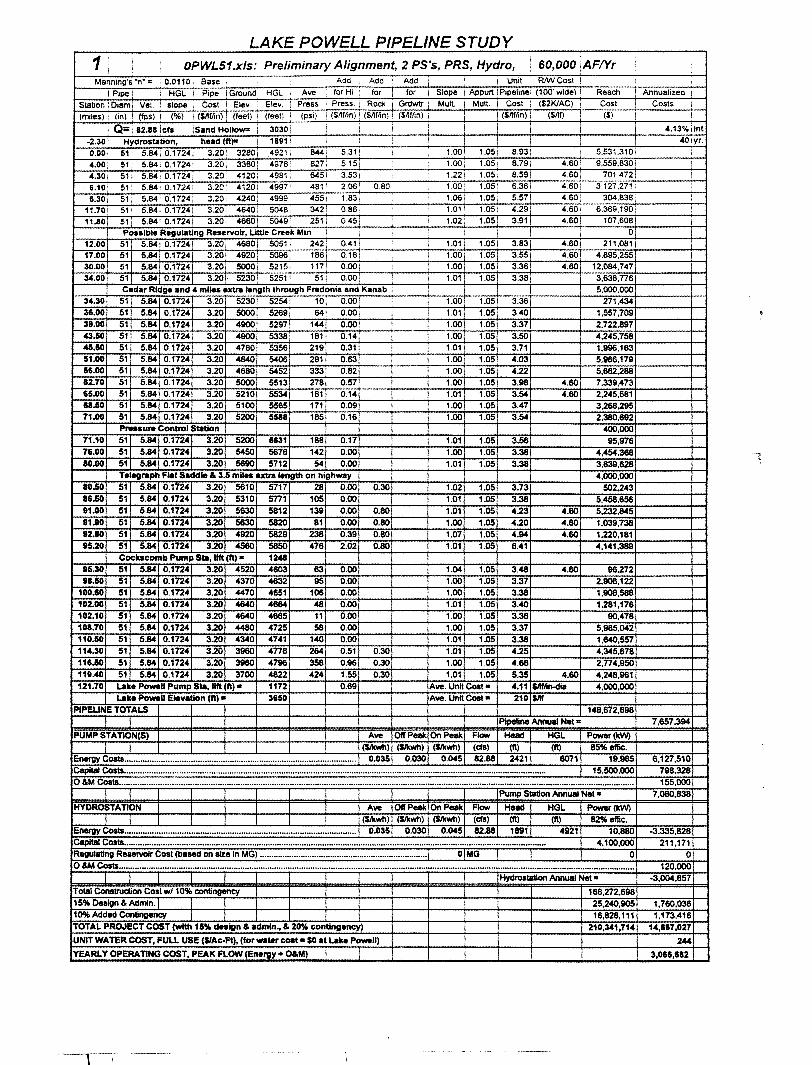
LAKE POWELL PIPELINE STUDY 1
' OPWL51.xls: Preliminary Alignment, 2 PS's, PRS, Hydro, 60,000 ~AF!Yr
Manning's .. n .. = 0.0110 Base Add I Add Add , Unit RMICost I
; P•oe; : HGL Pipe !Ground. HGL Ave for Hi : for l for i Slope : Appurt I P•Peline- (100' wide) ' ReaCh Annualized : Stab on : Otem 1 Vel. ' stope 1 Cost Elev. Elev. Press Press.: Rocic 1 Grdwtr • Mutt. I Mult. I Cost ($2KIAC) Cost Costs i
(miles) 1 (in) I (fps) I (%) i ($/lffln) I (feet) 1 (feet) I (psi) : (SMion) 1 (SMfln) ' (Snffln) : i ! (SIIflin) i (Sntl : ($) I
1 Q=: 82.18 I cfs !Sand Hollo- i 3030; .
I I I I I i I 4.13'kiint
-2.30! Hydrostation, head (ft)= 1191 1 , I I I I I I 40!yr.
0.001 51 1 5.841 0.1724; 3.20' 3280; ~921 644: 5.311 I 1.001 1.05: 8.93! i 5.531,3101
4.00[ 51' 5.841 0.17241 3.20: 33801 4978· 827· 5.15, 1.00: 1.05t 8.79, ~-80' 9.559.630
4.301 51 i 5.84! 0.1724! 3.20 ~1201 4981; 645i 3.53i 1.221 1.05: 8.59! 4.60! 701.472
6.101 51 1 5.84: 0.1724; 3.20 4120: 4997 481' 2.06 1 0.80 1.00: 1.051 6.36! 4.60, 3.127,2711
6.30i 51' 5.84: 0.1724: 3.20! 4240! 4999 455: 1.831 1.06j 1.051 5.571 4.60: 304.838 1 I
11.701 51! 5.84! 0.17241 3.201 4640: 5048. 3421 o.ss. 1.01 1.05! 4.29' 4.601 6.369,1901
11.80, 51 5.841 0.17241 3.20i 4660> 5049! 251t 0.451 I 1.02' 1.05 3.91! 4.60! 107,608 I
I Possible Regulating Reservoir, U!tle Creek Mtn I I I ! i ! l 0 I 12.00 51 5.841 0.1724! 3.20 4680 5051 i 2421 0.411 i 1.011 1.051 3.831 4.601 211.081[
17.00 51 5.84 0.1724 3.20 4920 5096 1861 0.161 i I 1.00 1.05, 3.551 4.60, 4,895.255
30.00 51 5.84 0.17241 3.20 5000 52151 1171 0.001 I 1.00 1.05! 3.361 4.80 12,084.747 34.00 51 5.84 0.1724 3.20. 5230 5251! 511 0.00! I 1.01 1.05 3.38! 3,638,776
Cedar Ridge and 4 miles extra length through Fredonia and Kanab I I 5,000,000
34.30 51 5.84 0.1724 3.20 5230 5254 10 0.00 1.00 1.05 3.36i 271.434 36.00 51 5.84 0.1724 3.20 5000 5269 64 0.00 1.01 1.05 3.40 1,557,709 39.00 51 5.84 0.1724 3.20 4900 5297 144 0.00 1.00 1.05 3.37 2.722.897 43.50 51 5.84 0.1724 3.20 4900 5338 181 0.14 1.00 1.05 3.50 4,245,758 45.50 51 5.84 0.1724 3.20 4780 5356 219 0.31 1.01 1.05 3.71 1,996,163 51.00 51 5.84 0.1724 3.20 -4640 5406 291 0.63 1.00 1.05 4.03 5,966,179 56.00 51 5.84 0.1724 3.20 4680 5452 333 0.82 1.00 1.05 4.22 5,682.288 62.70 51 5.84 0.1724 3.20 5000 5513 278 0.57 1.00 1.05 3.98 4.80 7,339,473 65.00 51 5.84 0.1724 3.20 5210 5534 181 0.14 1.01 1.05 3.54 4.60 2.245.581 68.50 51 5.84 0.1724 3.20 5100 5565 171 0.09 1.00 1.05 3.47 3,268.295 71.00 51 5.84 0.1724 3.20 5200 5588 185 0.16 1.00 1.05 3.54 2.380.692
Prusura Conrtol Station 400.000 71.10 51 5.84! 0.17241 3.20 5200 5831 188 0.17 1.01 1.05 3.56 95,976 76.00 51 5.84! 0.17241 3.20 5450 5676 142 0.00 1.00 1.05 3.38 4,454.388 80.00 51 5.84! 0.17241 3.20 5690 5712 54 0.00 1.01 1.05 3.38 3.639.628
Telegraph Flat Saddle & :u miles extra length on highway 4,000,000 80.50 51 5.84 0.1724 3.20 5610 5717 28 0.00 0.30 1.02 1.05 3.73 502.243 16.50 51 5.84 0.1724 3.20 5310 5771 105 0.00 1.01 1.05 3.38 5,458,656 91.00 51 5.84 0.1724 3.20 5630 5812 139 0.00 0.80 1.01 1.05 4.23 4.60 5.232.845 91.90 51 5.84 0.1724 3.20 5630 5820 81 0.00 0.60 1.00 1.05 4.20 4.60 1,039,738 92.80 51 5.84 0.1724 3.20 4920 5829 238 0.39 0.80 1.07 1.05 4.94 4.60 1.220,181 15.20 51 5.84 0.1724 3.20 4560 5850 476 2.02 0.80 1.01 1.05 6.41 4,141,389
Cockacomb Pump Sta, 11ft (ft) • 1248 15.30 51 5.84 0.1724 3.20 4520 4803 63 0.00 1.04 1.05 3.48 4.80 96.272 81.50 51 5.84 0.1724 3.20 4370 4632 95 0.00 1.00 1.05 3.37 2,908,122
100.60 51 5.84 0.1724 3.20 4470 41351 106 0.00 1.00 1.05 3.38 1,908,588 102.00 51 5.84 0.1724 3.20 -4640 4664 48 0.00 1.01 1.05 3.40 1.281,176 102.10 51 5.84 0.1724 3.20 4840 4665 11 0.00 1.00 1.05 3.36 90.478 108.70 51 5.84 0.1724 3.20 4480 4725 58 0.00 1.00 1.05 3.37 5,965,042 110.50 51 5.84 0.1724 3.20 4340 4741 140 0.00 1.01 1.05 3.38 1,840,557 114.30 51 5.84 0.1724 3.20 3960 4716 264 0.51 0.30 1.01 1.05 4.25 4,345,678
116.50 51 5.84 0.1724 3.20 3960 4796 358 0.96 0.30 1.00 1.05 4.68 2,774,950 118.40 51 5.84 0.1724 3.20 3700 4822 424 1.55 0.30 1.01 1.05 5.35 4.80 4,248.961 121.70 Lake Powell Pump Sta, lift (ft) • 1172 0.69 Ave. Unit Cost • 4.11 Sllflln..dill 4.000.000
Laka Powell ElevatiOn (ft} • 3650 Ave. Unit Cost • 210 Sllf PIPEUNE TOTALS 148,672,698
I I Pipeline Annual Net .. 7,657,394
PUMP STA TION(S) Ave Off Peak On Peek Flow Headl HGL Power(kW)
I I (Sikwh) (Sikwh) (Sikwh) (Cfll) Cft> I (ft) 85%eftic. Energy Costs ...................................................................................................... 0.035 0.030 0.045 82.88 24211 6071 19.985 6.127,510 Capital Costs .......................................................................................................................................................................................... 15,500,000 798,328 O&MCosts ................................................................................................................................................................................................................................... 155,000
I I l I I I I Pump Station Annual Net • 7,080.638
HYDROSTATION I I I I Ave Off Peak On Peak Flow Head! HGL Power (kVIf)
I I I I I I (Sikwh) ($!kWh) ($/kwh) (cfs) (II) I (II) 82%effic. EneiVY Costs ...................................................................................................... 0.035 0.030 0.045 82.88 16911 4921 10,880 -3.335,828 Cepltal Costa .......................................................................................................................................................................................... 4,100,000 211,171 Regulating Reservoir Cost (based on size in MG) .......................................................................... 1 OIMG I 0 0 O&MCosts ................................................................................................................................................................................................................................... 120.000
I I I Hydrostation Annual Net • ·3,004.857
Total ConslrUCiion Cost w/10% contingency 168.272.698 15% Design &Admin. I 25.240,905 1,760,036 10% Added Contingency I 16,828,111 1,173.416 TOTAL PROJECT COST (with 15% d"ign & admin., & 20% contingency) 210,341,714 1-4,817,027
UNIT WATER COST, FUU. USE ($/Ac-Ft}, (for -tar cost • $0 •t Lake Pow.ll) 244
YEARLY OPERATING COST, PEAK FLOW (Energy+ O&M) 3,086,682
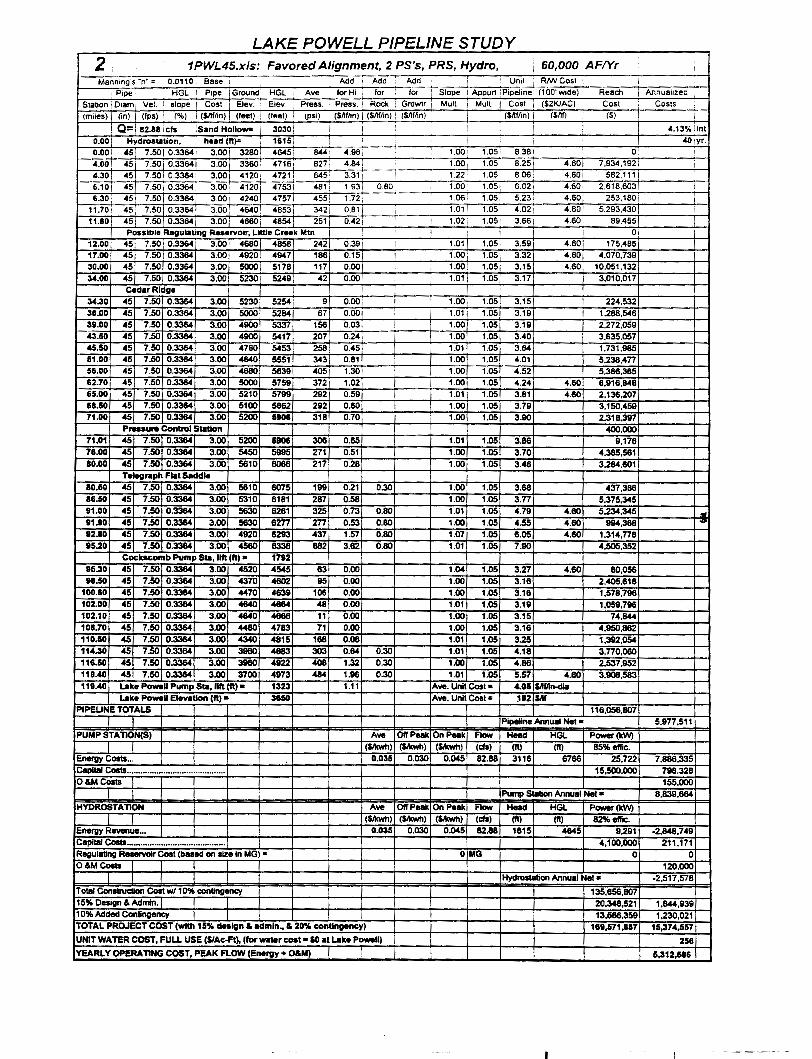
LAKE POWELL PIPELINE STUDY 2: 1PWL45.xls: Favored Alignment, 2 PS's, PRS, Hydro, i 60,000 AF/Yr :
Mannmg·s "n'' ~ 0.0110 Base Add ' Add Add I Un.t RIWCost 1 1 Pape HGL I Pope !Ground: HGL Ave for Hi : for for ! Slope : Appurt IPipehne. (100' wode) I Reach Annuahzed
Station I Ooam 1 Vel. slope 1 Cost Elev. Elev. Press. l Press. , Rod< Grdwtr 1 Mutt. I Mult. I Cost 1 ($2KIAC) '
Cost Costs :
(miles) I (in) I (Ips) (%) I (SIIflin) (feet) (feet) i (psi) 1 (S/Ifhn) I (S/Iffon) : (Snff:n) , I i csntron) i csno I ($) I l
! Q= I 82.88 efs I Sand Hollows i 3030! I ! I i I I 4.13%iint
0.001 Hydrostalion, h .. d (ft)s 1615\ ! : I I i I 40;yr. 0.001 45' 7.50 I 0.33641 3.00! 3280; 46451 844 4.98, 1.00! 1.051 8.381 I 0' ! 4.001 451 7.50! 0.33641 3.00 3360 4716: 8271 4.64, ' ! 1.001 1.051 8.251 4.60) 7.934.192 i 4.301 45 7.501 0.3364[ 3.00[ 4120, 47211 645 3.31! I 1.22' 1.05 8.06j 4.60 582,1111
6.101 451 7 .SQ I 0.3364 i 3.001 4120j 47531 481; 1.93: 0.80 ! 1.00 1.051 6.021 4.60: 2,618.603 I
6.30: 451 7 .so I 0.33641 3.001 42401 47571 455! 1.72' I 1.06 1.05 5.23: 4.60 253,180 i I
11.701 45; 7.501 0.33641 3.00; 4640! 48531 342! 0.81 i 1.01 1.05, 4.02; 4.601 5,293,4301 i
11.80 45 7.50 0.33641 3.00J 4660' 4854 251 i 0.42: i 1.02 1.05 3.66; 4.60. 89.455 Possible Regu .. ling Reservoir, Little Creek Mt.n I 0:
12.00 45 7.50 0.3364 3.00 4680 4858 242 0.391 l 1.01 1.05 3.59 4.60 175,485 17.00 45 7.50 0.3364 3.00 4920 4947 186 0.15 I 1.00 1.05 3.32 4.60 4.070.739 30.00 45 7.50 0.3364 3.00 5000 5178 117 0.00 I 1.00 1.05 3.15 4.60 10,051,132 34.00 45 7.50 0.3364 3.00 5230 5249 42 0.00 1.01 1.05 3.17 3,010,017
C.clar Ridge I
34.30 45 7.50 0.3364 3.00 5230 5254 9 0.00 1.00 1.05 3.15 224,532 3&.00 45 7.50 0.3364 3.00 5000 5284 67 0.00 1.01 1.05 3.19 1.268,546 3i.OO 45 7.50 0.3364 3.00 4900 5337 156 0.03 1.00 1.05 3.19 2.272,059 43.50 45 7.50 0.3364 3.00 4900 5417 207 0.24 1.00 1.05 3.40 3.635.057 45.50 45 7.50 0.3364 3.00 4780 5453 258 0.45 1.01 1.05 3.64 1.731,985 51.00 45 7.50 0.3364 3.00 4840 5551 343 0.81 1.00 1.05 4.01 5.238.4n 56.00 45 7.50 0.3364 3.00 4680 5839 405 1.30 1.00 1.05 4.52 5,386,365 62.70 45 7.50 0.3364 3.00 5000 5759 372 1.02 1.00 1.05 4.24 4.50 6,916,848 65.00 45 7.50 0.3364 3.00 5210 5799 292 0.59 1.01 1.05 3.61 4.50 2,136.207 11.50 45 7.50 0.3364 3.00 5100 5862 292 0.50 1.00 1.05 3.79 3,150,459 71.00 45 7.50 0.3364 3.00 5200 5101 318 0.70 1.00 1.05 3.90 2.318.397
P-ure Control Station 400,000 71.01 45) 7.50) 0.33641 3.00 5200 11801 306 0.65 1.01 1.05 3.86 9,176 76.00 45 7.50 0.3364J 3.00 5450 5995 271 0.51 1.00 1.05 3.70 4,365,581 80.00 451 7.50 0.33641 3.00 5610 6066 217 0.28 1.00 1.05 3.46 3.284,601
Telegraph Flat Saddle 80.110 45 7.50 0.3364 3.00 5610 5075 199 0.21 0.30 1.00 1.05 3.68 437,368 86.110 45 7.50 0.3364 3.00 5310 6181 287 0.58 1.00 1.05 3.n 5,375,345 91.00 45 7.50 0.3364 3.00 5630 6261 325 0.73 0.80 1.01 1.05 4.79 4.80 5.234,345 • 11.90 45 7.50 0.3364 3.00 5630 62n 2n 0.53 0.80 1.00 1.05 4.55 4.60 994,368 .... 12.60 45 7.50 0.3364 3.00 4920 6293 437 1.57 0.80 1.07 1.05 6.05 4.50 1.314,n6 15.20 45 7.50 0.3364 3.00 4550 6338 882 3.62 0.80 1.01 1.05 7.90 4,505,352
Cockscomb Pump Sta, lift (fl)• 1792 15.30 45 7.50 0.3364 3.00 4520 4545 63 0.00 1.04 1.05 3.27 4.60 60,056 18.110 45 7.50 0.3364 3.00 4370 4602 95 0.00 1.00 1.05 3.16 2.405.616
100.10 45 7.50 0.3364 3.00 4470 4639 106 0.00 1.00 1.05 3.16 1,576,796 102.00 45 7.50 0.3364 3.00 4840 4664 46 0.00 1.01 1.05 3.19 1,059,796 102.10 45 7.50 0.3364 3.00 4840 4666 11 0.00 1.00 1.05 3.15 74,844 101.70 45 7.50 0.3364 3.00 4480 4783 71 0.00 1.00 1.05 3.16 4.950.882 110.110 45 7.50 0.3364 3.00 4340 4815 188 0.08 1.01 1.05 3.25 1,392,054 114.30 45 7.50 0.3364 3.00 3960 4883 303 0.64 0.30 1.01 1.05 4.18 3,no.oeo 116.110 45 7.50 0.3364 3.00 3960 4922 408 1.32 0.30 1.00 1.05 4.86 2,537.952 118.40 45 7.50 0.3364 3.00 3700 4973 484 1.96 0.30 1.01 1.05 5.57 4.60 3.908,583 119.40 Lake Powell Pump Sta, lift (ft)• 1323 1.11 Ave. Unit Cost • 4.011 SllfllrHIIa
Lake Powell ElevatiOn (ft)• 3650 Ave. Unit Cost • ,.2 Sill PIPEUNE TOTALS 116,056,807
I I Pipeline Annual Net • 5.9n.511
PUMP STATION(S) Ave Off Peak OnPuk flOW Head HGL Power(kW) ($/kwh) ($/kwh) ($Jkwh) (cis) (ft) (ft) 85'111 ellic.
Energy Costs ... 0.035 0.030 0.045 82.68 3116 6766 25,722 7,886,335 Capl181 Costa ........................................... 15,500.000 798,328 O&MCosts 155.000
I I Pump Station Annual Net • 8,639,664
HYDROSTATION Ave Off Peak On Peak Flow Head HGL Power (leW)
I ($/kwh) (Sikwh) ($Jkwh) (cis) (ft) (II) 82%eflic:. Energy Revenue ... 0.035 0.030 0.045 82.88 1615 4645 9.291 -2,846,749 Capital Costa ........................................... 4,100,000 211,171 Regulating ReMMIIr Cost (bas.cl on size in MG) • 0 MG 0 0 0 &M Costa I I 120,000
I I I Hydrostation Annual Net = -2.517,578 Tol81 Construction Col1 w/ 1 0'111 contingency 135,656,807 15% Design & Admin. I I 20,346,521 1,844,939 1 0'111 Added Contingency I 13,566,359 1,230,021 TOTAL PROJECT COST (with 111% design & admln., & 20% contingency) 169,571,187 15,374,557 UNIT WATER COST, FULL USE (SIAe.f't), (for water cost • SO at Lake Powell) 255 YEARLY OPERA nNG COST, PEAK FLOW (Energy + O&M) 11,312,516
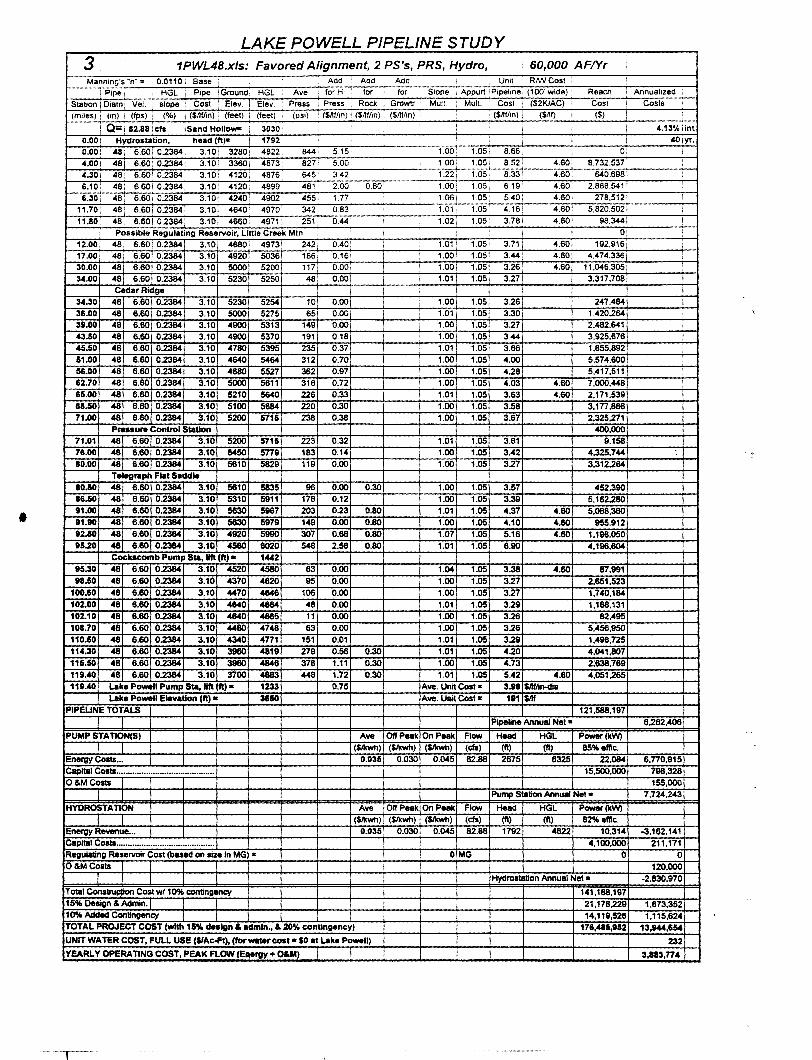
LAKE POWELL PIPELINE STUDY 3 1PWL48.xls: Favored Alignment, 2 PS's, PRS, Hydro, I 60,000 AF!Yr I
Manning's "n .. = '0.0110 Base Add Add Add ! Un<t RN>/Cost I
I P1pe! I HGL i P1pe 'Ground HGL Ave for HI ; for i for Stope 1 Appurt ! P1pehne: ( 1 oo· wiae) · Reach t Annualized
Station I Oiam: Vel. Slope I Cost ! Elev. j Elev Press 1 Press ROCI< Grawtr · Mutt. I Mull. ; Cost ; (S2KIAC) ! Cost ! Costs ' (miles), (In) 1 (Ips) i (%) I (Snt/in) 1 (feet) ! (feet) I (psi) (SMfln) I ($/!flin) , (Sntfln) 1 1 (Snffln)! ($Jif) ' ($) I
I Q:t 82.881Cfs !Sand Hollo- 3030; ! ! I i i 4.13%iint
0.00! Hydrostation, head (ft)= : 1792· I I ' l .W 1 yr.
0.001 48; 6.601 0.2384! 3.101 3280: 4822< 6441 5.15: 1.00 1.05 1 8.66: : 0, I
o4.00i 48' 6.60: 0.2384! 3.101 3360· o4B73i 8271 5.00 ! 100 1.05: 8.52' 4.60: 8.732.537, 4.301 48. 6.80' 0.2384: 3.101 41201 4876 8451 3.42. 1.221 1.05: 8.331 4.60; 840,698'
6.10 48: 6.601 0.2384! 3.101 41201 4899 481 2.00: 0.60 1.001 1.05, 6.19 4.601 2.868.541 i
6.30, 48: 6.60t 0.2384: 310J. 4240, 4902· 4551 1.77' : I 1.061 1.051 5401 4.601 278,5121 I
11.701 48' 6.60 I 0.2384 i 3.10i 4840! 49701 342! 0.83 1.01 1.051 4.16! 4.60r 5,820.5021 I 11.80 48 6.60 I 0.2384 1 3.10! 46601 49711 251 044[ I 1.02i 1.05 1 3.781 4.601 96.3441 I
Possible Regulating Reservoir, Little Creek Mtn I I l i I I Oi I 12.00 48 6.60 I 0.2384 3.10 4880 4973 242' 0.40i i 1.01 1 1.05 3.71 4.60 192,916 I
17.00 48 6.60 0.2384 3.10 4920 5036 186 0.161 I 1.001 1.05 3.44 4.60 4.474,336 I
30.00 48 6.601 0.2384 3.10 5000 5200 117 O.OOr I I 1.00 1.051 3.26 4.60 11,046,305 : 34.00 48 6.60 1 0.2384 3.10 5230 5250 48' 0.00 I 1.01 1.051 3.27 3,317,708 I
Ceder Ridge I i I I I 34.30 48 6.60 0.2384 3.10 5230 5254 10 0.00 I : 1.00 1.05· 3.26 247,484 I 36.00 48 6.60 0.2384 3.10 5000 5275 65 0.00 I 1.01 1.05 3.30 1,420,264 i 39.00 48 6.60 0.2384 3.10 o4900 5313 149 0.00 1.00 1.05 3.27 2.482.641 43.50 48 6.60 0.2364 3.10 4900 5370 191 0.18 I 1.00 1.05 3.44 3.925,676 -45.50 o48 6.60 0.2384 3.10 4780 5395 235 0.37 1.01 1.05 3.66 1,855,892 61.00 48 6.60 0.2384 3.10 o4840 5464 312 0.70 1.00 1.05 4.00 5.574.600 56.00 48 6.60 0.2384 3.10 4680 5527 362 0.97 1.00 1.05 4.28 5,417,511 i 62.70 48 6.60 0.2384 3.10 5000 5811 316 0.72 1.00 1.05 4.03 o4.60 7,000,448 l 65.00 48 6.60 0.2384 3.10 5210 5640 226 0.33 1.01 1.05 3.63 4.60 2.171.539 L 611.50 48 6.60 0.2384 3.10 5100 5884 220 0.30 1.00 1.05 3.56 3.1n.886 I 71.00 48 6.80 0.2384 3.10 5200 6716 238 0.38 1.00 1.05 3.67 2,325.271
Prnsura Control Station 400,000 71.01 o48\ 6.60 0.2384\ 3.10 5200 5716 223 0.32 1.01 1.05 3.61 9.158 76.00 481 6.80 0.23841 3.10 5450 sn9 183 0.14 1.00 1.05 3.42 4,325,744 : 110.00 48 I 6.80 0.23841 3.10 5610 5829 119 0.00 I 1.00 1.05 3.27 3,312.264
Telegraph Flat S.ddle 80.50 48 6.60 0.2384 3.10 5610 5835 96 0.00 0.30 1.00 1.05 3.57 452,390 86.60 48 6.80 0.2384 3.10 5310 5911 178 0.12 1.00 1.05 3.39 5,162.280
• 91.00 48 6.60 0.2384 3.10 5630 5967 203 0.23 0.80 1.01 1.05 .C.37 4.60 5,088,360 91.90 o48 6.60 0.2384 3.10 5630 5979 149 0.00 0.80 1.00 1.05 4.10 4.60 955.912 82.10 48 6.80 0.2384 3.10 4920 5990 307 0.68 0.80 1.07 1.05 5.16 4.80 1.198,050 85.20 48 6.60 0.2364 3.10 4560 8020 548 2.58 0.80 1.01 1.05 6.90 .C,196,804
CockScomb Pump Sta, lift (ft) • 1.U2 85.30 o48 6.60 0.2384 3.10 4520 4580 63 0.00 1.04 1.05 3.38 4.60 87,991 98.50 48 6.60 0.2384 3.10 4370 -4620 95 0.00 1.00 1.05 3.27 2,651,523
100.80 48 6.60 0.2364 3.10 .U70 4646 106 0.00 1.00 1.05 3.27 1,740,164 102.00 o48 6.60 0.2384 3.10 4640 4664 48 0.00 1.01 1.05 3.29 1.168.131 102.10 48 6.60 0.2384 3.10 -4840 o4665 11 0.00 1.00 1.05 3.26 82,496 101.70 48 6.60 0.2384 3.10 4480 o4748 63 0.00 1.00 1.05 3.26 5,456,950 110.50 48 6.60 0.2384 3.10 4340 "n1 151 0.01 1.01 1.05 3.29 1.498,725 114.30 48 6.60 0.2384 3.10 3960 4819 279 0.56 0.30 1.01 1.05 4.20 4,041,607 116.50 48 6.80 0.2384 3.10 3960 4846 378 1.11 0.30 1.00 1.05 o4.73 2;638,769 119 • .&0 o48 6.80 0.2364 3.10 3700 4883 448 1.72 0.30 1.01 1.05 5.42 4.60 4,051.265 118.4{1 Lake Powell Pump Sta, 11ft (ft) • 1233 0.75 Ave. Unit Cost" 3.11 Sllffin.dia
Lake Po-11 Elavatlon (ft) • 3150 Ave. UAit Cost" 111 $/If
PIPEUNE TOTALS 121,568,197
L I Pipeline Annual Net " 6,262,406
PUMP STA TION(S) Ave O!fPaak On Peak Flow Head HGL Power(ltW)
L _L ($1kwh) ($1kwh) ($1kwh) (cfll) (II) (11) B5%efllc. Energy Coats ... 0.035 0.030 0.045 82.88 2675 6325 22,084 a.no,915 Capital Costs ........................................... 15.500,000 798,328 O&MCosts I 155,000
I I Pump Station Annual Net • 7,72o4,2.C3
HYDROSTATION Ave Off Peak On Peak Flow Head HGL Power(kW)
I I ($1kwh) ($/kwh) {$1kwh) (cfll) (II) (II) 82% elllc. Energy Rewnue ... 0.035 0.030 0.045 82.88 1792 4822 10,314 -3,162,1.(1 Capital Costs ........................................... 4,100,000 211,171 Regulating Reservoir Cost (based on size in MG) • 0 MG 0 0 O&MCosts I I I I 120,000
I I I I I Hydrostation Annual Net " ·2.830,970
Total ConslniJ:!jon Cost w/10% contingency 141,188,197 15% Design & Admin.j I I 21,178,229 1,673,352 10% Added Contingency I I 14,119,526 1.115,624 TOTAL PROJECT COST (with 15% deelgn & edmln., & 20% contingency) 176,o415,t52 13,144,654
UNIT WATER COST, FULL USE ($/Ac.f!), (tor water cos!• SO •t Lake Po-ll) 232
YEARLY OPeRATING COST, PEAK FLOW {Eqergy + O&M) 3,113,774
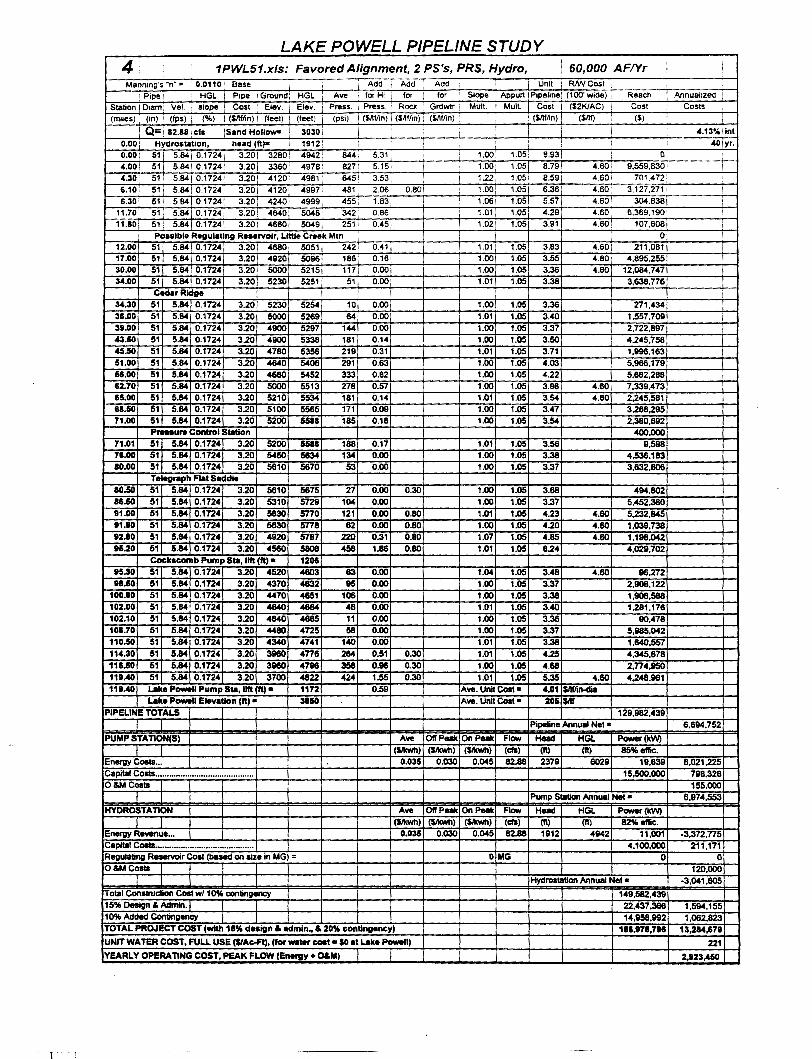
LAKE POWELL PIPELINE STUDY 4 1PWL51.xls: Favored Alignment, 2 PS's, PRS, Hydro, i 60,000 AF!Yr I
Manning's "n .. = '0.0110 Base Add Add ' Add ' ' I Unit RNVCost I
1 Pipe 1 : HGL i Pipe tGroundf HGL I Ave lor Hi lor I for Slope 1 Appurt IPrpeline: (100' wide) Reach I Annualized ! Station 1 Dram! Vel. I slope , Cost Etev. ! Elev. 1 Press. 1 Press. I Rod< I Grdwtr ! Mutt. I Mutt. I Cost ! ($2KIAC) I Cost Costs
(mrles) , (in) ! (fps) L (%) I (SM!in) I (feet) (feet) J (psi) I (Sntfrn) I (Snffln) ($~fAn) i I !(~flin), ($/H) i ($) I ! ! Q:1 82.88lcts JSand Hollows 30301 I I I i I I 4.13•~iint
0.00' Hydrostation, head (ft)& 1912i I ' I ! 40jyr. o.oo; 511 5.84j 0.1724j 3.20! 3280 4942: 844 5.31'
' I 1.00 1.05' 8.93 01 I
4.00) 511 5.841 0.17241 3.201 3360 4978; 8271 5.151 I 1.00[ 1.05 8.79 4.60: 9.559,830 I 4.30 1 51 5.841 0.17241 3.20! 4120 4981' 6451 3.53: 1.22. 1.05< 8.59 4.60! 701,4721 6.10 51• 5.841 0.1724, 3.20! 4120 49971 481' 2.061 0.80 1
, I 1.00! 1.051 6.36' 4.60j 3,127.271 i 6.30. 511 5.84 0.1724j 3.201 4240 4999' 455i 1.83; 1.061 1.05 5.57 4.60 304.8381
11.701 51 i 5.84 0.1724! 3.20, 464oL 50481 342' 086 ' 1.01' 1.05' 4.29' 4.60: 6.369, 190' 11.10, 51j 5.84 0.17241 3.20! 48601 5049J 251 0.451 1.02 1.05 3.91 4.60; 107.6081
Possible Regulating Reservoir, Little Creek Mtn I I 0 12.00 51 5.84 0.1724 3.20 4680 5051 242 0.411 1.01 1.05 3.83 4.60 211.081 17.00 51 5.84 0.1724 3.20 4920 5096 186 0.161 I 1.00 1.05 3.55 4.80 4,895,255 30.00 51 5.84 0.1724 3.20 5000 5215 117 0.00 1.00 1.05 3.36 4.60 12,084.747 34.00 51 5.84 0.1724 3.20 5230 5251 51 0.00 1.01 1.05 3.38 3,638,776
Cedar Ridge I 34.30 51 5.84 0.1724 3.20J 5230 5254 10 0.00 1.00 1.05 3.36 271,434 36.00 51 5.84 0.1724 320 5000 5269 64 0.00 1.01 1.05 3.40 1.557.709 39.00 51 5.84 0.1724 3.20 4900 5297 144 0.00 1.00 1.05 3.37 2,722.897 -43.50 51 5.84 0.1724 3.20 4900 5338 181 0.14 1.00 1.05 3.50 4.245,758 45.50 51 5.84 0.1724 3.20 4780 5356 219 0.31 1.01 1.05 3.71 1,996,163 51.00 51 5.84 0.1724 3.20 4640 5406 291 0.63 1.00 1.05 4.03 5,966,179 56.00 51 5.84 0.1724 3.20 4680 5452 333 0.82 1.00 1.05 4.22 5,682,288 62.70 51 5.84 0.1724 3.20 5000 5513 278 0.57 1.00 1.05 3.96 4.60 7.339,473 15.00 51 5.84 0.1724 3.20 5210 5534 181 0.14 1.01 1.05 3.54 4.60 2.245,581 61.50 51 5.84 0.1724 3.20 5100 5565 171 0.09 1.00 1.05 3.47 3,268,295 71.00 51 5.84 0.1724 3.20 5200 SUI 185 0.16 1.00 1.05 3.54 2,380,892
Pnuura Control Station 400.000 71.01 511 5.84 0.17241 3.20 5200 5&51 188 0.17 1.01 1.05 3.56 9,598 71.00 511 5.84 0.17241 3.20 5450 5634 134 0.00 1.00 1.05 3.38 4,536.183 10.00 511 5.84 0.17241 3.20 5610 5670 53 0.00 1.00 1.05 3.37 3,632.806
Teleg,.ph Flat Saddle 10.50 51 5.84 0.1724 3.20 5610 5675 27 0.00 0.30 1.00 1.05 3.68 494,802 11.50 51 5.84 0.1724 3.20 5310 5729 104 0.00 1.00 1.05 3.37 5.452.380 11.00 51 5.84 0.1724 3.20 5630 5770 121 0.00 0.80 1.01 1.05 4.23 4.80 5.232,845 11.10 51 5.84 0.17~ 320 5630 5778 62 0.00 0.80 1.00 1.05 4.20 4.80 1,039,738 12.10 51 5.84 0.1724 3.20 4920 5787 220 0.31 0.80 1.07 1.05 4.85 4.80 1,196,042 15.20 51 5.84 0.1724 3.20 4580 5808 458 1.86 0.80 1.01 1.05 6.24 4,029,702
Cockscomb Pump Sta, lifl (ft) • 1201 95.30 51 5.84 0.1724 3.20 4520 4803 63 0.00 1.04 1.05 3.48 4.60 96.272 11.50 51 5.84 0.1724 3.20 4370 4832 95 0.00 1.00 1.05 3.37 2.908.122
100.10 51 5.84 0.1724 3.20 4470 4851 106 0.00 1.00 1.05 3.38 1,908,588 102.00 51 5.84 0.1724 3.20 4840 4884 48 0.00 1.01 1.05 3.40 1,281,176 102.10 51 5.84 0.1724 3.20 4640 4865 11 0.00 1.00 1.05 3.36 90.478 101.70 51 5.84 0.1724 3.20 4480 4725 58 0.00 1.00 1.05 3.37 5,985,042 110.50 51 5.84 0.17~ 3.20 4340 4741 140 0.00 1.01 1.05 3.38 1.640,557 114.30 51 5.84 0.1724 3.20 3960 4n6 284 0.51 0.30 1.01 1.05 425 4,345,678 111.50 51 5.84 0.1724 3.20 3980 4796 356 0.96 0.30 1.00 1.05 4.68 2,n4,950 111.40 51 5.84 0.1724 3.20 3700 4822 424 1.55 0.30 1.01 1.05 5.35 4.60 4.248.961 111.40 Lake Powell Pump Sta, lifl (ft) • 1172 0.59 Aile. Unit Cost c 4.01 Sllflin-clia
Lake Powell Elevation (Ill • 31110 A ~~e. Unit Coat • 205 $/If
PIPEUNE TOTALS 129,982,439
I I Pipeline Annual Net • 6,694,752
PUMP STA nON(S) Ave OtrPaak On Peak Flow Head HGL Power(kW)
l I (Sikwh) (Sikwh) (Sikwh) (cis) (II) (11) 85%ellic. Energy COSIII ... 0.035 0.030 0.045 82.88 2379 6029 19,839 6.021.225 Capital Costs ........................................... 15.500,000 796.328 O&MCoets I 155,000
I I Pump StatiOn Annual Net • 6,974,553
HYDROSTAnON Ave OIYPuk On Peak Flow Head HGL Power(kW)
I I (Sikwh) (Sikwh) (Sikwh) (cis) (II) (II) 82% ellic. Energy Revenue ... 0.035 0.030 0.045 82.88 1912 4942 11,001 -3,372.n5 Capital Costs ........................................... 4,100,000 211.171 Regulating R--..oir Coat (baaed on SiZe In MG) = 0 MG 0 0 O&M Costs I I I 120,000
I I I I Hydroatation Annual Net • -3,041.605
Total ConsiiUCiion Coat w/ 10% contingency 149,582,439 15% Design & Admin. I I 22,437,388 1,594,155 10% Added Contingency I 14,958,992 1,062,823 TOTAL PROJECT COST (with 15% dnign & edmln., & 20% contingency) 116,171,716 13,214,&78
UNIT WATER COST, FULL USE (SIAc-Ft), (for water coat • $0 •t Lab '"-111 221
YEARLY OPERA nNG COST, PEAK FLOW (Energy+ O&M) 2,823,450
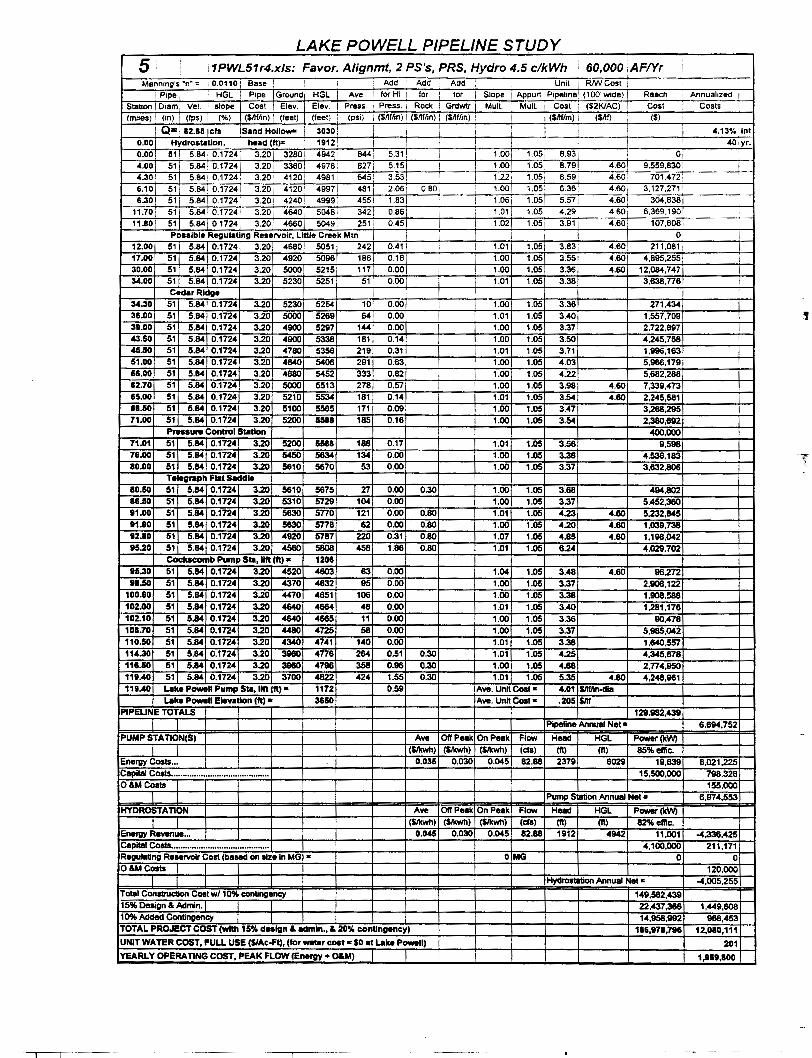
LAKE POWELL PIPELINE STUDY
5' '1PWL51r4.xls: Favor. A/ignmt, 2 PS's, PRS, Hydro 4.5 clkWh 60,000 ,AF!Yr Manning's "n" = i 0.01101 Base I ' Add Add Add I Unit RM!Cost 1 I
i P1pe ! HGL i Pipe I Ground HGL I Ave I forHi i for I for I Stope 1 Appurt !Pipeline~ (100' wide) ReaCh 1 AnnualiZed
Station I Oiam · Vel. ' stope Cost Elev. J Elev. I Press. · Press. ! Rock I Grdwtr i Mull. I Mult. i Cost I ($21</AC) Cost ' Costs (miles) i (in) (Ips) (%) \ (Snffln) '1 (feet) I (feet) : (psi) 1 (Snffon) 1 (SM!on) 1 (Snffln) , i ! ($Mfon) i rsnf) ($) I I
I Q= I 82.18 cts Sand Hollo- ! 3030! ' ' I I 4.13•;.rint ' ' I I
0.00 Hydrostatlon, head (ft)z 1912! ! ! I I ' I I 4D;yr. I
0.00; 51: 5.84! 0.17241 3.20, 32801 494~ 8441 5.31! i i 1.00! 1.05: 8.93 ' o, ' 4.00 51 L 5.841 0.1724 3.20 3360j 4978: 827i 5.15! I 1.00 1.05! 8.79! 4.601 9,559,830, i
4.301 51 5.841 0.1724. 3.20; 4120 1 4981 i 645! 3.53! I 1.221 1.05j 8.59 4.60, 701.4721 6.101_ s1 L 5.84! 0.1724 3.20 4120 1 4997 481; 2.06: 0.801 1.001 1.051 6.361 4.60; 3,127.2711 I 6.301_ 51 i 5.841 0.1724. 3.20! 42401 4999; 4551 1.83 I 1.06 1.051 5.57. 4.60 1 304.838
11.70\ 511 5.84 0.1724[ 3.20 4640'; 5048 3421 0.861 i 1.01 1.05. 4.291 4.601 6,369.190;
11.ao 1 51\ 5.841 0.1724 3.20 4660 50491 251' 0.45J I 1.02 1.05 3.911 4.60' 107,6081 ' Possible Regulating Reservoir, Little Creek Mtn I I I I Or
12.00 51 5.84 0.1724 3.20 4680 5051 242 0.41 ' 1.01 1.05 3.83 4.60, 211,081' I 17.00 51 5.84 0.1724 3.20 4920 5096 186 0.16 1.00 1.05 3.551 4.60 4,895,255 I 30.00 51 5.84 0.1724 3.20 5000 5215 117 0.00 1.00 1.05 3.36 4.60 12,084,747 34.00 51 5.84 0.1724 3.20 5230 5251 51 0.00 1.01 1.05 3.38 3,638,776
Cedar Ridge 34.30 51 5.84 0.1724 3.20 5230 5254 10 0.00 1.00 1.05 3.36 271,434 38.00 51 5.84 0.1724 3.20 5000 5269 64 0.00 1.01 1.05 3.40 1.557,709 38.00 51 5.84 0.1724 3.20 4900 5297 144 0.00 1.00 1.05 3.37 2.722,897 43.50 51 5.84 0.1724 3.20 4900 5338 181 0.14 1.00 1.05 3.50 4,245,758 45.50 51 5.84 0.1724 3.20 4780 5358 219 0.31 1.01 1.05 3.71 1.996,163 51.00 51 5.84 0.1724 3.20 4840 5406 291 0.83 1.00 1.05 4.03 5.966.179 56.00 51 5.84 0.1724 3.20 4680 5452 333 0.82 1.00 1.05 4.22 5,682.288 62.70 51 5.84 0.1724 3.20 5000 5513 278 0.57 1.00 1.05 3.98 4.60 7,339,473 85.00 51 5.84 0.1724 3.20 5210 5534 181 0.14 1.01 1.05 3.54 4.60 2,245,581 81.50 51 5.84 0.1724 3.20 5100 5585 171 0.09 1.00 1.05 3.47 3.268,295 71.00 51 5.84 0.1724 3.20 5200 5511 185 0.16 1.00 1.05 3.54 2.380,692
Pnseure Control Station 400,000 71.01 51\ 5.84\ 0.1724\ 3.20 5200 5511 188 0.17 1.01 1.05 3.58 9,598 76.00 511 5.84J 0.1724 3.20 5450 5834 134 0.00 1.00 1.05 3.38 4.538,183 -~
10.00 51! 5.84J 0.17241 3.20 5810 5870 53 0.00 1.00 1.05 3.37 3,632,806 Telegraph Flat Saddle
10.50 51 5.84 0.1724 3.20 5610 5875 27 0.00 0.30 1.00 1.05 3.68 494,802 16.50 51 5.84 0.1724 3.20 5310 5729 104 0.00 1.00 1.05 3.37 5,452,380 11.00 51 5.84 0.1724 3.20 5630 5770 121 0.00 0.80 1.01 1.05 4.23 4.80 5.232,845 11.10 51 5.84 0.1724 3.20 5830 5778 62 0.00 0.80 1.00 1.05 4.20 4.80 1.039,738 12.10 51 5.84 0.1724 3.20 4920 5787 220 0.31 0.80 1.07 1.05 4.85 4.80 1,198,042 15.20 51 5.84 0.1724 3.20 4580 5808 458 1.88 0.80 1.01 1.05 6.24 4.029,702
Cockscomb Pump Sta,llft (ft) • 1201 15.30 51 5.84 0.1724 3.20 4520 4603 63 0.00 1.04 1.05 3.48 4.60 96.272 11.50 51 5.84 0.1724 3.20 4370 4832 95 0.00 1.00 1.05 3.37 2.908,122
100.80 51 5.84 0.1724 3.20 4470 4651 106 0.00 1.00 1.05 3.38 1.908.588 102.00 51 5.84 0.1724 3.20 4&40 4684 48 0.00 1.01 1.05 3.40 1.281,176 102.10 51 5.84 0.1724 3.20 4640 4665 11 0.00 1.00 1.05 3.36 90,478 101.70 51 5.84 0.1724 3.20 4480 4725 58 0.00 1.00 1.05 3.37 5.985,042 110.50 51 5.84 0.1724 3.20 4340 4741 140 0.00 1.01 1.05 3.38 1.840.557 114.30 51 5.84 0.1724 3.20 31160 4776 284 0.51 0.30 1.01 1.05 4.25 4,345,678 116.50 51 5.84 0.1724 3.20 3960 4796 358 0.96 0.30 1.00 1.05 4.68 2.774,950 111.40 51 5.84 0.1724 3.20 3700 4822 424 1.55 0.30 1.01 1.05 5.35 4.80 4,248,961 111.40 Lake Powell Pump Sta, lift (ft) • 1172 0.59 Ave. Unit Cost • 4.01 Sllflin-dla
Lake Powell Elevation (ft) • 3650 Ave. UnH Cost • .205 $M PIPEUNE TOTALS 129.982,439
I Pipeline Annual Net • 6,694,752
PUMP STATION($) Ave Off Peak On Peak Flow Head HGL Power(kW)
I I (Sikwh) (Sikwh) (Sikwh) (cfs) (11) (11) 85% ellic. Energy Costs ... 0.035 0.030 0.045 82.88 2379 6029 19,839 6,021.225 Capital Costs ........................................... 15,500,000 798,328 O&MCosts 155,000
I Pump Station Annual Net • 6,974,553
HYDROSTATION Ave Off Peak On Peak Flow Head HGL P-(kW) (Sikwh) (Sikwh) (Sikwh) (Cfa) (11) (11) 82% ellic.
Energy Revenue ... 0.045 0.030 0.045 62.88 1912 4942 11,001 -4.336.425 Capital Costs ........................................... 4,100,000 211.171 Regulating Reservoir Cost (based on size In MG) • 0 MG 0 0 O&MCosts I 120.000
I I I I Hydrostation Annual Net • -4,005.255 Total ConS1rUCIIon Cost w/10% contingency 149,582,439 15% Design & Admin. I I 22,437.388 1,449,608 1 0% Added Contingency I I 14,958,992 966,453 TOTAL PROJECT COST (with 15% dnign & admln., & 20% contingency) 116,971,796 12,010,111
UNIT WATER COST, FULL USE (SIAc.ft), (for -r c011t • $0 at Lake Powell) 201 YEARLY OPERATING COST, PEAK FLOW (Energy+ O&M) I, 1,1&1,100
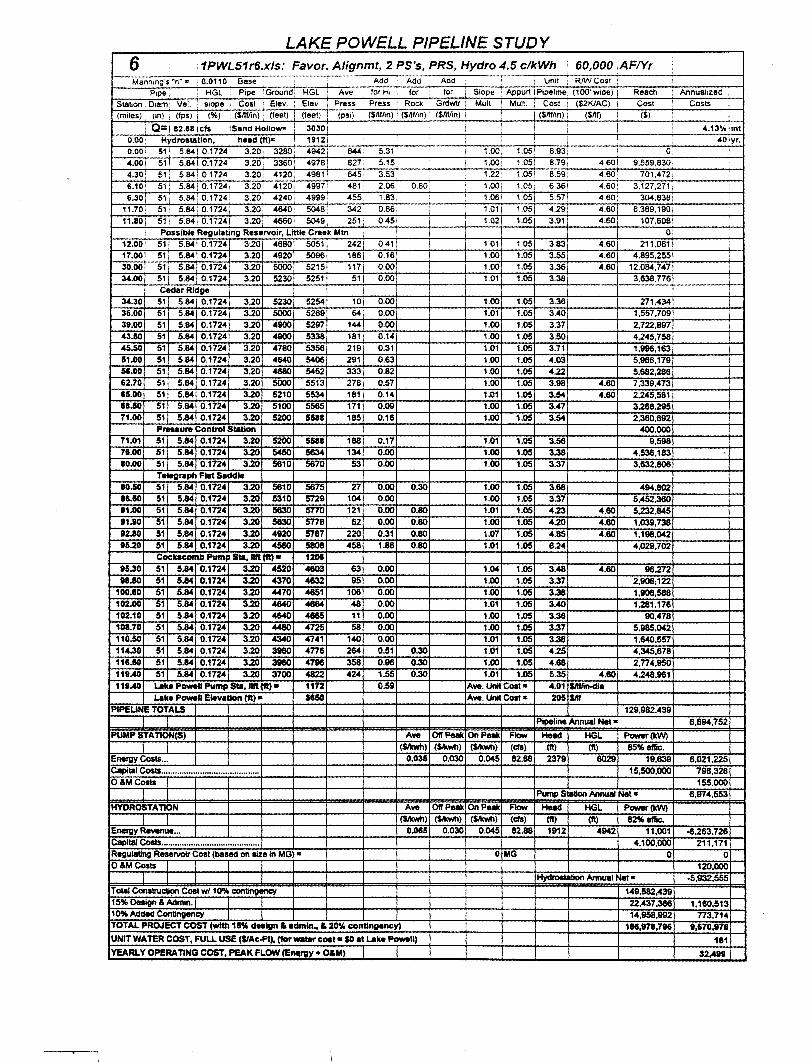
LAKE POWELL PIPELINE STUDY 6 : 1PWL51r6.xls: Favor. Alignmt, 2 PS's, PRS, Hydro 4.5 clkWh 60,000 .AF!Yr Mannmg·s .. n .. = 0.0110 Base Add ' Add Add Unit RN>I Cost :
1 P1pe: HGL ' Pipe !Ground HGL Ave torH1 : for ' for ' Slope : Appurt I Pipeline (100'wtde) 1 Reach Annualized I
Stabon : Dtam: Vel. stope 1 Cost 1 E•ev : Etev Press , Press RoCk ; Grdwtr : Mutt. I Mult. : Cost I ($2KIAC) ' Cost Costs ' (miles) (m) 1 (Ips) i (%) I (Snffln) : (teet) ' (teet) : (pSi) • ($/lfftn) I (SIIffln) · (SIIflin) 1 : (SIIIftn) i ($!If) ($)
i Q:l I:Z.I81Cfs !Sand Hollow= I 3030! I i i I I I I 4.13'/oilnt o.oo• Hydrostation, heed (ft)= ' 1912; i I i ' 401yr.
0.001 51' 5.841 0.1724! 3.20' 3280· 4942! 844! 5.31 I 1.00; 1.05; 8.93! 0,
4.001 511 5.841 0.1724 : 3.201 3360: 497Bi 8271 5.15i I 1.00! 1.051 8.791 4.601 9.559,830- I
4.30' 51. 584'01724: 3.20, 4120, 4981 645 3.53; 1.22: 1.05! 8.59; 460 701.472! I
6.10' 51: 5.841 0.172-41 3.20L 4120 -49971 481 2.06: 0.80, 1.001 1.05, 6.361 -4.60' 3,127,2711
6.30 51' 5.8-4: 0.172-4: 3.20: 4240: -4999' -455 1.83! I 1.061 1.051 5.57 4.60: 30-4,B38i 11.701 51 I 5.8-4 0.172-4' 3.20 4640! 50-48; 342 0.86! I 1.01 1.051 429! 4.60' 6,369.190j
11.801 511 5.84J0.17241 3.20l 4660! 5D49[ 251' 0.45 I 1.02 1.05 3.911 4.60 107.6081
i Possible Regulating Reservoir, Little Creek Mtn I I 0: 12.00 51 5.8-4 0.172-4 3.20 4680 5051 242' 041 I 1.01 1.05 3.83 4.60 211.0611 17.00 51 5.84 0.1724 3.20 4920 5096 1861 0.16 1.00 1.05 3.55 -4.60 4.895.2551 30.001 51 5.84 0.1724 3.20 5000 5215 1171 0.00 1.00 1.05 3.36 4.60 12.084,747 34.00 51 5.84 0.1724 3.20 5230 5251 51 I 0.00 1.01 1.05 3.38 3,638.776
Cedar Ridge ! 34.30 51' 5.84 0.1724 3.20 5230 525-4 101 0.00 1.00 1.05 3.36 271,434 36.00 51 5.84 0.1724 3.20 5000 5269 64 0.00 1.01 1.05 3.40 1.557,709 39.00 51 5.84 0.1724 3.20 4900 5297 14-41 0.00 1.00 1.05 3.37 2.722,897 43.50 51 5.84 0.1724 3.20 4900 5338 181• 0.14 1.00 1.05 3.50 4,245,758 45.50 51 5.84 0.1724 3.20 4780 5356 219' 0.31 1.01 1.05 3.71 1.996,163 51.00 51 5.84 0.1724 3.20 4840 5406 291 0.63 1.00 1.05 4.03 5,966,179 56.00 51 5.84 0.1724 3.20 4880 5452 333 0.82 1.00 1.05 4.22 5,692,288 62.70 51 5.84 0.1724 3.20 5000 5513 278 0.57 1.00 1.05 3.98 4.60 7,339,473 65.00 51 5.84 0.1724 3.20 5210 5534 181 0.14 1.01 1.05 3.54 4.60 Z.245.581 8a.ao 51 5.84 0.1724 3.20 5100 5565 171 0.09 1.00 1.05 3.47 3.288,295 71.00 51 5.84 0.1724 3.20 5200 UN 185 0.16 1.00 1.05 3.54 2,380,692
Pressure Control Station 400.000 71.01 511 5.84! 0.1724! 3.20 5200 5AI 188 0.17 1.01 1.05 3.58 9,598 76.00 511 5.84! 0.1724! 3.20 5450 5634 134 0.00 1.00 1.05 3.38 4,536,183 10.00 51! 5.841 0.17241 3.20 5810 5870 53 0.00 1.00 1.05 3.37 3,632.806
T elegl'llph Flat Saddle 10.50 51 5.84 0.1724 3.20 5810 5875 27 0.00 0.30 1.00 1.05 3.88 494,802 86.50 51 5.84 0.1724 3.20 5310 5729 104 0.00 1.00 1.05 3.37 5,452.360 81.00 51 5.84 0.1724 3.20 6630 5770 121 0.00 0.80 1.01 1.05 4.23 4.80 5.232,845 81.80 51 5.84 0.1724 3.20 6630 5778 62 0.00 0.80 1.00 1.05 4.20 4.80 1.039,738 12.80 51 5.84 0.1724 3.20 4920 5787 220 0.31 0.80 1.07 1.05 4.85 4.60 1,198.042 15.20 51 5.84 0.1724 3.20 4580 5808 458 1.88 0.60 1.01 1.05 8.24 4.029,702
Cockscomb Pump Sta, 11ft (ft) • 1206 15.30 51 5.84 0.1724 3.20 4520 <4803 63 0.00 1.04 1.05 3.48 4.80 96.272 Ill .SO 51 5.84 0.1724 3.20 4370 4632 95 0.00 1.00 1.05 3.37 2,110&.122
100.80 51 5.84 0.1724 3.20 4470 4651 106 0.00 1.00 1.05 3.38 1,908,588 102.00 51 5.84 0.1724 3.20 4840 4664 48 0.00 1.01 1.05 3.40 1,281.176 102.10 51 5.84 0.1724 3.20 4840 4865 11 0.00 1.00 1.05 3.36 90,478 1011.70 51 5.84 0.1724 3.20 4480 4725 58 0.00 1.00 1.05 3.37 5,985,042 110.50 51 5.84 0.1724 3.20 4340 4741 140 0.00 1.01 1.05 3.38 1,840.557 11-UO 51 5.84 0.1724 3.20 3960 4776 264 0.51 0.30 1.01 1.05 4.25 4,345.678 116.50 51 5.84 0.1724 3.20 3960 4796 358 0.96 0.30 1.00 1.05 4.88 2.774,950 111AO 51 5.84 0.1724 3.20 3700 4822 424 1.55 0.30 1.01 1.05 5.35 4.80 4.248.961 111AO Lake Powell Pump Sta, 11ft (ft) • 1172 0.59 Ave. Unit Costa 4.01 $/lflin-dia
Lake Powell ElevatiOn (ft) • H50 Ave. Unit Colt,. 205 sm PIPEUNE TOTALS 129.982,439
I I Pipeline Annual Net • 8,894,752
PUMP STA TION(S) Ave OlrPeak On Peak FkM Head HGL Power(kW)
I I ($1kwh) ($1kwh) ($Jkwll) (cfs) (11) (1'1) 85% effie. Energy Costs ... 0.035 0.030 0.045 82.88 2379 8029 19,839 6,021,225 Capital Cosu ........................................... 15,500,000 798,328 O&MCosts I 155,000
1 J Pump Station Annual Net • 6,974.553
HYDROSTATION Ave OlrPeak On Peak FkM Head HGL P-.r(kW)
I I ($/kwh} ($Jkwll) ($Jkwll) (cfs) (11) (Ill 82% effie. Energy Rawnue ... 0.065 0.030 0.045 82.88 1912 4942 11,001 -6,263.726 Capital Costs ........................................... 4.100,000 211,171 Regulating Reservoir Cost (baSed on me in MG) • 0 MG 0 0 O&MCosts J J l J 120,000
J J J J J Hydrostalion Annual Net • -5,932.555
Total Construelion Cost w/10'10 contingency 149.582,439 15% Design & Admin. I I I 22.437,388 1.180,513 1 0'10 Added Continglll1cy I I 14.958,992 773,714 TOTAL PROJECT COST (with 11% dealgn & admln., & 20% contingency) 188,171,718 1,&70,176
UNIT WATER COST, FULL USE ($/Ac-4"1), (for water coat a $0 at Lake Powell) 181
YEARLY OPERATING COST, PEAK FLOW (E~rgy + O&.M) I 32,4119
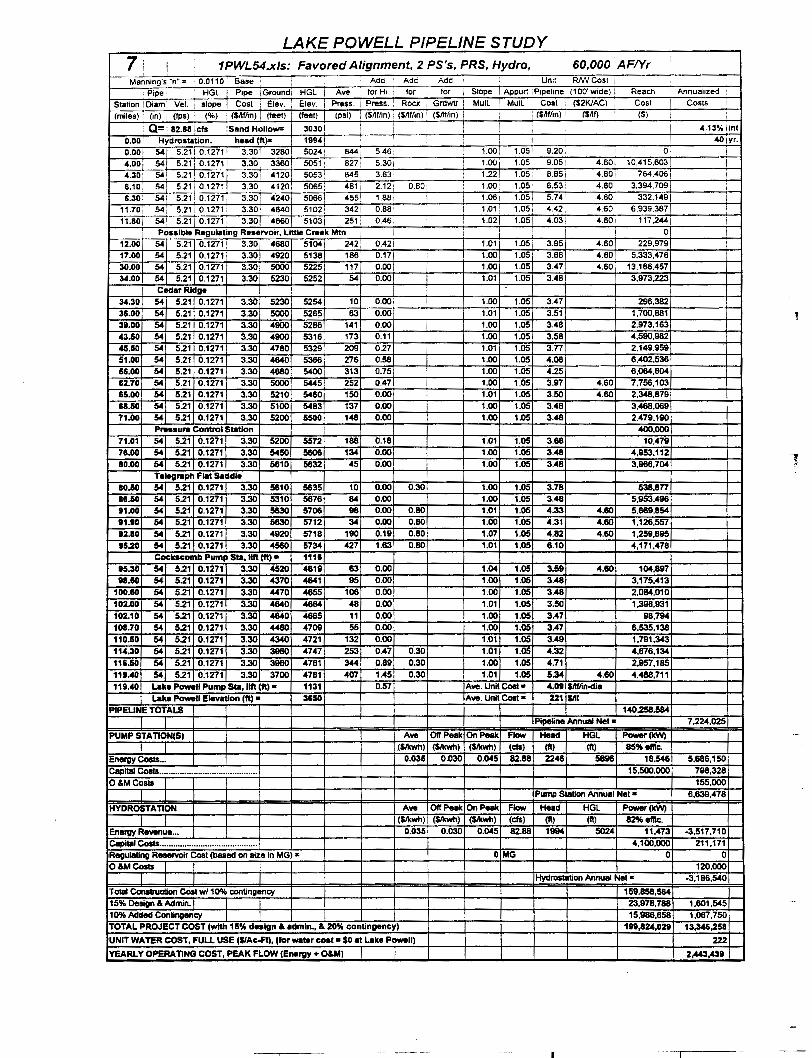
LAKE POWELL PIPELINE STUDY 7! i 1 PWL54.x/s: Favored Alignment, 2 PS's, PRS, Hydro, 60,000 ,AF!Yr i
Manning's .. n .. = 0.0110 i Base Add Add Add I I Unit RN>J Cost 1
i Pipe i HGL ' Pipe ;Ground! HGL i Ave forH• for for Stope i Appurt I Pope line. (100' wide) Reach Annualized
Station I Oiam 1 Vel. slope 1 Cost i Elev. Elev. ' Press. 1 Press. : Rocl< Grdwtr I MulL Mult. I Cost ($2KIAC) I Cost Costs
(miles) : (in) ! (fps) (%) ($11flin) (feel) I (feet) I (psi) ! (SM!in) i (Snffon) , (Snflin) i I I ($nffon) i ($AI) ! ($) I
i Q= 1 82.18 lets !Sand Hollow= 30301 I I I I I : 4.13% int
O.OOi Hydrostation, head (ft)a I 1994! : '
I I i ~1yr.
0.00. 54/ 5.211 0.1271' 3.30 3280! 5024: 8441 546 1.00/ 1.051 9.20; I 0' ! 4.00! 54 5.21 t 0.12111 3.30\ 33601 5051' 827' 5.30, 1.00i 1.05! 9.05/ 4.601 10,415.6031 I
4.30' 54 5.21' 0.12711 3.30; 4120! 5053' 645 1 3.63 1.221 1.05; 8.85, 4.601 764.4061
6.10 54 5.211 0.1271' 3.30, 4120: 5065 1 481 i 2.12; 0.80, 1.001 1.051 6.53! 4.601 3,394,709\
6.30 54 5.21: 0.1271 3.30, 4240\ 5066/ 455, 1.881 I I 1.061 1.05 5.741 4.601 332.1491 i 11.70 54i 5.21 I 0.1271 3.301 4640, 51021 342' 0.88 i : 1.01: 1.05! 4.42 4.601 6.939.3871 ;
11.80 54 5.21 0.1271 3.30 46601 5103; 251 0.461 I I 1.021 1.05 4.03 4.60! 117,2441 Possible Regulating Reservoir, Little Creek Mtn I i
I O! 12.00 54 5.21 0.1271 3.30 4680 51041 242 0.421 1.01 1.05, 3.951 4.60 229.979 17.00 54 5.21 0.1271 3.30 4920 5138\ 186 0.17 1.00 1.05 3.66 4.60 5.333,476
30.00 54 5.21 0.1271 3.30 5000 52251 117 0.00 1.00 1.05 3.47 4.60 13.166,457 34.00 54 5.21 0.1271 3.30 5230 52521 54 0.00 1.01 1.05 3.48 3,973.223
Cedar Ridge I I 34.30 54 5.21 0.1271 3.30 5230 5254 10 0.001 1.00 1.05 3.47 296,382
36.00 54 5.21 0.1271 3.30 5000 5265 63 0.00 I 1.01 1.05 3.51 1,700,881
311.00 54 5.21 0.1271 3.30 4900 5286 141 0.00 1.00 1.05 3.48 2.973,163
43.50 54 5.21 0.1271 3.30 4900 5316 173 0.11 1.00 1.05 3.58 4.590,982
45.50 54 5.21 0.1271 3.30 4780 5329. 209 0.27 1.01 1.05 3.n 2.149.959
51.00 54 5.21 0.1271 3.30 4640 5366 276 0.58 1.00 1.05 4.08 6,402,536
56.00 54 5.21 0.1271 3.30 4680 5400 313 0.75 1.00 1.05 4.25 6,064,804
62.70 54 5.21 0.1271 3.30 5000 5445 252 0.47 1.00 1.05 3.97 4.60 7,758,103 65.00 54 5.21 0.1271 3.30 5210 5460 150 0.00 1.01 1.05 3.50 4.60 2.348.879 61.50 54 5.21 0.1271 3.30 5100 5483 137 0.00 1.00 1.05 3.48 3,468,069 71.00 54 5.21 0.1271 3.30 5200 5500 148 0.00 1.00 1.05 3.48 2.479.190
Pr.nure Control Station 400,000 71.01 54 5.211 0.12711 3.30 5200 5572 188 0.18 1.01 1.05 3.68 10,479 78.00 54 5.21 0.12711 3.30 5450 5608 134 0.00 1.00 1.05 3.48 4,953,112 10.00 54l 5.21 0.1271 3.30 5610 5832 45 0.00 1.00 1.05 3.48 3,986,704 -1
Telegraph Flat Saddle 80.50 54 5.21 0.1271 3.30 5610 5835 10 0.00 0.30 1.00 1.05 3.78 538.8n 16.50 54 5.21 0.1271 3.30 5310 5676 84 0.00 1.00 1.05 3.48 5,953,496 11.00 54 5.21 0.1271 3.30 5830 5706 96 0.00 0.80 1.01 1.05 4.33 4.60 5.869,854 11.10 54 5.21 0.1271 3.30 5830 5712 34 0.00 0.80 1.00 1.05 4.31 4.60 1,126,557
12.80 54 521 0.1271 3.30 4920 5718 190 0.19 0.80 1.07 1.05 4.82 4.60 1,259,885 15.20 54 5.21 0.1271 3.30 4560 5734 427 1.63 0.60 1.01 1.05 6.10 4,171,478
Cockac:omb Pump Sta, lift (ft) • 1111
15.30 54 5.21 0.1271 3.30 4520 4819 63 0.00 1.04 1.05 3.59 4.60 104,897 11.50 54 5.21 0.1271 3.30 4370 4641 95 0.00 1.00 1.05 3.48 3,175,413
100.80 54 5.21 0.1271 3.30 4470 4855 106 0.00 1.00 1.05 3.48 2,084,010
102.00 54 5.21 0.1211 3.30 4640 4864 48 0.00 1.01 1.05 3.50 1,398,931 102.10 54 5.21 0.1271 3.30 4640 4865 11 0.00 1.00 1.05 3.47 98,794 101.70 54 5.21 0.1271 3.30 4480 4709 55 0.00 1.00 1.05 3.47 6.535,138 110.50 54 5.21 0.1271 3.30 4340 4121 132 0.00 1.01 1.05 3.49 1,791,343
114.30 54 5.21 0.1271 3.30 3960 4747 253 0.47 0.30 1.01 1.05 4.32 4,676,134
116.50 54 5.21 0.1211 3.30 3960 4781 344 0.89 0.30 1.00 1.05 4.71 2,957,185
1111.40 54 5.21 0.1271 3.30 3700 4781 407 1.45 0.30 1.01 1.05 5.34 4.60 4,488,711
119.40 Lake P-11 Pump Sta, lift (ft) • 1131 0.57 Ave. unit Cost • 4.01 $/If/in-dia
Lake Powell Elevation (ft) • 3650 Ave. Unit Cost • 221 $llf PIPEUNE TOTALS 140.256.584
Pipeline Annual Net • 7.224.025
PUMP STAnON(S) Ave 011 Peak On Peak Flow Heed HGL Power(kW)
I (Sio<wh) (Sio<wh) (Sio<wh) (cb) (ft) (ft) 85%etllc.
Energy Costs ... 0.035 0.030 0.045 82.88 2246 5898 18.546 5,686,150
Capital Costs ........................................... 15,500,000 798,328
o &M CosiS 155,000
I Pump Station Annual Net • 6,639,478
HYDROSTAnON Ave Oil Peak On Peak Flow Heed HGL Power(kW) (Sio<wh) (Sio<wh) ($/kwh) (cb) (ft) (ft) 82%etllc.
Energy Revenue ... 0.035 0.030 0.045 82.88 1994 5024 11,473 -3,517,710
c:.pital Costs ........................................... 4,100,000 211.171 Regulating ReseNOir Cost (based on size in MG) c 0 MG 0 0 O&Meosts I I 120,000
I Hydrostalion Annual Net • -3,186,540
Total Construction Cost w/1 0% contingency 159,858,584 15% Design & Admin. I I 23,978,788 1,601,545 10% Added Contingency I 15,986,856 1,067,750 TOTAL PROJECT COST (with 115% dnlgn & edmln., & 20% contingency) 11111,124,021 13,346,258
UNIT WATER COST, FULL USE ($/Ac-Ft), (for -ter cost • SO at Lake P-11) 222
YEARLY OPERA nNG COST, PEAK FLOW (Energy + O&M) I I 2,443,439
r

LAKE POWELL PIPELINE STUDY 8 i 2PWL51 H4.xls: So. Little Crk Mt, 2 PS's, 33 MW Hydro, +1c: 60,000 1AF!Yr i
Manmng·s ·n· = , 0.0110 Base ' I Add Add Add ' ! Unit I RfNCost t I
: P1pe 1 ' HGL P1pe !Gnoundl HGL I Ave forH1 1 for I for I Slope I Appurt !Pipeline, (100' wiele) 1 Reach ' AnnualiZed ' Stabon l O&am; VeL slope . Cost ! Elev. i Elev. I Press. 1 Press. 1 Rod< I Grelwtr Mull. Mull. i Cost I ($2KIAC) I Cost Costs I (miles) I (in) i (Ips) 1 (%) i ($1lff.n) I !feet) ; (feet) (psi) 1 (Silffln) , (Snffln) ! CSMfln) I ! (SMfin)l ($111) ! ($) i
t Q=! 82.88 I efs !Sand Hollow= I 3a.oi I I I i I I 4.13%llnt
0.001 Hydrostation, head (ft)& ' 19001 ' I I I <4Diyr. 0.00· 69! 9.58' 0.30891 440! 32801 4~0: 7881 5.59: I I 1.001 1.05. 10.491 I 0 I 3.001 69' 9.58 0.3089 i 4.40, 3300' 4989 7841 5.541 I 1.00( 1.051 10.451 4.601 11,489,432
3.50! 691 9.581 0.3089! 440i 3400 4997 758[ 5.27' 1 1.02 1.05[ 10.351 4.60 1.896.821
4.001 69i 9.58! 0.3089 i 4.40, 3700' 50051 671' 4.37! 0.801 ' 1.06 1.05' 10.611 4.60 1,944,372: I '
4.50! 691 9.58! 0.30891 20.00! 4550! 50131 4221 1.79 '
i 1.15 1.05 26.30! 4.60 4,803,575! ! ! Tunnel & Possible Regulating Reservoir, Hurricane Cliffs I I I I I I
6.30 69 9.581 0.3089 4.40 48001 5043! 184! 0.18! I 1.011 1.05 4.871 4.60 3,236,214
13.00 531 5.41 0.14041 3.271 43801 5092, 221 0.32, I I 1.01 1.05 3.791 4.601 7,270.018
16.001 53 5.41 0.14041 3.27 4380 5107 312 0.741 1.00 1.05 4.20' 4.60 2,400,641
17.00 53 5.41 0.1404 3.27 4800 5122 227 0.35 1.02 1.05 3.87 4.60 2.216.539 22.00 53 5.41 0.1404 3.Z7 4970 5159 111 0.00 1.00 1.05 3.44 4.60 4,936,123
34.00 53 5.41 0.1404 3.27 5230 5246 45 0.00 1.00 1.05 3.44 4.60 11,833.279 Cedar Ridge
34.30 54 5.21 0.1271 3.30 5230 5250 8 0.00 1.00 1.05 3.47 4.60 303.669 36.00 54 5.21 0.1271 3.30 5000 5282 61 0.00 1.01 1.05 3.51 4.60 1,742,171 311.00 54 5.21 0.1271 3.30 4900 5282 139 0.00 1.00 1.05 3.48 2,973,163
43.60 54 5.21 0.1271 3.30 4900 5312 172 0.10 1.00 1.05 3.57 4,580,679 -'5.60 54 5.21 0.1271 3.30 4780 5325 207 0.26 1.01 1.05 3.76 2.145,355 51.00 51 5.84 0.1724 3.20 4840 5375 277 0.57 1.00 1.05 3.97 5,873,781 56.00 51 5.84 0.1724 3.20 4680 5421 320 0.76 1.00 1.05 4.16 5,598.428 62.70 51 5.84 0.1724 3.20 5000 5462 265 0.51 1.00 1.05 3.92 4.60 7.226.680 15.00 51 5.84 0.1724 3.20 5210 5503 168 0.08 1.01 1.05 3.47 4.60 2,206,703 68.60 51 5.84 0.1724 3.20 5100 5535 158 0.03 1.00 1.05 3.41 3,209,463 71.00 51 5.84 0.1724 3.20 5200 5157 172 0.10 1.00 1.05 3.47 2,338,636
P,...u,. Control Station 400.000 71.10 511 5.84 0.17241 3.20 5200 5557 168 0.17 1.01 1.05 3.56 95,976 76.00 511 5.841 0.17241 3.20 5450 5602 134 0.00 1.00 1.05 3.38 4,454.388 10.00 511 5.8410.17241 3.20 5610 5639 39 0.00 1.00 1.05 3.37 3,632,808
Telegraph Flet Saddle 60.50 54 5.21 0.1271 3.30 5610 5842 13 0.00 0.30 1.00 1.05 3.78 538,877 18.50 54 5.21 0.1271 3.30 5310 5682 87 0.00 1.00 1.05 3.46 5,953,498 11.00 54 5.21 0.1271 3.30 5630 5712 98 0.00 0.80 1.01 1.05 4.33 4.60 5,689,854 111.110 54 5.21 0.1271 3.30 5630 5718 37 0.00 0.80 1.00 1.05 4.31 4.80 1,128,557 12.80 54 5.21 0.1271 3.30 4920 5724 193 0.20 0.80 1.07 1.05 4.84 4.80 1.263.141 15.20 54 5.21 0.1271 3.30 4560 5741 430 1.65 0.80 1.01 1.05 6.12 4,190.379
Cockacomb Pump Sta,llft (fl) • 1122 15.30 54 5.21 0.1271 3.30 4520 4819 63 0.00 1.04 1.05 3.59 4.60 104.697 118.50 54 5.21 0.1271 3.30 4370 4841 95 0.00 1.00 1.05 3.48 3,175,413
100.60 54 5.21 0.1271 3.30 4470 4855 106 0.00 1.00 1.05 3.48 2,084,010 102.00 54 5.21 0.1271 3.30 4840 4884 46 0.00 1.01 1.05 3.50 1,398,931 102.10 54 5.21 0.1271 3.30 4840 4865 11 0.00 1.00 1.05 3.47 98,784 108.70 54 5.21 0.1271 3.30 4480 4709 55 0.00 1.00 1.05 3.47 6,535,138 110.50 54 5.21 0.1271 3.30 4340 4721 132 0.00 1.01 1.05 3.49 1,791,343 114.30 54 5.21 0.1271 3.30 3960 4747 253 0.47 0.30 1.01 1.05 4.32 4,676,134 118.50 54 5.21 0.1271 3.30 3960 4781 344 0.89 0.30 1.00 1.05 4.71 2,957,185 1111.40 54 5.21 0.1271 3.30 3700 4781 407 1.45 0.30 1.01 1.05 5.34 4.80 4,468,711 1111.40 Lake '"-11 Pump Sta, Hft (ft) • 1131 Ave. Unit Coat • Sllflln-dia
Lake "--I Elevation (ft) • 3610 Ave. Unit Coat " Sllf PJPEUNE TOTALS 144,682.252
I Pipeline Annual Net • 7,461,137
PUMP STATlON(S) Ave Oil Peak On Peak FlOw Hull HGL Power(kW)
I I ($/kWh) ($/kWh) (Sikwh) (cfs) (11) (11) 85'11. ellic. Energy Costa ... O.D35 0.030 0.045 82.68 2253 5903 18,600 5,702,658
Capital CoalS ........................................... 15,500.000 798,328 O&MCoats I 155.000
I I Pump Station Annual Net • 6,655,987
HYDROSTAnON Ave Oil Peek On Peak Flow Head HGL Pawer(kW)
I I ($/kWh) ($Jkwh) ($11<wh) (cfs) (11) (II) 82% ellic. Energy Revenue ... 0.0-'5 0.030 0.085 82.68 1900 4840 32,600 -4,309,695 Capital Coats ........................................... 9,300,000 478,997 Regulllling R...voir Coat (based on lize In f/IFJ • 110 AF 3.600.000 318,667 O&MCoats J I 260,000
I I I Hydrostallon Annual Net " -3.234.231
T otaJ Construction Coat wl10'11o contingency 169,682.252 15% Design &Admin.L 25,449,338 1,632,434 10'11o Added Contingency 16,987,073 1,088.344 TOTAL PROJECT COST (with 15% clulgn & admtn., & 20% contingency) 212,071,163 13,803,870
UNIT WATER COST, FULL USE (S/Ac-Ft), (for watar co.t a $0 at Lake P_.ll) 227
YEARLY OPERATING COST, PEAK FLOW (Energy+ O&M) 1,127,713
T
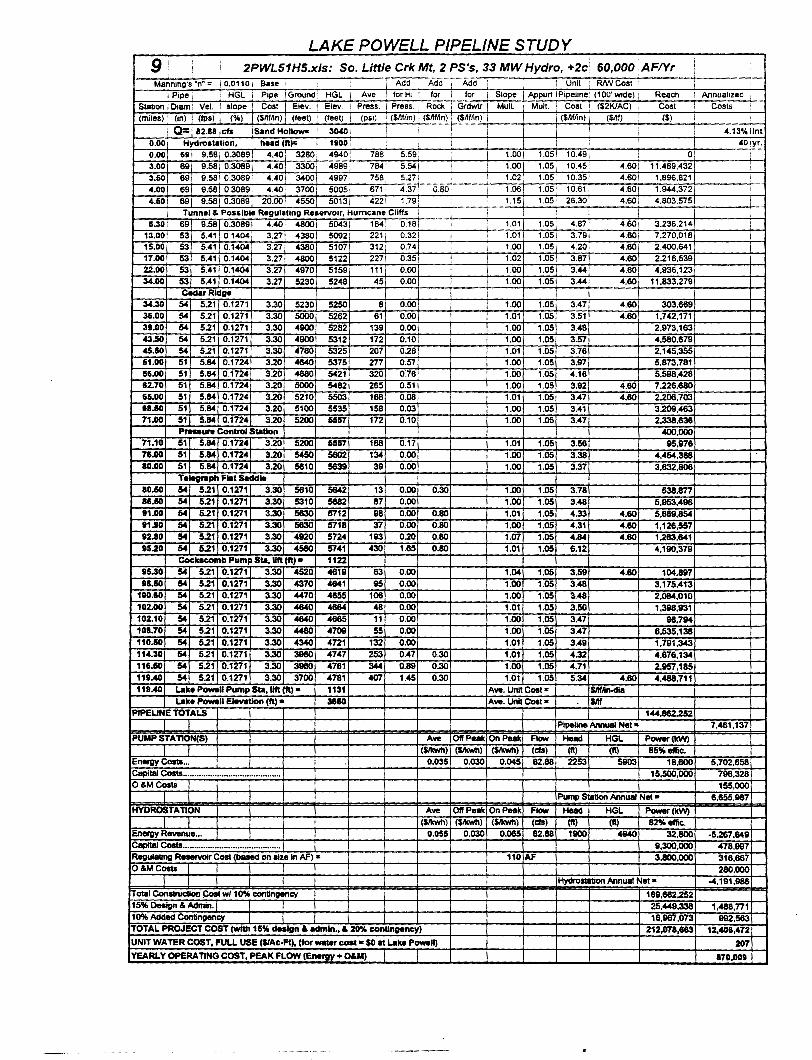
LAKE POWELL PIPELINE STUDY 9! i f 2PWL51H5.xls: So. Little Crk Mt, 2 PS's, 33 MW Hydro, +2ci 60,000 .AF/Yr Mannmg's "n" = 1 0.0110 1 Base Add Add Add I Unit I RNVCost i
I Pope· HGL 1 Pope ;Ground' HGL i Ave ! forHo i for I for i Slope Appurt I Pipeline. (100' wide) Reach AnnuaJozed
Slatoon Ooaml Vel. slope 1 Cost Elev. ! Elev. ! Press. I Press. 1 ROCI< 1 Gl'dWtr I Mull. Mull. ! Cost L ($2KIAC) I Cost Costs (miles) I (on) . (Ips) (%) I (SM/in) I (feet) 1 (feet) i (psi) ! (SMftn) (Snf/in) . (Sntlin) 1 I i (Snt/in) · ($nf) I ($) I
I Q=i 82.88 c:fs isand Hollo- I 30401 i ! 4.13'~1int
o.oo 1 HydroaUition, heed (ft): 1 1100! I I I I 40oyr.
O.OOj 191 9.58J 0.3089 4.40 3280; 4940 788, 5.59 i 1.001 1.05 10.49' I 0< i
3.00 691 9.58! 0.30891 4.40. 33001 4989; 7841 5.54[ I i 1.ool 1.05 10.45. 4.60 11,489.432 I
3.50 69! 9.58 I 0.30891 4.40 34001 49971 758; 5.27• I I 1.02, 1.05[ 10.351 4.601 1.896,821 I
4.00 69! 9.58! 0.3089 4.40; 3700j 50051 671 4.37. 0.80' ! 1.06 1.05, 10.61 i 4.60! 1.944,372 I
4.50 691 9.58 1 0.3089 20.00. 45501 5013! 422 1.79! 1.15 1.05 26.30 4.601 4.803,575 I
Tunnel & Possible Regulating Reservoir, Hurricane Cliffs I I ! 6.30 69 9.58 0.3089 4.40 48001 5043! 1841 0.18! i i 1.01 1.05 4.87. 4.601 3.236.214
13.00 53 5.41 0.1404 3.27 43801 5092! 221 0.321 I I 1.01 1.05 3.79 4.60' 7,270,018 15.00 53 5.41 0.1404 3.27 4380 5107! 312 0.741 I 1.00 1.05 4.20 4.80 2.400.641 17.00 53 5.41 0.1404 3.27 4800 51221 227 0.35! 1.02 1.05 3.87 4.60 2.216,539 22.00 53 5.41 0.1404 3.27 4970 5159. 111 0.00 I 1.00 1.05 3.44 4.60 4,936,123 :)4.00 53 5.41 0.1404 3.27 5230 5248 45 0.00 1.00 1.05 3.44 4.60 11,833.279
Cedar Ridge :)4.30 54 5.21 0.1271 3.30 5230 5250 8 0.00 1.00 1.05 3.47 4.60 303,669 36.00 54 5.21 0.1271 3.30 5000 5262 61 0.00 1.01 1.05 3.51 4.60 1,742,171 39.00 54 5.21 0.1271 3.30 4900 5282 139 0.00 1.00 1.05 3.48 2.973,163 43.50 54 5.21 0.1271 3.30 4900 5312 172 0.10 1.00 1.05 3.57 4,580,679 45.50 54 5.21 0.1271 3.30 4760 5325 207 0.26 1.01 1.05 3.76 2,145,355 51.00 51 5.64 0.1724 3.20 4640 5375 2n 0.57 1.00 1.05 3.97 5,873,781 51.00 51 5.64 0.1724 3.20 4880 5421 320 0~76 1.00 1.05 4.16 5,598,428 82.70 51 5.64 0.1724 3.20 5000 5482 265 0.51 1.00 1.05 3.92 4.60 7.226.680 85.00 51 5.64 0.1724 3.20 5210 5503 168 0.08 1.01 1.05 3.47 4.60 2.206.703 11.50 51 5.64 0.1724 3.20 5100 5535 158 0.03 1.00 1.05 3.41 3.209,463 71.00 51 5.84 0.1724 3.20 5200 5557 172 0.10 1.00 1.05 3.47 2.338.636
Preuur. Control Station 400,000 71.10 151 5.84f 0.11241 3.20 5200 15557 168 0.17 1.01 1.05 3.58 95,976 715.00 511 5.6410.1724 3.20 5450 5602 13<1 0.00 1.00 1.05 3.38 4,454,368 10.00 51 5.64 0.17241 3.20 5610 5639 39 0.00 1.00 1.05 3.37 3,632.806
Telegraph Flat Saddle 10.60 54 5.21 0.1271 3.30 5610 5&42 13 0.00 0.30 1.00 1.05 3.78 538.en 16.50 54 5.21 0.1271 3.30 5310 5682 87 0.00 1.00 1.05 3.48 5,953,496 11.00 54 5.21 0.1271 3.30 5630 5712 98 0.00 0.60 1.01 1.05 4.33 4.60 5.689.854 91.10 54 5.21 0.1271 3.30 5630 5718 37 0.00 0.60 1.00 1.05 4.31 4.80 1,126.557 12.10 54 15.21 0.1271 3.30 4920 5724 1113 0.20 0.60 1.07 1.05 4.84 4.60 1,283,841 15.20 54 5.21 0.1271 3.30 o4560 5741 430 1.65 0.60 1.01 1.05 6.12 4.190,379
Coc:llaCOII'Ib Pump Sta, Uft (ft) • 1122 15.30 54 5.21 0.1271 3.30 4520 4619 63 0.00 1.04 1.05 3.59 4.60 104.897 98.&0 54 5.21 0.1271 3.30 4370 4841 95 0.00 1.00 1.05 3.48 3,175.413
100.60 S4 5.21 0.1271 3.30 4470 4855 106 0.00 1.00 1.05 3.48 2.084.010 102.00 54 5.21 0.1271 3.30 4640 4664 48 0.00 1.01 1.05 3.50 1.398,931 102.10 54 5.21 0.1271 3.30 4840 4685 11 0.00 1.00 1.05 3.47 118,794 108.70 54 5.21 0.1271 3.30 4480 4709 55 0.00 1.00 1.05 3.47 6.535.138 110.&0 54 5.21 0.1271 3.30 4340 4721 132 0.00 1.01 1.05 3.<19 1,7111.3<13 114.30 54 5.21 0.1271 3.30 3960 4747 253 0.47 0.30 1.01 1.05 4.32 4.876,13<1 1115.50 54 5.21 0.1271 3.30 3960 4761 344 0.89 0.30 1.00 1.05 4.71 2.1157,185 118AO 54 5.21 0.1271 3.30 3700 4781 407 us 0.30 1.01 1.05 5.3<1 4.80 4.488.711 118AO Lake Powell Pump Sta, Uft (ft)• 11S1 Ave. Unit Cost" SM/in-dia
Lake '"-II Elwlltlon (ft) • 38&0 Ave. Unit Cost • $/If
PIPEUNE TOTALS 144.862.252
L _I Pipeline Annual Net • 7,461.137
PUMP STAnDN(S) Ave OlfPUk On Peak Flow HINICI HGL Power~
I I (Sikwh) (SIKwh) (SIKwh) (cfs) (ft) (ft) 85% ellic. EnetliY Costs ... 0.035 0.030 0.045 82.88 2253 5903 18,600 5,702.658 Capital Costs ........................................... 15.500,000 798.328 O&MCosts _I 155,000
I I Pump SUition Annual Net • 8,655.987
HYDROSTATION Ave Off Peak On Peak Flow Heacl HGL Power(kW)
J I ($1kwh) (S/Kwl1) ($/kwh) (cfs) (ft) (II) 82%ef!ic. Energy Rawnue ... 0.055 0.030 0.065 82.68 1900 4940 32,600 -5.267.649 Capital Costs ........................................... 11,300,000 478,997 Regulating ReseriiOir Cost (based on sae in AF) " 110 AF 3,900,000 316.887 O&MCosts I I I I 280.000
I I I Hyclros1ation Annual Net • .o4,191,986
T CUll ConSiniCiion .Cost w/1 0% contingency 189,862.252 15% Design & Admin. I I 25.449.338 1,468,n1 10%Added Contingency 16,967,073 992.563 TOTAL PROJECT COST (with 115% design & admin., & 20% contingency) 212,G71,883 12,406,472
UNIT WA T!R COST, FULL USE ($/Ac.Pt), (for watar coat• $0 at Lake Powell) 207
YEARLY OPERATING COST, PEAK FLOW (Energv + O&M) I 170,001
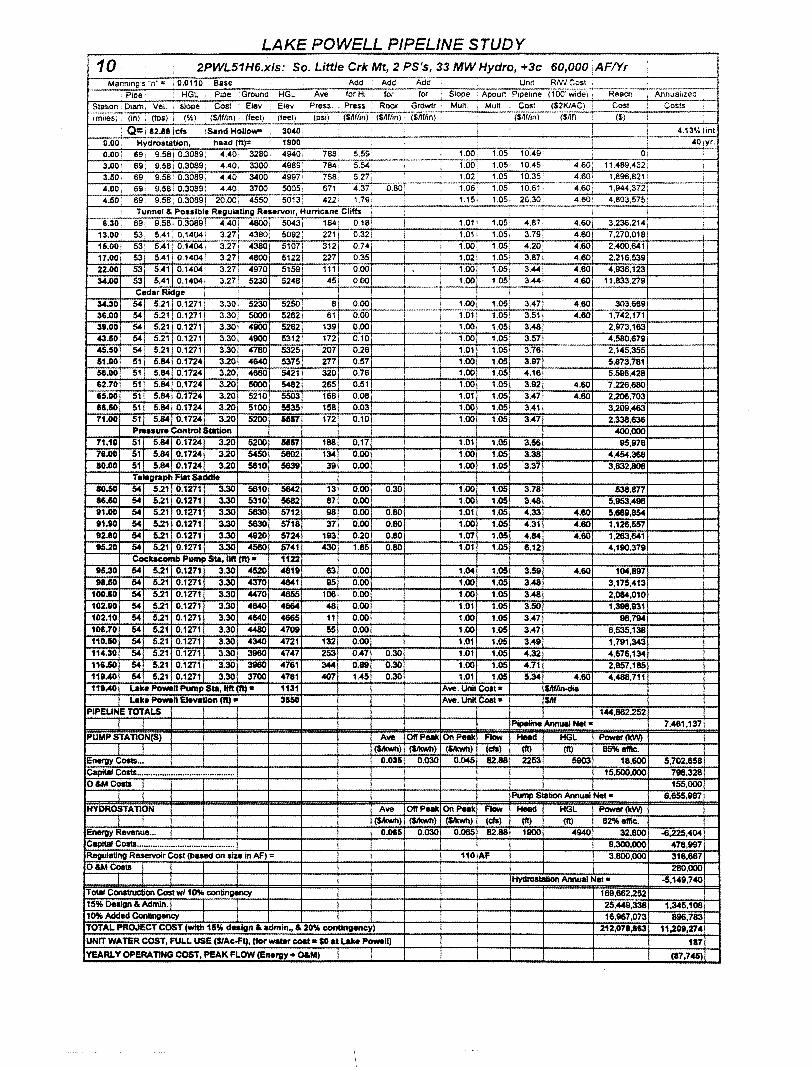
LAKE POWELL PIPELINE STUDY
10. 2PWL.51 H6.xls: So. Little Crk Mt, 2 PS's, 33 MW Hydro, +3c 60,000 .AF!Yr Manning's "n" = '0.0110 Base Ado Add Ada Unit RNJCost
: Ptpe HGL Ptpe :Ground HGL Ave torH1 tor lor I Slope : Appurt I PtpeHne ( 1 oo· wide J , ReaCh Annualized
Stabon •Otam. V"l. slope , Cost Elev Elev Press. ; Press. ROCk Grdwtr : Mult. i Mult Cost i ($2KIAC) Cost Costs
tmtles) (1M) . (IPS) 1 (%) · ($11ffln). (feet) . (feet) (p$1) ; (Snfhn) I ($nlftn) ($nfftnl, : csmtin): ($nf) ($)
: Q: i 82.118 ICfs I Sand Hollow- 3040: ' I I I 4.13·,~ lint i I
0.00 Hydrostation, head (ftl= 1900' I 40;yr.
o.oo: 69. 9.581 0.3089 4.40! 3280, 4940; 788: 5.59 1 1.00. 1 05: 1049: 0
3.00• 69: 9.581 0.3089, 4.40i 3300; 4989' 784; 5.54: I i 1.00; 1.051 10.45 4.60· 11.489,432
3.50. 69 9.58 i 0.3089' 440 34001 49971 758· 5.27: I 1.02, 1.05: 10.35 4.60i 1,896.821 I
4.00, 691 9.581 0.3089: 4.40: 3700: 5005, 671 4.37; 0.80 ' 1.06· 1.05 10.61 4.60; 1,944.372 I
4.50 1 691 9.58' 0.30891 20.001 4550; 5013: 4221 1.791 I 1.151 1.051 26.30 4.60' 4.803,575
Tunnel & Possible Regulating Reurvoir, Hurricane Cliffs ' ' i
6.301 69! 9.581 0.3089 4.401 48001 5043, 184: 0.181 ! 1.01 1.051 4.87 4.601 3.236.214 : 13.00! 53' 5.41, 0.14041 3.271 4:,!801 sosz: 221 i 0.32, i 1.011 1.051 3.79 4.601 7,270,018 ' 15.00 53 5.41 0.14041 3.27! 4380' 51071 3121 0.74 i I 1.00· 1.051 4.20 4.60 2.400.641 I
11.00 53 5.41 0.1404 3.271 4800 5122 2271 0.35 I 1.02 1.05 3.87 4.60 2.216.539
22.00 53 5.41 0.1404 3.27 4970 5159 1111 0.00 i 1.00 1.05 3.44 4,60 4,936,123
34.00 53 5.41 0.1404 3.27 5230 5248 451 0.00 I 1.00 1.05 3.44 4.60 11.833.279
Cedar Ridge I I !
34.30 54 5.21 0.1271 3.301 5230 5250 8 0.00 I I 1.00 1.05 3.47 4.60j 303.669
36.00 54 5.21 0.1271 3.30' 5000 5262 61 0.00 i I 1.01 1.05 3.51 4.60 1,742,171
39.00 54 5.21 0.1271 3.30 4900 5282 139 o.oo I 1.00 1.05 3.48 2.973,153
43.50 54 5,21 0.1271 3.30 4900 5312 172 0.10 I 1.00 1.05 3.57 4.580,679
45.50 54 5.21 0.1271 3.30 4780 5325 207 0.26 I 1.01 1.05 3.78 2.145.355 51.00 51 5.84 0.1724 3.20 4640 5375 277 0.57 I 1.00 1.05 3.97 5.873.781 56.00 51 5.84 0.1724 3.20 4680 5421 320 0.76 l 1.00 1.05 4.16 5.598,428 62.70 51 5.84 0.1724 3.20 5000 5482 265 0.51 I 1.00 1.05 3.92 4.60 7.226,680
15.00 51 5.84 0.1724 3.20 5210 5503 168 0.08 1.01 1.05 3.47 4.60 2.206.703 88.50 51 5.84 0.1724 3.20 5100 5535 158 0.03 1.00 1.05 3.41 3.209,463 71.00 51 5.84 0.1724 3.20 5200 5557 172 0.10 1.00 1.05 3.47 2.338.636
Preuure ContrOl Station 400.000 71.10 s1 I 5.841 o.1724l 3.20 5200 5557 188 0.17 1.01 1.05 3.56 95.976 78.00 511 5.841 0.1724 3.20 5450 5802 134 0.00 1.00 1.05 3.38 4.454.368 10.00 51[ 5.841 0.1724 3.20 5610 5639 39 0.00 1.00 1.05 3.37 3.632.806
Telegraph Flat S.ddle 10.50 54 5.21 0.1271 3.30 5610 5642 13 0.00 0.30 1.00 1.05 3.78 538,877 16.50 54 5.21 0.1271 3.30 5310 5682 87 0.00 1.00 1.05 3.48 5.953.498 11.00 54 5.21 0.1271 3.30 5630 5712 98 0.00 0.80 1.01 1.05 4.33 4.60 5,689,854
91.110 54 5.21 0.1271 3.30 5630 5718 37 0.00 0.80 1.00 1.05 4.31 4.60 1.126.557 92.10 54 5.21 0.1271 3.30 4920 5724 193 0.20 0.80 1.07 1.05 4.84 4.60 1.263,641 15.20 54 5.21 0.1271 3.30 4560 5741 430 1.65 0.80 1.01 1.05 6.12 4,1110,379
Cockac:Omb Pump Sta, lift (ft) • 1122 15.30 54 5.21 0.1271 3.30 4520 4819 53 0.00 1.04 1.05 3.59 4.60 104,897
91.50 54 5.21 0.1271 3.30 4370 4841 95 o.oo 1.00 1.05 3.48 3,175,413
100.50 54 5.21 0.1271 3.30 4470 4655 106 0.00 1.00 1.05 3.48 2.084,010
102.00 54 5.21 0.1271 3.30 4640 4664 48 0.00 1.01 1.05 3.50 1,398,931
102.10 54 5.21 0.1271 3.30 4640 4665 11 0.00 1.00 1.05 3.47 98,794
108.70 54 5.21 0.1271 3.30 4480 4709 55 o.oo 1.00 1.05 3.47 6.535,138 110.50 54 5.21 0.1271 3.30 4340 4721 132 0.00 1.01 1.05 3.49 1,791,343
114.30 54 5.21 0.1271 3.30 3980 4747 253 0.47 0.30 1.01 1.05 4.32 4.676,134 116.50 54 5.21 0.1271 3.30 3980 4761 344 0.89 0.30 1.00 1.05 4.71 2.957,185
119.40 54 5.21 0.1271 3.30 3700 4761 407 1.45 0.30 1.01 1.05 5.34 4.60 4.488,711
119.40 l.eke P-11 Pump Sta, 11ft (ft) • 1131 Ave. Unit COat • $llflin-dia l.eke Powell Elevation (It) • 3150 Ave. Unit Cost • $/If
PIPEUNE TOTALS 144.882.252
I I Pipeline Annual Net • 7,481,137
PUMP STAnON(S) Ave OlfPuk On Peak Flow Head HGL Power (leW)
I ($!KWh) ($!KWh) ($/kWh) (cfll) {ft) (ft) 85%ellic.
Energy Costs ... 0.035 0.030 0.045 82.88 2253 51103 18.600 5,702.658
capital Costs ........................................... 15.500,000 798.328
O&MCosts 155,000
I I Pump Station Annual Net • 6,655,987
HYDROSTAnON Ave OlfPuk On Peak Flow Head HGL Power(kW)
I ($!KWh) ($!KWh) ($/kWh) (cfll) {ft) {ft) 82%eftic:.
Energy Rllll8nue ... 0.085 0.030 0.065 82.88 1900 4940 32,800 -6.225.404 Capital Costs ........................................... 9.300.000 478,997 Regulaling Reservoir COat (biiSed on me in AF) = 110 AF 3.800,000 316.667
O&MCoats I I I 280.000
I I I I Hydrostation Annual Net • -5,149,740
Total Cona1nlction Cost wl 10% contingency 169,682.252 15'11. Design & Admin. I I 25,449,338 1,345,108 10% Added Contingency I I 16,987,073 8116.783 TOTAL PROJECT COST (with 111% dnlgn & admin., & 20% contingency) 212,071,1113 11,208,274
UNIT WATER COST, FULl. USE (SIAc.f't), (lor water cost • $0 at l.eke Powell) 187
YEARL. Y OPERATING COST, PEAK FLOW (Energy+ O&M) (17,745)
\ \ \
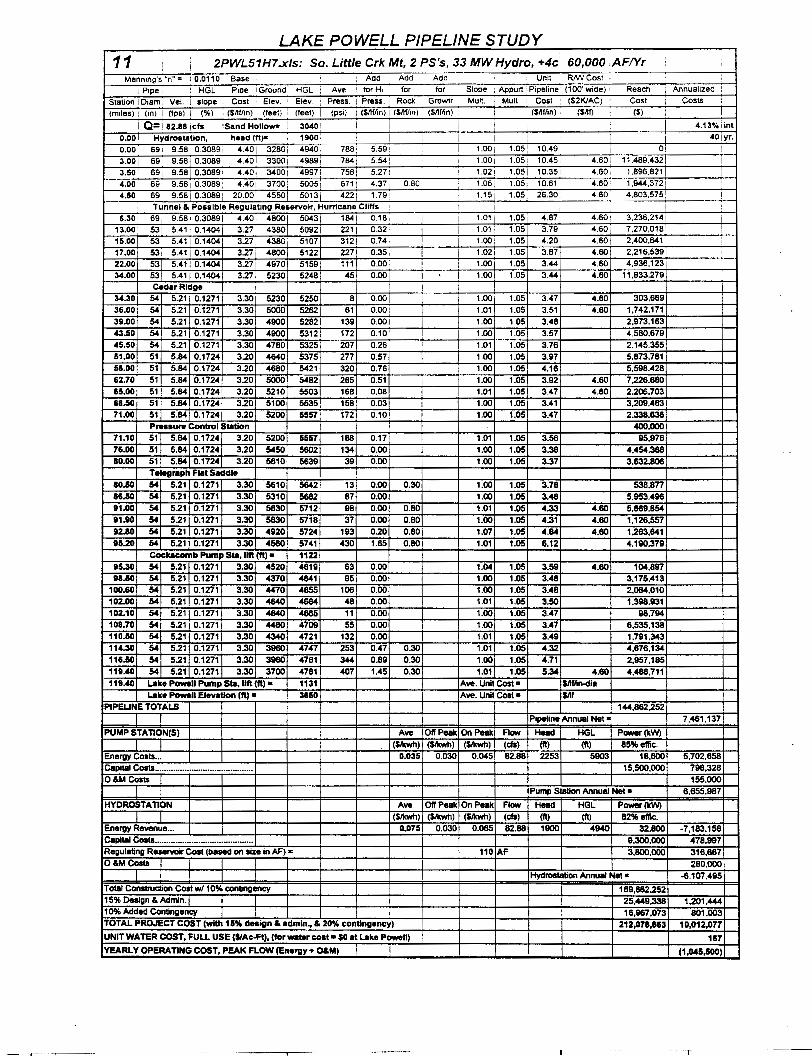
LAKE POWELL PIPELINE STUDY 11 2PWL51 H7.xls: So. Little Crk Mt, 2 PS's, 33 MW Hydro, +4c
1 60,000 .AF!Yr !
;
Manmng's "'n" = :0.0110 Base Add Add Add I Unit RmCost
Pope HGL Pope 1 Ground HGL Ave lor Hi for for Slope 1 Appurt ! Pipeline· (100' wide) ' Reach Annualized '
Stanon I Doam, Vel. I slope Cost Elev. Elev Press. ! Press. 1 Roc!< I Grdwtr I Mult. I Mult. I Cost ' ($2KIAC) Cost i Costs
(moles) r (on) I (Ips) 1 (%) i ($M~n) : (feet) I (feet) ! (psi) 1 ($ntfln) I ($ntfln) 1 (Sntfln) I (Sntfln) I csnn I ($) I I
I Q= i 82.88 ICfs !Sand Hollow= i 3040' I I I I I I 4.13'-' lint
0.001 Hydrostation, heed (ft)" I 1900· ; I I I ~ ! ! I 401yr.
0.001 691 9.58' 0.3089; 4.40! 3280 4940. 788 5.59: I 1.001 1.o5: 10.49. I 01
3.00j 691 9.581 0.3089 ·, 4.401 3300j 4989; 784! 5.541. I I 1.001 1.051, 10.45, 4.601, 1 1 .489.432 ' I
3.50' 691 9.581 0.30891 4.401 3400t 49971 758t 5.271 ! 1.021 1.051 10.35: 4.60; 1,896,821! I
4.001 691 9.58 I 0.3089 i 4.40! 37oo: 5005; 671' 4.371 0.80 '
1.061 1.05] 10.61' 4.601 1,944,3721 I
4.50! 69, 9.581 0.3089; 20.001 45501 5013! 422! 1.79! I I 1.15 1.05 26.301 4.60; 4,803,575, I
Tunnel & Possible Regulating Reservoir, Hurricane Cliffs I ' I I I I I !
6.30: 69, 9.581 0.30891 4.401 4800 5043! 1841 0.181 i I 1.01 1.05 4.871 4.601 3,236,2141 i 13.001 531 5.41 I 0.1404 3.27 4380 50921 2211 0.321 I 1.01; 1.05 3.791 4.60, 7,270,018 I
15.00 53 5.41 0.14041 3.27! 43801 51071 3121 0.741 1.00: 1.05 4.20! 4.601 2,400,641
17.00 53 5.41 0.14041 3.271 48001 5122 227 0.35 1.021 1.05 3.87 4.60 2,216,539
22.00 53 5.41 0.14041 3.27 4970 5159 1111 0.00 1.00 1.05 3.44 4.60 4.936.123 34.00 53 5.41 0.14041 3.27 5230 5248 45 0.00 1.00 1.05 3.44 4.60 11,833,279
Cedar Ridge I I 34.30 54 5.21 0.1271 3.30 5230 5250 8 O.OOj 1.00 1.05 3.47 4.60 303,669
36.00' 54 5.21 0.1271 3.30 5000 5262 61 0.001 1.01 1.05 3.51 4.60 1,742,171 39.00 54 5.21 0.1271 3.30 4900 52821 139 0.00 1.00 1.05 3.48 2,973,163 43.50 54 5.21 0.1271 3.30 4900 53121 172 0.10 I 1.00 1.05 3.57 4.580,679 45.50 54 5.21 0.1271 3.30 4780 5325 207 0.26 1.01 1.05 3.76 2.145,355 51.00 51 5.64 0.1724 3.20 4640 5375 277 0.57 1.00 1.05 3.97 5,873,781 56.00 51 5.64 0.1724 3.20 4680 5421 320 0.76 1.00 1.05 4.16 5,598,428 62.70 51 5.64 0.1724 3.20 5000 5482 265 0.51 I 1.00 1.05 3.92 4.60 7.226.680 65.00 51 5.64 0.1724 3.20 5210 5503 168 0.08 1.01 1.05 3.47 4.60 2.206.703 68.50 51 5.64 0.1724 3.20 5100 5535 158 0.03 1.00 1.05 3.41 3.209,463 71.00 51 5.64 0.1724 3.20 5200 15557 172 0.10 1.00 1.05 3.47 2.338,636
Pressu"' Control Station 400,000 71.10 51 5.64 0.17241 3.20 5200 6557 188 0.17 1.01 1.05 3.56 95,976 76.00 51 5.64 0.17241 3.20 5450 5802 134 0.00 1.00 1.05 3.38 4.454,368 10.00 51 5.64 0.17241 3.20 5810 5639 39 0.00 1.00 1.05 3.37 3,632,806
Telegraph Flat Saddle 10.50 54 5.21 0.1271 3.30 5610 5642 13 0.00 0.30 1.00 1.05 3.78 538,877 16.50 54 5.21 0.1271 3.30 5310 5682 87 0.00 1.00 1.05 3.48 5,953,496 91.00 54 5.21 0.1271 3.30 5630 5712 98 0.00 0.80 1.01 1.05 4.33 4.60 5,869,854 tUO 54 5.21 0.1271 3.30 5830 5718 37 0.00 0.80 1.00 1.05 4.31 4.80 1,126,557 $2.10 54 5.21 0.1271 3.30 4920 5724 193 0.20 0.80 1.07 1.05 4.64 4.80 1.263,641 $5.20 54 5.21 0.1271 3.30 4580 5741 430 1.65 0.80 1.01 1.05 6.12 4,190,379
Cocucomb Pump Sta, lift (ft) • 1122 t5.30 54 5.21 0.1271 3.30 4520 4819 63 0.00 1.04 1.05 3.59 4.60 104,897 ta.50 54 5.21 0.1271 3.30 4370 4641 95 0.00 1.00 1.05 3.48 3,175,413
100.60 54 5.21 0.1271 3.30 4470 4855 106 0.00 1.00 1.05 3.48 2,064,010 102.00 54 5.21 0.1271 3.30 4640 4684 48 0.00 1.01 1.05 3.50 1,398,931 102.10 54 5.21 0.1271 3.30 4640 4665 11 0.00 1.00 1.05 3.47 96,794 108.70 54 5.21 0.1271 3.30 4480 4709 55 0.00 1.00 1.05 3.47 6,535,138 110.50 54 5.21 0.1271 3.30 4340 4721 132 0.00 1.01 1.05 3.49 1,791,343 114.30 54 5.21 0.1271 3.30 3960 4747 253 0.47 0.30 1.01 1.05 4.32 4.676,134 116.50 54 5.21 0.1271 3.30 3960 4761 344 0.89 0.30 1.00 1.05 4.71 2,957,185 111AO 54 5.21 0.1271 3.30 3700 4781 407 1.45 0.30 1.01 1.05 5.34 4.60 4,468,711 119AO Lake Powell Pump Sta, lift (ft) • 1131 Ave. Unll Cost • Sllflin-dia
Lake Powell Elevation (ft) • 36150 Ave. Unll Cost • sm PIPEUNE TOTALS 144,862.252
Pipeline Annual Net • 7,461,137
PUMP STATION(S) Ave 011 Peak On Peak Flow Head HGL Power(kW) (Sikwh) (Sikwh) (Sikwh) (cfa) (ft) (ft) 85%ellic.
Energy CosiS ... 0.035 0.030 0.045 82.68 2253 5903 18,600 5,702.658 Capital CosiS ........................................... 15,500,000 798,328 0 &M Costs 155,000
Pump Station Annual Net • 6,655,987
HYDROSTATION Ave Oil Peak On Peak Fl- Head HGL Power(kW)
I (Sikwh) (Sikwh) (Sikwh) (cfa) (ft) (It) 82% ellic. Energy Revenue ... 0.075 0.030 0.065 82.68 1900 4940 32,800 -7,183,158 Capital Costa ........................................... 9,300,000 478,997 Regulating Reservoir Cost (baaed on Size in AF) " 110 AF 3,800,000 316,667 O&MCoats 280,000
Hydrostatlon Annual Net • -6,107,495
Total Construction Cost w1 10% conbngency 189,682,252 15% Oeaign & Admin. I I 25,449,338 1.201.444 10% Added Contingency I 16,967,073 801.003 TOTAL PROJECT COST (with 115% design & admln., & 20% contingency) 212,071,163 10,012,077
UNIT WATER COST, FULL USE ($1Ac-Ft), (for -• cost • $0 at Lake Powell) 167 YEARLY OPERATING COST, PEAK FLOW (Energy+ O&M) I I (1,045,1500)
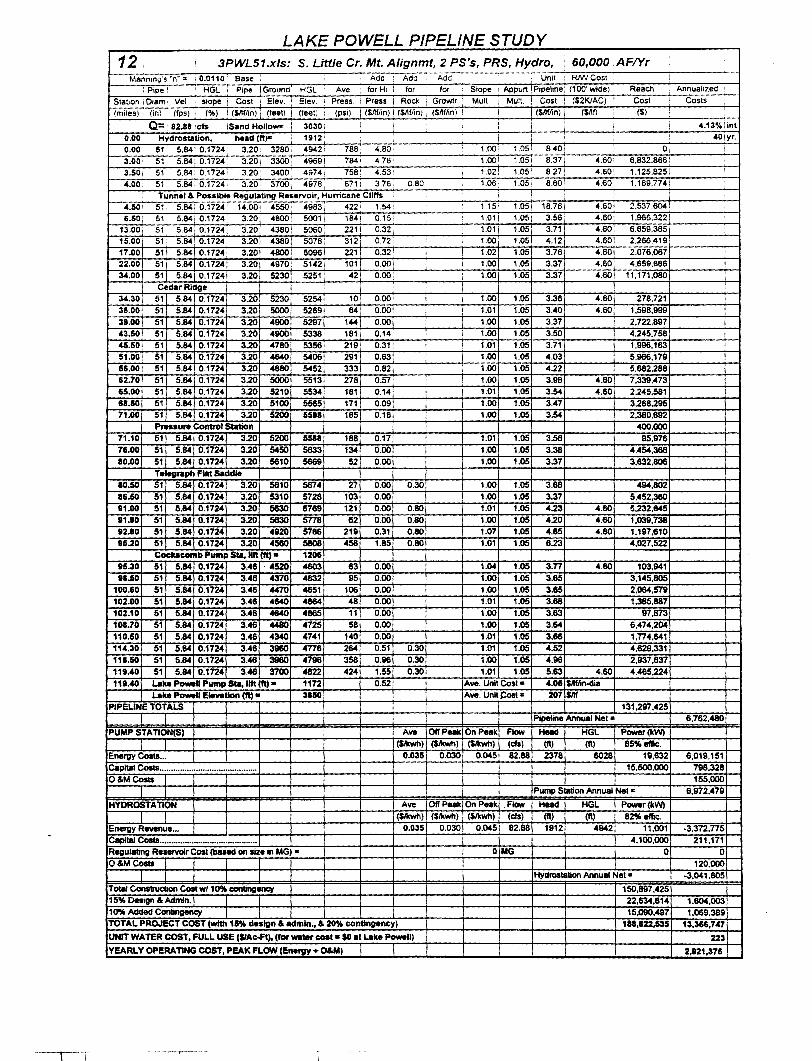
LAKE POWELL PIPELINE STUDY 12 ' 3PWL51.xls: S. Little Cr. Mt. Alignmt, 2 PS's, PRS, Hydro, I 60,000 .AF!Yr
Manmng·~ ~n-- = '0.0110 Base Add Ada Add Unit RMICost i : P1pe• HGL P1pe I Ground HGL Ave forHr I for for Slope , Appun IP1pehne: (100' wide) Reael\ Annualized '
Stab on ; D•am · Vel SlOpe i Cost Elev. ' Elev. ! Press i Press. i Roc!< i Grdwtr Mult. Mull. I Cost I ($2KIAC) I Cost Costs I
(miles) (in) (fps) ! (%) 1 tsnffln) i (feet) i (feet) (psi) _l (Smfm) I (SIIffln) 1 (Smr1n) ! I 1 csnffln)' ($/tf) l ($)
'Q= 82.88 :cfs \Sand Hollowz i 3030: I I I i I 4.13% lint I
0.00: Hydrostation, haad (ft)& 1912 I j _L j 40iyr.
0.00· 51 5.84! 0.1724: 3.20j 3280 4942< 788, 4.80 1.00 1.051 8.40! ! o, I 3.00· 51 5.84! 0.1724' 3.201 3300, 49691 784 1 4.761 1.001 1.051 8.371 4.601 6.832,8661 I
3.50! 51 5.841 0.1724! 3.20: 3400 4974, 7581 4.531 : 1.02! 1.05 8.27 4.601 1.125,8251 I
4.00: 51 5.84! 0.1724 3.20 3700, 4978, 671 i 3.761 0.80 1.06 1.05' 8.60 4.60j 1,169.7741 ! ' Tunnel & Possible Regulating Reservoir, Hurricane Cliffs I I I '
•• SOl 51; 5.84: 0.1724' 14.00 4550 .ol983· 422' 1.541 1.15 1.051 18.76 4.601 2.537.604
6.50i 51 5.841 0.1724! 3.201 4800! 5001) 184! 0.15. ! 1.011 1.051 3.56 4.601 1,966,322 1 ' '
13.00 51 5.84' 0.1724: 3.20! 4380 1 5060: 221 0.32! 1.01 i 1.051 3.71 4.60! 6.659.385 ! 15.00 51! 5.84 0.1724. 3.201 4380 5078! 312 0.72' 1.00' 1.05 4.12 4.60j 2.266.419; 17.00 511 5.84 0.1724 3.20 4800 5096 221 0.321 I 1.02 1.05 3.76 4.60 2.076,067 22.00 51 i 5.84 0.1724 3.20 4970 5142 101 O.OOj I I 1.00 1.05 3.37 4.60 4.559.886 34.00 511 5.84 0.1724 3.20 5230 5251 421 0.001 I 1.00 1.05 3.37 4.60 11.171.080
Cedar Ridge I 34.30 51 5.84 0.1724 3.20 5230 5254 10 0.00 I 1.00 1.05 3.36 4.60 278,721 36.00 51 5.84 0.1724 3.20 5000 5269 64 0.00 ! 1.01 1.05 3.40 4.60 1.598,999 39.00 51 5.64 0.1724 3.20 4900 5297 144 0.00 I 1.00 1.05 3.37 2.722.897 <&3.50 51 5.64 0.1724 3.20 4900 5338 181 0.14 I 1.00 1.05 3.50 4.245.758 45.50 51 5.64 0.1724 3.20 4780 5356 219 0.31 ' 1.01 1.05 3.71 1.996.163 51.00 51 5.84 0.1724 3.20 4640 5406 291 0.63 I 1.00 1.05 4.03 5.966.179 I
56.00 51 5.64 0.1724 3.20 4680 5452 333 0.82 1.00 1.05 4.22 5,682.288 62.70 51 5.84 0.1724 3.20 5000 5513 278 0.57 ! 1.00 1.05 3.98 4.60 7,339,473 65.00 51 5.84 0.1724 3.20 5210 5534 181 0.1 ... i 1.01 1.05 3.54 4.60 2.245.581 68.50 51 5.64 0.1724 3.20 5100 5565 171 0.09 i 1.00 1.05 3.47 3.268.295 71.00 51 5.64 0.1724 3.20 5200 5518 185 0.16 1.00 1.05 3.54 2,380,892
Prn•ure Control StatiOn 400.000 71.10 51 5.84 0.17241 3.20 5200 55a8 188 0.17 1.01 1.05 3.56 95.976 71.00 51 5.64 0.17241 3.20 5450 5633 134 0.00 1.00 1.05 3.38 4,454,388 80.00 51 5.84J 0.1724 3.20 5610 5669 52 0.00 1.00 1.05 3.37 3.832.806
Telegraph Flat Saddla 10.50 51 5.84 0.1724 3.20 5610 5674 27 0.00 0.30 1.00 1.05 3.88 494.802 86.50 51 5.84 0.1724 3.20 5310 5728 103 0.00 1.00 1.05 3.37 5,452.380 91.00 51 5.84 0.1724 3.20 5630 5769 121 0.00 0.80 1.01 1.05 4.23 4.80 5.232.645 91.10 51 5.84 0.1724 3.20 5630 5778 152 0.00 0.80 1.00 1.05 4.20 4.60 1,039.738 92.10 51 5.84 0.1724 3.20 41120 5786 2111 0.31 0.80 1.07 1.05 4.85 4.60 1,197,1510 95.20 51 5.84 0.1724 3.20 4560 5808 458 1.85 0.80 1.01 1.05 8.23 4.027.522
Cocucomb Pump Sta,llft (ft) • 1206 95.30 51 5.84 0.1724 3.48 . 4520 4803 83 0.00 1.04 1.05 3.77 4.110 103,941 98.50 51 5.84 0.1724 3.48 4370 4632 95 0.00 1.00 1.05 3.85 3,145.805
100.110 51 5.84 0.1724 3.46 4470 4651 106 0.00 1.00 1.05 3.85 2.084.579 102.00 51 5.84 0.1724 3.46 4640 4664 48 0.00 1.01 1.05 3.88 1,385,887 102.10 51 5.84 0.1724 3.46 4640 4665 11 0.00 1.00 1.05 3.83 97,873 108.70 51 5.84 0.1724 3.46 4480 4725 58 0.00 1.00 1.05 3.64 6,474,204 110.50 51 5.84 0.1724 3.46 4340 4741 140 0.00 1.01 1.05 3.86 1.774.641 114.30 51 5.84 0.1724 3.46 31160 4776 264 0.51 0.30 1.01 1.05 4.52 4.629,331 116.50 51 5.84 0.1724 3.46 3880 4796 358 0.96 0.30 1.00 1.05 4.96 2,937,637 119.40 51 5.84 0.1724 3.46 3700 4622 424 1.55 0.30 1.01 1.05 5.83 4.60 4.485.224 1111.40 Lake Powell Pump Sta, 1m (ft) • 1172 0.52 Ave. UnH Cost• 4.05 SMJin..dia
l.llka ,._., Elevation (ft) • SISO Ave. Unit Cost= 207 $Ill
PIPEUNE TOTALS 131.297,425
I I Pipeline AnnUli! Net • 6,762.460
PUMP STATION($) Ave Oft' Palik OnPe•k Flow HIIIICI HGL Power(kW)
I I (SA<wh) (SA<wh) (SA<wh) (cis) (It) (It) 85% eftic:. Energy Costs ... 0.035 0.030 0.045 82.88 2378 6028 19,632 6,019,151 C.pltal Costs ........................................... 15,500.000 798,326 O&MCosts I 155.000
I I Pump Station Annual Net ,. 6.972,4711
HYDROSTATION Ave Oft' Peak On Peak Flow Heacl HGL Power(kW)
I I (SA<wh) ($/kwh) (SA<wh) (cis) (ft) (ft) 82% ellic. Energy Ravenue ... 0.035 0.030 0.045 82.88 1912 4942 11,001 ·3,372.775 Capital Costs ........................................... 4,100.000 211.171 Ragulating Reservoir Cost (balad on size in MG) • 0 MG 0 0 O&MCosts I I I 120.000
I I J l Hydrostation Annual Net • ·3.041,805
Total Cons1Judion Cost w/10% contingltllq' 150,897,425 15% Design & Admin. I I 22,634,614 1.804,003 10% Added Contingency I I 15,1l90,497 1,069,389 TOTAL PROJECT COST (with 15% design & admln., & 20% contlngancy) 118,122,535 13.366,747
UNIT WATER COST, FULL USE ($/Ac-Ft), (for W8ter co.t"' $0 It Lake Powell) 223
YEARI. Y OPERATING COST, PEAK FLOW (Enervv + O&M) I I 2,121,375
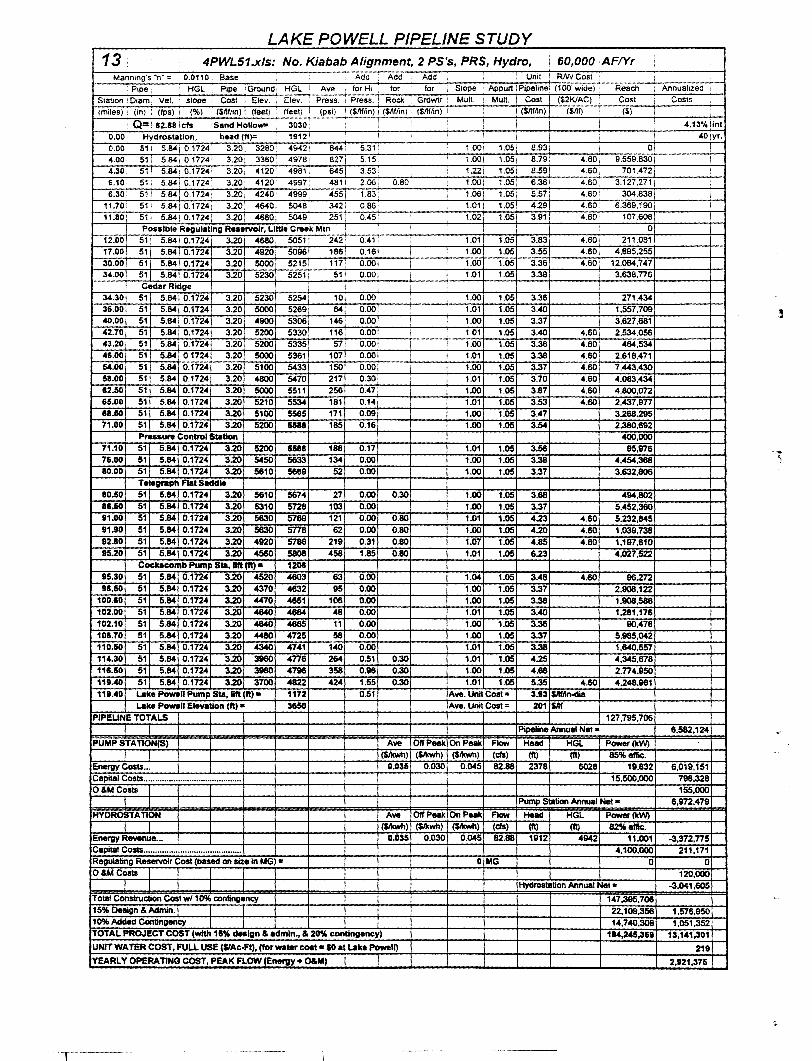
LAKE POWELL PIPELINE STUDY 13 4PWL51.xls: No. Kiabab Alignment, 2 PS's, PRS, Hydro, ' 60,000 AF!Yr
Manning's "'n" : 0.0110 Base Add Add Add I Unit RMICost ,
: P1pe HGl Pipe !Ground HGL Ave forH1 for for Slope ' AppurtiPipeline: (100' wide) ·, Reach Annualized
Stabon ! 01am, Vel. : stooe 1 Cost Elev. , Elev. Press. : Press. i Rock I Grclwtr : Mull. 1 Mull. ! Cost I ($2K/AC) Cost Costs
(miles)' (in) , (fps) 1 (%) i ($Affln) 1 (feet) : (feet) • (psi) I ($Affm) I ($nffon) I ($n!fm) I I ! ($Miin) ($nf) ($) i
! Q=• 62.88 leis !Sand HolloW'" 3030 I I I I I I 4.13'/oiint
0.00 Hydrostation, head (ft): 19121 i I ' I i ! ' I 4Dryr.
0.00 511 5.84j 0.1724' 3.20: 3280• 4942• 844 5.31' 1.001 1.05i 8.93, I 01 I 4.00' 51 i 5.84, 0.17241 3.20· 3360 4978. 8271 5.15 I 1.001 1.051 8.79' 4.601 9.559.8301 I 4.30: 511 5.841 0.1724' 3.20; 4120 4981 i 845, 3.53 I 1.221 1.051 8.591 4.601 701,4721 I
6.10: 51 I 5.84 i 0.1724: 3.20! 4120( 4997: 481 I 2.061 0.80, 1.001 1.os: 6.36• 4.60 3,127.2711
6.30 51 I 5.84 1 0.1724· 3.20, 4240: 4999 455! 1.83i i 1.06! 1.05: 5.571 4.60 304,838! i
11.70' 511 5.84: 0.1724! 3.20. 48401 5048 342: 0.86: 1.01) 1.05. 4.29 4.60 6,369,1901 !
11.801 511 5.841 0.17241 3.20 4660j 5049; 251 i 0.45 1.02, 1.051 3.911 4.60 107,608 i
I Possible Ragulating Reservoir, Llltl• Creak Mtn : I ! I 0
12.00 511 5.841 0.1724 3.20' 46801 5051 I 242t 0.41 1.01 1.051 3.83 4.60 211.081
17.001 51 5.84! 0.1724 3.20 4920 5096 1881 0.16 I 1.00 1.05 3.55 4.60 4,895,255 I
30.00 511 5.841 0.1724 3.20 5000 5215 1171 0,00 I 1.00 1.05 3.36 4.60 12.084.747 34.00 511 5.84 0.1724 3.20 5230 52511 51 0.00 I 1.01 1.05 3.38 3.638,776
Cedar Ridge ! ' 34.30 51 5.84 0.1724 3.20 5230 5254 10 0.00 I 1.00 1.05 3.36 271,434 36.00 51 5.84 0.1724 3.20 5000 5269 84 0.00 I 1.01 1.05 3.40 1,557,709 40.00 51 5.84 0.1724 3.20 4900 5306 146 0.00 ! 1.00 1.05 3.37 3.627,681 42.70 51 5.84 0.1724 3.20 5200 5330 116 0.00 1.01 1.05 3.40 4.60 2.534.056 43.20 51 5.84 0.1724 3.20 5200 5335 57 0.00 I 1.00 1.05 3.38 4.60 464,534 46.00 51 5.841 0.1724 3.20 5000 5381 107 0.00 1.01 1.05 3.38 4.60 2.818,471 54.00 51 5.84 0.1124 3.20 5100 5433 150 0.00 1.00 1.05 3.37 4.60 7,443,430 58.00 51 5.84 0.1724 3.20 4800 5470 217 0.30 1.01 1.05 3.70 4.60 4,083,434 62.50 51 5.84 0.1724 3.20 5000 5511 256 0.47 1.00 1.05 3.87 4.60 4,800,012 65.00 51 5.84 0.1124 3.20 5210 5534 181 0.14 1.01 1.05 3.53 4.60 2.437.977 68.50 51 5.84 0.1724 3.20 5100 5565 171 0.09 1.00 1.05 3.47 3.268,295 71.00 51 5.84 0.1724 3.20 5200 5588 185 0.16 1.00 1.05 3.54 2.380,692
Prusure Control Station 400,000 71.10 51 5.84\ 0.1724 3.20 5200 5588 186 0.17 1.01 1.05 3.56 95,976 76.00 51[ 5.84 j_ 0.1724 3.20 5450 5633 134 0.00 1.00 1.05 3.38 4,454,368 80.00 51 5.84\ 0.1724 3.20 5610 5669 52 0.00 1.00 1.05 3.37 3.632,806
Telegraph Flat S.ddla 10.50 51 5.84 0.1724 3.20 5610 5674 27 0.00 0.30 1.00 1.05 3.68 494,802 86.50 51 5.84 0.1724 3.20 5310 5728 103 0.00 1.00 1.05 3.37 5,452,360 91.00 51 5.84 0.1724 3.20 5630 5769 121 0.00 0.80 1.01 1.05 4.23 4.60 5,232,845 91.90 51 5.84 0.1724 3.20 5630 5778 62 0.00 0.80 1.00 1.05 4.20 4.80 1,039,738 92.80 51 5.84 0.1724 3.20 4920 5786 219 0.31 0.80 1.07 1.05 4.85 4.80 1.197,610 95.20 51 5.84 0.1724 3.20 4560 5808 458 1.85 0.80 1.01 1.05 6.23 4.027,522
Cocksc:omll Pump Sta,llft (ft) • 1206 115.30 51 5.84 0.1724 3.20 4520 4803 63 0.00 1.04 1.05 3.48 4.60 96.212 98.50 51 5.84 0.1724 3.20 4370 4832 95 0.00 1.00 1.05 3.37 2,908,122
100.80 51 5.84 0.1724 3.20 4470 4851 106 0.00 1.00 1.05 3.38 1,908,588 102.00 51 5.84 0.1724 3.20 4640 4664 48 0.00 1.01 1.05 3.40 1.281,176 102.10 51 5.84 0.1724 3.20 4640 4865 11 0.00 1.00 1.05 3.36 90,478 108.70 51 5.84 0.1724 3.20 4480 4725 58 0.00 1.00 1.05 3.37 5,985,042 110.50 51 5.84 0.1724 3.20 4340 4741 140 0.00 1.01 1.05 3.38 1.840,557 114.30 51 5.84 0.1724 3.20 3980 4776 264 0.51 0.30 1.01 1.05 4.25 4,345,678 116.50 51 5.84 0.1724 3.20 3980 "'796 358 0.96 0.30 1.00 1.05 4.86 2.774,950 119.40 51 5.84 0.1724 3.20 3700 4822 424 1.55 0.30 1.01 1.05 5.35 4.60 4.248.961 119.40 Lake P-11 Pump Sta, 11ft (ft) • 1172 0.51 Ave. Unit Cost ,. ::1.13 $/If/in-dia
Lake P-11 Elevation (ft) • 3650 Ave. Unil Cost" 201 $/If
PIPEUNE TOTALS 127,795,706
I Pipeline Annual Net • 6,582,124
PUMP STA TION(S) Ave OlrPeak OnPaak Flow Head HGL Power(kW) ($/kwh} (Sikwh) ($/kwh) (Cis) (ft) (ft) 85% eftic.
Energy Costs ... 0.035 0.030 0.045 82.68 2378 6028 19.632 6,019,151 Capital Costs ........................................... 15,500,000 798,328 O&MCosts 155,000
l Pump Station Annual Net • 6,972,479
HYOROSTA TION Ave OlrPeak On Peak Flow Head HGL Power(kW)
I I (Sikwh) ($/kwh) (Sikwh) (cfs) (ft) (II) 82% eftlc. Energy Rewnue ... 0.035 0.030 0.045 82.88 1912 4942 11,001 -3.372,775 Capital Costs ........................................... 4,100,000 211,171 Regulating ReseNOir Cost (based on size In MG) = 0 MG 0 0 O&MCoS1s I 120,000
I J J Hydrostation Annual Net .. -3.041,605
Total Construction Cost w/1 0% contingency 147,395.706 15% Design & Admin.f 22.109.356 1,576,950 10% Added Contingency J 14.740,308 1,051,352 TOTAL PROJECT COST (with 111% dnlgn & admln., & 20% contingency) 184,245,3&1 1::1,141,301
UNIT WATER COST, FULL USE ($1Ac-Ft), (for -tar cost • $0 at Lake Powell) 2111 YEARLY OPERATING COST, PEAK FLOW (Energy+ O&M) 2,121,376
T-
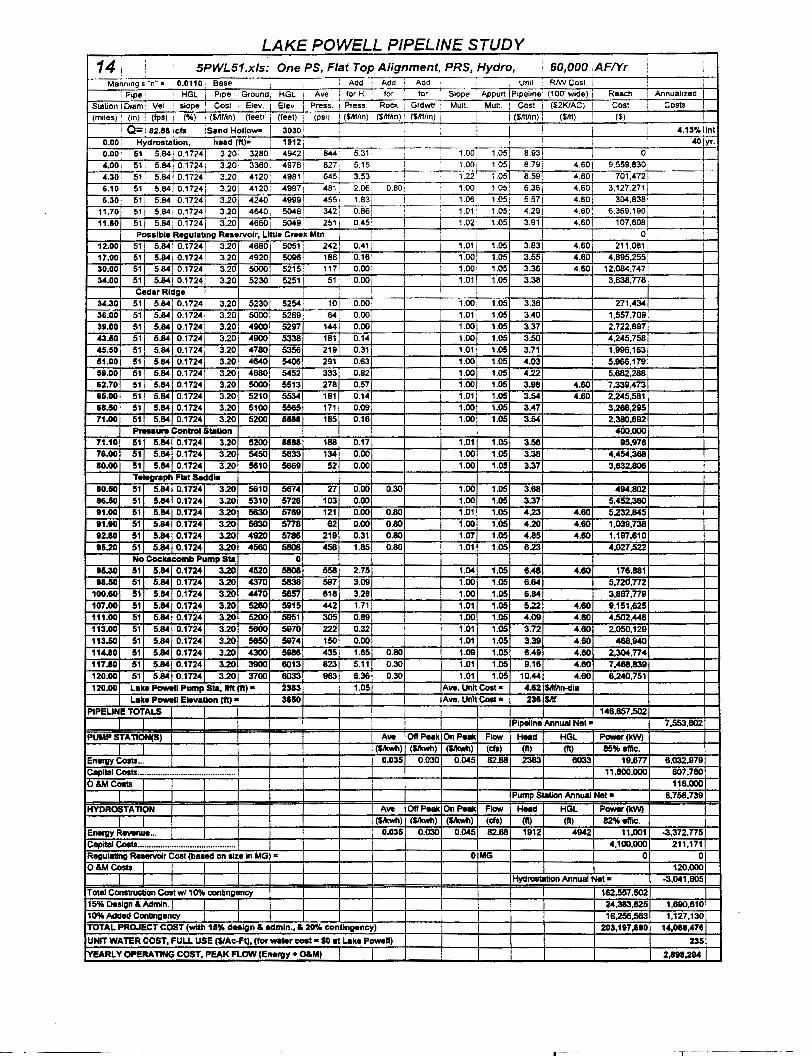
LAKE POWELL PIPELINE STUDY 14, 5PWL51.xls: One PS, Flat Top Alignment, PRS, Hydro, 60,000
1AF!Yr
I
Mannmg·s "n" = 0.0110 Base ; Add : Add I Add Unit RMICosl i I ; P1pe 1 HGL I P1pe 1Ground, HGL I Ave forHi! for for Slope , Appurt I P1pehne (100'wide) 1 Reach I Annualized~
Stabon i 01am· VeL slope • Cost I Elev. I Elev. i Press. ! Press. 1 Rock Grdwtr i MulL i MulL t Cost i ($2KIAC) I Cost Costs I I
(miles) ' (in) ; (fps) i (%) 1 (SIIffln) 1 (feet) I (feet) (psi) I ($/lffln) I ($/lffln) · (Sntfln) ; I (SIIffln) I (SIIf) I ($) I i
• Q= I 82.88 !Cfs !Sand HollOW" 3030: ! I : 4.13% lint
0.00[ Hydrostation, head (ft)" L 19121 ' ! £0iyr. O.OOi 51 5.84j 0.17241 3.201 3280' 4942 844 5.31• 1.001 1.05 8.931 I Oj
4.00j 51! 5.841 0.1724; 3.201 3360 49781 827 5.151 I 1.00! 1.05 8.79; 4.601 9,559,8301 ! 4.301 51' 5.84! 0.1724 3.20 4120: 4981! 645, 3.53! I 1.22 ~ 1.05 8.59• 4.601 701,472! I
6.101 511 5.84 0.17241 3.201 41201 49971 481 2.061 0.80: 1.00! 1.05 6.36i 4.6oL 3,127.271' ' 6.301 51! 5.84 I 0.17241 3.201 4240, 4999 4551 1.83; I 1.06 1.05 5.571 4.60i 304,838 ' 11.701 511 5.84! 0.1724! 3.201 46401 5048! 3421 0.86: 1.01' 1.05 4.291 4.60, 6,369,190 !
11.110 51 i 5.84 0.17241 3.201 4660 5049 2511 o.45i J l 1.021 1.05 3.91J 4.60 107,608 I
Possible Regulating Reservoir, Little C,..k Mtn ! I o, i
12.00 51 5.84 0.1724 3.20 4680 5051 242 0.41' J I 1.01 1.05 3.831 4.60 211,081 17.00 51 5.84 0.1724 3.20 4920 5096 186 0.16 1.00 1.05 3.55 4.60 4.895.255 30.00 51 5.84 0.1724 3.20 5000 5215 117 0.00 1.00 1.05 3.36 4.60 12,084,747 34.00 51 5.84 0.1724 3.20 5230 5251 51 0.00 ' 1.01 1.05 3.38 3,838,776
Cedar Ridge I I
34.30 51 5.84 0.1724 3.20 5230 5254 10 0.00 1.00 1.05 3.36 271,434 36.00 51 5.84 0.1724 3.20 5000 5269 64 0.00 1.01 1.05 3.40 1,557,709 311.00 51 5.84 0.1724 3.20 4900 5297 144 0.00 1.00 1.05 3.37 2,722.897 ~.60 51 5.84 0.1724 3.20 4900 5338 181 0.14 1.00 1.05 3.50 4,245,758 45.50 51 5.84 0.1724 3.20 4780 5356 219 0.31 1.01 1.05 3.71 1,996,163 61.00 51 5.84 0.1724 3.20 4640 5406 291 0.63 1.00 1.05 4.03 5,966,179 66.00 51 5.84 0.1724 3.20 4680 5452 333 0.82 1.00 1.05 4.22 5,682.288 112.70 51 5.84 0.1724 3.20 5000 5513 278 0.57 1.00 1.05 3.98 4.60 7,339,473 65.00 51 5.84 0.1724 3.20 5210 5534 181 0.14 1.01 1.05 3.54 4.60 2,245,581 118.50 51 5.84 0.1724 3.20 5100 5565 171 0.09 1.00 1.05 3.47 3,288,295 71.00 51 5.84 0.1724 3.20 5200 551111 185 0.18 1.00 1.05 3.54 2,380,692
P .... u .. Control Station 400,000 71.10 511 5.841 0.1724 3.20 5200 IIIII 188 0.17 1.01 1.05 3.56 95,978 76.00 511 5.841 0.17241 3.20 5450 5633 134 0.00 1.00 1.05 3.38 4,454,368 110.00 511 5.84J 0.17241 3.20 5610 5669 52 0.00 1.00 1.05 3.37 3,632,808
TelegNph Flat Saddle 110.10 51 5.84 0.1724 3.20 5610 5674 27 0.00 0.30 1.00 1.05 3.88 494,802 811.50 51 5.84 0.1724 3.20 5310 5728 103 0.00 1.00 1.05 3.37 5,452,360 11.00 51 5.84 0.1724 3.20 5830 5789 121 0.00 0.80 1.01 1.05 4.23 4.60 5,232,845 11.10 51 5.84 0.1724 3.20 5830 5778 82 0.00 0.80 1.00 1.05 4.20 4.60 1,039,738 12.10 51 5.84 0.1724 3.20 4920 5786 219 0.31 0.80 1.07 1.05 4.85 4.60 1,197,810 15.20 51 5.84 0.1724 3.20 4560 5808 456 1.85 0.80 1.01 1.05 6.23 4,027.522
No Cockscomb Pump Sta 0 15.30 51 5.84 0.1724 3.20 4520 5808 556 2.75 1.04 1.05 6.48 4.60 178,881 118.10 51 5.84 0.1724 3.20 4370 5638 597 3.09 1.00 1.05 6.84 5,720,772
100.10 51 5.84 0.1724 3.20 4470 5657 818 3.28 1.00 1.05 1.84 3,867,779 107.00 51 5.84 0.1724 3.20 5280 5915 442 1.71 1.01 1.05 5.22 4.80 9,151,825 111.00 51 5.84 0.1724 3.20 5200 5951 305 0.89 1.00 1.05 4.09 4.60 4,502,448 113.00 51 5.84 0.1724 3.20 5600 5970 222 0.32 1.01 1.05 3.72 4.80 2,050,129 113.50 51 5.84 0.1724 3.20 5650 5974 150 0.00 1.01 1.05 3.39 4.80 488,940 114.110 51 5.84 0.1724 3.20 4300 5988 435 1.65 0.80 1.09 1.05 6.49 4.80 2,304.774 117.110 51 5.84 0.1724 3.20 3900 8013 823 5.11 0.30 1.01 1.05 9.16 4.80 7,488,839 120.00 51 5.84 0.1724 3.20 3700 8033 983 6.36 0.30 1.01 1.05 10.44 4.80 8,240,751 120.00 L.llke "-II Pump Sta, lift (ft) • 2383 1.05 Ave. Unit Coal" 4.12 $11f/in-dia
L.llke Powell Elevation (ft) • 3110 Ave. Unlt Coat • 231 Sllf PIPEUNE TOTALS 148,857.502
I Pipeline Annual Net • 7,553,802
PUMP STA nON(S) Ave OIJPaak On Peak Flow Head HGl Power(kW)
I (Sikwh) (Sikwh) (Sikwh) (ds) {11) {ft) 85% ellic. Energy Coats ... 0.035 0.030 0.045 82.88 2383 6033 19,877 8,032,979 Capital Costs ........................................... 11,800,000 807,780
O&MCoats 118.000 Pump Station Annual Nat • 6,756,739
HYDROSTAnON Ave Off Peak On Peak FilM Head HGl Power(kW)
(Sikwh) (Sikwh) (SAiwh) (cfs) (11) (II) 82%ellie. EnervY Revenue ... 0.035 0.030 0.045 82.88 1912 4942 11,001 -3,372,775 Capital Coats ........................................... 4,100,000 211,171 Regulating ReMNOir Cost (based on me in MG) • 0 MG 0 0 O&MCosts L l 120.000
J I l Hyd1'0818tion Annual Net• -3,041,805
Total Cons1ruc:tion Coat w/1 0% contingency 182,557.502 15% Design &Admin. I I 24,383,825 1,690,610 10% Added Contingency I 18,256,563 1,127,130 TOTAL PROJECT COST (with 15% deSign & admin., &. 20% contingency) 203,117,110 14,0118,471
UNIT WATER COST, FULL USE ($/Ae.ft),(for water eo.t • $0 .t L.llke Powell) 236
YEARLY OPERA nNG COST, PEAK FLOW (Energy+ O&M) I I 2,111,204
T ---
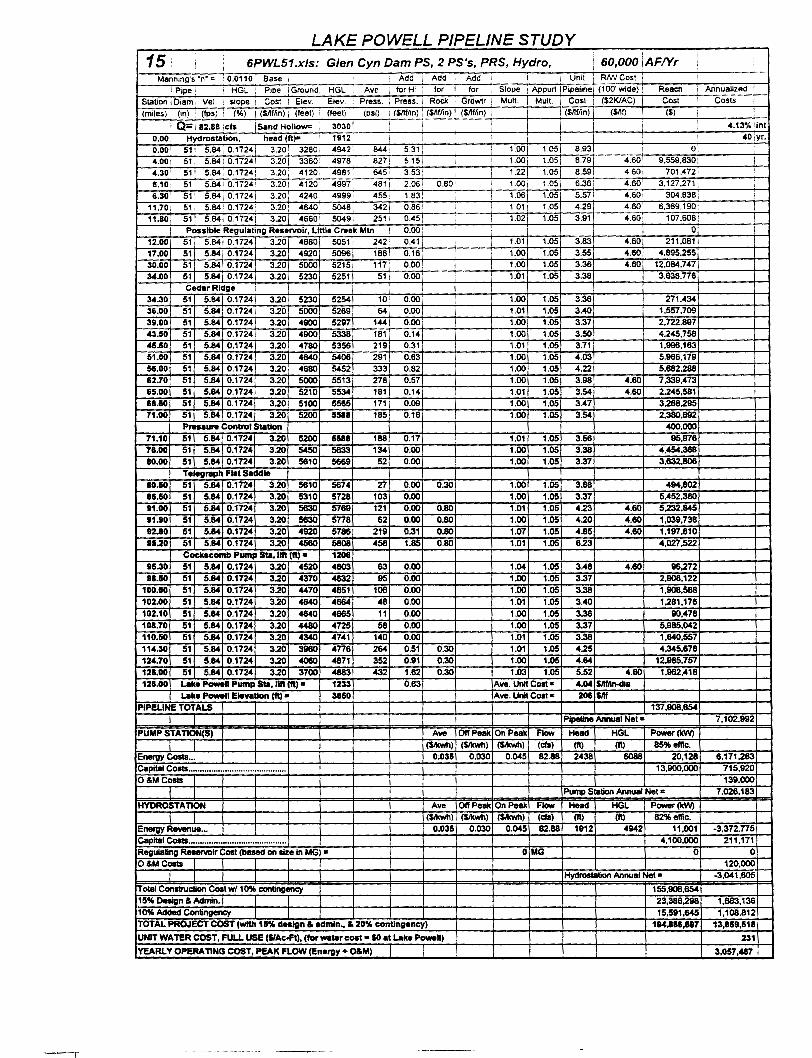
LAKE POWELL PIPELINE STUDY 15. i
I 6PWL51.xls: Glen Cyn Dam PS, 2 PS's, PRS, Hydro,
1 60,000 \AF!Yr i
Mann1ng's "n" = i 0.0110 Base Add Add Add I I I Unit i RM/Cost i I
i P1pe: I HGL ; P1pe i Ground; HGL Ave for Hi tor I for Slope : AppuJ1 I Pipehnel (1 oo· wide) ! Reach ! Annualized I
Station I D•am : Vel. slope i Cost Elev. 1 Elev. I Press. ' p,..,ss. I Rod< I Grnwtr i Mutt. I Mutt. I Cost i ($2KIAC) I Cost I Costs I
(miles) 1 (in) 1 (Ips) I (%) 1 (S,ffln) 1 (feet) i (feet) , (psi) r ($-'ffln) (Wfln) ! (S-'ffln) , (S-'ffln) ($-'f) ($) I i Q=! 82.88 ;cfs !Sand Hollow= i 3030: I I I
I
I : I 4.13"klint
0.00 Hydrostation, head(ft)= 1912. i I I I 40!yr.
0.001 511 5.84: 0.17241 3.20: 3280! 4942, 844, 5.31 j i 1.001 1.05 8.93 011
4.00; 51, 5.84) 0.17241 3.201 33601 49781 8271 5151 1.00j 1.051 8.791 4.60 9,559,8301 I 4.30' 511 5.84' 0.17241 3.20: 4120\ 4981: 645 3.53 1.221 1.05 8.59r 4.60 701,4721 6.10: 51: 5.841 0.1724. 3.201 4120: 4997: 48i i 2.06 0.80 i 1.00r 1.05i 6.36 4.60 3.127.271) I
6.301 51 i 5.84[ 0.17241 3.20, 4240 1 49991 455 1.83' 1.061 1.05 5.57 4.60 304,838) 11.70 51! 5.841 0.1724 1 3.20; 4640! 5048; 342, 0.86 1.011 1.05 4.29 4.60 6.369.1901 I 11.80 51 5.84L o.17241 3.20' 46601 50491 251' 0.451 1.02 1.05 3.91 4.60 107,608
Possible Regulating Reservoir, Little Creek Min I o.oo: ' 0 I
12.00 51 5.84 0.1724 3.20 4680 50511 242' 0.41 1.01 1.05 3.83 4.80 211.081 17.00 51 5.84 0.1724 3.20 4920 5096 186 0.16 1.00 1.05 3.55 4.60 4,895,255
30.00 51 5.64 0.1724 3.20 5000 5215 1171 0.00 1.00 1.05 3.36 4.60 12,084,747 u.oo 51 5.84 0.1724 3.20 5230 5251 51) 0.00 1.01 1.05 3.38 3,638,778
Cedar Ridge I S4.30 51 5.84 0.1724 3.20 5230 5254 10) 0.00 1.00 1.05 3.36 271,434 36.00 51 5.84 0.1724 3.20 5000 5269 64_i 0.00 1.01 1.05 3.40 1.557,709 311.00 51 5.84 0.1724 3.20 4900 5297 144 0.00 1.00 1.05 3.37 2,722,897 43.50 51 5.84 0.1724 3.20 4900 5338 181 I 0.14 1.00 1.05 3.50 4.245,758 <l!i.SO 51 5.84 0.1724 3.20 4780 5356 219 0.31 1.01 1.05 3.71 1,996,163 51.00 51 5.84 0.1724 3.20 4840 5406 291 0.63 1.00 1.05 4.03 5.966.179 56.00 51 5.84 0.1724 3.20 4680 5452 333 0.82 1.00 1.05 4.22 5,682.288 12.70 51 5.84 0.1724 3.20 5000 5513 278 0.57 1.00 1.05 3.98 4.60 7,339,473 65.00 51 5.84 0.1724 3.20 5210 5534 181 0.14 1.01 1.05 3.54 4.60 2.245,581 18.50 51 5.84 0.1724 3.20 5100 5585 171 0.09 1.00 1.05 3.47 3.288.295 71.00 51 5.84 0.1724 3.20 5200 5518 185 0.16 1.00 1.05 3.54 2.380.692
P,...u,. Control St.ltlon 400,000 71.10 51 5.84 0.17241 3.20 5200 5518 188 0.17 1.01 1.05 3.56 95,976 78.00 51 5.84 0.17241 3.20 5450 5633 134 0.00 1.00 1.05 3.38 4,<l54.388 80.00 51 5.84 0.17241 3.20 5610 5669 52 0.00 1.00 1.05 3.37 3.632.806
Telegraph F .. t Saddle 10.50 51 5.84 0.1724 3.20 5610 5674 27 0.00 0.30 1.00 1.05 3.88 494,802 88.50 51 5.84 0.1724 3.20 5310 5728 103 0.00 1.00 1.05 3.37 5,452,360 111.00 51 5.84 0.1724 3.20 5630 5769 121 0.00 0.80 1.01 1.05 4.23 4.60 5.232.845 11.90 51 5.84 0.1724 3.20 5630 5778 62 0.00 0.80 1.00 1.05 4.20 4.60 1,039,738 82.10 51 5.84 0.1724 3.20 4920 5788 219 0.31 0.80 1.07 1.05 4.85 4.80 1.197.610 115.20 51 5.84 0.1724 3.20 <l560 5808 458 1.85 0.80 1.01 1.05 6.23 4,027.522
Coc:bcomb Pump St.l, llfl(fl) • 1208 115.30 51 5.84 0.1724 3.20 4520 4603 63 0.00 1.04 1.05 3.48 4.60 96.272 88.110 51 5.84 0.1724 3.20 4370 4632 95 0.00 1.00 1.05 3.37 2,908,122
100.80 51 5.84 0.1724 3.20 4470 4851 106 0.00 1.00 1.05 3.38 1,908,588 102.00 51 5.84 0.1724 3.20 4840 4684 46 0.00 1.01 1.05 3.40 1.281,176 102.10 51 5.84 0.1724 3.20 4840 4665 11 0.00 1.00 1.05 3.36 90,478 108.70 51 5.84 0.1724 3.20 4480 4725 58 0.00 1.00 1.05 3.37 5,985,042 110.50 51 5.84 0.1724 3.20 4340 4741 140 0.00 1.01 1.05 3.38 1,640,557 114.30 51 5.84 0.1724 3.20 3960 4n6 264 0.51 0.30 1.01 1.05 4.25 4.345.678 124.70 51 5.84 0.1724 3.20 4060 4871 352 0.91 0.30 1.00 1.05 4.84 12.985,757 12&.00 51 5.84 0.1724 3.20 3700 4883 432 1.62 0.30 1.03 1.05 5.52 4.60 1.962,418 128.00 Lake "-U Pump St.l, lift (fl)• 1233 0.83 Ave. Unit Cost • 4.04 $11f!in.dia
Lake ,._., Ele¥11tlon (fl) • 3850 Ave. Unit Cost• l08 $llf
PIPEUNE TOTALS 137,908,854
I Pipeline Annual Net• 7,102.992
PUMP STA TION(SI Ave Oil Peak On Peak Flow Head HGL Power(kW)
I ($/kwh) ($/kwh) ($/kwh) (cis) (II) (II) 85% effie. Energy Costs ... 0;035 0.030 0.045 82.88 2438 6088 20,128 6.171,263 Capital Costs ........................................... 13,900,000 715.920 O&MCosts I 139.000
I I Pump Station Annual Net= 7.026.183
HYDROSTAnON Ave Oil Peak On Peak Flow Head HGL Power(kW)
I I ($/kwh) ($/kwh) ($/kwh) (cis) (11) (11) 82% effie. Energy Revenue ... 0.035 0.030 0.045 82.88 1912 4942 11,001 -3,372.n5 Capital Costs ........................................... 4,100.000 211,171 Regulating Rewrvotr Cost (beseel on size tn MG) a 0 MG 0 0 O&MCosts I I I 120,000
I I I Hydros1ation Annual Net • -3.041,805
Total Conllluction Cost w/1 0% c:onlingency 155,908.854 15% Design & Admin. I I I 23,386.298 1.883,136 10% Added Contingency I I 15,591,845 1,108.812 TOTAL PROJECT COST (With 11% design & aelmln~ & 20% contingency) 1114,116,&117 13,159,618
UNIT WA T£R COST, FULL USE ($/Ac.ft), (fOr Mt.lr co8t • $0 at Lake Powell) 231
YEARL. Y OPERA nNG COST, PEAK FLOW (Energy+ O&M) 3,0S7,U7
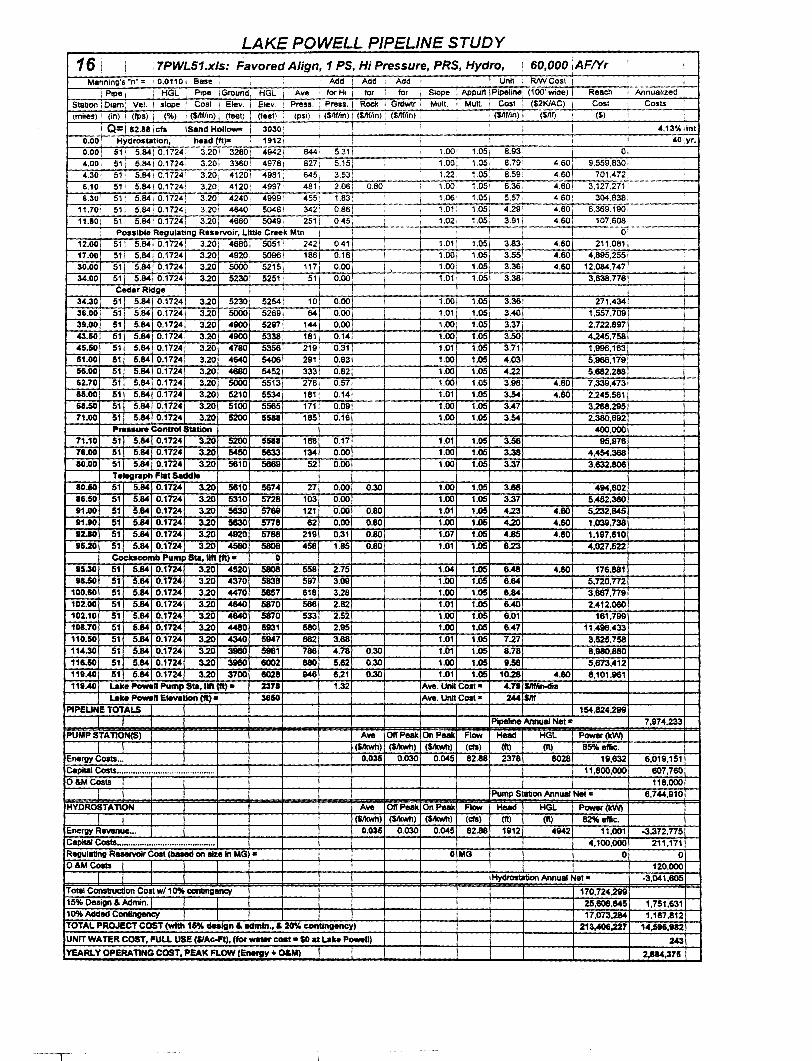
LAKE POWELL PIPELINE STUDY 16; i : 7PWL51.xls: Favored Align, 1 PS, Hi Pressure, PRS, Hydro, I 60,000 iAF!Yr I
Manning's ·n· : ' 0.0110 i Base ' : Add I Add I Add i I Unit I RNVCost I ! Pope ' HGL 1 P1pe !Ground. HGL I Ave 1 forHi I for for I Slope l APPUrt IPipeltM: (100'Wtde) i Reach t AnnuaJlzed 1
$1abon : D1am' Vel. I slope ! Cost 1 Elev. 1 Eiev. 1 Press. I Press. I Rod< ! Grdwlr 1 Mult. .I Mult. 1 Cost I ($2KIAC) Cost I Costs ! (miles) ' (in) ' (Ips) I (%) i ($/If/in) i (feet) 1 (feet) (psi) I ($/lffln) 1 ($/lffln) 1 ($/lffln) i ! ($/If/in) I ($/II) ' ($) i I
I Q=\82.18\Cfa !Sand Hollow- i 3030'· i I I i I i <1.13'1. lint O.DO Hydrostation, head (ftl" 19121 ' ' I I I 401Yr. 0.00 51• 5.841 0.1724! 3.201 32801 4942! 844' 5.31! ' I 1.001 1.05j 8.93' I Oi 4.00 51 i 5.841 0.1724! 3.20! 33801 49781 827: 5.15) I I 1.001 1.05. 8.79: 4.60' 9,559,8301 I
4.30 51: 5.84. 0.1724 1 3.20; 4120! 4981' 645, 3.53; 1.221 1.05' 8.59' 4.60 701.472) ! 6.10 511 5.841 0.1724: 3.20i 4120• 4997 481 I 2.061 080 : 1.00: 1.051 6.36 4.601 3,127.271 I I
6.30 51! 5.841 0.17241 3.20 42401 49991 455 1.83' I I 1.061 1.05! 5.57 4.60) 304,838: 11.70 511 5.84 1 o. 1724. 3.201 4640· 50461 342' 0.86! 1.01 1.05j 4.29 4.601 6,369,1901 I
11.80 51! 5.841 0.1724. 3.20; 4660. 5049. 2511 0.45 I I 1.021 1.05! 3.91! 4.60; 107.606 i Possible Regulating Reservoir, Little Creek Mtn I I I I '· I 0 I
12.00 51 I 5.841 0.17241 3.20 1 4680 50511 242, 0.41 1.01 1.05' 3.83i 4.60 211.081 I 17.00 511 5.841 0.1724 3.20 4920' 5096 1861 0.16 1.00 1.05 3.551 4.60 4,895,255 ' 30.00 51! 5.84 0.1724 3.20 5000• 5215 117' 0.00 1.00 1.05 3.36 4.60 12,084.747 3<1.00 51 1 5.841 o.1724 3.20 5230 5251 51 0.00 1.01 1.05 3.38 3,638,776
Cedar Ridge 34.30 51! 5.841 0.1724 3.20 5230 5254 10 0.00 1.00 1.05 3.36 271,434 36.00 51! 5.841 0.1724 3.20 5000 5269 64 0.00 1.01 1.05 3.40 1,557.709 39.00 51 5.84 0.1724 3.20 4900 5297 144 0.00 1.00 1.05 3.37 2,722.897 43.60 51 5.84 0.1724 3.20 4900 5338 181 0.14 1.00 1.05 3.50 4.245,758 <15.50 51 5.84 0.1724 3.20 4780 5356 219 0.31 1.01 1.05 3.71 1,996,163 51.00 51 5.84 0.1724 3.20 4640 5406 291 0.63 1.00 1.05 4.03 5,966,179 56.00 51 5.84 0.1724 3.20 4680 5452 333 0.82 1.00 1.05 4.22 5.682.288 62.70 51 5.84 0.1724 3.20 5000 5513 278 0.57 I 1.00 1.05 3.98 4.80 7,339.473 65.00 51 5.84 0.1724 3.20 5210 5534 1811 0.14 1.01 1.05 3.54 4.60 2.245,581 68.50 51 5.84 0.1724 3.20 5100 5565 171 0.09 1.00 1.05 3.47 3,268,295 71.00 51 5.84 0.1724 3.20 5200 5511 185 0.16 1.00 1.05 3.54 2.380.692
Prauure Control Station 400,000 71.10 51 5.84 0.17241 3.20 5200 5511 188 0.17 1.01 1.05 3.56 95.978 76.00 51 5.841 0.17241 3.20 5450 5633 134 0.00 1.00 1.05 3.38 4,454,368 110.00 511 5.84 0.17241 3.20 5610 5669 52 0.00 1.00 1.05 3.37 3,832,806
Telegraph Flllt Saddle 110.50 51 5.84 0.1724 3.20 5610 567<1 27 0.00 0.30 1.00 1.05 3.68 494,802 16.50 51 5.84 0.1724 3.20 5310 5728 103 0.00 1.00 1.05 3.37 5,452.360 11.00 51 5.84 0.1724 3.20 5630 5769 121 0.00 0.80 1.01 1.05 4.23 4.60 5.232.845 tUO 51 5.84 0.172<1 3.20 5630 5176 62 0.00 0.80 1.00 1.05 4.20 4.60 1,039,738 112.110 51 5.84 0.1724 3.20 4920 5786 219 0.31 0.80 1.07 1.05 4.85 4.60 1,197,610 115.20 51 5.84 0.1724 3.20 4560 5608 <158 1.85 0.60 1.01 1.05 8.23 4,027.522
Cockscomb Pump Sta, 11ft (fl) • 0 15.30 51 5.84 0.1724 3.20 4520 5608 558 2.75 1.04 1.D5 6.48 4.60 176.881 118.50 51 5.84 0.1724 3.20 4370 5838 597 3.09 1.00 1.05 6.84 5,720.772
100.60 51 5.84 0.1724 3.20 4470 5657 618 3.28 1.00 1.05 8.84 3,867,779 102.00 51 5.84 0.1724 3.20 4640 5870 566 2.82 1.01 1.05 6.<10 2.412.060 102.10 51 5.84 0.1724 3.20 4840 5870 533 2.52 1.00 1.05 6.01 161.799 1011.70 51 5.84 0.1724 3.20 4480 51131 580 2.95 1.00 1.05 6.47 11,498.433 110.50 51 5.84 0.1724 3.20 4340 5947 662 3.68 1.01 1.05 7.27 3,525,758 tt.C.30 51 5.84 0.1724 3.20 3960 5981 786 4.78 0.30 1.01 1.05 8.78 8,980.860 116.50 51 5.84 0.1724 3.20 3980 6002 680 5.82 0.30 1.00 1.05 9.58 5,673.412 119.<10 51 5.84 0.1724 3.20 3700 6028 946 6.21 0.30 1.01 1.05 10.28 4.60 8,101,961 118.<10 Lake '"-" Pump Sta, 11ft (ft) • 23711 1.32 Ave. Unit Coli • . ..,. WAn-Ilia
Lake Powell Erev.tiOn (ft) • 3650 Ave. Unit Cost • zu $M
PIPEUNE TOTALS 154,82<1.299
1 Pipeline Annual Net c 7,974,233
PUMPSTAnON(S) A~~e Oil' Peak On Peak Flow Head HGL Power(kW)
I ($A<wh) ($A<wh) ($A<wh} (cis) (ft) (ft) 85%~
Energy Coats ... 0.035 0.030 0.045 82.88 2378 6028 19,832 6.019.151 Capital Costs ........................................... 11,800,000 807,760 O&MCoats I 118,000
I Pump Station Annual Net " 6.744,910
HYOROSTAnON Aile Oil' Peak On Peak Flow Head HGL Power(kW)
I I ($A<wh) ($A<wh) ($A<wh) (cis) (ft) (II) 82% etllc. Energy Re-venue ... 0.035 0.030 0.045 82.88 1912 4942 11,001 -3.372.775 Capi1al Costs ........................................... 4.100,000 211.171 Regulating R...vcir Cost (based on llze in MG) • 0 MG 0 0 O&MCosts I I I I 120,000
I I I Hydrostation Annual Net • ·3,041,805
Total Construction Cost wl1 0% contingllf1CY 110.724.299 15% Design & Admin.j I I 25,608,845 1,751,631 10% Added Contingency I I 17,073,284 1.167.812 TOTAL PROJECT COST (with 111% dutgn & admln., & 20% contingency) 213,406,227 14,5116,1112 UNIT WATER COST, FULL USE ($1Ac.ft), (forWIIWr cost • $D at Lake Pow.ll) 243 YEARLY OPERAnNG COST, PEAK FLOW (Energy+ O&M) 2,184,375
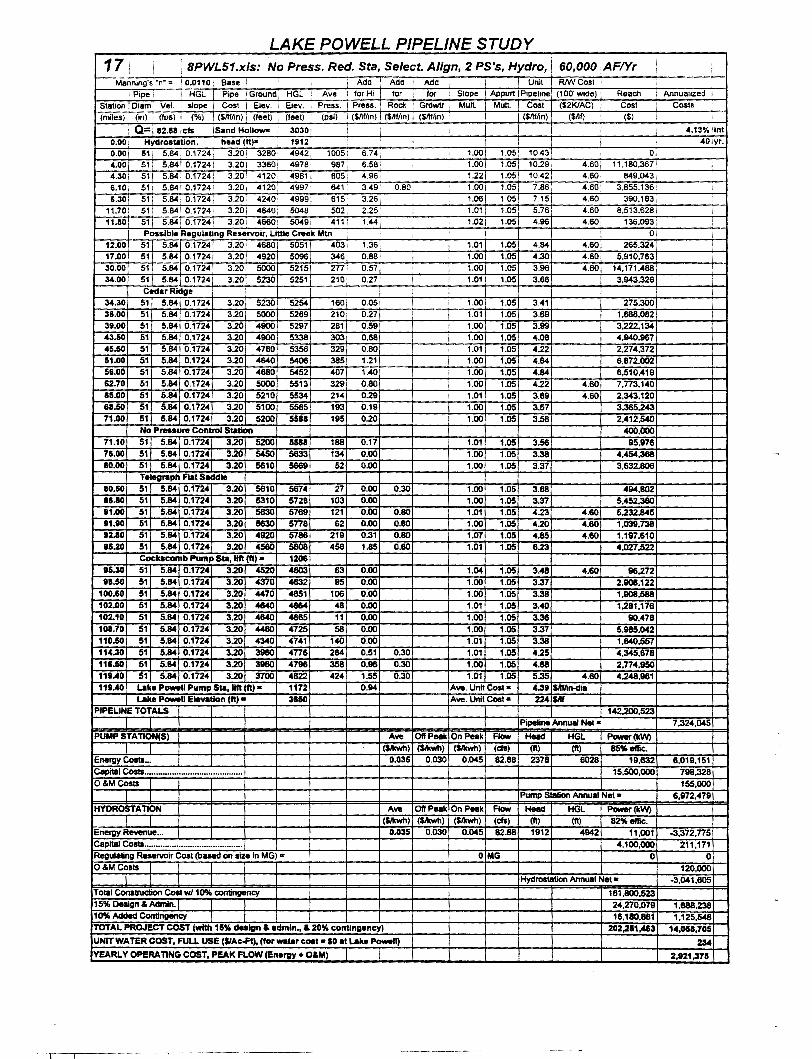
LAKE POWELL PIPELINE STUDY 171 I : BPWL51.xls: No Press. Red. Sta, Select. Align, 2 PS's, Hydro, I 60,000 [AF!Yr I i
Mannmg's "'n .. = i 0.0110: Base i I Add Ada Add ! I Unit ! RNV Cost I I Pipe I HGL I Pope I Ground I HGL I Ave '1 forHi_j for ! for : Slope i Appurt I Pipeline (1 00' wide) Reach i Annualized !
Stabon I Doam I Vel. stope 1 Cost I Elev. 1 Elev. 1 Press. I Press. Rock i Grdwtr 1 Mutt j Mutt. J Cost ($2KIAC) Cost l Costs I
(miles) I (in) : (Ips) : (%) I ($/lffln) i (feet) , (feet) i (pSi) : ($/lffln) 1 ($/lffln) (SIIffln) i i I (SIIflin) ($/If) ($) i i I Q= 82.881Cfs I Sand Hollo- I 30301 ! I I i i 4.13%/int
O.OOj Hydros!ation, head (ft)= 1912. I I I I ! 4DIY'· I
o.oo· 51; 5.84! 0.1724, 3.201 3280: 49421 1005: 6.74; 1.001 1.05' 10.43 I o; 4.001 51 i 5.841 0.1724/ 3.201 3360! 49781 9871 6.58 ; I 1.001 1.051 10.29, 4.60 11,180,367/ I
4.30! 511 5.841 0.1724; 3.20 1 4120 49811 805[ 4.961 1.221 1.05! 10.421 4.60 849.0431 6.101 511 5.8410.1724 1 3.201 4120, 4997: 641' 349! 0.80 i 1.001 1.051 7.86, 4.601 3,855,1361 : 6.30: 51! 5.84[ 0.1724; 3.20 4240 4999: 615· 3.261 1.061 1.051 7.151 4.60 390,1831 I
11.70; 511 5.841 0.1724 3.201 46401 5048. 502, 2.25, I ' 1.01' 1.05• 5.76: 4.601 8,513,6281 I 11.1101 51 i 5.841 0.1724 3.201 4660 50.(91 411 1.44 I 1.021 1.05; 4.96 4.601 136,093! I
Possible Regulating Reservoir, Little Cree~ Mtn I 'I I I I 01 I 12.00 51 5.84 0.1724 3.201 46801 5051 4031 1.36 I 1.011 1.051 4.84 4.60 265,324' 17.00 51 5.84 0.1724 3.20 4920 5096! 3461 0.88 i 1.001 1.05 4.30 4.60 5.910,763 30.00 51 5.84 0.1724 3.20i 5000 52151 277 0.57 I 1.00J 1.05 3.96 4.60 14.171.488 34.00 51 5.84 0.1724 3.20 5230 52511 210 0.27 I I 1.011 1.05 3.66 3,943,326
Cedar Ridge I i i 34.30 51 5.S4 0.1724 3.20 5230 52541 160 0.05 ! 1.00 1.05 3.41 275.300 36.00 51 5.84 0.1724 3.20 5000 5269J 210 0.27 I 1.01 1.05 3.69 1,688,082 39.00 51 5.S4 0.1724 3.20 4900 52971 281 0.59 1.00 1.05 3.99 3,222,134 43.50 51 5.S4 0.1724 3.20 4900 5338 1 303 0.68 I 1.00 1.05 4.08 4,940,967 45.50 51 5.84 0.1724 3.20 4780 5356 329 0.80 1.01 1.05 4.22 2,274,372 51.00 51 5.84 0.1724 3.20 4640 5406 385 1.21 1.00 1.05 4.84 8,872,002 56.00 51 5.84 0.1724 3.20 4880 5452 407 1.40 1.00 1.05 4.84 6,510,419 62.70 51 5.S4 0.1724 3.20 5000 5513 329 0.80 1.00 1.05 4.22 4.60 7,773,140 65.00 51 5.84 0.1724 3.20 5210 5534 214 0.29 1.01 1.05 3.69 4.60 2.343,120 611.50 51 5.S4 0.1724 3.20 5100 5565 193 0.19 1.00 1.05 3.57 3,365,243 71.00 51 5.84 0.1724 3.20 5200 5511 195 0.20 1.00 1.05 3.56 2.412.540
No Preuure Control Station 400,000 71.10 511 5.S4j 0.1724 3.20 5200 5518 188 0.17 1.01 1.05 3.56 95,976 715.00 511 5.841 0.1724 3.20 5450 5633 134 0.00 1.00 1.05 3.38 4,454,368 10.00 511 5.84j0.1724 3.20 5610 5669 52 0.00 1.00 1.05 3.37 3,632,806
Telagl'llph Flat S•ddla 10.50 51 5.S4 0.1724 3.20 5610 5874 27 0.00 0.30 1.00 1.05 3.88 494,802 16.50 51 5.84 0.1724 3.20 5310 5728 103 0.00 1.00 1.05 3.37 5,452,360 11.00 51 5.84 0.1724 3.20 5630 5769 121 0.00 0.80 1.01 1.05 4.23 4.80 5,232,845 11.10 51 5.84 0.1724 3.20 5630 5778 62 0.00 0.80 1.00 1.05 4.20 4.60 1,039,736 112.10 51 5.S4 0.1724 3.20 4920 5786 219 0.31 0.80 1.07 1.05 4.85 4.80 1,197,610 15.20 51 5.84 0.1724 3.20 4560 5806 -458 1.85 0.80 1.01 1.05 6.23 4,027,522
Cockscomb Pump Sta, lift (ft) • 1206 15.30 51 5.S4 0.172-4 3.20 4520 4603 63 0.00 1.04 1.05 3..48 4.60 96.272 11.50 51 5.84 0.1724 3.20 4370 4632 95 0.00 1.00 1.05 3.37 2,908,122
100.80 51 5.84 0.1724 3.20 4470 ..a51 106 0.00 1.00 1.05 3.38 1,908,588 102.00 51 5.84 0.1724 3.20 4840 4864 48 0.00 1.01 1.05 3.40 1.281,178 102.10 51 5.84 0.1724 3.20 4840 4885 11 0.00 1.00 1.05 3.36 90,478 101.70 51 5.84 0.1724 3.20 -4480 4725 58 0.00 1.00 1.05 3.37 5,985,042 110.50 51 5.S4 0.1724 3.20 4340 4741 140 0.00 1.01 1.05 3.38 1,640,557 114.30 51 5.84 0.1724 3.20 3960 4776 284 0.51 0.30 1.01 1.05 4.25 4,345,678 1111.50 51 5.84 0.1724 3.20 3960 4796 358 0.96 0.30 1.00 1.05 4.88 2,774,950 119.40 51 5.&4 0.1724 3.20 3700 4822 424 1.55 0.30 1.01 1.D5 5.35 4.60 4.248,961 119.40 Lake Powell Pump Sta, lift (ft) • 1172 0.94 Ave. Unit Cost • 4.39 $11flin-diJI
Lake Pow.ll Elevation (ft) • 3650 Alii!. Unit Cost • 224 $llf PIPEUNE TOTALS 142,200,523
Pipeline Annual Nat • 7,324,045
PUMP STA TION(S) Ave Off Peak On Peek Flow Head HGL P-(kW)
I ($/olwh) (Sikwh) (Sikwh) (Cis) (II) (II) 85% etlic. Energy Costs ... 0.035 0.030 0.045 82.88 2378 8028 19,632 8,019.151 Capital Costs ........................................... 15,500,000 798,328 O&MCosts 155,000
I Pump Station Annual Net• 6,972,479
HYDROSTA TION Ave Off Peek On Peak F'- Head HGL P-(kW) (Sikwh) (Sikwh) ($/kwh) (Cis) (II) (II) 82% etlic.
Energy R~ue ... 0.035 0.030 0.045 82.88 1912 4942 11.001 -3,372,775 Capllal Costs ........................................... 4,100,000 211,171 Regulating Reservoir Cost (based on size In MG) c 0 MG 0 0 O&M Coats I 120,000
I I I Hydrostation Annual Nat • -3,041,605
Total Conalllldion Coat w/1 0% contingency 161,800,523 15% Design & Admin.! I 24,270,079 1.688.238 10% Added Contingency I 16,180,881 1.125,548 TOTAL PROJECT COST (with 15% design & edmln., & 20% conting•ncy) 202,2111,483 14,00,705 UNIT WATER COST, FULL USE ($/Ac-Ft), (for water c011t • SO •t Lake Powell) 234 YEARLY OPERATING COST, PEAK FLOW (Energy + O&M) I I 2,121,375
l
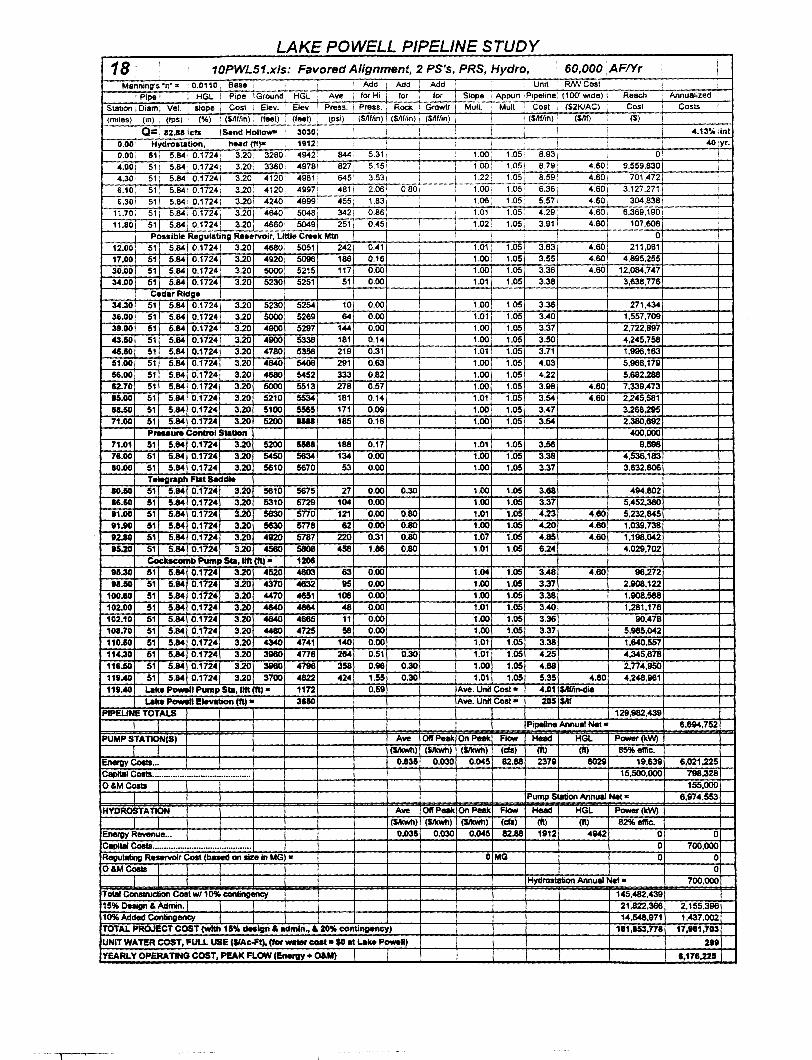
LAKE POWELL PIPELINE STUDY 18: ! I 10PWL51.xls: Favored Alignment, 2 PS's, PRS, Hydro, 60,000 AF!Yr i i
' Manning's "n" :- '0.0110 Base I ' I Add I Add : Add : Unit RM/Cost I
I Pipej ; HGL P1pe !Ground HGL : Ave I forHi for for I Sldpe Appurt !Pipeline: (100' Wide) I Reach Annualized I I
Stabon I Diam; Vel. 1 slope ' Cost I Elev. ' Elev. ' Press. Press. ROCI< I Grdwtr 1 Mull. Mull. Cost ! ($2KIAC) I Cost I Costs
(miles) ; (m) 1 (Ips) ' (%) ! (SM/m) j (!Mt) i (feet) I (psi) : ($/lffm) ($Mion) 1 ($n!ftn) 1 I {Snffln): ($/If) I ($) i ' Q= ! aua I c:ts !Sand Hollow- ! 3030; ! i ! I I .t.13%1int
0.00: Hydrostation, head (ft)a 1912: ! ' I I .tO I yr.
0.00! 511 5.841 0.17241 3.20: 3280 49421 8.(4! 5.31 I 1.00 1.05: 8.93: Q! I 4.001 511 5.84! 0.17241 3.201 3360i .. 9781 827i 5.151 I I 1.00 1.051 8.79' 4.60! 9,559,8301 ! 4.30; 511 5.841 0.17241 3.20. 4120! 4981: 645' 3.53: i 1.22 1.05: 8.591 4.60; 701,4721
6.10, 51, 5.841 0.17241 J.2o· 4120: 4997! 4811 2.06• 0.80: I 1.00 1.05' 6.361 4.60: 3.127.271 i i
6.301 511 5.841 0.1724: 3.20: 4240 4999• 4551 1.83: I 1.06 1.05: 5.57: 4.60: 304.8381 I
11.70: 511 5.84 I 0.1724, 3.201 4640 5048, 342! 0.86, 1.01 1.05: 4.29; 4.60, 6,369,1901 I
11.801 51 5.841 0.1724: 3.20i 46601 5049 2511 0.451 I 1.02 1.05 1 3.911 4.60 107.608
Possible Regulating Reservoir, L.lttle CrNk Mtn I I I 0
12.00 51 5.84 0.1724 3.20 4680. 5051 242 0.41 1.01 1.05 3.83 4.60 211,081
17.00 51 5.84 0.1724 3.20 4920 5096 186 0.16 1.00 1.05 3.55 4.60, 4.895,255
30.00 51 5.84 0.1724 3.20 5000! 5215 117 0.00 1.00 1.05· 3.36 4.60 12,084,747
34.00 51 5.84 0.1724 3.20 52301 5251 51 0.00 1-01 1.05 3.38 3,638,776 C.der Ridge
34.30 51 5.84 0.1724 3.20 5230 5254 10 0.00 1.00 1.05 3.36 271,434
36.00 51 5.84 0.1724 3.20 5000 5269 64 0.00 1.01 1.05 3.40 1,557,709
39.00 51 5.84 0.1724 3.20 4900 5297 144 0.00 1.00 1.05 3.37 2.722.897 43.60 51 5.84 0.1724 3.20 4900 5338 181 0.14 1.00 1.05 3.50 4,245,758
45.50 51 5.84 0.1724 3.20 4780 5356 219 0.31 1.01 1.05 3.71 1,996,163 51.00 51 5.84 0.1724 3.20 46.tO 5406 291 0.63 1.00 1.05 4.03 5.986,179 66.00 51 5.84 0.1724 3.20 4680 5452 333 0.82 1.00 1.05 4.22 5,682.288 62.70 51 5.84 0.1724 3.20 5000 5513 278 0.57 1.00 1.05 3.98 4.60 7,339,473 IS.OO 51 5.84 0.1724 3.20 5210 5534 181 0.14 1.01 1.05 3.54 4.60 2.245,581 11.50 51 5.84 0.1724 3.20 5100 5565 171 0.09 1.00 1.05 3.47 3.268,295 71.00 51 5.84 0.1724 3.20 5200 5111 185 0.18 1.00 1.05 3.54 2.380.692
PNUure Control Station 400,000 71.01 51! 5.84! 0.1724 3.20 5200 5516 168 0.17 1.01 1.05 3.56 9,598 76.00 51 5.841 0.17241 3.20 5450 5634 134 0.00 1.00 1.05 3.38 4,536,183 10.00 51! 5.84! 0.1724 3.20 5610 5670 53 0.00 1.00 1.05 3.37 3.632,806
Teiegnoph Flat Saddle 80.110 51 5.84 0.1724 3.20 5610 5675 27 0.00 0.30 1.00 1.05 3.68 494.802 16.50 51 5.84 0.1724 3.20 5310 5729 104 0.00 1.00 1.05 3.37 5,452,360 81.00 51 5.84 0.1724 3.20 5630 5no 121 0.00 0.80 1.01 1.05 4.23 4.60 5.232,845 IUIO 51 5.84 0.1724 3.20 5830 5778 62 0.00 0.80 1.00 1.05 4.20 4.60 1,039,738
12.60 51 5.84 0.1724 3.20 4920 5787 220 0.31 0.80 1.07 1.05 4.85 ... 60 1,198,042
15.20 51 5.84 0.1724 3.20 4580 5808 458 1.86 0.80 1.01 1.05 6.24 4.029.702 Coc:IIKomb Pump Sta,llft (ft) • 1206
15.30 51 5.84 0.1724 3.20 4520 4603 63 0.00 1.04 1.05 3.48 4.60 96.272 11.50 51 5.84 0.1724 3.20 4370 4632 95 0.00 1.00 1.05 3.37 2,908,122
100.10 51 5.84 0.1724 3.20 4470 4851 106 0.00 1.00 1.05 3.38 1,908.588 102.00 51 5.84 0.1724 3.20 46.tO 4884 48 0.00 1.01 1.05 3.40 1,281.176 102.10 51 5.84 0.1724 3.20 46.tO 4665 11 0.00 1.00 1.05 3.36 90.478 101.70 51 5.84 0.1724 3.20 4480 4725 58 0.00 1.00 1.05 3.37 5,985,042
110.50 51 5.84 0.1724 3.20 4340 4741 140 0.00 1.01 1.05 3.38 1,640,557
114.30 51 5.84 0.1724 3.20 3980 4776 264 0.51 0.30 1.01 1.05 4.25 4,345,678
1111.50 51 5.84 0.1724 3.20 3980 47116 358 0.116 0.30 1.00 1.05 4.68 2.n4.950 118.40 51 5.84 0.1724 3.20 3700 4822 424 1.55 0.30 1.01 1.05 5.35 4.60 4,248,1161 1111 • ..0 Lake P-n Pump Sta, lift (ft) • 1172 0.59 Ave. Un~ Cost • 4.01 Sllflin-dia
Lalta Powell Elevetion (ft) • 3150 Ave. Unit Cost • 205 Sllf PIPEUNE TOTALS 129,982 ... 39
I Pipeline Annual Net • 6,894,752
PUMPSTAnON(S) Ave Off Peek OnPuk Flow Head HGL PDW11r(kW)
I I ($111W11) ($1kwh) ($1kwh) (ds} (It) (11} 85'lltelfie. Energy Coats ... 0.03$ 0.030 0.045 82.68 2379 8029 19.639 6,021.225
Cepital Costs ........................................... 15,500,000 798,328
O&MCoats 155,000
I Pump Slation Annual Net • 6,974,553
HYDROSTA TION Ave OlfPUk On Peek Flow Heed HGL PDW1tr(kW)
I ($ikwll) ($ikwll) ($111W11) (ds) (11) (It) 82% ellle. Energy Revenue ... 0.035 0.030 0.045 82.88 1912 4942 0 0 Capllel Coats ........................................... 0 700,000 Regulating ReHIVOir Coat (baed on size in MG) • 0 MG 0 0 O&MCosts I I I 0
I I I Hydroa1ation Annual Net • 700.000
Total Conslruction Cost w/ 1 O'llt contingency 145,482,439 15% Design & Admin.\ I I 21.822.386 2.155.396 10'llt Added Contingency I I 14,548.971 1,437.002 TOTAL PROJECT COST (with 11% CIKign & •dmln~ & ZO% contingency) 111,e53,n1 17,181,703
UNIT WATER COST, FUL.L USE ($/Ac.,.t), (for Wlltllr cost • $0 et Lake Powell} 2H YEARL. Y OPERA nNG COST, PEAK FLOW (Energy • O&M) &,176.225
Appendix B - Hydrostation O&M Cost Curve
The following curve is for planning level estimates of annual O&M costs for hydrostations and is taken from the US COE Hydropower Engineering and Design Manual, 1985 edition.
1ke Powell Pipeline Study Final Report, March 1995
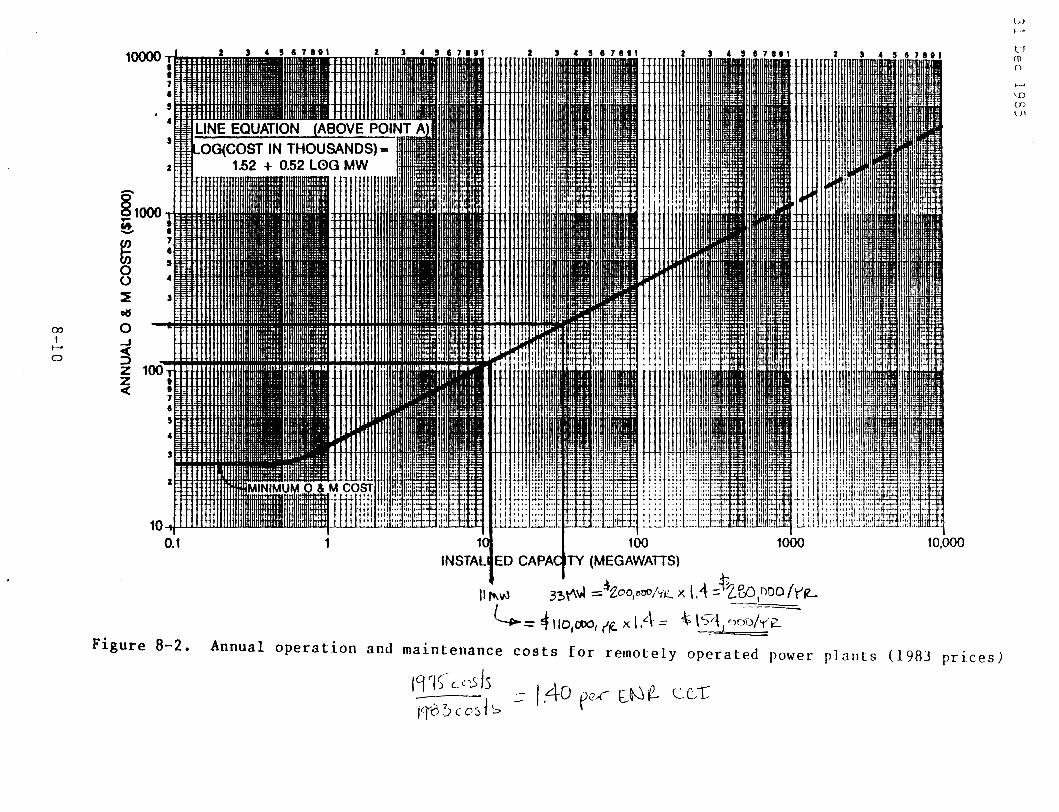
00
' r-o 0
·-·" l
2
~ s 0 • ()
~ l
ad 0 _, ~ z z c:(
10 •I I II Jlllllllllllll
0.1 100 (MEGAWATIS)
~ "' tno 1 II 1'\W 3~\"\~ = 2oo1oOO/'i(. X\.\::. ~t:D/)00 r'~
~ == 4llo,coo1 (~ x 1 :~l= t l54, oon/;e.
10,000
Figure 8-2. Annual operation and maintenance costs for remotely operated power plants (1983 prices)
19'"1S c_.:>.S/s ~ /.40 peA" EJ~~ ccr vro.:; co:., 1 s
(,)
·~ tl m [)
~~
'D 0)
\Jl
Appendix C - St. George Electrical Rates
Attached is a current copy of the electrical rates for the City of St. George which is the largest power supplier in Washington County with a peak base load of80 MW.
.ake Powell Pipeline Study Final Report, March 1995
--·1
.}
Sin'JUilY o: AATt: .SCHttULE.S s~, azoKGt, trrAH, !!llNlC!rAl. POnR AHo t.ICH'l' SYS!!M
£!'Ft:!'Ivt NOVEHBEK J , l9SO
SU!!i!AR! OF lUTES !CHtDULES a!! a'Jth:~i:ed bi' crdi::ant:! passed by the City C:ur.:il i:n Ct:t;ba~ 4, 1990 f:r sel"li~e aviilable to C:u!tc!la~s v1tbln tne re!::h ~i t~e existlnq ~istr1but!:n systn.
RESIDDl'l'lAL StR.VICE
· · RESID'e.ll'l'IAL stRv"Itt. AvuuarLIT¥ :· ·Th!2. r!t·a·"i:!!aduli'i:lpHii'tc·irr · rasiaentTil ·e-lec-rn:- sa:"::1ce· cser for -a:li&!fii'ptirpC:Seicn· t.l!e · · premises or any in41':idua! private resiaence, apirtllent cr dwe!li~ and •essucad by a !inqlllleter at approxillat!ly 110 or 2tO Talts, 60 cycles, The ca;,:n 4f!!S :t ns~dant ial ~e·rei:~llents v!U be c:rt5idered re!ident1il senic! H the e'iner.s of tbe co!lmcn ana are e~clusi7e u!ers and if tne total :~nne:ted lea~ tor the c:mmcn are! does net exceed ~0 k~.
~'!ts: .
CU!t:3er C~arqe £na~; Charqe 1 per U.h
·saALL GENERAL SERVICE
Pee Meter Per Hcntb
s 6.;5 ' o.o•e~
APPLICABLE: Thi! s:hedule is Ear sinqle :r tbr!!·phase n~~res!aenti;l ser;ict supplie~ at t~a Department's available Toltaat thro~~ a slnq!e aeter f:r all s.r•1~! r~~u1red ~n tbe ~JSt;aer't pre~15!! by Cust;~srs vith i pe~er requ1renent that 1s not jrest!~ than 50 ~V dur1nq seven {7) cf t!'lt prier tllel':e U~l acntb per1;d and r.ever t."tctt4inq 60 k1. C::stcaet'! subj~t to tb1s nt; scb~ule tho fail te qualil7 under tbe tb:ve :'n41t1on sttal! he c!a:sifitd IJ Larqe Gene:ll service reqar41es: oi tbe psr1C4 cf ti:te dur~nq vll1ch t~.•:· qu!Uiled ui!Ge: tAl! S:beaule. custe11e:s other11se s~jeet to this nu vno tall t: quautr under t~e abo'te eond!t!or.s shall re:a~n on the t.arqe General Str"•ic'! s:~e~lli! rer a per1cd of n:t l!!! t~an 1'2 11cnths. ·
CHA.'V.C'!'G ot SiRVlC:::: .11 tt:-llat1n; :urre:l!; 60 cyeles: si nqle pba!e l10/2(0 ·t:Hs: tl1rt!·(ha!e J2onoe VQlta, ud ather Tcltaqc: upcn p~:li!SiQn et the C!t7 :: spee!fie~ 1n ser11~a p:licits and re;ulat1or~.
RATts:
Ci.l!t:aer Cb&rqe
Encqy Cl!arQe: 0·500 kVh, per t~h lle.'\t ,,~o Uh, 9er kYb Over 10,000 tVb~ per kih
~e::ar.d Cllarqe: o-s kW 1 per U Over S ki, par kV
P:~ Met!!' Per M:ntb
! 5,75
• 0.0795 - . s 0.04~3 S O.OZ5l
rOitR FlCTCR ADJUSTHENT: If tbe ~ust~1er Pailr iact:r is fcund t: be l!!! than 95 per:ant, th= CUSt:t!r vill ~~ ptnaliJid 1 Pltc!n cf tbe :vara!l blllinq t:r eacn l per~!nt bel:• tne 95 percent ~c~er taet~r,
T
~ LARGE GE~~L S~VlC!
- ~ ·-
APPLICASU:: 'l'h is s:~:dul! is fer ·.si nqle :: three-phase r.::n·rasident ial ser·;ic~ !upp 1 ied at the Depu t!lent '~ available voltaqe through a sir.qle me~!r t:r all :ervice re~uir!~ :n the CU5t::er'! pre~ise: ty Cust:mers with a ;e~e: re~uire1ent that is ;reate: than sc ki durinq se~en (7J ot the prior t~elve (l~l 1onth per1c~ and fer all customers vhcse lead exceeds 60 tl in any tenth during the tvel ve 1onth peri:~, L t 1s al~o applicable t: any cust::ler who failS to qualify f:r S11all General ser'lic:e aurinq anr tvelTe 1onths. · ·
CHARACTER or SERVI~: Altarna~ing current: 60 ~rcles: single pnase 12012~0 Tclts: three-phase 120/~oe volts, and other voltaqe! upcn pe~isaion of the Citj' as spe~Hiec in se~:·;::::e policie~ ar.d requlati:~.
RATES: Per Meter Par Konth .... - ~. -=~:.:...-.:.:- ............ ·- .. -·-··- -· .. - ... •· ·,·
Custo11er Char9e
.Enerqy Char~e: 0-1o.ooo kih, per kih Oie~ 10,000 klb, per kWh
De!lan4 oar9e: o-s t'l, per u
./ 0\'ar 5 U, per U
$30.00
s o.o3S2 s 0.0,~1
~ o.oo $ 7.60
POm FACTOR ADJUS'i'HEtiT: If tne custour pc:~u facto~ is f:und t: ~~ l!ss than ;s perc:ent, the c-J.stcser wlll ~~ penil1:ed 1 percenl~ cf the cteral1 billinq tcr aac:h l percent ~elo~ the 95 percent power fac:tor.
TEHPORARf SERVICE: Tespcrar7 ~~~ar Vili bl :har~td at the Small Ga~eral Ser~ice Rate.
SLRVICE OUTS.IDE CITY LIH!TS 1 tlee:r1e :er71C:! f!ulnte! ::r these ecnne~tad to the City Electric: Syste~, but li t1nq outside th1 .C~ty ;f st. uaer9e :nc:r~:ute'i cea vill ~~ ~iqher than t~e rates ~al4 by tr.:se ill$ille :ne :nc:rporated area ot tAe City, a deterJine~ fr:u t1~e t~ t1~e ~r the Citi c:unc:11.
DEHAHD ~AARGt ADJ~-rHEHT: it billinq !~ l!!! th!n 15 ~ays. tne ~ecan~ cnarge wiil D! pre-rated,
Sa90Rite.Scb Hl!e-1
--y