feasibility study hoteal rizona - rio nuevo — official...
TRANSCRIPT

FEASIBILITY STUDY
HotelArizona 181 WEST BROADWAY BOULEVARD TUCSON, ARIZONA
SUBMITTED TO:PR OPOSED
Mr. Jerry Fischer HSL Properties 3901 East Broadway Boulevard Tucson, Arizona, 85711 +1 (520) 322-6994
PREPARED BY:
HVS Consulting & Valuation Division of TS Worldwide, LLC 221 East Indianaola Avenue Phoenix, Arizona, 85012 +1 608-658-587
April-2017

May 31, 2017 Mr. Jerry Fischer HSL Properties 3901 East Broadway Boulevard, Tucson, AZ 85711
Re: Hotel Arizona Tucson, Arizona HVS Reference: 2017250013, 2017020758
Dear Mr. Fischer: Pursuant to your request, we herewith submit our feasibility study pertaining to the above-captioned property. We have inspected the real estate and analyzed the hotel market conditions in the Tucson, Arizona area. We have studied the proposed project, and the results of our fieldwork and analysis are presented in this report. We have also reviewed the proposed improvements for this site. Our report was prepared in accordance with the Uniform Standards of Professional Appraisal Practice (USPAP), as provided by the Appraisal Foundation. We hereby certify that we have no undisclosed interest in the property, and our employment and compensation are not contingent upon our findings. This study is subject to the comments made throughout this report and to all assumptions and limiting conditions set forth herein.
Sincerely, TS Worldwide, LLC DRAFT DOCUMENT
Ryan M. Wall, Vice President [email protected], +1 608-658-587 State Appraiser License (AZ) 32100
HVS PHOENIX - LOS ANGELES OFFICE
221 East Indianaola Avenue
Phoenix, Arizona, 85012 +1 608-658-587 +1 (415) 896-0516 FAX www.hvs.com
Superior results through unrivaled hospitality intelligence. Everywhere.

Table of Contents
SECTION TITLE PAGE
1. Executive Summary 6 Ownership, Franchise, and Management Assumptions 6 Summary of Hotel Market Trends 7 Summary of Forecast Occupancy and Average Rate 11 Summary of Forecast Income and Expense Statement 11 Feasibility Conclusion 14
2. Description of the Site and Neighborhood 17 Physical Characteristics 17 Access and Visibility 20 Airport and Metrorail Access 22 Neighborhood 22 Proximity to Local Demand Generators and Attractions 23 Flood Zone 25 Zoning 27
3. Market Area Analysis 28 Workforce Characteristics 32 Radial Demographic Snapshot 38 Unemployment Statistics 40 Major Business and Industry 41 Office Space Statistics 43 Convention Activity 46 Airport Traffic 47 Tourist Attractions 49
4. Supply and Demand Analysis 52 Definition of Subject Hotel Market 52 National Trends Overview 52 Historical Supply and Demand Data 56

Seasonality 58 Patterns of Demand 61 Primary Competitiors 64 Secondary Competitors 75 Supply Changes 77 Demand Analysis Using Market Segmentation 79 Base Demand Growth Rates 81 Latent Demand 82 Accommodated Demand and Market-wide Occupancy 84
5. Description of the Proposed Project 87 Project Overview 87 Summary of the Facilities 88 Site Improvements and Hotel Structure 90 Lobby 90 Food and Beverage Facilities 91 Meeting and Banquet Space 92 Recreational Amenities 93 Additional Amenities 93 Guestrooms 93 Construction Budget 97 Conclusion 99
6. Projection of Occupancy and Average Rate 100 Historical Penetration Rates by Market Segment 100 Forecast of Subject Property’s Occupancy 101 Average Rate Analysis 104 Competitive Position 104
7. Projection of Income and Expense 111 Comparable Operating Statements 111 Forecast of Revenue and Expense 118 Rooms Revenue 121 Food and Beverage Revenue 121

Other Operated Departments Revenue 122 Miscellaneous Income 122 Rooms Expense 122 Food and Beverage Expense 123 Other Operated Departments Expense 123 Administrative and General Expense 124 Information and Telecommunications Systems Expense 124 Marketing Expense 125 Franchise Fee 125 Property Operations and Maintenance 125 Utilities Expense 126 Management Fee 127 Property Taxes 127 Insurance Expense 131 Reserve for Replacement 132 Forecast of Revenue and Expense Conclusion 132
8. Feasibility Analysis 134 Construction Cost Estimate 134 Mortgage Component 136 Equity Component 138 Terminal Capitalization Rate 140 Mortgage-Equity Method 142 Conclusion 144
9. Statement of Assumptions and Limiting Conditions 146 10. Certification 149
Addenda
Induced Demand Analysis – Tucson Convention Center Qualifications Copy of Appraisal License(s)
April-2017 Executive Summary Hotel Arizona – Tucson, Arizona 6
1. Executive Summary
The subject of the feasibility study is a 155,179-square-foot (3.56-acre) full-service lodging facility; the redeveloped hotel is expected to be affiliated with the DoubleTree by Hilton or similar brand. The property, which is expected to reopen on January 1, 2019, will feature 309 total rooms, a three-meal restaurant, a signature restaurant, a lobby bar and lounge, and "made market"/grab-n-go, an outdoor pool, an outdoor whirlpool, a sundeck, a fitness center, a business center, and a gift shop. The hotel will also contain the appropriate parking capacity (350 garage) and all necessary back-of-the-house space. The Hotel Arizona was built in conjunction with the Tucson Convention Center in the early 1970s and served as Downtown Tucson's primary convention lodging facility until its closure in 2012. The hotel originally opened as Braniff Place, and over the years it has been branded as a Marriott and Holiday Inn. The hotel is now expected to undergo a comprehensive renovation and reopen as a DoubleTree by Hilton (or similar brand), once again providing Downtown Tucson with a large, convention-oriented lodging facility. Furthermore, the hotel's reopening is expected to have a positive impact on the Tucson Convention Center, which will be discussed in more detail throughout this report. The subject site’s location is 181 West Broadway Boulevard, Tucson, Arizona, 85701-1616. The effective date of the report is May 8, 2017. The subject site was inspected by Ryan M. Wall on April 24, 2017. The owner of the subject hotel is Pueblo Center Partners LP; the parent company of this owning partnership is HSL Properties, which is based in Tucson, Arizona. The subject site was last sold in 1984; HSL Properties has owned the site since that time, having purchased it from an unknown seller for an unknown price. The property is neither listed nor under contract for sale, and we have no knowledge of any recent listings. Details pertaining to management terms were not yet determined at the time of this report; however, we assume that the proposed hotel will be managed by a professional hotel-operating company, with fees deducted at rates consistent with current market standards. We have assumed a market-appropriate total management fee of 3.0% of total revenues in our study. We recommend that the proposed subject hotel operate as an upscale, full-service property. While we have placed heavy consideration on the DoubleTree by Hilton
Subject of the Feasibility Study
Pertinent Dates
Ownership, Franchise, and Management Assumptions

April-2017 Executive Summary Hotel Arizona – Tucson, Arizona 7
brand, which is affiliated with Hilton Hotels and Resorts, a specific franchise affiliation and/or brand has yet to be finalized. Based on our review of the agreement’s terms or expected terms, the DoubleTree by Hilton franchise is reflected in our forecasts with a royalty fee of 5% of rooms revenue, and a marketing assessment of 4% of rooms revenue. RevPAR first peaked for this selected set of competitive hotels in 2007, resulting in a RevPAR of nearly $80, before declining to a low point of roughly $63 by year-end 2009 because of the recession. A delayed recovery was generally experienced from 2010 through 2013, with year-over-year RevPAR fluctuations. The delayed ramp-up was largely due to group cancelations following the attempted passage of SB 1070 in 2010 and the federal government sequester in 2013. However, both occupancy and rate grew in 2014, largely driven by upticks in leisure travel during the peak spring months. This trend continued through 2016, as hotel managers in the area reported fewer cancelations in the group segment, which contributed to the overall strengthening. Year-to-date data illustrate continued strengthening in overall RevPAR, led by stronger average rate growth. This positive trend illustrates that the market is continuing to strengthen, which was confirmed by our market interviews, indicating less rate-resistance by travelers in the year-to-date period over the prior year. The outlook for the remaining months of 2017 is positive as the local economy continues to strengthen. The following table provides a historical perspective on the supply and demand trends for a selected set of hotels, as provided by STR.
Summary of Hotel Market Trends

April-2017 Executive Summary Hotel Arizona – Tucson, Arizona 8
FIGURE 1-1 HISTORICAL SUPPLY AND DEMAND TRENDS (STR)
YearAverage Daily Room Count
Available Room Nights Change
Occupied Room Nights Change Occupancy
Average Rate Change RevPAR Change
2005 1,788 652,620 — 481,528 — 73.8 % $96.00 — $70.83 — 2006 1,788 652,620 0.0 % 511,042 6.1 % 78.3 100.66 4.8 % 78.82 11.3 %2007 1,788 652,620 0.0 467,599 (8.5) 71.6 110.63 9.9 79.27 0.62008 1,788 652,620 0.0 427,633 (8.5) 65.5 111.63 0.9 73.15 (7.7)2009 1,788 652,620 0.0 406,840 (4.9) 62.3 101.54 (9.0) 63.30 (13.5)2010 1,785 651,396 (0.2) 432,269 6.3 66.4 97.65 (3.8) 64.80 2.42011 1,780 649,700 (0.3) 426,237 (1.4) 65.6 94.97 (2.7) 62.31 (3.8)2012 1,667 608,450 (6.3) 403,335 (5.4) 66.3 94.28 (0.7) 62.50 0.32013 1,746 637,300 4.7 414,087 2.7 65.0 95.38 1.2 61.97 (0.8)2014 1,784 651,160 2.2 424,453 2.5 65.2 96.99 1.7 63.22 2.02015 1,784 651,160 0.0 433,329 2.1 66.5 99.06 2.1 65.92 4.32016 1,784 651,160 0.0 433,771 0.1 66.6 102.55 3.5 68.32 3.6
Year-to-Date Through March2016 1,784 160,560 — 130,483 — 81.3 % $119.08 — $96.77 — 2017 1,784 160,560 0.0 % 126,531 (3.0) % 78.8 125.42 5.3 % 98.84 2.1 %
Average Annual Compounded Change:2005 - 2016 (0.0) % (0.9) % 0.6 % (0.3) %2005 - 2007 0.0 (1.5) 7.4 5.82007 - 2010 (0.1) (2.6) (4.1) (6.5)2010 - 2016 (0.0) 0.1 0.8 0.9
Hotels Included in Sample
Hil ton Tucs on Eas t Primary 232 Upper Ups ca le Class Feb 1987Radis s on Sui tes Tucson Not Competitive 299 Ups ca le Class Dec 1985Doubletree Tucson @ Reid Park Primary 287 Ups ca le Class Nov 1974DoubleTree Sui tes Tucson Wil l iams Center Primary 142 Ups ca le Class Jun 1975 *Converted from Embas sy Sui tes i n July 2015Sheraton Hotel & Suites Tucson Primary 216 Upper Ups ca le Class Jun 1985Tucson Hotel Primary 250 Mids ca le Class Dec 1996 *Converted from Marriott in March 2017a loft Hotel Tucs on Univers i ty Primary 154 Ups ca le Class Jun 1971 *Converted to Aloft in Apri l 2013DoubleTree Tucson Ai rport Secondary 204 Ups ca le Class Jan 1982
Total 1,784
Source: STR
Competitive Status
YearOpened
Number Yearof Rooms Affiliated Comments
The following tables reflect our estimates of operating data for hotels on an individual basis. These trends are presented in detail in the Supply and Demand Analysis chapter of this report.

April-2017 Executive Summary Hotel Arizona – Tucson, Arizona 9
FIGURE 1-2 PRIMARY COMPETITORS – OPERATING PERFORMANCE
Est. Segmentation Estimated 2015 Estimated 2016
Property Occ. RevPAR RevPAROccupancy Penetration
Yield Penetration
DoubleTree Sui tes by Hi l ton Tucson Wi l l iams Center 142 50 % 30 % 20 % 142 50 - 55 % $105 - $110 $55 - $60 142 60 - 65 % $110 - $115 $70 - $75 90 - 95 % 95 - 100 %
DoubleTree by Hi l ton Tucson Reid Park 287 50 25 25 287 70 - 75 90 - 95 65 - 70 287 75 - 80 95 - 100 70 - 75 100 - 110 95 - 100
Tucs on Univers i ty Park Hotel 250 40 30 30 250 75 - 80 130 - 140 100 - 105 251 75 - 80 130 - 140 105 - 110 110 - 120 140 - 150
Hi l ton Tucson Eas t 232 55 25 20 232 65 - 70 85 - 90 60 - 65 232 70 - 75 85 - 90 60 - 65 100 - 110 85 - 90
Sheraton Hotel & Suites Tucs on 216 40 30 30 216 60 - 65 80 - 85 50 - 55 216 55 - 60 85 - 90 45 - 50 75 - 80 65 - 70
Al oft Tucson Univers i ty 154 45 20 35 154 70 - 75 120 - 125 85 - 90 154 70 - 75 125 - 130 90 - 95 100 - 110 120 - 130
Sub-Totals/Averages 1,281 47 % 27 % 27 % 1,281 69.8 % $104.14 $72.66 1,282 71.4 % $107.13 $76.54 101.0 % 102.4 %
Secondary Competi tors 503 50 % 15 % 35 % 163 58.0 % $93.00 $53.94 163 65.0 % $93.00 $60.45 91.9 % 80.9 %
Totals/Averages 1,784 47 % 25 % 27 % 1,444 68.4 % $103.07 $70.54 1,445 70.7 % $105.66 $74.72 100.0 % 100.0 %
* Specific occupancy and average rate data were utilized in our analysis, but are presented in ranges in the above table for the purposes of confidentiality.
Number of Rooms Average Rate Occ.
Weighted Annual Room Count Average RateCo
mm
ercia
l/Gov
ernm
ent
Mee
ting
and
Grou
p
Leisu
re
Weighted Annual Room Count

April-2017 Executive Summary Hotel Arizona – Tucson, Arizona 10
FIGURE 1-3 SECONDARY COMPETITORS – OPERATING PERFORMANCE
Est. Segmentation Estimated 2015 Estimated 2016
PropertyNumber of
Rooms Occ. Average Rate RevPAR Occ. Average Rate RevPAR
DoubleTree Sui tes by Hi l ton Tucson Airport
204 50 15 35 80 163 55 - 60 90 - 95 50 - 55 163 60 - 65 90 - 95 60 - 65
Ra disson Suites Tucson 299 30 40 30 0 0 55 - 60 75 - 80 40 - 45 0 45 - 50 80 - 85 35 - 40
Totals/Averages 503 50 % 15 % 35 % 32 % 163 58.0 % $93.00 $53.94 163 65.0 % $93.00 $60.45
* Specific occupancy and average rate data was utilized in our analysis, but is presented in ranges in the above table for the purposes of confidentiality.
Leisu
re
Com
mer
cial/G
over
nmen
t
Mee
ting
and
Grou
p
Total Competitive
Level
Weighted Annual Room Count
Weighted Annual Room Count

April-2017 Executive Summary Hotel Arizona – Tucson, Arizona 11
Based on our analysis presented in the Projection of Occupancy and Average Rate chapter, we have chosen to use a stabilized occupancy level of 68% and a base-year rate position of $125.00 for the proposed subject hotel. The following table reflects a summary of our market-wide and proposed subject hotel occupancy and average rate projections.
FIGURE 1-4 MARKET AND SUBJECT PROPERTY AVERAGE RATE FORECAST
Calendar Year 2016 2017 2018 2019 2020 2021 2022 2023 2024
Market ADR $105.66 $110.42 $114.83 $118.28 $121.83 $125.48 $129.24 $133.12 $137.12Projected Market ADR Growth Ra te — 4.5% 4.0% 3.0% 3.0% 3.0% 3.0% 3.0% 3.0%
Proposed Subject Property ADR (Before Discount) $125.00 $130.63 $135.85 $139.93 $144.12 $148.45 $152.90 $157.49 $162.21ADR Growth Rate — 4.5% 4.0% 3.0% 3.0% 3.0% 3.0% 3.0% 3.0%
Proposed Subject ADR Penetra tion (Before Discount) 118% 118% 118% 118% 118% 118% 118% 118% 118.3%
Fiscal Year 2019 2020 2021 2022 2023 2024
Proposed Subject Property Average Rate $139.93 $144.12 $148.45 $152.90 $157.49 $162.21Opening Discount 3.0% 2.0% 0.0% 0.0% 0.0% 0.0%
Average Rate After Discount $135.73 $141.24 $148.45 $152.90 $157.49 $162.21
Real Average Rate Growth — 4.1% 5.1% 3.0% 3.0% 3.0%
Market ADR $118.28 $121.83 $125.48 $129.24 $133.12 $137.12Proposed Subject ADR Penetra tion (After Discount) 115% 116% 118% 118% 118% 118%
ADR Expressed in Base-Year Dol lars Deflated @ Infla tion Rate $127.34 $127.34 $129.94 $129.94 $129.94 $129.94
Our positioning of each revenue and expense level is supported by comparable operations or trends specific to this market. Our forecast of income and expense is presented in the following table.
Summary of Forecast Occupancy and Average Rate
Summary of Forecast Income and Expense Statement

April-2017 Executive Summary Hotel Arizona – Tucson, Arizona 12
FIGURE 1-5 DETAILED FORECAST OF INCOME AND EXPENSE
2019 (Calendar Year) 2020 2021 Stabilized 2023
Number of Rooms: 309 309 309 309 309Occupancy: 54% 63% 67% 68% 68%Average Rate: $135.73 $141.24 $148.45 $152.90 $157.49RevPAR: $73.29 $88.98 $99.46 $103.97 $107.09Days Open: 365 365 365 365 365Occupied Rooms: 60,904 %Gross PAR POR 71,055 %Gross PAR POR 75,566 %Gross PAR POR 76,694 %Gross PAR POR 76,694 %Gross PAR POR OPERATING REVENUERooms $8,266 59.1 % $26,751 $135.72 $10,036 60.7 % $32,479 $141.24 $11,218 61.7 % $36,304 $148.45 $11,727 61.8 % $37,951 $152.91 $12,078 61.8 % $39,087 $157.48Food 3,883 27.8 12,567 63.76 4,469 27.0 14,464 62.90 4,818 26.5 15,593 63.76 5,018 26.4 16,240 65.43 5,169 26.4 16,728 67.40Beverage 1,337 9.6 4,328 21.96 1,493 9.0 4,833 21.02 1,591 8.7 5,150 21.06 1,653 8.7 5,348 21.55 1,702 8.7 5,509 22.19Other Operated Departments 387 2.8 1,254 6.36 416 2.5 1,346 5.85 436 2.4 1,412 5.77 451 2.4 1,460 5.88 465 2.4 1,504 6.06Miscellaneous Income 116 0.8 376 1.91 125 0.8 404 1.76 131 0.7 423 1.73 135 0.7 438 1.77 139 0.7 451 1.82 Total Operating Revenues 13,990 100.0 45,276 229.71 16,539 100.0 53,526 232.77 18,195 100.0 58,882 240.78 18,984 100.0 61,438 247.54 19,553 100.0 63,279 254.95DEPARTMENTAL EXPENSES *Rooms 1,871 22.6 6,055 30.72 2,038 20.3 6,597 28.69 2,150 19.2 6,959 28.46 2,228 19.0 7,210 29.05 2,295 19.0 7,427 29.92Food & Beverage 3,439 65.9 11,131 56.47 3,701 62.1 11,979 52.09 3,885 60.6 12,573 51.41 4,020 60.3 13,011 52.42 4,141 60.3 13,401 53.99Other Operated Departments 284 73.2 918 4.66 296 71.1 957 4.16 306 70.2 991 4.05 316 70.0 1,022 4.12 325 70.0 1,053 4.24 Total Expenses 5,594 40.0 18,104 91.85 6,036 36.5 19,533 84.94 6,342 34.9 20,524 83.92 6,564 34.6 21,244 85.59 6,761 34.6 21,881 88.16DEPARTMENTAL INCOME 8,396 60.0 27,172 137.86 10,504 63.5 33,993 147.83 11,853 65.1 38,358 156.85 12,420 65.4 40,195 161.94 12,792 65.4 41,398 166.79UNDISTRIBUTED OPERATING EXPENSESAdministrative & General 1,203 8.6 3,893 19.75 1,278 7.7 4,135 17.98 1,337 7.3 4,327 17.70 1,382 7.3 4,472 18.02 1,423 7.3 4,606 18.56Info & Telecom Systems 190 1.4 615 3.12 202 1.2 653 2.84 211 1.2 683 2.79 218 1.1 706 2.84 225 1.1 727 2.93Marketing 1,368 9.8 4,426 22.45 1,332 8.1 4,309 18.74 1,267 7.0 4,100 16.76 1,309 6.9 4,236 17.07 1,348 6.9 4,363 17.58Franchise Fee 744 5.3 2,408 12.21 903 5.5 2,923 12.71 1,010 5.5 3,267 13.36 1,055 5.6 3,416 13.76 1,087 5.6 3,518 14.17Prop. Operations & Maint. 506 3.6 1,639 8.32 605 3.7 1,959 8.52 704 3.9 2,278 9.31 727 3.8 2,353 9.48 749 3.8 2,424 9.77Utilities 601 4.3 1,946 9.88 639 3.9 2,068 8.99 669 3.7 2,164 8.85 691 3.6 2,236 9.01 712 3.6 2,303 9.28 Total Expenses 4,612 33.0 14,926 75.73 4,958 30.1 16,047 69.78 5,197 28.6 16,819 68.77 5,382 28.3 17,419 70.18 5,544 28.3 17,941 72.28GROSS HOUSE PROFIT 3,784 27.0 12,245 62.13 5,545 33.4 17,947 78.05 6,656 36.5 21,540 88.08 7,038 37.1 22,776 91.76 7,248 37.1 23,457 94.51Management Fee 420 3.0 1,358 6.89 496 3.0 1,606 6.98 546 3.0 1,766 7.22 570 3.0 1,843 7.43 587 3.0 1,898 7.65INCOME BEFORE NON-OPR. INC. & EXP. 3,364 24.0 10,887 55.24 5,049 30.4 16,341 71.06 6,110 33.5 19,773 80.86 6,468 34.1 20,933 84.34 6,662 34.1 21,559 86.86NON-OPERATING INCOME & EXPENSEProperty Taxes 483 3.5 1,563 7.93 611 3.7 1,978 8.60 658 3.6 2,129 8.70 708 3.7 2,292 9.23 729 3.7 2,360 9.51Insurance 166 1.2 538 2.73 171 1.0 555 2.41 177 1.0 571 2.34 182 1.0 588 2.37 187 1.0 606 2.44Reserve for Replacement 280 2.0 906 4.59 496 3.0 1,606 6.98 728 4.0 2,355 9.63 759 4.0 2,458 9.90 782 4.0 2,531 10.20 Total Expenses 929 6.7 3,007 15.26 1,279 7.7 4,138 17.99 1,562 8.6 5,055 20.67 1,649 8.7 5,338 21.51 1,699 8.7 5,498 22.15EBITDA LESS RESERVE $2,435 17.3 % $7,880 $39.98 $3,771 22.7 % $12,203 $53.07 $4,548 24.9 % $14,718 $60.18 $4,819 25.4 % $15,595 $62.83 $4,963 25.4 % $16,061 $64.71
*Departmental expenses are expressed as a percentage of departmental revenues.

April-2017 Executive Summary Hotel Arizona – Tucson, Arizona 13
FIGURE 1-6 TEN-YEAR FORECAST OF INCOME AND EXPENSE
2019 2020 2021 2022 2023 2024 2025 2026 2027 2028
Number of Rooms: 309 309 309 309 309 309 309 309 309 309Occupied Rooms: 60,904 71,055 75,566 76,694 76,694 76,694 76,694 76,694 76,694 76,694Occupancy: 54% 63% 67% 68% 68% 68% 68% 68% 68% 68%Average Rate: $135.73 % of $141.24 % of $148.45 % of $152.90 % of $157.49 % of $162.21 % of $167.08 % of $172.09 % of $177.25 % of $182.57RevPAR: $73.29 Gross $88.98 Gross $99.46 Gross $103.97 Gross $107.09 Gross $110.30 Gross $113.61 Gross $117.02 Gross $120.53 Gross $124.15OPERATING REVENUERooms $8,266 59.1 % $10,036 60.7 % $11,218 61.7 % $11,727 61.8 % $12,078 61.8 % $12,441 61.8 % $12,814 61.8 % $13,198 61.8 % $13,594 61.8 % $14,002 61.8 %Food 3,883 27.8 4,469 27.0 4,818 26.5 5,018 26.4 5,169 26.4 5,324 26.4 5,484 26.4 5,648 26.4 5,818 26.4 5,992 26.4Beverage 1,337 9.6 1,493 9.0 1,591 8.7 1,653 8.7 1,702 8.7 1,753 8.7 1,806 8.7 1,860 8.7 1,916 8.7 1,973 8.7Other Operated Departments 387 2.8 416 2.5 436 2.4 451 2.4 465 2.4 479 2.4 493 2.4 508 2.4 523 2.4 539 2.4Miscellaneous Income 116 0.8 125 0.8 131 0.7 135 0.7 139 0.7 144 0.7 148 0.7 152 0.7 157 0.7 162 0.7 Total Operating Revenues 13,990 100.0 16,539 100.0 18,195 100.0 18,984 100.0 19,553 100.0 20,140 100.0 20,744 100.0 21,366 100.0 22,007 100.0 22,668 100.0DEPARTMENTAL EXPENSES *Rooms 1,871 22.6 2,038 20.3 2,150 19.2 2,228 19.0 2,295 19.0 2,364 19.0 2,435 19.0 2,508 19.0 2,583 19.0 2,660 19.0Food & Beverage 3,439 65.9 3,701 62.1 3,885 60.6 4,020 60.3 4,141 60.3 4,265 60.3 4,393 60.3 4,525 60.3 4,661 60.3 4,801 60.3Other Operated Departments 284 73.2 296 71.1 306 70.2 316 70.0 325 70.0 335 70.0 345 70.0 356 70.0 366 70.0 377 70.0 Total Expenses 5,594 40.0 6,036 36.5 6,342 34.9 6,564 34.6 6,761 34.6 6,964 34.6 7,173 34.6 7,388 34.6 7,610 34.6 7,838 34.6DEPARTMENTAL INCOME 8,396 60.0 10,504 63.5 11,853 65.1 12,420 65.4 12,792 65.4 13,176 65.4 13,571 65.4 13,978 65.4 14,398 65.4 14,830 65.4UNDISTRIBUTED OPERATING EXPENSESAdministrative & General 1,203 8.6 1,278 7.7 1,337 7.3 1,382 7.3 1,423 7.3 1,466 7.3 1,510 7.3 1,555 7.3 1,602 7.3 1,650 7.3Info & Telecom Systems 190 1.4 202 1.2 211 1.2 218 1.1 225 1.1 231 1.1 238 1.1 246 1.1 253 1.1 260 1.1Marketing 1,368 9.8 1,332 8.1 1,267 7.0 1,309 6.9 1,348 6.9 1,389 6.9 1,430 6.9 1,473 6.9 1,517 6.9 1,563 6.9Franchise Fee 744 5.3 903 5.5 1,010 5.5 1,055 5.6 1,087 5.6 1,120 5.6 1,153 5.6 1,188 5.6 1,223 5.6 1,260 5.6Prop. Operations & Maint. 506 3.6 605 3.7 704 3.9 727 3.8 749 3.8 772 3.8 795 3.8 818 3.8 843 3.8 868 3.8Utilities 601 4.3 639 3.9 669 3.7 691 3.6 712 3.6 733 3.6 755 3.6 778 3.6 801 3.6 825 3.6 Total Expenses 4,612 33.0 4,958 30.1 5,197 28.6 5,382 28.3 5,544 28.3 5,710 28.3 5,881 28.3 6,058 28.3 6,240 28.3 6,427 28.3GROSS HOUSE PROFIT 3,784 27.0 5,545 33.4 6,656 36.5 7,038 37.1 7,248 37.1 7,466 37.1 7,690 37.1 7,920 37.1 8,158 37.1 8,403 37.1Management Fee 420 3.0 496 3.0 546 3.0 570 3.0 587 3.0 604 3.0 622 3.0 641 3.0 660 3.0 680 3.0INCOME BEFORE NON-OPR. INC. & EXP. 3,364 24.0 5,049 30.4 6,110 33.5 6,468 34.1 6,662 34.1 6,862 34.1 7,068 34.1 7,279 34.1 7,498 34.1 7,723 34.1NON-OPERATING INCOME & EXPENSEProperty Taxes 483 3.5 611 3.7 658 3.6 708 3.7 729 3.7 751 3.7 774 3.7 797 3.7 821 3.7 846 3.7Insurance 166 1.2 171 1.0 177 1.0 182 1.0 187 1.0 193 1.0 199 1.0 205 1.0 211 1.0 217 1.0Reserve for Replacement 280 2.0 496 3.0 728 4.0 759 4.0 782 4.0 806 4.0 830 4.0 855 4.0 880 4.0 907 4.0 Total Expenses 929 6.7 1,279 7.7 1,562 8.6 1,649 8.7 1,699 8.7 1,750 8.7 1,802 8.7 1,856 8.7 1,912 8.7 1,969 8.7EBITDA LESS RESERVE $2,435 17.3 % $3,771 22.7 % $4,548 24.9 % $4,819 25.4 % $4,963 25.4 % $5,112 25.4 % $5,265 25.4 % $5,423 25.4 % $5,586 25.4 % $5,754 25.4 %
1 1 1 1 1 1 1 1 1 1*Departmental expenses are expressed as a percentage of departmental revenues.
% ofGross

April-2017 Executive Summary Hotel Arizona – Tucson, Arizona 14
As illustrated, the hotel is expected to stabilize at a profitable level. Please refer to the Forecast of Income and Expense chapter of our report for a detailed explanation of the methodology used in deriving this forecast. The Feasibility Analysis chapter of this report converts these cash flows into a net present value indication assuming set-forth debt and equity requirements. The conclusion of this analysis indicates that an equity investor contributing $19,167,000 (roughly 35% of the $54,800,000 redevelopment cost) could expect to receive a 14.8% internal rate of return over a ten-year holding period, assuming that the investor obtains financing at the time of the project’s completion at the loan-to-value ratio and interest rate set forth. While the redeveloped subject hotel has an opportunity to serve an underserved niche in the market, our market analysis indicates a gap in the project's overall feasibility. A feasibility gap can be defined as the difference between a project’s cost and its value. If a project’s cost is greater than its value, then it is not feasible and subsidies may be required. Hotel funding typically includes an equity component and a loan component. As different developers have access to different sources of equity and loan financing, the funding aspect of a hotel development can play a crucial role in determining a developer’s total project cost. Alternative types of funding can take many forms, including upfront cash subsidies or debt service guarantees or even a rebate of site-specific taxes. Our conclusions are based primarily on the long-term strength of this hotel market and conventional financing methods. A review of investor surveys indicates equity returns ranging from 10.3% to 22.7%, with an average of 17.7%. Based on these parameters, the calculated return to the equity investor, 14.8%, is below the average of market-level returns given the anticipated cost of approximately $54,800,000. “Extraordinary Assumption” is defined in USPAP as follows:
An assumption, directly related to a specific assignment, as of the effective date of the assignment results, which, if found to be false, could alter the appraiser’s opinions or conclusions. Comment: Extraordinary assumptions presume as fact otherwise uncertain information about physical, legal, or economic characteristics of the subject property; or about conditions external to the property, such as market conditions or trends; or about the integrity of data used in an analysis.1
The analysis is based on the extraordinary assumption that the described improvements have been renovated as of the stated date of opening. The reader should understand that the subject property's structure does exist as of the date of 1 The Appraisal Foundation, Uniform Standards of Professional Appraisal Practice, 2016–2017 ed.
Feasibility Conclusion
Assignment Conditions

April-2017 Executive Summary Hotel Arizona – Tucson, Arizona 15
this report. Our feasibility study does not address unforeseeable events that could alter the redevelopment project and/or the market conditions reflected in the analyses; we assume that no significant changes, other than those anticipated and explained in this report, shall take place between the date of inspection and stated date of opening. The use of this extraordinary assumption may have affected the assignment results. We have made no other extraordinary assumptions specific to this feasibility study. However, several important general assumptions have been made that apply to this feasibility study and our studies of proposed hotels in general. These aspects are set forth in the Assumptions and Limiting Conditions chapter of this report. This feasibility report is being prepared for use in the redevelopment of the proposed subject hotel. The client for this engagement is HSL Properties. This report is intended for the addressee firm, and may not be distributed to or relied upon by other persons or entities. The methodology used to develop this study is based on the market research and valuation techniques set forth in the textbooks authored by Hospitality Valuation Services for the American Institute of Real Estate Appraisers and the Appraisal Institute, entitled The Valuation of Hotels and Motels,2 Hotels, Motels and Restaurants: Valuations and Market Studies,3 The Computerized Income Approach to Hotel/Motel Market Studies and Valuations,4 Hotels and Motels: A Guide to Market Analysis, Investment Analysis, and Valuations,5 and Hotels and Motels – Valuations and Market Studies.6
1. All information was collected and analyzed by the staff of TS Worldwide, LLC. Information was supplied by the client and/or the property’s development team.
2 Stephen Rushmore, The Valuation of Hotels and Motels. (Chicago: American Institute of Real Estate Appraisers, 1978). 3 Stephen Rushmore, Hotels, Motels and Restaurants: Valuations and Market Studies. (Chicago: American Institute of Real Estate Appraisers, 1983). 4 Stephen Rushmore, The Computerized Income Approach to Hotel/Motel Market Studies and Valuations. (Chicago: American Institute of Real Estate Appraisers, 1990). 5 Stephen Rushmore, Hotels and Motels: A Guide to Market Analysis, Investment Analysis, and Valuations (Chicago: Appraisal Institute, 1992). 6 Stephen Rushmore and Erich Baum, Hotels and Motels – Valuations and Market Studies. (Chicago: Appraisal Institute, 2001).
Intended Use of the Feasibility Study
Identification of the Client and Intended User(s)
Scope of Work

April-2017 Executive Summary Hotel Arizona – Tucson, Arizona 16
2. The subject site has been evaluated from the viewpoint of its physical utility for the future operation of a hotel, as well as access, visibility, and other relevant factors.
3. The subject property's proposed improvements have been reviewed for their expected quality of construction, design, and layout efficiency.
4. The surrounding economic environment, on both an area and neighborhood level, has been reviewed to identify specific hostelry-related economic and demographic trends that may have an impact on future demand for hotels.
5. Dividing the market for hotel accommodations into individual segments defines specific market characteristics for the types of travelers expected to utilize the area's hotels. The factors investigated include purpose of visit, average length of stay, facilities and amenities required, seasonality, daily demand fluctuations, and price sensitivity.
6. An analysis of existing and proposed competition provides an indication of the current accommodated demand, along with market penetration and the degree of competitiveness. Unless noted otherwise, we have inspected the competitive lodging facilities summarized in this report.
7. Documentation for an occupancy and average rate projection is derived utilizing the build-up approach based on an analysis of lodging activity.
8. A detailed projection of income and expense made in accordance with the Uniform System of Accounts for the Lodging Industry sets forth the anticipated economic benefits of the subject property.
9. A feasibility analysis is performed, in which the market equity yield an investor would expect is compared to the equity yield an investor must accept.

April-2017 Description of the Site and Neighborhood Hotel Arizona – Tucson, Arizona 17
2. Description of the Site and Neighborhood
The suitability of the land for the operation of a lodging facility is an important consideration affecting the economic viability of a property and its ultimate marketability. Factors such as size, topography, access, visibility, and the availability of utilities have a direct impact on the desirability of a particular site. The subject site is located in Downtown Tucson, in the southeast quadrant of the intersection formed by Granada Avenue and Congress Street/Broadway Boulevard. This site is in the city of Tucson, Arizona. The subject site measures approximately 3.56 acres, or 155,179 square feet. The parcel's adjacent uses are set forth in the following table. FIGURE 2-1 SUBJECT PARCEL'S ADJACENT USES
Direction
North Congress Street; Broadway BoulevardSouth Tucson Mus ic Hal lEast La Placi taWest Granada Avenue
Adjacent Use
The subject site comprises two separate parcels. The main parcel (Parcel 1), located along Congress Street/Broadway Boulevard, measures 144,056 square feet and features the hotel and a parking structure. The second parcel (Parcel 2) is located on the southeast side of hotel structure; this parcel is improved with an asphalt traffic circle providing access to the hotel's lower-level ballroom and adjacent meeting space.
Physical Characteristics

April-2017 Description of the Site and Neighborhood Hotel Arizona – Tucson, Arizona 18
PLAT MAP
The topography of the site gently slopes from north to south, and the shape should permit efficient use of the site for building and site improvements, including ingress and egress. Upon completion of hotel's redevelopment, the subject site will not contain any significant portion of undeveloped land that could be sold, entitled, and developed for alternate use. It is expected that the site will be developed fully with building and site improvements, thus contributing to the overall profitability of the hotel.
Topography and Site Utility

April-2017 Description of the Site and Neighborhood Hotel Arizona – Tucson, Arizona 19
AERIAL PHOTOGRAPH
VIEW FROM SITE TO THE NORTH
VIEW FROM SITE TO THE SOUTH

April-2017 Description of the Site and Neighborhood Hotel Arizona – Tucson, Arizona 20
VIEW FROM SITE TO THE EAST
VIEW FROM SITE TO THE WEST
It is important to analyze the site with respect to regional and local transportation routes and demand generators, including ease of access. The subject site is readily accessible to a variety of local and county roads, as well as state and interstate highways.
Access and Visibility

April-2017 Description of the Site and Neighborhood Hotel Arizona – Tucson, Arizona 21
MAP OF REGIONAL ACCESS ROUTES
Primary regional access through the area is provided by east/west Interstate 10, which extends to such cities as Las Cruces, New Mexico, to the east and Phoenix to the northwest. North/south Interstate 19 provides access to the city of Nogales and Mexico to the south, while State Highway 77 provides access to the Oro Valley to the north. The subject market is served by a variety of additional local highways, which are illustrated on the map. Primary vehicular access to the subject site will be provided by Broadway Boulevard. Access will also be available from Granada Avenue. The subject site is located at a busy intersection and is relatively simple to locate from Interstate 10, which is the nearest major highway. The proposed subject hotel is anticipated to have adequate signage at the street, as well as on its façade. Overall, the subject site benefits from very good accessibility, and the proposed hotel is expected to enjoy very good visibility from within its local neighborhood.

April-2017 Description of the Site and Neighborhood Hotel Arizona – Tucson, Arizona 22
The proposed subject hotel will be served by the Tucson International Airport, which is located approximately six miles to the southwest of the subject site. The Sun Link light-rail system began service in July 2014. The $196-million streetcar system traverses four miles through Tucson, connecting the Banner - University Medical Center Tucson, the University of Arizona campus, and Downtown Tucson. The Sun Link Streetcar is the Tucson area's largest construction project to date, creating 500 construction jobs in addition to 1,500 long-term positions. The closest Sun Link rail stop to the subject site is the Broadway Boulevard and Granada Avenue Station, one block to the west. The neighborhood surrounding a lodging facility often has an impact on a hotel's status, image, class, style of operation, and sometimes its ability to attract and properly serve a particular market segment. This section of the report investigates the subject neighborhood and evaluates any pertinent location factors that could affect its future occupancy, average rate, and overall profitability. The neighborhood that surrounds the subject site is generally defined by West 6th Street to the north, East Toole Avenue and State Route 210 to the east, West Cushing Street/East 14th Street to the south, and Interstate 10 to the west. The neighborhood is characterized by restaurants, office buildings, and retail shopping centers along the primary thoroughfares, with residential areas located along the secondary roadways. Some specific businesses and entities in the area include United States, Pima County, and City of Tucson government offices; National Bank of Arizona; and Caterpillar. Hotels in the vicinity include the small boutique-like Congress Hotel and the soon-to-open AC Hotel by Marriott, while restaurants located near the subject site include Christy's Corner Cafe, Nook, and Bruegger's Bagels; the proximity of these restaurants is considered supportive of the operation of a full-service convention lodging property. In general, this neighborhood is in the growth stage of its life cycle. The 2014 opening of the Sun Link light-rail system has attracted numerous commercial investments to Downtown in recent years, including the 130-room AC Hotel by Marriott, which is under construction and set to open in July 2017. Furthermore, Downtown Tucson's revitalization has attracted large commercial users to the Downtown core; in 2016, Caterpillar began the process of relocating employees to its new regional headquarters in Downtown Tucson.
Airport and Metrorail Access
Neighborhood

April-2017 Description of the Site and Neighborhood Hotel Arizona – Tucson, Arizona 23
MAP OF NEIGHBORHOOD
The proposed subject hotel's opening should be a positive influence on the area; the hotel will be in character with and will complement surrounding land uses. Overall, the supportive nature of the development in the immediate area is considered appropriate for and conducive to the operation of a hotel. The subject site is located near the area's primary generators of lodging demand. A sample of these demand generators is reflected on the following map, including respective distances from and drive times to the subject site. Overall, the subject site is well situated with respect to demand generators.
Proximity to Local Demand Generators and Attractions

April-2017 Description of the Site and Neighborhood Hotel Arizona – Tucson, Arizona 24
ACCESS TO DEMAND GENERATORS AND ATTRACTIONS

April-2017 Description of the Site and Neighborhood Hotel Arizona – Tucson, Arizona 25
The subject site will reportedly be served by all necessary utilities. Geological and soil reports were not provided to us or made available for our review during the preparation of this report. We are not qualified to evaluate soil conditions other than by a visual inspection of the surface; no extraordinary conditions were apparent. We were not informed of any site-specific nuisances or hazards, and there were no visible signs of toxic ground contaminants at the time of our inspection. Because we are not experts in this field, we do not warrant the absence of hazardous waste and urge the reader to obtain an independent analysis of these factors. According to the Federal Emergency Management Agency map illustrated below, the subject site is located in X.
Utilities
Soil and Subsoil Conditions
Nuisances and Hazards
Flood Zone

April-2017 Description of the Site and Neighborhood Hotel Arizona – Tucson, Arizona 26
COPY OF FLOOD MAP AND COVER
The flood zone definition for the X designation is as follows: areas outside the 500-year flood plain; areas of the 500-year flood; areas of the 100-year flood with

April-2017 Description of the Site and Neighborhood Hotel Arizona – Tucson, Arizona 27
average depths of less than one foot or with drainage areas less than one square mile and areas protected by levees from the 100-year flood. According to the local planning office, the subject property is zoned as follows: OCR-2 - Office/Commercial/Residential. Additional details pertaining to the proposed subject property’s zoning regulations are summarized in the following table.
FIGURE 2-2 ZONING
Municipa l i ty Governing Zoning City of Tucs on; Rio NuevoCurrent Zoning Office/Commercia l/ResidentialCurrent Use Vacant HotelIs Current Us e Permitted YesIs Change in Zoning Likely NoPermitted Us es YesHotel Al lowed YesLegal ly Non-Conforming Not Appl icable
We are not aware of any easements attached to the property that would significantly affect the utility of the site or marketability of this project. We have analyzed the issues of size, topography, access, visibility, and the availability of utilities. The subject site is favorably located along a well-traveled commercial corridor in Downtown Tucson, within walking distance of the Tucson Convention Center and numerous shopping, dining, and entertainment establishments. In general, the site should be well suited for future hotel use, with acceptable access, visibility, and topography for an effective operation.
Zoning
Easements and Encroachments
Conclusion

April-2017 Market Area Analysis Hotel Arizona – Tucson, Arizona 28
3. Market Area Analysis
The economic vitality of the market area and neighborhood surrounding the subject site is an important consideration in forecasting lodging demand and future income potential. Economic and demographic trends that reflect the amount of visitation provide a basis from which to project lodging demand. The purpose of the market area analysis is to review available economic and demographic data to determine whether the local market will undergo economic growth, stabilize, or decline. In addition to predicting the direction of the economy, the rate of change must be quantified. These trends are then correlated based on their propensity to reflect variations in lodging demand, with the objective of forecasting the amount of growth or decline in visitation by individual market segment (e.g., commercial, meeting and group, and leisure). The market area for a lodging facility is the geographical region where the sources of demand and the competitive supply are located. The subject site is located in the city of Tucson, the county of Pima, and the state of Arizona. Tucson is a resort area, an educational and copper center, a cotton and cattle market, headquarters for the Coronado National Forest, home to the University of Arizona, and a place of business for several large industries. Known for its dry and sunny climate, Tucson is gaining a new reputation for high culture and high technology. The city's shops, restaurants, resorts, and points of interest are varied and numerous. Tucson is the primary seat of Pima County, Arizona located 115 miles southeast of Phoenix and 60 miles north of the U.S.-Mexico border. It is the largest city in southern Arizona and the second largest in the state. Much of Tucson’s economic development has been centered on the development of the University of Arizona. A cornerstone of Tucson is Davis-Monthan Air Force Base, which creates a collaborative environment for military-technology companies. Furthermore, the Sun Link light-rail system began service in July 2014. The $196-million streetcar system traverses four miles through Tucson, connecting the Banner - University Medical Center Tucson, the University of Arizona campus, and Downtown Tucson. The Sun Link Streetcar is the Tucson area's largest construction project to date, creating 500 construction jobs in addition to 1,500 long-term positions.
Market Area Definition

April-2017 Market Area Analysis Hotel Arizona – Tucson, Arizona 29
TUCSON
The proposed subject property’s market area can be defined by its Combined Statistical Area (CSA): Tucson-Nogales, AZ. The CSA represents adjacent metropolitan and micropolitan statistical areas that have a moderate degree of employment interchange. Micropolitan statistical areas represent urban areas in the United States based around a core city or town with a population of 10,000 to 49,999; the MSA requires the presence of a core city of at least 50,000 people and a total population of at least 100,000 (75,000 in New England). The following exhibit illustrates the market area.

April-2017 Market Area Analysis Hotel Arizona – Tucson, Arizona 30
MAP OF MARKET AREA
A primary source of economic and demographic statistics used in this analysis is the Complete Economic and Demographic Data Source published by Woods & Poole Economics, Inc.—a well-regarded forecasting service based in Washington, D.C. Using a database containing more than 900 variables for each county in the nation, Woods & Poole employs a sophisticated regional model to forecast economic and demographic trends. Historical statistics are based on census data and information published by the Bureau of Economic Analysis. Projections are formulated by Woods & Poole, and all dollar amounts have been adjusted for inflation, thus reflecting real change. These data are summarized in the following table.
Economic and Demographic Review

April-2017 Market Area Analysis Hotel Arizona – Tucson, Arizona 31
FIGURE 3-1 ECONOMIC AND DEMOGRAPHIC DATA SUMMARY
Average AnnualCompounded Change
2000 2010 2016 2020 2000-10 2010-16 2016-20
Resident Population (Thousands)Pima County 848.0 981.9 1,029.1 1,081.8 1.5 % 0.8 % 1.3 %Tucson, AZ MSA 848.0 981.9 1,029.1 1,081.8 1.5 0.8 1.3Tucson-Nogales , AZ CSA 886.6 1,029.3 1,077.3 1,133.0 1.5 0.8 1.3State of Ari zona 5,160.6 6,412.0 6,948.7 7,415.5 2.2 1.3 1.6United States 282,162.4 309,347.1 324,506.9 336,690.4 0.9 0.8 0.9
Per-Capita Personal Income*Pima County $30,165 $33,062 $34,998 $37,197 0.9 1.0 1.5Tucson, AZ MSA 30,165 33,062 34,998 37,197 0.9 1.0 1.5Tucson-Nogales , AZ CSA 29,767 32,760 34,714 36,886 1.0 1.0 1.5State of Ari zona 31,942 33,629 35,985 38,485 0.5 1.1 1.7United States 36,812 39,622 43,613 46,375 0.7 1.6 1.5
W&P Wealth IndexPima County 87.1 85.4 83.0 82.9 (0.2) (0.5) (0.0)Tucson, AZ MSA 87.1 85.4 83.0 82.9 (0.2) (0.5) (0.0)Tucson-Nogales , AZ CSA 86.2 84.7 82.4 82.3 (0.2) (0.5) (0.0)State of Ari zona 90.2 86.2 84.2 84.6 (0.5) (0.4) 0.1United States 100.0 100.0 100.0 100.0 0.0 0.0 0.0
Food and Beverage Sales (Millions)*Pima County $1,069 $1,314 $1,612 $1,750 2.1 3.5 2.1Tucson, AZ MSA 1,069 1,314 1,612 1,750 2.1 3.5 2.1Tucson-Nogales , AZ CSA 1,112 1,355 1,658 1,800 2.0 3.4 2.1State of Ari zona 6,682 8,764 10,897 11,984 2.7 3.7 2.4United States 368,829 447,728 562,999 602,635 2.0 3.9 1.7
Total Retail Sales (Millions)*Pima County $11,066 $11,771 $13,163 $14,248 0.6 1.9 2.0Tucson, AZ MSA 11,066 11,771 13,163 14,248 0.6 1.9 2.0Tucson-Nogales , AZ CSA 11,602 12,332 13,705 14,842 0.6 1.8 2.0State of Ari zona 71,246 85,453 99,155 109,013 1.8 2.5 2.4United States 3,902,830 4,130,414 4,846,834 5,181,433 0.6 2.7 1.7
* Inflation AdjustedSource: Woods & Poole Economics , Inc.

April-2017 Market Area Analysis Hotel Arizona – Tucson, Arizona 32
The U.S. population has grown at an average annual compounded rate of 0.8% from 2010 through 2016. The county’s population has grown more slowly than the nation’s population; the average annual growth rate of 0.8% between 2010 and 2016 reflects a gradually expanding area. Following this population trend, per-capita personal income increased slowly, at 1.0% on average annually for the county between 2010 and 2016. Local wealth indexes have remained stable in recent years, registering a relatively modest 83.0 level for the county in 2016. Food and beverage sales totaled $1,612 million in the county in 2016, versus $1,314 million in 2010. This reflects a 3.5% average annual change, which is stronger than the 2.1% pace recorded in the prior decade, the latter years of which were adversely affected by the recession. Over the long term, the pace of growth is forecast to moderate to a more sustainable level of 2.1%, which is forecast through 2020. The retail sales sector demonstrated an annual increase of 0.6% registered in the decade 2000 to 2010, followed by an increase of 1.9% in the period 2010 to 2016. An increase of 2.0% average annual change is expected in county retail sales through 2020. The characteristics of an area's workforce provide an indication of the type and amount of transient visitation likely to be generated by local businesses. Sectors such as finance, insurance, and real estate (FIRE); wholesale trade; and services produce a considerable number of visitors who are not particularly rate-sensitive. The government sector often generates transient room nights, but per-diem reimbursement allowances often limit the accommodations selection to budget and mid-priced lodging facilities. Contributions from manufacturing, construction, transportation, communications, and public utilities (TCPU) employers can also be important, depending on the company type. The following table sets forth the county workforce distribution by business sector in 2000, 2010, and 2016, as well as a forecast for 2020.
Workforce Characteristics

April-2017 Market Area Analysis Hotel Arizona – Tucson, Arizona 33
FIGURE 3-2 HISTORICAL AND PROJECTED EMPLOYMENT (000S)
Average AnnualCompounded Change
Percent Percent Percent PercentIndustry 2000 of Total 2010 of Total 2016 of Total 2020 of Total
Farm 1.0 0.2 % 1.2 0.2 % 1.4 0.3 % 1.4 0.3 % 1.6 % 2.6 % 0.9 %Fores try, Fi shing, Related Activi ties And Other 0.4 0.1 0.4 0.1 0.4 0.1 0.4 0.1 (0.7) (0.4) 1.0Mining 2.4 0.5 3.3 0.7 5.0 1.0 5.1 0.9 3.2 7.1 0.9Uti l i ties 1.6 0.4 2.1 0.4 2.0 0.4 2.1 0.4 3.1 (0.6) 1.3Construction 28.5 6.4 22.5 4.6 23.9 4.6 26.2 4.7 (2.3) 1.1 2.3Manufacturing 35.1 7.9 26.0 5.4 25.6 4.9 26.6 4.8 (3.0) (0.2) 1.0Total Trade 58.0 13.1 59.6 12.3 65.2 12.6 70.1 12.6 0.3 1.5 1.8 Wholes ale Trade 8.6 1.9 9.8 2.0 9.8 1.9 10.4 1.9 1.4 0.0 1.4 Reta i l Trade 49.4 11.2 49.7 10.3 55.4 10.7 59.7 10.8 0.1 1.8 1.9Trans portation And Warehousing 9.1 2.1 9.2 1.9 11.4 2.2 11.7 2.1 0.2 3.5 0.7Information 9.2 2.1 5.9 1.2 6.1 1.2 6.5 1.2 (4.3) 0.5 1.3Finance And Ins urance 14.4 3.3 22.4 4.6 22.8 4.4 25.2 4.6 4.5 0.3 2.6Real Estate And Rental And Leas e 21.3 4.8 28.0 5.8 28.7 5.5 31.3 5.6 2.8 0.4 2.1Total Services 181.7 41.0 213.9 44.2 234.7 45.2 250.9 45.2 1.6 1.6 1.7
Profess ional And Technica l Services 25.9 5.8 33.1 6.8 34.2 6.6 36.1 6.5 2.5 0.5 1.4Management Of Companies And Enterprises 2.7 0.6 2.9 0.6 2.8 0.5 2.9 0.5 0.6 (0.6) 0.8Administrative And Waste Services 33.3 7.5 34.4 7.1 39.1 7.5 41.4 7.5 0.3 2.2 1.4Educational Services 4.3 1.0 7.6 1.6 9.7 1.9 11.1 2.0 5.8 4.2 3.3Health Care And Socia l Ass istance 44.9 10.1 62.7 12.9 67.1 12.9 73.6 13.3 3.4 1.2 2.3Arts , Enterta inment, And Recreation 10.9 2.5 11.1 2.3 11.7 2.3 12.3 2.2 0.1 0.9 1.2Accommodation And Food Services 34.8 7.9 35.9 7.4 40.1 7.7 42.2 7.6 0.3 1.9 1.3Other Services , Except Publ ic Administration 24.8 5.6 26.2 5.4 29.8 5.7 31.3 5.6 0.5 2.2 1.2
Total Government 80.1 18.1 89.6 18.5 91.8 17.7 97.2 17.5 1.1 0.4 1.5 Federal Civi l ian Government 9.2 2.1 12.8 2.6 12.9 2.5 13.7 2.5 3.4 0.1 1.5 Federal Mi l i tary 7.6 1.7 8.7 1.8 8.4 1.6 8.4 1.5 1.2 (0.4) 0.1 State And Local Government 63.3 14.3 68.1 14.1 70.5 13.6 75.1 13.5 0.7 0.6 1.6
TOTAL 442.9 100.0 % 484.0 100.0 % 519.0 100.0 % 554.8 100.0 % 0.9 % 1.2 % 1.7 %
MSA 442.9 — 484.0 — 519.0 — 554.8 — 0.9 % 1.2 % 1.7 %U.S. 165,370.9 — 173,034.7 — 191,870.8 — 203,418.4 — 0.9 1.7 1.5
Source: Woods & Poole Economics , Inc.
2000-2010 2010-2016 2016-2020

April-2017 Market Area Analysis Hotel Arizona – Tucson, Arizona 34
Woods & Poole Economics, Inc. reports that during the period from 2000 to 2010, total employment in the county grew at an average annual rate of 0.9%. This trend was on par with the growth rate recorded by the MSA and also lagged the national average. More recently, the pace of total employment growth in the county accelerated to 1.2% on an annual average from 2010 to 2016, reflecting the initial years of the recovery. Of the primary employment sectors, Total Services recorded the highest increase in number of employees during the period from 2010 to 2016, increasing by 20,794 people, or 9.7%, and rising from 44.2% to 45.2% of total employment. Of the various service sub-sectors, Health Care And Social Assistance and Accommodation And Food Services were the largest employers. Strong growth was also recorded in the Total Trade sector, as well as the Total Government sector, which expanded by 9.5% and -1.4%, respectively, in the period 2010 to 2016. Forecasts developed by Woods & Poole Economics, Inc. anticipate that total employment in the county will change by 1.7% on average annually through 2020. The trend is above the forecast rate of change for the U.S. as a whole during the same period. The following table reflects radial demographic trends for our market area measured by three points of distance from the subject site.
Radial Demographic Snapshot

April-2017 Market Area Analysis Hotel Arizona – Tucson, Arizona 35
FIGURE 3-3 DEMOGRAPHICS BY RADIUS
Population2022 Projection 12,244 110,504 282,2542017 Es timate 11,982 108,475 277,3562010 Census 11,681 106,470 275,2092000 Census 10,430 99,661 264,969
Growth 2017 - 2022 2.2% 1.9% 1.8%Growth 2010 - 2017 2.6% 1.9% 0.8%Growth 2000 - 2010 12.0% 6.8% 3.9%
Households2022 Projection 5,697 42,477 114,8792017 Es timate 5,546 41,324 111,9652010 Census 5,413 40,277 109,6762000 Census 4,917 37,662 106,603
Growth 2017 - 2022 2.7% 2.8% 2.6%Growth 2010 - 2017 2.5% 2.6% 2.1%Growth 2000 - 2010 10.1% 6.9% 2.9%
Income2017 Es t. Average Hous ehold Income $45,031 $43,739 $45,4612017 Es t. Median Household Income 27,979 28,930 31,500
2017 Est. Civ. Employed Pop 16+ by Occupation 5,496 45,679 117,483Archi tect/Engineer 59 612 1,838Arts /Enterta inment/Sports 204 1,187 2,558Bui lding Grounds Maintenance 285 3,001 8,044Business/Financia l Operations 107 1,049 2,879Community/Socia l Services 145 772 2,017Computer/Mathematica l 157 905 2,265Cons truction/Extraction 232 2,681 7,489Education/Tra ining/Library 618 3,908 8,176Farming/Fishing/Fores try 13 41 174Food Prep/Serving 753 5,111 11,522Health Practi tioner/Technician 308 1,875 5,137Heal thcare Support 41 1,056 3,291Maintenance Repa ir 118 1,158 3,492Lega l 67 426 874Li fe/Phys ica l/Socia l Science 170 1,167 2,180Management 474 2,564 6,876Office/Admin. Support 666 5,773 16,009Production 124 1,713 4,801Protective Services 99 1,305 3,038Sa les /Related 479 5,128 13,071Persona l Care/Service 178 2,179 5,675Trans portation/Moving 200 2,067 6,077
0.00 - 1.00 miles 0.00 - 3.00 miles 0.00 - 5.00 miles
Source: The Nielsen Company

April-2017 Market Area Analysis Hotel Arizona – Tucson, Arizona 36
This source reports a population of 277,356 within a five-mile radius of the subject site, and 111,965 households within this same radius. Average household income within a five-mile radius of the subject site is currently reported at $45,461, while the median is $31,500. The following table illustrates historical and projected employment, households, population and average household income data as provided by REIS for the overall Tucson market.

April-2017 Market Area Analysis Hotel Arizona – Tucson, Arizona 37
FIGURE 3-4 HISTORICAL & PROJECTED EMPLOYMENT, HOUSEHOLDS, POPULATION, AND HOUSEHOLD INCOME STATISTICS
Year
2004 362,770 — 111,493 — 42,346 — 374,950 — 910,510 — $71,098 — 2005 371,030 2.3 % 113,590 1.9 % 43,285 2.2 % 384,310 2.5 % 930,980 2.2 % 76,022 6.9 %2006 383,270 3.3 119,472 5.2 42,585 (1.6) 387,880 0.9 948,930 1.9 81,729 7.52007 385,030 0.5 120,920 1.2 43,441 2.0 388,900 0.3 962,260 1.4 85,341 4.42008 375,970 (2.4) 118,459 (2.0) 41,683 (4.0) 390,480 0.4 972,110 1.0 86,417 1.32009 356,000 (5.3) 114,651 (3.2) 38,196 (8.4) 389,970 (0.1) 978,760 0.7 83,341 (3.6)2010 353,070 (0.8) 113,539 (1.0) 36,381 (4.8) 390,090 0.0 985,020 0.6 84,182 1.02011 357,470 1.2 114,739 1.1 36,157 (0.6) 393,800 1.0 990,680 0.6 86,166 2.42012 361,330 1.1 116,210 1.3 36,258 0.3 396,920 0.8 995,020 0.4 89,903 4.32013 363,670 0.6 116,683 0.4 35,668 (1.6) 400,880 1.0 1,000,640 0.6 89,741 (0.2)2014 366,300 0.7 117,579 0.8 35,271 (1.1) 404,990 1.0 1,007,590 0.7 93,718 4.42015 373,000 1.8 119,742 1.8 35,867 1.7 411,420 1.6 1,017,700 1.0 94,141 0.52016 379,070 1.6 121,587 1.5 36,583 2.0 418,510 1.7 1,033,210 1.5 96,829 2.9
Forecasts2017 388,990 2.6 % 124,334 2.3 % 37,006 1.2 % 426,090 1.8 % 1,048,500 1.5 % $100,465 3.8 %2018 399,520 2.7 127,231 2.3 37,899 2.4 433,930 1.8 1,063,610 1.4 104,675 4.22019 406,260 1.7 129,263 1.6 38,329 1.1 441,760 1.8 1,078,610 1.4 108,548 3.72020 407,620 0.3 129,784 0.4 38,169 (0.4) 449,410 1.7 1,093,710 1.4 111,710 2.92021 407,570 (0.0) 129,965 0.1 37,740 (1.1) 457,150 1.7 1,109,300 1.4 114,361 2.4
Average Annual Compound Change2004 - 2016 0.4 % 0.7 % (1.2) % 0.9 % 1.1 % 2.6 %2004 - 2007 2.0 2.7 0.9 1.2 1.9 6.32007 - 2010 (2.8) (2.1) (5.7) 0.1 0.8 (0.5)2010 - 2016 1.2 1.1 0.1 1.2 0.8 3.6
Forecast 2017 - 2021 1.2 % 1.1 % 0.5 % 1.8 % 1.4 % 3.3 %
% Chg% ChgOffice
EmploymentHousehold
Avg. Income % Chg
Source: REIS Report, 1st Quarter, 2017
Households % Chg PopulationIndustrial
Employment % ChgTotal
Employment % Chg

April-2017 Market Area Analysis Hotel Arizona – Tucson, Arizona 38
For the Tucson market, of the roughly 400,000 persons employed, 32% are categorized as office employees, while 10% are categorized as industrial employees. Total employment decreased by an average annual compound rate of -2.8% during the recession of 2008 to 2011, followed by an increase of 1.2% from 2011 to 2016. By comparison, office employment reflected compound change rates of -2.1% and 1.1%, during the same respective periods. Total employment is expected to expand by 2.6% in 2017, while office employment is forecast to expand by 2.3% in 2017. From 2016 through 2021, REIS anticipates that total employment will expand at an average annual compound rate of 1.2%, while office employment will expand by 1.1% on average annually during the same period. The number of households is forecast to expand by 1.8% on average annually between 2016 and 2021. Population is forecast to expand during this same period, at an average annual compounded rate of 1.4%. Household average income is forecast to grow by 3.3% on average annually from 2016 through 2021. The following table reflects radial demographic trends for our market area measured by three points of distance from the subject site.
Radial Demographic Snapshot

April-2017 Market Area Analysis Hotel Arizona – Tucson, Arizona 39
FIGURE 3-5 DEMOGRAPHICS BY RADIUS
Population2022 Projection 12,244 110,504 282,2542017 Es ti mate 11,982 108,475 277,3562010 Census 11,681 106,470 275,2092000 Census 10,430 99,661 264,969
Growth 2017 - 2022 2.2% 1.9% 1.8%Growth 2010 - 2017 2.6% 1.9% 0.8%Growth 2000 - 2010 12.0% 6.8% 3.9%
Households2022 Projection 5,697 42,477 114,8792017 Es ti mate 5,546 41,324 111,9652010 Census 5,413 40,277 109,6762000 Census 4,917 37,662 106,603
Growth 2017 - 2022 2.7% 2.8% 2.6%Growth 2010 - 2017 2.5% 2.6% 2.1%Growth 2000 - 2010 10.1% 6.9% 2.9%
Income2017 Es t. Average Househol d Income $45,031 $43,739 $45,4612017 Es t. Median Househol d Income 27,979 28,930 31,500
2017 Est. Civ. Employed Pop 16+ by Occupation 5,496 45,679 117,483Archi tect/Engineer 59 612 1,838Arts/Entertainment/Sports 204 1,187 2,558Bui lding Grounds Maintenance 285 3,001 8,044Business /Financi al Operati ons 107 1,049 2,879Community/Socia l Servi ces 145 772 2,017Computer/Mathemati ca l 157 905 2,265Cons truction/Extraction 232 2,681 7,489Education/Tra ining/Library 618 3,908 8,176Farming/Fi shing/Forestry 13 41 174Food Prep/Serving 753 5,111 11,522Heal th Practi tioner/Technician 308 1,875 5,137Heal thcare Support 41 1,056 3,291Maintenance Repa ir 118 1,158 3,492Lega l 67 426 874Life/Phys ical/Socia l Sci ence 170 1,167 2,180Management 474 2,564 6,876Office/Admin. Support 666 5,773 16,009Production 124 1,713 4,801Protective Servi ces 99 1,305 3,038Sal es /Related 479 5,128 13,071Personal Care/Servi ce 178 2,179 5,675Trans portation/Moving 200 2,067 6,077
0.00 - 1.00 miles 0.00 - 3.00 miles 0.00 - 5.00 miles
Source: The Ni el sen Company

April-2017 Market Area Analysis Hotel Arizona – Tucson, Arizona 40
This source reports a population of 277,356 within a five-mile radius of the subject site, and 111,965 households within this same radius. Average household income within a five-mile radius of the subject site is currently reported at $45,461, while the median is $31,500. The following table presents historical unemployment rates for the proposed subject hotel’s market area. FIGURE 3-6 UNEMPLOYMENT STATISTICS
Year
2007 3.7 % 3.7 % 3.9 % 4.6 %2008 5.8 5.8 6.2 5.82009 9.1 9.1 9.9 9.32010 9.3(r) 9.3(r) 10.4 9.62011 8.5(r) 8.5(r) 9.5 8.92012 7.4(r) 7.4(r) 8.3(d) 8.12013 6.8(r) 6.8(r) 7.7(d) 7.42014 6.0(r) 6.0(r) 6.8(d) 6.22015 5.4(r) 5.4(r) 6.0(d) 5.32016 4.9(r) 4.9(r) 5.3(d) 4.9
Recent Month - Feb2016 4.9 % 4.9 % 5.3 % 4.9 %2017 4.7 4.7 5.0 4.7
* Letters shown next to data points (i f any) reflect revised population controls and/or model re-estimation implemented by the BLS.
Source: U.S. Bureau of Labor Stati s tics
U.S.StateCounty MSA
After the U.S. unemployment rate declined to an annual average of 4.6% in 2006 and 2007, the Great Recession, which spanned December 2007 through June 2009, resulted in heightened unemployment rates. The unemployment rate peaked at 10.0% in October 2009, after which job growth resumed; the national unemployment rate has steadily declined since 2010. Total nonfarm payroll employment increased by 216,000, 219,000, and 98,000 jobs in January, February, and March, respectively. The strongest gains in March were recorded in the professional and business services and mining sectors. The national unemployment rate remains low, at 4.8% in January, 4.7% in February, and 4.5% in March; it has remained near the 5.0% mark since August 2015, reflecting a trend of relative stability and the overall strength of the U.S. economy.
Unemployment Statistics

April-2017 Market Area Analysis Hotel Arizona – Tucson, Arizona 41
Locally, the unemployment rate was 4.9(r)% in 2016; for this same area in 2017, the most recent month’s unemployment rate was registered at 4.7%, versus 4.9% for the same month in 2016. Unemployment began to rise in 2008 as the region entered an economic slowdown, and this trend continued through 2010 as the height of the national recession took hold. However, unemployment declined in 2011 as the economy rebounded, a trend that continued through 2016. The most recent comparative period illustrates continued improvement, indicated by the lower unemployment rate in the latest available data. Local officials noted that the Tucson metro area is finally gaining economic momentum, and job growth is expected to increase at a faster pace 2017 and 2018. Most new jobs during the next few years are expected to be in the education and health services sector, the leisure and hospitality industry, and the professional and business services, as well as trade, transportation, and utilities. These positive projections are supported by recent expansions at Raytheon Missile Systems and Caterpillar. Providing additional context for understanding the nature of the regional economy, the following table presents a list of the major employers in the subject property’s market. FIGURE 3-7 MAJOR EMPLOYERS
Number ofRank Firm Employees
1 Univers i ty of Arizona 11,2512 Raytheon Miss i le Systems 9,6003 State of Arizona 8,5804 Davis -Monthan Ai r Force Base 8,4065 Pima County 7,0236 Tucson Uni fied School Dis trict 6,7707 Banner Heal th 6,2728 U.S. Customs and Border Protection 5,7399 Freeport-McMoRan, Inc. 5,53010 Wal-Mart Stores , Inc. 5,500
Source: Pima County Comprehens ive Report, 2016
The following bullet points highlight major demand generators for this market: • The City of Tucson, Pima County, the State of Arizona, and the private sector
have each made commitments to create a growing, healthy economy and to support high-tech industries. Advanced technology companies like Raytheon Missile Systems (RMS), Texas Instruments, IBM, and Universal Avionics all have
Major Business and Industry

April-2017 Market Area Analysis Hotel Arizona – Tucson, Arizona 42
a significant presence in Tucson. About 150 Tucson companies are in the optics industry, earning Tucson the nickname "Optics Valley." RMS began in Tucson in 1951. Through the defense industry consolidation in the 1990s, the business has grown to offer a wide array of missile systems designed, developed, and produced for the U.S. military services and the allied forces of more than 80 countries. In 2016, Raytheon was awarded a $291-million missile contract from the U.S. Navy. Furthermore, State and County officials broke ground on a new access road near the Tucson International Airport in 2015, which will keep RMS from moving almost 10,000 jobs to Alabama. The $12.7-million Aerospace Parkway will extend five miles between Nogales Highway and Alvernon Way, providing RMS with a bigger buffer from urban development and leaving space for future expansion. It also will allow for other high-tech companies, including Raytheon suppliers, to locate along Aerospace Parkway. Funding for the second phase, a two-lane road connecting Aerospace Parkway and Interstate 10 at Rita Road, is still in the early stages of planning.
• Much of Tucson's economic development has been centered on the development of the University of Arizona, which is currently the second-largest employer in the city. The University of Arizona (UA) was the first university in the state of Arizona, founded in 1885 when Arizona was still a territory, and the institution is considered a Public Ivy. The University of Arizona produces more than $530 million in annual research and is the state's only member of the prestigious Association of American Universities. In January 2015, the Arizona Board of Regents approved a $1-billion merger between Banner Health and the University of Arizona Health Network. Once the merger is complete, Banner Heath committed to spend more than $950 million to buy hospital land, build new clinical sites, and support the UA's medical education programs and faculty recruitment. Furthermore, a recent study indicated that the University of Arizona Science and Technology Park (UA Tech Park) has an annual economic impact of $2.3 billion on Pima County's economy. As one of the largest employment centers in the region, the UA Tech Park includes 45 companies and organizations, including IBM, Raytheon, Citigroup, and United Health, employing nearly 6,500 workers.
• Davis-Monthan Air Force Base (DM), located on the southeastern edge of the city, provides many jobs for Tucson residents. Davis-Monthan, which became a military base in 1925, is a key Air Combat Command installation. Its presence, as well as the presence of a U.S. Army Intelligence Center (Fort Huachuca, the largest employer in the region in nearby Sierra Vista), has led to the development of a significant number of high-tech industries, including government contractors, in the area. In 2015, the Department of Defense announced that the A-10 Thunderbolt fighter jet would be retired, which is considered a fixture for DM; the decision is a result of a series of recent cuts to the defense budget. Nonetheless, the Air Force is expected to vastly expand its

April-2017 Market Area Analysis Hotel Arizona – Tucson, Arizona 43
drone program over the next five years by creating five new drone centers. Davis-Monthan Air Force Base is mentioned as a possible site for the expanded drone program. The five new drone operations centers would cost about $1.5 billion to build and are expected to require 400 to 500 pilots and crew personnel at each base.
Although the area's economy is diversified across a multitude of sectors, including a number of healthcare and medical research businesses, the Tucson area has been negatively affected by the loss of Major League Baseball spring training, previous controversy over the state's immigration law, decreasing number of citywide events, the most recent national recession, and the recent sequester. However, local officials have tried to mitigate the impact of Major League Baseball's departure by attracting Major League Soccer spring training to the Tucson area, along with an increased number of amateur, college, and high school softball and soccer tournaments. Moreover, ongoing infrastructure improvements near Raytheon, the ongoing merger of Banner Health and the University of Arizona Health Network, and the recent announcement of Caterpillar's regional headquarters' move to Downtown Tucson bode well for future economic growth in the region. Our interviews with local tourism officials and hotel representatives revealed that the market is beginning to show signs of recovery, albeit at a slower pace than expected; however, marketing campaigns such as "Vamos a Tucson" and "Free Yourself" have been successfully launched in Mexico and the United States. Trends in occupied office space are typically among the most reliable indicators of lodging demand, as firms that occupy office space often exhibit a strong propensity to attract commercial visitors. Thus, trends that cause changes in vacancy rates or occupied office space may have a proportional impact on commercial lodging demand and a less direct effect on meeting demand. The following table details office space statistics for the pertinent market area.
FIGURE 3-8 OFFICE SPACE STATISTICS – MARKET OVERVIEW
Submarket
1 Easts ide 62 2,384,000 1,957,300 17.9 % $21.992 Northwest 78 1,701,000 1,471,400 13.5 22.313 Downtown 17 1,122,000 884,100 21.2 21.504 Central 26 442,000 335,000 24.2 17.90
Totals and Averages 183 5,649,000 4,647,800 17.7 % $21.67
Inventory Occupied Office Space
Vacancy Rate
Average Asking Lease RateBuildings Square Feet
Source: REIS Report, 1st Quarter, 2017
Office Space Statistics

April-2017 Market Area Analysis Hotel Arizona – Tucson, Arizona 44
The greater Tucson market comprises a total of 5.6 million square feet of office space. For the 1st Quarter of 2017, the market reported a vacancy rate of 17.7% and an average asking rent of $21.67. The subject property is located in the Downtown submarket, which houses 1,122,000 square feet of office space. The submarket's vacancy rate of 21.2% is above the overall market average. The average asking lease rate of $21.50 is on par with the average for the broader market. The following table illustrates a trend of office space statistics for the overall Tucson market and the Downtown submarket.

April-2017 Market Area Analysis Hotel Arizona – Tucson, Arizona 45
FIGURE 3-9 HISTORICAL AND PROJECTED OFFICE SPACE STATISTICS – GREATER MARKET VS. SUBMARKET
Year
2004 5,847,000 — 5,029,000 — 14.0 % $19.42 — 1,572,000 — 1,342,000 — 14.6 % $19.00 — 2005 5,823,000 (0.4) % 5,228,000 4.0 % 10.2 19.88 2.4 % 1,572,000 0.0 % 1,357,000 1.1 % 13.7 19.55 2.9 %2006 5,772,000 (0.9) 5,162,000 (1.3) 10.6 20.67 4.0 1,389,000 (11.6) 1,172,000 (13.6) 15.6 19.92 1.92007 5,700,000 (1.2) 5,094,000 (1.3) 10.6 21.49 4.0 1,291,000 (7.1) 1,103,000 (5.9) 14.6 20.87 4.82008 5,740,000 0.7 5,031,000 (1.2) 12.4 21.79 1.4 1,291,000 0.0 1,117,000 1.3 13.5 21.36 2.32009 5,814,000 1.3 4,968,000 (1.3) 14.6 21.75 (0.2) 1,291,000 0.0 1,119,000 0.2 13.3 21.44 0.42010 5,814,000 0.0 4,945,000 (0.5) 14.9 21.21 (2.5) 1,291,000 0.0 1,062,000 (5.1) 17.7 20.63 (3.8)2011 5,814,000 0.0 4,925,000 (0.4) 15.3 21.50 1.4 1,291,000 0.0 1,024,000 (3.6) 20.7 20.84 1.02012 5,814,000 0.0 4,911,000 (0.3) 15.5 21.38 (0.6) 1,291,000 0.0 985,000 (3.8) 23.7 20.89 0.22013 5,840,000 0.4 4,886,000 (0.5) 16.3 21.35 (0.1) 1,317,000 2.0 988,000 0.3 25.0 21.05 0.82014 5,840,000 0.0 4,809,000 (1.6) 17.7 21.42 0.3 1,317,000 0.0 997,000 0.9 24.3 21.34 1.42015 5,860,000 0.3 4,805,000 (0.1) 18.0 21.66 1.1 1,317,000 0.0 1,029,000 3.2 21.9 21.48 0.72016 5,649,000 (3.6) 4,647,000 (3.3) 17.7 21.67 0.0 1,122,000 (14.8) 884,000 (14.1) 21.2 21.50 0.1
Forecasts2017 5,649,000 0.0 % 4,747,000 2.2 % 16.0 % $21.93 1.2 % 1,122,000 0.0 % 903,000 2.1 % 19.6 % $21.99 2.3 %2018 5,694,000 0.8 4,843,000 2.0 14.9 22.37 2.0 1,132,000 0.9 925,000 2.4 18.3 22.71 3.32019 5,759,000 1.1 4,964,000 2.5 13.8 22.99 2.8 1,146,000 1.2 953,000 3.0 16.9 23.60 3.92020 5,831,000 1.3 5,121,000 3.2 12.2 23.52 2.3 1,161,000 1.3 990,000 3.9 14.7 24.45 3.62021 5,903,000 1.2 5,272,000 2.9 10.7 24.13 2.6 1,175,000 1.2 1,026,000 3.6 12.7 25.38 3.8
Average Annual Compound Change2004 - 2016 (0.3) % (0.7) % 0.9 % (2.8) % (3.4) % 1.0 %2004 - 2007 (0.8) 0.4 3.4 (6.4) (6.3) 3.22007 - 2010 0.7 (1.0) (0.4) (0.0) (1.3) (0.4)2010 - 2016 (0.5) (1.0) 0.4 (2.3) (3.0) 0.7
Forecast 2017 - 2021 1.1 % 2.1 % 2.4 % 1.2 % 3.2 % 3.6 %
Tucson Market Downtown SubmarketAvailable
Office Space % ChgOccupied
Office Space % ChgAsking
Lease Rate % ChgAvailable
Office Space % ChgOccupied
Office Space
Source: REIS Report, 1st Quarter, 2017
% ChgVacancy
RateAsking
Lease Rate % ChgVacancy
Rate

April-2017 Market Area Analysis Hotel Arizona – Tucson, Arizona 46
The inventory of office space in the Tucson market contracted at an average annual compound rate of -0.3% from 2004 through 2016, while occupied office space contracted at an average annual rate of -0.7% over the same period. During the period of 2004 through 2008, occupied office space expanded at an average annual compound rate of 0.4%. From 2008 through 2011, occupied office space contracted at an average annual compound rate of -1.0%, reflecting the impact of the recession. The continued market contraction is reflected in the -1.0% average annual change in occupied office space from 2011 to 2016. From 2016 through 2021, the inventory of occupied office space is forecast to increase at an average annual compound rate of 2.1%, with available office space expected to increase 1.1%, thus resulting in an anticipated vacancy rate of 10.7% as of 2021. Tucson is a mid-sized city, which is primarily driven by major entities in government, military, and higher technology, as well as a state university. According to REIS, the greater Tucson market offers over 5.6 million square feet of Class A and B office space, with only 442,000 square feet located in the Downtown submarket due to the region's sprawling nature. The Downtown office submarket realized minimal increases in both demand and average lease rate in 2016, with modest improvements expected over the near term. On a favorable note, Caterpillar’s decision to locate its headquarters in Downtown Tucson will bring 600 jobs to the city. REIS expects the firm’s 200,000-square-foot office facility to break ground in January 2018. A convention center serves as a gauge of visitation trends to a particular market. Convention centers also generate significant levels of demand for area hotels and serve as a focal point for community activity. Typically, hotels within the closest proximity to a convention center—up to three miles away—will benefit the most. Hotels serving as headquarters for an event benefit the most by way of premium rates and hosting related banquet events. During the largest of conventions, peripheral hotels may benefit from compression within the city as a whole.The Tucson Convention Center (TCC) is located in historic Downtown Tucson. The 205,000-square-foot center has three Exhibition Halls (A, B, and C) that can share a total space of 89,760 square feet. The North Exhibition Hall comprises 24,180 square feet. The 21,000-square-foot Grand Ballroom features tiered ceilings with elegant chandeliers, and the Grand Lobby offers 11,236 square feet of multipurpose space. The center's eight meeting rooms range in size from 700 to 1,800 square feet. A courtyard adds space for outdoor activities and leads to the adjacent Leo Rich Theatre and the Music Hall, both of which have large stages and support facilities. According to Convention and Visitors Bureau officials, the convention center is dated and in need of cosmetic upgrades; consequently, bookings and event attendance have reportedly suffered. In 2012, the Tucson Arena at the TCC underwent a $1-million renovation that included a new seating area in Section 100. In 2014 and 2015, an $8-million renovation included new seats, updated concession stands, and new sound and visual aids. Furthermore, the facility underwent a management change in 2014 when SMG overtook the day-to-day operations from
Convention Activity

April-2017 Market Area Analysis Hotel Arizona – Tucson, Arizona 47
the City of Tucson. The shift to a private management company was done in the hopes of reducing the City's costs and generating greater profits. CONVENTION CENTER
A more detailed analysis of the historical and projected performance of the Tucson Convention Center is located in the Induced Demand Analysis section of the addenda. Airport passenger counts are important indicators of lodging demand. Depending on the type of service provided by a particular airfield, a sizable percentage of arriving passengers may require hotel accommodations. Trends showing changes in passenger counts also reflect local business activity and the overall economic health of the area. Tucson International Airport (TUS) is serviced by several major commercial airlines; Southwest Airlines is the largest carrier serving the airport. In September 2012, a $19.5-million grant was awarded to the Tucson Airport Authority for the reconstruction of the main terminal apron. Additionally, a $5.7-million grant was awarded for the design and construction of a solar array over the main parking facility. In 2015, the City of Tucson began construction on its Terminal Renovation Improvement Project (TRIP), which is expected to improve passenger flow,
Airport Traffic

April-2017 Market Area Analysis Hotel Arizona – Tucson, Arizona 48
optimize space usage, and increase revenues for the airport. While there is no specific timetable for its completion, a number of projects will reportedly be completed in phases, totaling $18 million to $23 million in improvements. In 2014, the Federal Aviation Administration broke ground on a new $26-million air-traffic-control tower at TUS, which opened in late 2016. The following table illustrates recent operating statistics for the Tucson International Airport, which is the primary airport facility serving the proposed subject hotel’s submarket. FIGURE 3-10 AIRPORT STATISTICS - TUCSON INTERNATIONAL AIRPORT
Year
2007 4,429,905 — — 2008 4,225,869 (4.6) % (4.6) %2009 3,637,458 (13.9) (9.4)2010 3,740,675 2.8 (5.5)2011 3,658,199 (2.2) (4.7)2012 3,605,682 (1.4) (4.0)2013 3,237,319 (10.2) (5.1)2014 3,247,678 0.3 (4.3)2015 3,178,210 (2.1) (4.1)2016 3,283,243 3.3 (3.3)
Year-to-date, Mar2016 1,137,388 — — 2017 1,210,844 6.5 % —
*Annual average compounded percentage change from the previous year**Annual average compounded percentage change from fi rs t year of data
Change**Passenger
Change*TrafficPercent Percent
Source: Tucson International Airport

April-2017 Market Area Analysis Hotel Arizona – Tucson, Arizona 49
FIGURE 3-11 LOCAL PASSENGER TRAFFIC VS. NATIONAL TREND
-15%
-10%
-5%
0%
5%
10%
2008 2009 2010 2011 2012 2013 2014 2015 2016
Chan
ge in
Pass
enge
r Act
ivity
Source: HVS, Local Airport Authority
Local Passenger Volume National Passenger Volume
This facility recorded 3,283,243 passengers in 2016. The change in passenger traffic between 2015 and 2016 was 3.3%. The average annual change during the period shown was -3.3%. In May 2016, American Airlines announced a nonstop flight to/from New York JFK International Airport starting on October 7. This new route will be the first direct flight to New York since 2008 and is considered the area's initial step toward creating better connectivity to its primary feeder markets in the northeast. Consistently pleasant weather and a beautiful desert setting continue to make Tucson a popular tourist destination. The peak season for tourism in this area is from January to April. During other times of the year, weekend demand comprises travelers passing through en route to other destinations, people visiting friends or relatives, and other similar weekend demand generators. Primary attractions in the area include the following: • Reid Park Zoo features over 500 animals across 17 acres and contains two
championship golf courses, a nationally recognized tennis center, and Hi Corbett Field. In 2012, the Reid Park Zoo underwent a $9.6-million, seven-acre expansion known as "Expedition Tanzania."
• The Pima Air & Space Museum houses one of the largest aircraft collections in the world, including World War II combat gliders, experimental aircraft, a B-17 "Flying Fortress," and other military and commercial aircraft. In 2013, the newly revamped B-17 bomber museum housed within the Pima Air & Space Museum
Tourist Attractions

April-2017 Market Area Analysis Hotel Arizona – Tucson, Arizona 50
reopened. The $2.4-million renovation included a new grand entryway and the addition of 12,000 square feet, including a new 7,500-square-foot mezzanine level.
• The warm climate in Tucson allows for year-round outdoor activities such as hiking, cycling, horseback riding, swimming, tennis, and golf. Tucson is also home to several high-end scenic golf courses and resorts, including the Mountain at Ventana Canyon, the Golf Club at Vistoso, and the Westin La Paloma Golf Course. The city also benefits from yearly events such as the Tour de Tucson and Chrysler Classic of Tucson golf tournament.
• Saguaro National Park in southern Arizona consists of two geographically distinct districts, one east and the other west of Tucson. The park preserves Sonoran Desert landscapes, fauna, and flora, including the giant saguaro cactus. The park offer more than 165 miles of hiking trails between the two districts. In 2016, the park welcomed over 800,000 visitors.
SAGUARO NATIONAL PARK
This section discussed a wide variety of economic indicators for the pertinent market area. While slow to recover in recent years, Tucson is beginning to experience steady growth. Our market interviews and research revealed that although the Tucson area lost Major League Baseball spring training as a seasonal
Conclusion

April-2017 Market Area Analysis Hotel Arizona – Tucson, Arizona 51
demand generator, the stability of the healthcare sector and growth in student enrollment at the University of Arizona have helped support the region. Furthermore, many of the corporations or institutions within this area, such as the University of Arizona, IBM, and Raytheon Missile Systems, are world-renowned entities working with a multitude of clients or partners. The recent announcements of Caterpillar's new regional headquarters and nonstop flights to/from New York further illustrate the market's ongoing resurgence. The overall outlook is optimistic. Our analysis of the outlook for this specific market also considers the broader context of the national economy. The U.S. economy expanded during the last ten quarters, with a relative low point in growth occurring during the fourth quarter of 2015 and the first quarter of 2016. The economy then expanded by 1.4% and 2.9% in the second and third quarters of 2016, respectively. In recent months, increases in personal consumption expenditures, exports, private inventory investment, federal government spending, and nonresidential fixed investment were the primary factors in the net gain.
FIGURE 3-12 UNITED STATES GDP GROWTH RATE
1.6
3.9
2.8 2.8
-1.3
3.2
0.8
4.6
2.31.6
2.5
0.1
1.91.1
3.14.0
-1.2
4.05.0
2.3 2.02.6
2.0
0.9 0.81.4
2.9
-2.0-1.00.01.02.03.04.05.06.0
2010 2011 2012 2013 2014 2015 2016Source: tradingeconomics.com, Bureau of Economic Analysis
U.S. economic growth continues to support expansion of lodging demand; however, demand growth was not as robust in 2016 as in the last several years. As will be reflected in the following chapter, nationwide demand growth just slightly surpassed supply growth in 2016. Nevertheless, the stability in the U.S. economy is maintaining strong interest in hotel investments by a diverse array of market participants.
April-2017 Supply and Demand Analysis Hotel Arizona – Tucson, Arizona 52
4. Supply and Demand Analysis
In the lodging industry, price varies directly, but not proportionately, with demand and inversely, but not proportionately, with supply. Supply is measured by the number of guestrooms available, and demand is measured by the number of rooms occupied; the net effect of supply and demand toward equilibrium results in a prevailing price, or average rate. The purpose of this section is to investigate current supply and demand trends, as indicated by the current competitive market, and to set forth a basis for the projection of future supply and demand growth. The subject site is located in the greater Tucson lodging market. This greater lodging market spans nearly 150 open and operating lodging facilities totaling almost 16,000 guestrooms. Within this greater market, the direct submarket that will encompass the proposed subject hotel is known as Downtown Tucson. The proposed subject hotel is expected to compete with six hotels on a primary level based on their similar full-service product types and/or national brand affiliations. We have considered an additional hotel as a future secondary competitor given differences in location. The subject property’s local lodging market is most directly affected by the supply and demand trends within the immediate area. However, individual markets are also influenced by conditions in the national lodging market. We have reviewed national lodging trends to provide a context for the forecast of the supply and demand for the proposed subject hotel’s competitive set. STR is an independent research firm that compiles and publishes data on the lodging industry, and this information is routinely used by typical hotel buyers. The following STR diagram presents annual hotel occupancy and average rate data since 1987. The next two tables contain information that is more recent; the data are categorized by geographical region, price point, type of location, and chain scale, and the statistics include occupancy, average rate, and rooms revenue per available room (RevPAR). RevPAR is calculated by multiplying occupancy by average rate and provides an indication of how well rooms revenue is being maximized.
Definition of Subject Hotel Market
National Trends Overview

April-2017 Supply and Demand Analysis Hotel Arizona – Tucson, Arizona 53
FIGURE 4-1 NATIONAL OCCUPANCY AND AVERAGE RATE TRENDS
45.0%
50.0%
55.0%
60.0%
65.0%
70.0%
$0
$20
$40
$60
$80
$100
$120
1988
1989
1990
1991
1992
1993
1994
1995
1996
1997
1998
1999
2000
2001
2002
2003
2004
2005
2006
2007
2008
2009
2010
2011
2012
2013
2014
2015
2016
Source: STR
RevPAR Average Rate Occupancy

April-2017 Supply and Demand Analysis Hotel Arizona – Tucson, Arizona 54
FIGURE 4-2 NATIONAL OCCUPANCY AND AVERAGE RATE TRENDS – YEAR-TO-DATE DATA
United States 57.5 % 57.4 % (0.1) % $119.10 $122.02 2.4 % $68.44 $70.08 2.4 % 1.9 % 1.8 %
RegionNew England 49.8 % 49.9 % 0.3 % $124.50 $123.97 (0.4) % $61.94 $61.86 (0.1) % 1.6 % 1.9 %M iddle Atlantic 53.2 54.0 1.6 134.04 134.10 0.0 71.31 72.47 1.6 3.4 5.0South Atlantic 61.6 62.3 1.1 122.65 125.74 2.5 75.54 78.32 3.7 1.6 2.7East North Central 48.7 48.2 (0.9) 94.23 95.78 1.6 45.85 46.17 0.7 1.9 1.0East South Central 52.3 51.2 (2.2) 87.15 89.53 2.7 45.61 45.82 0.5 1.9 (0.4)West North Central 47.0 46.2 (1.8) 89.51 90.63 1.3 42.11 41.89 (0.5) 1.5 (0.3)West South Central 57.8 57.4 (0.6) 98.23 102.08 3.9 56.75 58.64 3.3 3.1 2.6M ountain 59.6 59.4 (0.3) 122.06 127.35 4.3 72.72 75.65 4.0 1.0 0.7Pacific 67.5 67.4 (0.2) 153.80 157.19 2.2 103.77 105.90 2.0 1.3 1.2
ClassLuxury 64.9 % 65.0 % 0.1 % $279.10 $284.95 2.1 % $181.18 $185.14 2.2 % 3.0 % 3.1 %Upper Upscale 65.7 65.7 0.0 172.31 176.40 2.4 113.25 115.97 2.4 1.6 1.6Upscale 64.8 64.8 0.0 133.10 135.15 1.5 86.30 87.61 1.5 4.1 4.0Upper M idscale 57.9 57.8 (0.2) 106.72 108.33 1.5 61.82 62.62 1.3 4.0 3.7M idscale 50.5 50.7 0.4 86.53 87.86 1.5 43.68 44.54 2.0 0.3 0.7Economy 50.7 50.3 (0.8) 64.29 66.14 2.9 32.61 33.27 2.0 (0.1) (0.9)
LocationUrban 64.3 % 64.7 % 0.5 % $155.17 $159.83 3.0 % $99.78 $103.34 3.6 % 3.3 % 3.9 %Suburban 59.4 58.9 (0.9) 102.08 103.98 1.9 60.62 61.20 1.0 1.8 0.9Airport 67.9 68.2 0.5 111.40 114.38 2.7 75.63 78.02 3.2 1.6 2.1Interstate 46.5 46.1 (0.7) 77.72 78.91 1.5 36.10 36.41 0.9 1.4 0.7Resort 64.5 65.1 1.0 181.19 184.92 2.1 116.84 120.42 3.1 1.3 2.3Small M etro /Town 46.1 46.2 0.2 90.26 92.01 1.9 41.64 42.52 2.1 1.6 1.8
Chain Sca leLuxury 69.4 % 69.1 % (0.4) % $314.85 $323.62 2.8 % $218.52 $223.62 2.3 % 2.9 % 2.4 %Upper Upscale 67.7 67.6 (0.1) 173.11 177.02 2.3 117.13 119.71 2.2 1.8 1.8Upscale 67.2 66.6 (0.9) 132.68 134.62 1.5 89.14 89.62 0.5 6.1 5.1Upper M idscale 58.0 57.9 (0.2) 104.29 105.72 1.4 60.53 61.22 1.1 3.1 2.9M idscale 50.0 50.2 0.5 79.45 80.35 1.1 39.69 40.33 1.6 0.7 1.2Economy 50.2 49.5 (1.4) 55.91 56.98 1.9 28.08 28.21 0.5 0.2 (1.2)Independents 53.9 54.2 0.5 116.78 120.36 3.1 62.94 65.19 3.6 0.4 0.9
Rms. Avail. Rms. Sold20162016 2017
Source: STR - February 2017 Lodging Review
2016 20172017%
Change%
Change%
Change
Occupancy - YTD February Average Rate - YTD February RevPAR - YTD February Percent Change

April-2017 Supply and Demand Analysis Hotel Arizona – Tucson, Arizona 55
FIGURE 4-3 NATIONAL OCCUPANCY AND AVERAGE RATE TRENDS – CALENDAR YEAR DATA
United States 65.4 % 65.5 % 0.1 % $120.30 $123.97 3.1 % $78.68 $81.19 3.2 % 1.6 % 1.7 %
RegionNew England 64.5 % 64.3 % (0.4) % $146.41 $150.70 2.9 % $94.49 $96.89 2.5 % 1.3 % 1.0 %M iddle Atlantic 67.3 67.3 0.0 162.29 163.41 0.7 109.22 109.99 0.7 2.8 2.8South A tlantic 66.5 67.2 1.1 116.65 119.77 2.7 77.53 80.44 3.8 1.3 1.3East North Central 61.3 61.2 (0.2) 105.20 108.09 2.7 64.45 66.10 2.6 1.6 1.4East South Central 61.0 61.4 0.7 90.91 94.87 4.4 55.43 58.26 5.1 1.7 2.5West North Central 59.6 59.1 (0.8) 93.28 95.91 2.8 55.58 56.68 2.0 1.5 0.7West South Central 62.9 61.5 (2.3) 98.43 98.66 0.2 61.93 60.63 (2.1) 2.7 0.3M ountain 65.0 65.5 0.7 108.77 114.24 5.0 70.68 74.79 5.8 0.8 1.5Pacific 73.2 73.9 0.9 151.10 158.44 4.9 110.57 117.04 5.8 0.9 1.9
ClassLuxury 70.8 % 71.0 % 0.3 % $278.39 $283.05 1.7 % $196.98 $200.95 2.0 % 2.8 % 3.1 %Upper Upscale 72.7 72.6 (0.1) 173.53 177.77 2.4 126.08 129.07 2.4 1.2 1.2Upscale 72.0 72.0 0.1 135.70 139.47 2.8 97.72 100.49 2.8 3.9 3.9Upper M idscale 67.1 67.1 0.0 110.95 113.84 2.6 74.48 76.38 2.6 3.3 3.2M idscale 59.9 59.9 0.1 90.13 92.61 2.7 53.96 55.50 2.9 0.4 0.6Economy 58.6 58.6 0.0 67.60 70.17 3.8 39.63 41.13 3.8 (0.4) (0.4)
Loca tionUrban 73.0 % 73.1 % 0.1 % $173.99 $177.37 1.9 % $127.04 $129.69 2.1 % 2.9 % 3.0 %Suburban 66.7 66.8 0.2 101.91 105.70 3.7 67.97 70.63 3.9 1.4 1.6Airport 73.6 73.4 (0.2) 109.78 113.56 3.4 80.78 83.40 3.3 1.0 0.8Interstate 57.2 56.6 (1.1) 81.35 83.04 2.1 46.53 46.97 0.9 1.5 0.4Resort 67.9 68.6 0.9 164.10 168.76 2.8 111.51 115.76 3.8 0.9 1.8Small M etro /Town 56.9 56.9 0.1 96.63 99.45 2.9 54.95 56.64 3.1 1.4 1.5
Chain Sca leLuxury 75.2 % 74.9 % (0.3) % $317.58 $322.84 1.7 % $238.70 $241.82 1.3 % 2.8 % 2.4 %Upper Upscale 74.3 74.2 (0.2) 174.98 178.82 2.2 130.08 132.63 2.0 1.6 1.4Upscale 74.3 73.8 (0.6) 134.82 138.50 2.7 100.13 102.27 2.1 5.6 5.0Upper M idscale 67.5 67.4 (0.2) 108.75 111.43 2.5 73.46 75.14 2.3 2.1 1.9M idscale 59.4 59.4 (0.1) 83.32 85.43 2.5 49.52 50.74 2.5 1.2 1.1Economy 58.1 57.9 (0.4) 58.82 60.84 3.4 34.16 35.20 3.1 0.3 (0.1)Independents 61.8 62.3 0.8 118.73 123.22 3.8 73.36 76.75 4.6 0.2 1.0
2016
RevPAR%
ChangeRms. Avail. Rms. Sold
Percent Change%
Change
Occupancy Average Rate
2016%
Change2015 20152015 2016
Source: STR - December 2016 Lodging Revi ew

April-2017 Supply and Demand Analysis Hotel Arizona – Tucson, Arizona 56
Following the significant RevPAR decline experienced during the last recession, demand growth resumed in 2010, led by select markets that had recorded growth trends in the fourth quarter of 2009. A return of business travel and some group activity contributed to these positive trends. The resurgence in demand was partly fueled by the significant price discounts that were widely available in the first half of 2010. These discounting policies were largely phased out in the latter half of the year, balancing much of the early rate loss. Demand growth remained strong, but decelerated from 2011 through 2013, increasing at rates of 4.7%, 2.8%, and 2.0%, respectively. Demand growth then surged to 4.0% in 2014, driven by a strong economy, a robust oil and gas sector, and limited new supply, among other factors. By 2014, occupancy had surpassed the 64% mark. Average rate rebounded similarly during this time, bracketing 4.0% annual gains from 2011 through 2014. In 2015, demand growth continued to outpace supply growth, a relationship that has been in place since 2010. With a 2.9% increase in room-nights, the nation's occupancy level reached a record high 65.4% in 2015. Supply growth intensified, but remained at 1.1%, following annual supply growth levels of 0.7% and 0.9% of 2013 and 2014, respectively. Average rate posted another strong year of growth, at 4.4% in 2015, in pace with the annual growth of the last four years. Robust job growth, intensified group and leisure travel, and waning price-sensitivity all contributed to the gains. In 2016, occupancy moved slightly higher (by 0.1 percentage point) to 65.5%, as demand growth slightly exceeded supply growth. Average rate increased 3.1% for the year, and the net change in RevPAR was 3.2%, reflecting a healthy lodging market overall. Year-to-date February 2017 data illustrate that occupancy decreased 0.1 of a point, while average rate increased by nearly $3.00, resulting in RevPAR growth of 2.4% thus far in 2017. As previously noted, STR is an independent research firm that compiles and publishes data on the lodging industry, routinely used by typical hotel buyers. HVS has ordered and analyzed an STR Trend Report of historical supply and demand data for a group of hotels considered applicable to this analysis for the proposed subject hotel. This information is presented in the following table, along with the market-wide occupancy, average rate, and rooms revenue per available room (RevPAR). RevPAR is calculated by multiplying occupancy by average rate and provides an indication of how well rooms revenue is being maximized.
Historical Supply and Demand Data

April-2017 Supply and Demand Analysis Hotel Arizona – Tucson, Arizona 57
FIGURE 4-4 HISTORICAL SUPPLY AND DEMAND TRENDS
YearAverage Daily Room Count
Available Room Nights Change
Occupied Room Nights Change Occupancy
Average Rate Change RevPAR Change
2005 1,788 652,620 — 481,528 — 73.8 % $96.00 — $70.83 — 2006 1,788 652,620 0.0 % 511,042 6.1 % 78.3 100.66 4.8 % 78.82 11.3 %2007 1,788 652,620 0.0 467,599 (8.5) 71.6 110.63 9.9 79.27 0.62008 1,788 652,620 0.0 427,633 (8.5) 65.5 111.63 0.9 73.15 (7.7)2009 1,788 652,620 0.0 406,840 (4.9) 62.3 101.54 (9.0) 63.30 (13.5)2010 1,785 651,396 (0.2) 432,269 6.3 66.4 97.65 (3.8) 64.80 2.42011 1,780 649,700 (0.3) 426,237 (1.4) 65.6 94.97 (2.7) 62.31 (3.8)2012 1,667 608,450 (6.3) 403,335 (5.4) 66.3 94.28 (0.7) 62.50 0.32013 1,746 637,300 4.7 414,087 2.7 65.0 95.38 1.2 61.97 (0.8)2014 1,784 651,160 2.2 424,453 2.5 65.2 96.99 1.7 63.22 2.02015 1,784 651,160 0.0 433,329 2.1 66.5 99.06 2.1 65.92 4.32016 1,784 651,160 0.0 433,771 0.1 66.6 102.55 3.5 68.32 3.6
Year-to-Date Through March2016 1,784 160,560 — 130,483 — 81.3 % $119.08 — $96.77 — 2017 1,784 160,560 0.0 % 126,531 (3.0) % 78.8 125.42 5.3 % 98.84 2.1 %
Avera ge Annual Compounded Change:2005 - 2016 (0.0) % (0.9) % 0.6 % (0.3) %2005 - 2007 0.0 (1.5) 7.4 5.82007 - 2010 (0.1) (2.6) (4.1) (6.5)2010 - 2016 (0.0) 0.1 0.8 0.9
Hotels Included in Sample
Hi l ton Tucson East Primary 232 Upper Upsca le Cla ss Feb 1987Radisson Suites Tucson Not Competitive 299 Upsca le Cla ss Dec 1985Doubletree Tucson @ Reid Park Primary 287 Upsca le Cla ss Nov 1974DoubleTree Suites Tucson Wi l l ia ms Center Primary 142 Upsca le Cla ss Jun 1975 *Converted from Embassy Suites in July 2015Sheraton Hotel & Suites Tucson Primary 216 Upper Upsca le Cla ss Jun 1985Tucson Hotel Primary 250 Mi dsca le Cla ss Dec 1996 *Converted from Marriott in March 2017al oft Hotel Tucson Univers i ty Primary 154 Upsca le Cla ss Jun 1971 *Converted to Aloft in Apri l 2013DoubleTree Tucson Airport Secondary 204 Upsca le Cla ss Jan 1982
Total 1,784
Source: STR
Competitive Status
YearOpened
Number Yearof Rooms Affiliated Comments

April-2017 Supply and Demand Analysis Hotel Arizona – Tucson, Arizona 58
It is important to note some limitations of the STR data. Hotels are occasionally added to or removed from the sample; furthermore, not every property reports data in a consistent and timely manner. These factors can influence the overall quality of the information by skewing the results, and these inconsistencies may also cause the STR data to differ from the results of our competitive survey. Nonetheless, STR data provide the best indication of aggregate growth or decline in existing supply and demand; thus, these trends have been considered in our analysis. Opening dates, as available, are presented for each reporting hotel in the previous table. The STR data for the competitive set reflect a market-wide occupancy level of 2016 in 66.6%, which compares to 66.5% for 2015. The overall average occupancy level for the calendar years presented equates to 65.9%. The STR data for the competitive set reflect a market-wide average rate level of $102.55 in 2016, which compares to $99.06 For 2015. The average across all calendar years presented for average rate equates to $97.26. These occupancy and average rate trends resulted in a RevPAR level of $68.32 in 2016. RevPAR first peaked for this selected set of competitive hotels in 2007, resulting in a RevPAR of nearly $80, before declining to a low point of roughly $63 by year-end 2009 because of the recession. A delayed recovery was generally experienced from 2010 through 2013, with year-over-year RevPAR fluctuations. The delayed ramp-up was largely due to group cancelations following the attempted passage of SB 1070 in 2010 and the federal government sequester in 2013. However, both occupancy and rate grew in 2014, largely driven by upticks in leisure travel during the peak spring months. This trend continued through 2016, as hotel managers in the area reported fewer cancelations in the group segment, which contributed to the overall strengthening. Year-to-date data illustrate continued strengthening in overall RevPAR, led by stronger average rate growth. This positive trend illustrates that the market is continuing to strengthen, which was confirmed by our market interviews, indicating less rate-resistance by travelers in the year-to-date period over the prior year. The outlook for the remaining months of 2017 is positive as the local economy continues to strengthen. Monthly occupancy and average rate trends are presented in the following tables. Seasonality

April-2017 Supply and Demand Analysis Hotel Arizona – Tucson, Arizona 59
FIGURE 4-5 MONTHLY OCCUPANCY TRENDS
Month 2005 2006 2007 2008 2009 2010 2011 2012 2013 2014 2015 2016 2017
January 73.3 % 75.6 % 77.4 % 64.9 % 60.4 % 65.9 % 64.2 % 64.7 % 66.7 % 63.2 % 66.6 % 73.8 % 66.2 %February 86.1 88.0 85.0 78.9 73.0 76.4 76.6 80.8 82.2 80.5 84.3 82.2 84.2March 89.7 91.0 89.2 78.7 72.3 81.5 76.2 80.1 83.0 79.9 85.5 87.9 86.5Apri l 80.0 80.7 78.2 72.0 69.1 72.2 72.2 69.3 72.2 70.3 69.1 73.6 — May 71.1 78.8 72.8 66.2 64.8 63.8 63.4 69.3 62.5 62.8 64.5 63.1 — June 76.4 75.6 76.0 70.7 64.8 64.0 68.8 65.9 59.1 61.6 66.0 61.9 — July 67.9 72.6 68.0 57.9 57.3 63.2 58.3 54.9 54.7 65.6 58.4 59.3 — Augus t 62.5 81.3 64.0 62.0 56.7 61.7 60.4 61.6 63.4 61.5 60.3 61.7 — September 65.5 74.0 62.5 55.4 53.4 60.7 64.2 58.0 54.3 51.3 57.5 58.7 — October 76.0 80.4 70.6 69.8 66.0 69.5 67.9 68.7 59.0 64.5 66.4 62.7 — November 74.1 78.4 65.3 56.0 58.3 62.5 61.1 63.5 68.2 61.7 63.2 60.2 — December 64.0 63.8 51.9 54.7 53.1 55.7 55.1 57.6 59.0 60.4 58.3 55.5 —
Annual Occupancy 73.8 % 78.3 % 71.6 % 65.5 % 62.3 % 66.4 % 65.6 % 66.3 % 65.0 % 65.2 % 66.5 % 66.6 % —
Source: STR
FIGURE 4-6 MONTHLY AVERAGE RATE TRENDS
Month 2005 2006 2007 2008 2009 2010 2011 2012 2013 2014 2015 2016 2017
January $103.63 $114.85 $133.28 $124.73 $115.01 $104.90 $106.17 $102.51 $103.00 $100.33 $101.22 $111.86 $124.49February 131.26 137.17 155.39 153.31 136.04 125.35 118.65 111.46 125.37 125.92 130.36 133.17 136.86March 118.80 124.77 137.45 135.52 120.87 113.02 113.45 105.92 105.84 110.72 111.77 113.22 116.08Apri l 102.20 103.66 108.03 118.81 106.66 104.95 98.72 98.47 97.59 101.82 99.88 100.71 — May 87.40 93.96 98.25 112.30 96.71 97.23 97.82 94.01 95.42 95.81 99.22 98.47 — June 74.84 78.59 86.01 83.63 79.21 79.73 76.31 75.55 77.91 80.76 81.92 86.56 — July 71.43 71.81 80.76 80.79 76.43 75.53 74.86 75.15 75.51 76.51 77.72 80.04 — Augus t 77.25 79.56 87.19 85.73 83.12 81.67 81.11 80.66 83.45 85.29 91.01 92.73 — September 89.06 92.44 97.89 102.18 94.99 95.09 92.86 89.89 91.58 91.03 92.54 95.86 — October 98.90 104.47 113.47 117.75 106.37 102.04 94.03 101.17 99.54 102.87 106.68 111.75 — November 94.98 102.77 110.56 106.58 100.02 93.59 92.74 94.33 93.90 98.92 94.40 100.40 — December 87.89 95.43 99.75 100.90 91.55 87.82 83.58 87.80 85.96 83.20 86.78 90.27 —
Annual Average Rate $96.00 $100.66 $110.63 $111.63 $101.54 $97.65 $94.97 $94.28 $95.38 $96.99 $99.06 $102.55 —
Source: STR

April-2017 Supply and Demand Analysis Hotel Arizona – Tucson, Arizona 60
FIGURE 4-7 SEASONALITY
2005 2006 2007 2008 2009 2010 2011 2012 2013 2014 2015 2016 2017
High Season - February, March Occupancy 88.0 % 89.6 % 87.2 % 78.8 % 72.6 % 79.1 % 76.4 % 80.4 % 82.6 % 80.2 % 84.9 % 85.2 % 85.4 %Average Rate $124.58 $130.55 $145.75 $143.97 $128.11 $118.68 $115.93 $108.56 $115.05 $117.96 $120.53 $122.36 $125.80RevPAR 109.66 117.01 127.12 113.45 93.00 93.83 88.56 87.28 95.06 94.61 102.37 104.25 107.46
Shoulder Season - January, April, May, October Occupancy 75.1 % 78.9 % 74.7 % 68.2 % 65.0 % 67.8 % 66.9 % 67.9 % 65.0 % 65.1 % 66.6 % 68.2 %Average Rate $98.18 $104.13 $113.52 $118.37 $106.04 $102.36 $99.11 $99.06 $98.81 $100.26 $101.77 $105.78RevPAR 73.70 82.15 84.82 80.75 68.96 69.39 66.31 67.25 64.22 65.31 67.80 72.19
Low Season - June, July, August, September, November, December Occupancy 68.3 % 74.3 % 64.6 % 59.4 % 57.2 % 61.3 % 61.3 % 60.2 % 59.8 % 60.4 % 60.6 % 59.5 %Average Rate $82.52 $86.55 $93.10 $92.61 $87.23 $85.37 $83.52 $83.87 $84.91 $85.65 $87.35 $90.93RevPAR 56.39 64.27 60.11 55.04 49.92 52.32 51.16 50.51 50.75 51.71 52.90 54.13
Source: Smith Travel Research

April-2017 Supply and Demand Analysis Hotel Arizona – Tucson, Arizona 61
The illustrated monthly occupancy and average rates patterns reflect important seasonal characteristics. We have reviewed these trends in developing our forthcoming forecast of market-wide demand and average rate. The peak season for Tucson extends from late February through April. During this time, the number of scheduled events throughout the area spikes, drawing thousands of travelers to the area. The month of May and the fall months represent shoulder periods, but still attract strong levels of visitation given the favorable climate. The hot summer months and the cooler period from December through early January are considered the area's off-seasons. During the off-season, weekend occupancy can still remain high; however, hotel operators typically offer significant rate discounts and group incentives to attract travelers. A review of the trends in occupancy and average rate by day of the week provides some insight into the impact that the current economic conditions have had on the competitive lodging market. The data, as provided by STR, are illustrated in the following table(s).
Patterns of Demand

April-2017 Supply and Demand Analysis Hotel Arizona – Tucson, Arizona 62
FIGURE 4-8 OCCUPANCY BY DAY OF WEEK (TRAILING 12 MONTHS)
Month Sunday Monday Tuesday Wednesday Thursday Friday Saturday Total Month
Nov - 15 45.9 % 66.7 % 72.2 % 75.7 % 68.5 % 77.8 % 78.2 % 68.4 %Dec - 15 29.9 40.7 46.1 47.0 50.2 53.0 56.0 46.3Jan - 16 32.2 51.4 61.8 66.1 53.8 53.3 57.5 53.2Feb - 16 45.4 49.5 64.6 75.5 71.8 60.4 69.1 61.9Mar - 16 35.6 54.0 64.3 62.2 56.6 64.1 61.1 57.3Apr - 16 37.1 55.8 66.0 71.3 66.4 69.5 70.3 62.8May - 16 50.3 58.3 72.6 82.4 80.4 81.1 78.1 70.8Jun - 16 49.0 67.7 77.5 75.7 60.3 62.6 66.3 65.7Jul - 16 39.4 50.2 58.7 62.3 58.7 55.9 63.9 55.3Aug - 16 42.4 45.3 54.0 56.0 56.9 64.1 72.1 55.4Sep - 16 51.0 63.0 77.3 81.1 69.6 68.6 74.5 69.3Oct - 16 39.6 53.8 81.8 91.8 79.6 63.9 66.0 66.6
Average 41.5 % 54.7 % 66.0 % 70.0 % 64.1 % 64.3 % 67.5 % 61.1 %
Source: STR
FIGURE 4-9 AVERAGE RATE BY DAY OF WEEK (TRAILING 12 MONTHS)
Month Sunday Monday Tuesday Wednesday Thursday Friday Saturday Total Month
Nov - 15 $144.18 $161.17 $166.45 $163.17 $152.25 $137.01 $139.02 $152.08Dec - 15 125.78 139.40 145.36 147.31 146.34 127.43 124.73 137.67Jan - 16 131.95 150.75 154.54 154.45 142.09 122.99 119.84 139.05Feb - 16 135.02 144.84 152.56 151.59 148.49 126.13 131.95 142.17Mar - 16 136.95 159.63 157.92 149.19 140.81 125.16 122.70 142.61Apr - 16 139.08 149.68 156.98 158.24 153.88 133.59 131.96 145.49May - 16 134.98 148.57 154.55 155.26 153.14 141.16 131.09 146.09Jun - 16 145.31 155.45 155.54 154.03 148.77 132.43 131.52 147.02Jul - 16 132.51 141.55 146.62 143.53 136.14 125.86 127.48 135.57Aug - 16 134.48 140.18 145.26 141.84 140.27 136.34 135.27 139.30Sep - 16 138.64 154.95 162.27 162.80 153.12 141.24 140.24 150.99Oct - 16 150.88 162.09 176.02 177.20 174.64 153.39 145.95 164.18
Average $138.22 $151.71 $157.11 $155.99 $150.35 $134.22 $132.44 $146.06
Source: STR

April-2017 Supply and Demand Analysis Hotel Arizona – Tucson, Arizona 63
FIGURE 4-10 OCCUPANCY, AVERAGE RATE, AND REVPAR BY DAY OF WEEK (MULTIPLE YEARS)
Occupancy (%)
Nov 13 - Oct 14 52.2 % 67.5 % 78.9 % 80.1 % 73.5 % 75.9 % 80.3 % 72.6 %Nov 14 - Oct 15 50.8 60.9 70.8 74.0 66.0 69.4 75.1 66.7Nov 15 - Oct 16 41.5 54.7 66.0 70.0 64.1 64.3 67.5 61.1
Change (Occupancy Points)FY 15 - FY 16 (1.4) (6.6) (8.1) (6.2) (7.5) (6.5) (5.2) (5.9)FY 16 - FY 17 (9.3) (6.2) (4.8) (4.0) (1.8) (5.0) (7.6) (5.6)
ADR ($)
Nov 13 - Oct 14 $135.76 $149.88 $156.11 $155.74 $148.60 $130.94 $130.85 $144.26Nov 14 - Oct 15 141.87 155.70 160.88 160.84 152.77 135.41 136.70 149.27Nov 15 - Oct 16 138.22 151.71 157.11 155.99 150.35 134.22 132.44 146.06
Change (Dollars)FY 15 - FY 16 $6.11 $5.82 $4.78 $5.10 $4.16 $4.47 $5.85 $5.01FY 16 - FY 17 (3.65) (3.99) (3.78) (4.85) (2.42) (1.19) (4.27) (3.21)
Change (Percent)FY 15 - FY 16 4.5 % 3.9 % 3.1 % 3.3 % 2.8 % 3.4 % 4.5 % 3.5 %FY 16 - FY 17 (2.6) (2.6) (2.3) (3.0) (1.6) (0.9) (3.1) (2.2)
RevPAR ($)
Nov 13 - Oct 14 $70.81 $101.12 $123.09 $124.81 $109.26 $99.39 $105.03 $104.77Nov 14 - Oct 15 72.01 94.77 113.87 118.99 100.79 93.92 102.64 99.58Nov 15 - Oct 16 57.30 82.99 103.72 109.21 96.44 86.35 89.37 89.22
Change (Dollars)FY 15 - FY 16 $1.20 ($6.35) ($9.22) ($5.82) ($8.47) ($5.47) ($2.39) ($5.19)FY 16 - FY 17 (14.71) (11.78) (10.15) (9.77) (4.36) (7.57) (13.27) (10.36)
Change (Percent)FY 15 - FY 16 1.7 % (6.3) % (7.5) % (4.7) % (7.7) % (5.5) % (2.3) % (5.0) %FY 16 - FY 17 (20.4) (12.4) (8.9) (8.2) (4.3) (8.1) (12.9) (10.4)
Source: STR
Total Year
Sunday Monday Tuesday Total Year
Wednesday Saturday
Wednesday Thursday Friday Saturday
Total YearSaturday
Friday
Thursday FridayWednesday
Sunday Monday Tuesday Thursday
Sunday Monday Tuesday
In most markets, business travel, including individual commercial travelers and corporate groups, is the predominant source of demand on Monday through Thursday nights. Leisure travelers and non-business-related groups generate a majority of demand on Friday and Saturday nights.

April-2017 Supply and Demand Analysis Hotel Arizona – Tucson, Arizona 64
Based on an evaluation of the occupancy, rate structure, market orientation, chain affiliation, location, facilities, amenities, reputation, and quality of each area hotel, as well as the comments of management representatives, we have identified several properties that are expected to be primarily competitive with the proposed subject hotel. If applicable, additional lodging facilities may be judged only secondarily competitive; although the facilities, rate structures, or market orientations of these hotels prevent their inclusion among the primary competitive supply, they are expected to compete with the proposed subject hotel to some extent. The following table summarizes the important operating characteristics of the future primary competitors and the aggregate secondary competitors (if applicable). This information was compiled from personal interviews, inspections, online resources, and our in-house database of operating and hotel facility data.
SUPPLY
Primary Competitiors

April-2017 Supply and Demand Analysis Hotel Arizona – Tucson, Arizona 65
FIGURE 4-11 PRIMARY COMPETITORS – OPERATING PERFORMANCE
Est. Segmentation Estimated 2015 Estimated 2016
Property Occ. RevPAR RevPAROccupancy Penetration
Yield Penetration
DoubleTree Suites by Hi l ton Tucson Wi l l iams Center
142 50 % 30 % 20 % 142 50 - 55 % $105 - $110 $55 - $60 142 60 - 65 % $110 - $115 $70 - $75 90 - 95 % 95 - 100 %
DoubleTree by Hi l ton Tucson Reid Pa rk 287 50 25 25 287 70 - 75 90 - 95 65 - 70 287 75 - 80 95 - 100 70 - 75 100 - 110 95 - 100
Tucson Uni vers i ty Park Hotel 250 40 30 30 250 75 - 80 130 - 140 100 - 105 251 75 - 80 130 - 140 105 - 110 110 - 120 140 - 150
Hi l ton Tucson Ea st 232 55 25 20 232 65 - 70 85 - 90 60 - 65 232 70 - 75 85 - 90 60 - 65 100 - 110 85 - 90
Sheraton Hotel & Suites Tucson 216 40 30 30 216 60 - 65 80 - 85 50 - 55 216 55 - 60 85 - 90 45 - 50 75 - 80 65 - 70
Al oft Tucson Univers i ty 154 45 20 35 154 70 - 75 120 - 125 85 - 90 154 70 - 75 125 - 130 90 - 95 100 - 110 120 - 130
Sub-Totals/Averages 1,281 47 % 27 % 27 % 1,281 69.8 % $104.14 $72.66 1,282 71.4 % $107.13 $76.54 101.0 % 102.4 %
Secondary Competi tors 503 50 % 15 % 35 % 163 58.0 % $93.00 $53.94 163 65.0 % $93.00 $60.45 91.9 % 80.9 %
Totals/Averages 1,784 47 % 25 % 27 % 1,444 68.4 % $103.07 $70.54 1,445 70.7 % $105.66 $74.72 100.0 % 100.0 %
* Specific occupancy and average rate data were utilized in our analysis, but are presented in ranges in the above table for the purposes of confidentiality.
Number of Rooms Average Rate Occ.
Weighted Annual Room Count Average RateCo
mm
ercia
l/Gov
ernm
ent
Mee
ting
and
Grou
p
Leisu
re
Weighted Annual Room Count

April-2017 Supply and Demand Analysis Hotel Arizona – Tucson, Arizona 66
FIGURE 4-12 PRIMARY COMPETITORS – FACILITY PROFILES
PropertyNumber of
RoomsYear
OpenedLast Major
Renovation(s)
Approx. Miles To Subject Property Food and Beverage Outlets
Indoor Meeting
Space (SF)Meeting Space
per Room Facilities & Amenities
DoubleTree Sui tes by Hi l ton Tucson Wil l iams Center 142 1975 2015 5.5 1,800 12.7 5335 East Broadway Boulevard
DoubleTree by Hi l ton Tucson Reid Park 287 1974 — 3.7 17,685 61.6 445 South Alvernon Way
Tucs on Univers ity Park Hotel 250 1996 — 1.2 24,000 96.0 880 Eas t 2nd Street
Hi l ton Tucson East 232 1987 2017 8.3 10,743 46.3 7600 East Broadway
Sheraton Hotel & Sui tes Tucs on 216 1985 2016/17 5.6 14,164 65.6 5151 East Grant Road
Aloft Tucs on Univers i ty 154 1971 2012/13 2.0 1,200 7.8 1900 East Speedway Boulevard
w xyz bar; re:fuel Bus ines s Center; Gues t Laundry Area ; Room Service; Outdoor Swimming Pool ; Indoor Whirlpool ; Fi tnes s Room; Outdoor Whirlpool
Los Arboles Bar & Gri l l Outdoor Swimming Pool ; Outdoor Whirlpool ; Fi tnes s Room; Lobby Workstations ; Market Pantry; Vending Area(s);
Cactus Ros e; Javel ina Cantina ; Lobby Bar
Gi ft Shop; Outdoor Swimming Pool ; Tennis Court(s ); Fi tnes s Room; Hai r Salon; Lobby Works tation; Vending Area(s); Outdoor Whirlpool
Saguaro Gri l l ; Sedona Lounge Outdoor Swimming Pool ; Outdoor Whirlpool ; Fi tnes s Room; Bus ines s Center; Market Pantry; Vending Area(s);
Vis tas Bar and Gri l l Bus ines s Center; Gues t Laundry Area ; Gift Shop; Outdoor Swimming Pool ; Fi tness Room; Vending Area(s)
Fi re + Spice; Coffee Shop Outdoor Swimming Pool ; Fi tness Room; Lobby Works tation; Market Pantry; Vending Area(s); Outdoor Patio & Fi re Pi t; Outdoor Whirlpool

April-2017 Supply and Demand Analysis Hotel Arizona – Tucson, Arizona 67
The following map illustrates the locations of the subject property and its future competitors.
MAP OF COMPETITION

April-2017 Supply and Demand Analysis Hotel Arizona – Tucson, Arizona 68
Our survey of the primarily competitive hotels in the local market shows a range of lodging types and facilities. Each primary competitor was inspected and evaluated. Descriptions of our findings are presented below.

April-2017 Supply and Demand Analysis Hotel Arizona – Tucson, Arizona 69
PRIMARY COMPETITOR #1 - DOUBLETREE SUITES BY HILTON TUCSON WILLIAMS CENTER
FIGURE 4-13 ESTIMATED HISTORICAL OPERATING STATISTICS
YearWtd. Annual Room Count Occupancy RevPAR
Occupancy Penetration
Yield Penetration
Est. 2014 142 65 - 70 % $105 - $110 $65 - $70 95 - 100 % 100 - 110 %Est. 2015 142 50 - 55 105 - 110 55 - 60 75 - 80 80 - 85Est. 2016 142 60 - 65 110 - 115 70 - 75 90 - 95 95 - 100
Average Rate
This hotel benefits from its recent property-wide renovations and Williams Center location near several corporate entities. Overall, the property appeared to be in very good condition. Its accessibility is similar to that of the subject site, and its visibility is similar to the expected visibility of the Hotel Arizona.
DoubleTree Suites by Hilton Tucson Williams Center 5335 East Broadway Boulevard Tucson, AZ

April-2017 Supply and Demand Analysis Hotel Arizona – Tucson, Arizona 70
PRIMARY COMPETITOR #2 - DOUBLETREE BY HILTON TUCSON REID PARK
FIGURE 4-14 ESTIMATED HISTORICAL OPERATING STATISTICS
YearWtd. Annual Room Count Occupancy RevPAR
Occupancy Penetration
Yield Penetration
Est. 2014 287 65 - 70 % $90 - $95 $65 - $70 100 - 110 % 95 - 100 %Est. 2015 287 70 - 75 90 - 95 65 - 70 100 - 110 95 - 100Est. 2016 287 75 - 80 95 - 100 70 - 75 100 - 110 95 - 100
Average Rate
This hotel benefits from its strong Hilton brand affiliation, but is somewhat disadvantaged by its lack of recent property-wide renovations. Overall, the property appeared to be in good condition. Its accessibility is similar to that of the subject site, and its visibility is similar to the expected visibility of the Hotel Arizona.
DoubleTree by Hilton Tucson Reid Park 445 South Alvernon Way Tucson, AZ

April-2017 Supply and Demand Analysis Hotel Arizona – Tucson, Arizona 71
PRIMARY COMPETITOR #3 - TUCSON UNIVERSITY PARK HOTEL
FIGURE 4-15 ESTIMATED HISTORICAL OPERATING STATISTICS
YearWtd. Annual Room Count Occupancy RevPAR
Occupancy Penetration
Yield Penetration
Est. 2014 250 75 - 80 % $125 - $130 $95 - $100 110 - 120 % 140 - 150 %Est. 2015 250 75 - 80 130 - 140 100 - 105 110 - 120 140 - 150Est. 2016 251 75 - 80 130 - 140 105 - 110 110 - 120 140 - 150
Average Rate
This hotel benefits from its adjacent location to the University of Arizona, but is somewhat disadvantaged by its lack of a nationally recognized brand affiliation. Overall, the property appeared to be in good condition. Its accessibility is similar to that of the subject site, and its visibility is similar to the expected visibility of the Hotel Arizona.
Tucson University Park Hotel 880 East 2nd Street Tucson, AZ

April-2017 Supply and Demand Analysis Hotel Arizona – Tucson, Arizona 72
PRIMARY COMPETITOR #4 - HILTON TUCSON EAST
FIGURE 4-16 ESTIMATED HISTORICAL OPERATING STATISTICS
YearWtd. Annual Room Count Occupancy RevPAR
Occupancy Penetration
Yield Penetration
Est. 2014 232 65 - 70 % $85 - $90 $55 - $60 95 - 100 % 80 - 85 %Est. 2015 232 65 - 70 85 - 90 60 - 65 100 - 110 80 - 85Est. 2016 232 70 - 75 85 - 90 60 - 65 100 - 110 85 - 90
Average Rate
This hotel benefits from its strong Hilton brand affiliation and ongoing property-wide renovations. Overall, the property appeared to be in good condition. Its accessibility is similar to that of the subject site, and its visibility is similar to the expected visibility of the Hotel Arizona.
Hilton Tucson East 7600 East Broadway Tucson, AZ

April-2017 Supply and Demand Analysis Hotel Arizona – Tucson, Arizona 73
PRIMARY COMPETITOR #5 - SHERATON HOTEL & SUITES TUCSON
FIGURE 4-17 ESTIMATED HISTORICAL OPERATING STATISTICS
YearWtd. Annual Room Count Occupancy RevPAR
Occupancy Penetration
Yield Penetration
Est. 2014 216 60 - 65 % $80 - $85 $45 - $50 90 - 95 % 70 - 75 %Est. 2015 216 60 - 65 80 - 85 50 - 55 90 - 95 75 - 80Est. 2016 216 55 - 60 85 - 90 45 - 50 75 - 80 65 - 70
Average Rate
This hotel benefits from its strong Marriott brand affiliation and recent guestroom renovations. Overall, the property appeared to be in very good condition. Its accessibility is similar to the accessibility attributes of the subject site, while its visibility is similar to the expected visibility of the Hotel Arizona.
Sheraton Hotel & Suites Tucson 5151 East Grant Road Tucson, AZ

April-2017 Supply and Demand Analysis Hotel Arizona – Tucson, Arizona 74
PRIMARY COMPETITOR #6 - ALOFT TUCSON UNIVERSITY
FIGURE 4-18 ESTIMATED HISTORICAL OPERATING STATISTICS
YearWtd. Annual Room Count Occupancy RevPAR
Occupancy Penetration
Yield Penetration
Est. 2014 154 65 - 70 % $115 - $120 $80 - $85 100 - 110 % 110 - 120 %Est. 2015 154 70 - 75 120 - 125 85 - 90 100 - 110 120 - 130Est. 2016 154 70 - 75 125 - 130 90 - 95 100 - 110 120 - 130
Average Rate
This hotel benefits from its adjacent location to the University of Arizona and strong Marriott brand affiliation. Overall, the property appeared to be in very good condition. Its accessibility is similar to the accessibility attributes of the subject site, while its visibility is similar to the expected visibility of the Hotel Arizona.
Aloft Tucson University 1900 East Speedway Boulevard Tucson, AZ

April-2017 Supply and Demand Analysis Hotel Arizona – Tucson, Arizona 75
We have also reviewed other area lodging facilities to determine whether any may compete with the proposed subject hotel on a secondary basis. The room count of each secondary competitor has been weighted based on its assumed degree of competitiveness in the future with the proposed subject hotel. By assigning degrees of competitiveness, we can assess how the proposed subject hotel and its future competitors may react to various changes in the market, including new supply, changes to demand generators, and renovations or franchise changes of existing supply. The following table sets forth the pertinent operating characteristics of the secondary competitors.
Secondary Competitors

April-2017 Supply and Demand Analysis Hotel Arizona – Tucson, Arizona 76
FIGURE 4-19 SECONDARY COMPETITOR(S) – OPERATING PERFORMANCE
Est. Segmentation Estimated 2015 Estimated 2016
PropertyNumber of
Rooms Occ. Average Rate RevPAR Occ. Average Rate RevPAR
DoubleTree Sui tes by Hi l ton Tucson Airport
204 50 15 35 80 163 55 - 60 90 - 95 50 - 55 163 60 - 65 90 - 95 60 - 65
Ra disson Suites Tucson 299 30 40 30 0 0 55 - 60 75 - 80 40 - 45 0 45 - 50 80 - 85 35 - 40
Totals/Averages 503 50 % 15 % 35 % 32 % 163 58.0 % $93.00 $53.94 163 65.0 % $93.00 $60.45
* Specific occupancy and average rate data was utilized in our analysis, but is presented in ranges in the above table for the purposes of confidentiality.
Total Competitive
Level
Weighted Annual Room Count
Weighted Annual Room CountLe
isure
Com
mer
cial/G
over
nmen
t
Mee
ting
and
Grou
p

April-2017 Supply and Demand Analysis Hotel Arizona – Tucson, Arizona 77
We have identified one hotel that is expected to compete with the proposed subject hotel on a secondary level. The DoubleTree Suites by Hilton Tucson Airport is anticipated to be competitive based on its shared DoubleTree by Hilton brand affiliation; however, this hotel has been weighted secondarily competitive given its location in the airport submarket. We note that the Radisson Suites Tucson has been excluded from our analysis given its midscale brand affiliation and lower price point. It is important to consider any new hotels that may have an impact on the proposed subject hotel’s operating performance. The following chart sets forth the hotels that have recently opened, are under construction, or are in the stages of early development in the Tucson area. The list is categorized by the principal submarkets within the city.
FIGURE 4-20 AREA DEVELOPMENT ACTIVITY
Proposed Hotel Name Hotel Product Tier Development Stage AddressProposed Hotel 0
DowntownAC Hotels by Marriott 130 Ups cale Under Construction Q3 '17 151 E Broadway Blvd, Tucs on, AZ 85701Proposed Hampton Inn & Sui tes Mara na 100 Upper-Midsca le Approved Q2 '18 6401 W Marana Center Blvd, Tucson, AZ 85742Res idence Inn by Marriott Main Gate 140 Ups cale Approved Q4 '18 North Tyndal l Avenue and East Second StreetMoxy by Marriott 110 Upper-Midsca le Due Di l igence Period — 45 N. Fi fth Ave., near East Congres s Street.Proposed Convention Center Hotel 125 Upper-Midsca le Due Di l igence Period —Hampton Inn & Sui tes Convention Center 157 Upper-Midsca le Due Di l igence Period — 411 W. Congres s St., Tucson, AZ 85711
Estimated Number of
Rooms
Expected Qtr. & Year of Opening
Of the hotels listed in the preceding chart, we have identified the following new supply that is expected to have some degree of competitive interaction with the proposed subject hotel, based on location, anticipated market orientation and price point, and/or operating profile.
FIGURE 4-21 NEW SUPPLY
Total
Proposed PropertyNumber
of Rooms Competitive
LevelEstimated Opening
Date Development Stage
Propos ed Subject Property 309 100 % 309 January 1, 2019 Early DevelopmentAC Hotels by Marriott 130 80 104 August 1, 2017 Under Construction
Totals/Averages 439 413
Weighted Room Count
Supply Changes

April-2017 Supply and Demand Analysis Hotel Arizona – Tucson, Arizona 78
The proposed AC Hotel by Marriott will be similar to the subject property in terms of its full-service orientation and anticipated service level; however, this property has been weighted secondarily competitive in our analysis given its expected higher price point and lifestyle product type. It should be noted that other hotel projects are currently in the initial planning phases for Downtown Tucson and the area surrounding the University of Arizona. However, as these projects are still in the initial development stages and no confirmed information is available, they have only been considered qualitatively in our analysis. While we have taken reasonable steps to investigate proposed hotel projects and their status, due to the nature of real estate development, it is impossible to determine with certainty every hotel that will be opened in the future, or what their marketing strategies and effect in the market will be. Depending on the outcome of current and future projects, the future operating potential of the proposed subject hotel may be affected. Future improvement in market conditions will raise the risk of increased competition. Our forthcoming forecast of stabilized occupancy and average rate is intended to reflect such risk. We have identified various properties that are expected to be competitive to some degree with the proposed subject hotel. We have also investigated potential increases in competitive supply in this Tucson submarket. The Hotel Arizona should enter a dynamic market of varying product types and price points. Next, we will present our forecast for demand change, using the historical supply data presented as a starting point. The following table presents the most recent trends for the subject hotel market as tracked by HVS. These data pertain to the competitors discussed previously in this section; performance results are estimated, rounded for the competition, and in some cases weighted if there are secondary competitors present. In this respect, the information in the table differs from the previously presented STR data and is consistent with the supply and demand analysis developed for this report.
FIGURE 4-22 HISTORICAL MARKET TRENDS
Year
Es t. 2014 353,327 — 527,133 — 67.0 % $101.60 — $68.10 — Es t. 2015 360,783 2.1 % 527,133 0.0 % 68.4 103.07 1.5 % 70.54 3.6 %Es t. 2016 373,055 3.4 527,537 0.1 70.7 105.66 2.5 74.72 5.9
Avg. Annual Compounded Chg., Est. 2014-Est. 2016: 2.8 % 0.0 % 2.0 % 4.7 %
% ChangeMarket
Occupancy Market ADR% ChangeRoom Nights
Available % Change % ChangeMarket RevPAR
Accommodated Room Nights
Supply Conclusion
DEMAND

April-2017 Supply and Demand Analysis Hotel Arizona – Tucson, Arizona 79
For the purpose of demand analysis, the overall market is divided into individual segments based on the nature of travel. Based on our fieldwork, area analysis, and knowledge of the local lodging market, we estimate the 2016 distribution of accommodated-room-night demand as follows. FIGURE 4-23 ACCOMMODATED ROOM-NIGHT DEMAND
Marketwide
Market Segment
Commercial /Government 175,881 47 %Meeting and Group 94,880 25Leisure 102,294 27
Total 373,055 100 %
Accommodated Demand
Percentage of Total
The market’s demand mix comprises commercial/government demand, with this segment representing roughly 47% of the accommodated room nights in this Tucson submarket. The remaining portion comprises meeting and group at 25%, with the final portion leisure in nature, reflecting 27%. Using the distribution of accommodated hotel demand as a starting point, we will analyze the characteristics of each market segment in an effort to determine future trends in room-night demand. Commercial/government demand consists mainly of individual businesspeople passing through the subject market or visiting commercial firms or government institutions in the area, in addition to high-volume accounts generated by local agencies. Brand loyalty (particularly frequent-traveler programs), as well as location and convenience with respect to businesses and amenities, influence lodging choices in this segment. Companies typically designate hotels as “preferred” accommodations in return for significantly discounted rates, including government per-diem rates; negotiated rates are discounted in proportion to the number of room nights produced by a corporate client. Government per-diem rates are established annually. Demand within this segment is strongest Monday through Thursday nights, declines significantly on Friday and Saturday, and increases somewhat on Sunday night. It is relatively constant throughout the year, with marginal declines in late December and during other holiday periods. Commercial/government travel in the Tucson area is generated by the various companies and government entities located in the region. Corporate travel is generated by companies such as Raytheon, IBM, Ventana Medical Systems,
Demand Analysis Using Market Segmentation
Commercial/ Government Segment

April-2017 Supply and Demand Analysis Hotel Arizona – Tucson, Arizona 80
Freeport-McMoRan Copper & Gold, Caterpillar, and Banner - University Medical Center Tucson. Commercial demand is also derived from the University of Arizona and firms doing business with this institution. Government-related business is provided by Davis-Monthan Air Force Base, Pima County, the State of Arizona, and the U.S. Government, including entities such as the National Park Service and U.S. Border Patrol. Commercial travel to Tucson has steadily increased in recent years, and this trend has reportedly continued in 2017. The meeting and group market includes meetings, seminars, conventions, trade association shows, and similar gatherings of ten or more people. Peak convention demand typically occurs in the spring and fall. Although there are numerous classifications within the meeting and group segment, the primary categories considered in this analysis are corporate groups, associations, and SMERFE (social, military, ethnic, religious, fraternal, and educational) groups. Corporate groups typically meet during the business week, most commonly in the spring and fall months. These groups tend to be the most profitable for hotels, as they typically pay higher rates and usually generate ancillary revenues including food and beverage and/or banquet revenue. SMERFE groups are typically price-sensitive and tend to meet on weekends and during the summer months or holiday season, when greater discounts are usually available; these groups generate limited ancillary revenues. Association demand is generally divided on a geographical basis, with national, regional, and state associations representing the most common sources. Professional associations and/or those supported by members' employers often meet on weekdays, while other associations prefer to hold events on weekends. The profile and revenue potential of associations varies depending on the group and the purpose of the meeting or event. Meeting and group demand in this market represents a significant portion of overall demand and is generated by the extensive meeting space available within the competitive hotels and numerous resorts throughout Tucson. This segment is primarily driven by corporate groups, including those with locations in Tucson such as Raytheon and IBM, as well as national and local associations and SMERFE-related groups. This segment is also driven by larger national and local associations, government groups, and SMERFE groups. We note that these larger groups are currently being hosted at resort properties throughout the market because the closure of the subject property in 2012 has hindered the competitiveness of the Tucson Convention Center in recent years. We anticipate this segment to continue to improve as the national and local economies strengthen. Furthermore, the reopening of the subject property is expected to have a positive impact on the meeting and group segment, which will be detailed later in this report. We note that meetings and similar events are booked in advance; thus, growth in this segment is expected to intensify in the coming years.
Meeting and Group Segment

April-2017 Supply and Demand Analysis Hotel Arizona – Tucson, Arizona 81
Leisure demand consists of individuals and families spending time in an area or passing through en route to other destinations. Travel purposes include sightseeing, recreation, or visiting friends and relatives. Leisure demand also includes room nights booked through Internet sites such as Expedia, Hotels.com, and Priceline; however, leisure may not be the purpose of the stay. This demand may also include business travelers and group and convention attendees who use these channels to take advantage of any discounts that may be available on these sites. Leisure demand is strongest Friday and Saturday nights, and all week during holiday periods and the summer months. These peak periods represent the inverse of commercial visitation trends, underscoring the stabilizing effect of capturing weekend and summer tourist travel. Future leisure demand is related to the overall economic health of the region and the nation. Trends showing changes in state and regional unemployment and disposable personal income correlate strongly with leisure travel levels. A number of attractions in the Tucson market area contribute to transient leisure demand, particularly the array of world-class golf courses. Many leisure travelers come from colder, northern climates in search of a more temperate climate and mild winter. During the summer months, leisure-oriented travelers from Arizona, California, and other Southwestern states are more common, as these visitors tend to be price-sensitive and take advantage of Tucson’s comparatively cooler summer temperatures relative to Phoenix, which sits at a lower elevation. The national economic recession caused significant decreases in leisure travel and activities such as golfing. However, this segment began to recover in 2010, as leisure guests were taking advantage of the significant rate discounts. More recently, Tucson's Visitors Bureau launched television campaigns in Mexico and North America called "Vamos a Tucson" and "Free Yourself" to increase the number of travelers to the area. Demand related to these transient sources should remain strong, tapering to more modest levels throughout the projection period as properties seek to replace some lower-rated transient demand with higher-rated corporate group business. The purpose of segmenting the lodging market is to define each major type of demand, identify customer characteristics, and estimate future growth trends. Starting with an analysis of the local area, three segments were defined as representing the subject property’s lodging market. Various types of economic and demographic data were then evaluated to determine their propensity to reflect changes in hotel demand. Based on this procedure, we forecast the following average annual compounded market-segment growth rates.
Leisure Segment
Base Demand Growth Rates

April-2017 Supply and Demand Analysis Hotel Arizona – Tucson, Arizona 82
FIGURE 4-24 AVERAGE ANNUAL COMPOUNDED MARKET SEGMENT GROWTH RATES
Annual Growth RateMarket Segment
Commercia l /Government 2.5 % 3.0 % 3.0 % 2.5 % 1.5 % 0.5 %Meeting a nd Group 1.0 2.0 4.0 3.0 2.0 1.0Leisure 2.0 2.5 3.0 2.5 1.5 0.5
Base Demand Growth 2.0 % 2.6 % 3.3 % 2.6 % 1.6 % 0.6 %
2017 2018 2019 2020 2021 2022
A table presented earlier in this section illustrated the accommodated-room-night demand in the subject property’s competitive market. Because this estimate is based on historical occupancy levels, it includes only those hotel rooms that were used by guests. Latent demand reflects potential room-night demand that has not been realized by the existing competitive supply, further classified as either unaccommodated demand or induced demand. Unaccommodated demand refers to individuals who are unable to secure accommodations in the market because all the local hotels are filled. These travelers must defer their trips, settle for less desirable accommodations, or stay in properties located outside the market area. Because this demand did not yield occupied room nights, it is not included in the estimate of historical accommodated-room-night demand. If additional lodging facilities are expected to enter the market, it is reasonable to assume that these guests will be able to secure hotel rooms in the future, and it is therefore necessary to quantify this demand. Unaccommodated demand is further indicated if the market is at all seasonal, with distinct high and low seasons; such seasonality indicates that although year-end occupancy may not average in excess of 70%, the market may sell out certain nights during the year. To evaluate the incidence of unaccommodated demand in the market, we have reviewed the average occupancy by the night of the week for the past twelve months for the competitive set, as reflected in the STR data. This is set forth in the following table.
Latent Demand
Unaccommodated Demand

April-2017 Supply and Demand Analysis Hotel Arizona – Tucson, Arizona 83
FIGURE 4-25 OCCUPANCY BY NIGHT OF THE WEEK
Month Sunday Monday Tuesday Wednesday Thursday Friday Saturday Total Month
Nov - 15 45.9 % 66.7 % 72.2 % 75.7 % 68.5 % 77.8 % 78.2 % 68.4 %Dec - 15 29.9 40.7 46.1 47.0 50.2 53.0 56.0 46.3Jan - 16 32.2 51.4 61.8 66.1 53.8 53.3 57.5 53.2Feb - 16 45.4 49.5 64.6 75.5 71.8 60.4 69.1 61.9Mar - 16 35.6 54.0 64.3 62.2 56.6 64.1 61.1 57.3Apr - 16 37.1 55.8 66.0 71.3 66.4 69.5 70.3 62.8May - 16 50.3 58.3 72.6 82.4 80.4 81.1 78.1 70.8Jun - 16 49.0 67.7 77.5 75.7 60.3 62.6 66.3 65.7Jul - 16 39.4 50.2 58.7 62.3 58.7 55.9 63.9 55.3Aug - 16 42.4 45.3 54.0 56.0 56.9 64.1 72.1 55.4Sep - 16 51.0 63.0 77.3 81.1 69.6 68.6 74.5 69.3Oct - 16 39.6 53.8 81.8 91.8 79.6 63.9 66.0 66.6
Average 41.5 % 54.7 % 66.0 % 70.0 % 64.1 % 64.3 % 67.5 % 61.1 %
Source: STR
Our interviews with market participants found that the market generally sells out on Monday through Saturday nights during the peak travel season, as well as sporadically within other periods throughout the year. Special events, such as Tucson Gem & Mineral Show , regularly sell out competitive hotels. A portion of this demand, which is currently turned away, should return to the market concurrent with the supply increase. The following table presents our estimate of unaccommodated demand in the subject market. FIGURE 4-26 UNACCOMMODATED DEMAND ESTIMATE
Market Segment
Commercia l /Government 175,881 2.3 % 3,969Meeting and Group 94,880 2.1 1,962Leisure 102,294 0.8 828
Total 373,055 1.8 % 6,759
Unaccommodated Demand Percentage
Unaccommodated Room Night Demand
Accommodated Room Night Demand
Accordingly, we have forecast unaccommodated demand equivalent to 1.8% of the base-year demand, resulting from our analysis of monthly and weekly peak demand and sell-out trends.

April-2017 Supply and Demand Analysis Hotel Arizona – Tucson, Arizona 84
Induced demand represents the additional room nights that are expected to be attracted to the market following the introduction of a new demand generator. Situations that can result in induced demand include the opening of a new manufacturing plant, the expansion of a convention center, or the addition of a new hotel with a distinct chain affiliation or unique facilities. The following table summarizes our estimate of induced demand.
FIGURE 4-27 INDUCED DEMAND CALCULATION
Induced Room NightsMarket Segment
Commercia l/Government 0 0 0 0 0 0Meeting and Group 0 0 4,800 7,500 10,100 10,100Leisure 0 0 0 0 0 0
Total 0 0 4,800 7,500 10,100 10,100
2017 2018 2019 2020 2021 2022
The reopening of the proposed subject property and subsequent benefit to the Tucson Convention Center should induce meeting and group demand into this market. The hotel's reactivation should draw new groups to this market, as these groups with planned meetings would have likely chosen an alternate destination if it were not for the availability of the subject property's rooms. Further discussion related to the induced demand assumption is located in the addenda of this report. Accordingly, we have incorporated 10,000 room nights (rounded) into our analysis, phased in over an appropriate ramp-up period. Based upon a review of the market dynamics in the subject property’s competitive environment, we have forecast growth rates for each market segment. Using the calculated potential demand for the market, we have determined market-wide accommodated demand based on the inherent limitations of demand fluctuations and other factors in the market area. The following table details our projection of lodging demand growth for the subject market, including the total number of occupied room nights and any residual unaccommodated demand in the market.
Induced Demand
Accommodated Demand and Market-wide Occupancy
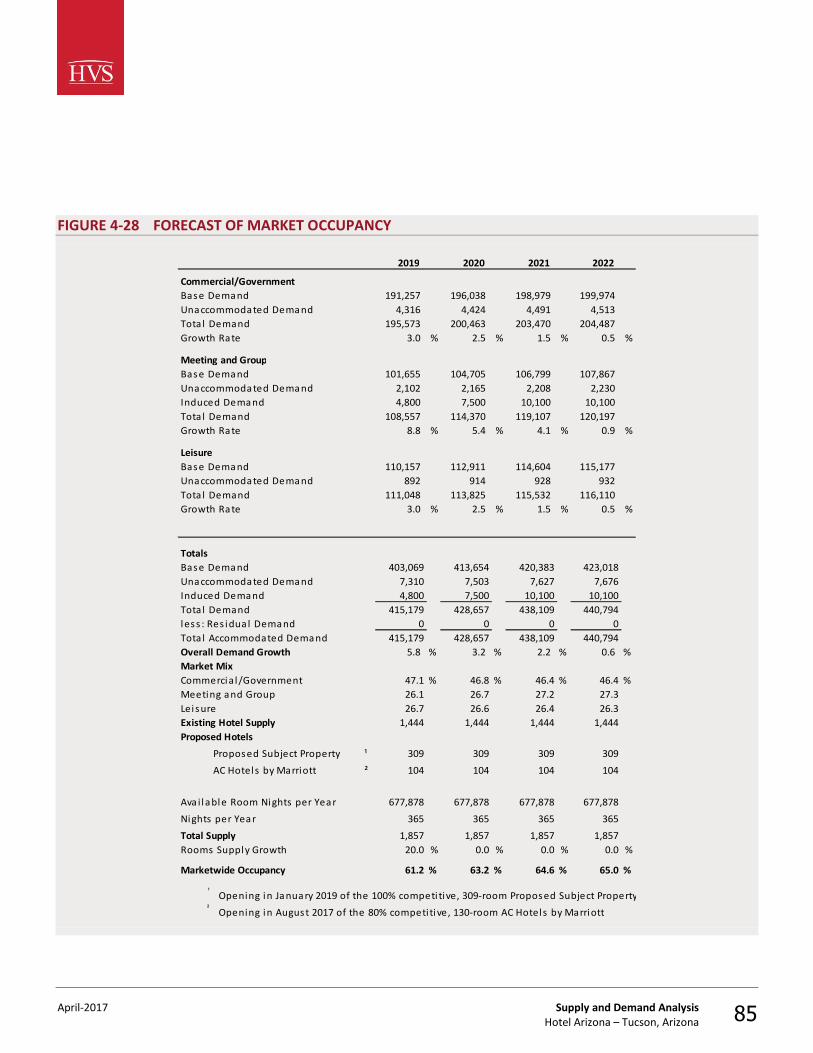
April-2017 Supply and Demand Analysis Hotel Arizona – Tucson, Arizona 85
FIGURE 4-28 FORECAST OF MARKET OCCUPANCY
191,257 196,038 198,979 199,974Unaccommodated Demand 4,316 4,424 4,491 4,513
195,573 200,463 203,470 204,487Growth Rate 3.0 % 2.5 % 1.5 % 0.5 %
101,655 104,705 106,799 107,8672,102 2,165 2,208 2,2304,800 7,500 10,100 10,100
108,557 114,370 119,107 120,1978.8 % 5.4 % 4.1 % 0.9 %
110,157 112,911 114,604 115,177892 914 928 932
111,048 113,825 115,532 116,1103.0 % 2.5 % 1.5 % 0.5 %
Base Demand 403,069 413,654 420,383 423,018Unaccommodated Demand 7,310 7,503 7,627 7,676Induced Demand 4,800 7,500 10,100 10,100Tota l Demand 415,179 428,657 438,109 440,794less : Res idua l Demand 0 0 0 0Tota l Accommodated Demand 415,179 428,657 438,109 440,794Overall Demand Growth 5.8 % 3.2 % 2.2 % 0.6 %Market Mix
47.1 % 46.8 % 46.4 % 46.4 %26.1 26.7 27.2 27.326.7 26.6 26.4 26.3
1,444 1,444 1,444 1,444
Proposed Subject Property ¹ 309 309 309 309AC Hotels by Marriott ² 104 104 104 104
Ava i lable Room Nights per Year 677,878 677,878 677,878 677,878Nights per Year 365 365 365 365Total Supply 1,857 1,857 1,857 1,857Rooms Supply Growth 20.0 % 0.0 % 0.0 % 0.0 %
Marketwide Occupancy 61.2 % 63.2 % 64.6 % 65.0 %
¹ Opening in January 2019 of the 100% competi tive, 309-room Proposed Subject Property² Opening in August 2017 of the 80% competitive, 130-room AC Hotels by Marriott
Lei sureExisting Hotel SupplyProposed Hotels
Totals
Commercial /GovernmentMeeting and Group
Induced DemandTota l DemandGrowth Rate
LeisureBase DemandUnaccommodated DemandTota l DemandGrowth Rate
Unaccommodated Demand
2022
Base Demand
Tota l Demand
Meeting and GroupBase Demand
Commercial/Government
2019 2020 2021

April-2017 Supply and Demand Analysis Hotel Arizona – Tucson, Arizona 86
The defined competitive market of hotels should experience consistent demand growth through the stabilized year although the entry of new supply will cause occupancy levels to fluctuate as the new hotels are absorbed in the market. Over the long term, the expected positive impact of the subject property's reopening on the Tucson Convention Center, coupled with the ongoing revitalization of Downtown Tucson, should contribute to steady demand increases. Based on historical occupancy levels in this market, and taking into consideration typical supply and demand cyclicality, market occupancy is forecast to stabilize in the mid-60s.

April-2017 Description of the Proposed Improvements Hotel Arizona – Tucson, Arizona 87
5. Description of the Proposed Improvements
The quality of a lodging facility's physical improvements has a direct influence on marketability, attainable occupancy, and average room rate. The design and functionality of the structure can also affect operating efficiency and overall profitability. This section investigates the subject property's proposed physical improvements and personal property in an effort to determine how they are expected to contribute to attainable cash flows. The Hotel Arizona will be a full-service lodging facility containing 309 rentable units. The 13-story property will reopen on January 1, 2019. The Hotel Arizona was built in conjunction with the Tucson Convention Center in the early 1970s and served as Downtown Tucson's primary convention lodging facility until its closure in 2012. The hotel originally opened as Braniff Place, and over the years it has been branded as a Marriott and Holiday Inn. The hotel is now expected to undergo a comprehensive renovation and reopen as a DoubleTree by Hilton (or similar brand), once again providing Downtown Tucson with a large, convention-oriented lodging facility. Furthermore, the hotel's reopening is expected to have a positive impact on the Tucson Convention Center, which will be discussed in more detail throughout this report.
Project Overview

April-2017 Description of the Proposed Improvements Hotel Arizona – Tucson, Arizona 88
EXISTING HOTEL ARIZONA EXTERIOR
Based on information provided by the proposed subject hotel’s development representatives, the following table summarizes the facilities that are expected to be available at the redeveloped subject hotel.
Summary of the Facilities

April-2017 Description of the Proposed Improvements Hotel Arizona – Tucson, Arizona 89
FIGURE 5-1 PROPOSED FACILITIES SUMMARY
Guestroom Configuration
ExistingQueen/Queen 160 King 120 Parlor 28 Pres identia l Sui te 1 Tota l 309
ProposedQueen/Queen 160 King 120 One-Bedroom Sui te 14 Parlor 14 Pres identia l Sui te 1
Tota l 309
Food & Beverage Facilities
Three Meal RestaurantSignature RestaurantLobby Bar and Lounge"Made Market"/Grab-n-Go
Indoor Meeting & Banquet Facilities
Lower LevelGrand Bal l room 10,000 Meeting Rooms 1-6 (600 SF each) 3,600
Lobby LevelStarl ight Ba l l room 5,500 Meeting Room A 3,000 Meeting Room B 1,300 Meeting Room C 800 Meeting Room D 600
Mezzanine LevelMeeting Room 1,200 Board Room 500 Tota l 26,500
Pre-Function Space 8,500
Amenities & Services
Outdoor Swimming Pool Bus iness CenterOutdoor Whirlpool Gi ft ShopFi tness Center Vending Area(s )
Infrastructure
Parking Spaces 350 ElevatorsLife-Safety SystemsConstruction Detai l s
Sprinklers , Smoke DetectorsReinforced Steel , Concrete
3 Guest, 1 Service, 2 Freight
Square Footage
Number of Units

April-2017 Description of the Proposed Improvements Hotel Arizona – Tucson, Arizona 90
Once guests enter the site, ample parking will be available in the stand-alone parking structure to the west of the hotel. We note that the hotel and parking structure are connected via two skywalks, which provide access from the fourth floor of the parking structure to the second floor of the hotel building. Site improvements should include monument signage, which is expected to be located on the northern and western sides of the site (additional signage is anticipated to be placed on the exterior of the building). We assume that all signage will adequately identify the property and meet brand standards. Planned landscaping should allow for a positive guest impression and competitive exterior appearance. Sidewalks will be present along the front entrance and around the perimeter of the hotel and parking structure. Other site improvements will include a third-story outdoor pool with sundeck and a loading dock/service area toward the rear of the property. Overall, the planned and existing site improvements for the property appear adequate. The hotel structure comprises one hotel building and one parking structure, both constructed of steel and reinforced concrete. The hotel's stucco exterior and the parking structure's concrete exterior will be refurbished to provide an aesthetically appealing exterior. Multiple stairways, three guest elevators, one service elevator, and two freight elevators will provide internal vertical transportation within the main hotel structure. Multiple stairways will provide vertical transportation within the parking structure. The hotel's roof is constructed of concrete and a rubber-membrane roofing system. Portions of the roof are expected to be replaced as part of the hotel's redevelopment. Several of the hotel's windows are expected to be replaced to reduce noise transmission into the rooms. Heating and cooling will continue to be provided by through-the-wall units and several large units for the public areas; however, these systems are expected to receive a comprehensive overhaul as part of the hotel's redevelopment. Overall, the planned and existing building components appear normal for a hotel of this type and should meet the standards for this market. We assume that all structural components will meet local building codes and that no significant defaults will occur during construction that would affect the future operating potential of the hotel or delay its assumed opening date. Guests will enter the hotel's Broadway Boulevard entrance through a single set of automatic doors on the second floor of the property. Similar entrances will be available on either the first or second levels of the west, east, and south sides of the hotel. The lobby will be spacious, appropriate for a DoubleTree by Hilton or similar upscale, full-service brand. A grand staircase will connect guests to the main meeting space area on the hotel's lower level and additional meeting space and select guestrooms on the mezzanine (third) level. The lobby walls should be attractively refinished with an upscale material that is in line with brand standards. The new front desk should feature a stone countertop, installed with appropriate
Site Improvements and Hotel Structure
Lobby

April-2017 Description of the Proposed Improvements Hotel Arizona – Tucson, Arizona 91
property management and telephone systems. The all new furnishings and finishes in this space should offer an appropriate first impression, and the design of the space should lend itself to adequate efficiency. The specific design concept will be finalized with input from the pursued future brand for the redeveloped subject property. We assume that all property management and guestroom technology will be appropriately installed for the effective management of hotel operations. EXISTING HOTEL ARIZONA LOBBY
The hotel is expected to include a fully renovated signature restaurant and a three-meal restaurant, as well as a lobby bar and lounge. All three outlets will be located on the east side of the reception area on the second-floor lobby. A major focus in the food and beverage department will be the banquet operations, given the hotel's extensive offering of indoor meeting space. Each area's existing size and layout appear appropriate for the hotel. The furnishings of the spaces will be of a similar style and finish as lobby and guestroom furnishings.
Food and Beverage Facilities

April-2017 Description of the Proposed Improvements Hotel Arizona – Tucson, Arizona 92
EXISTING HOTEL ARIZONA DINING AREA
Overall, the hotel is expected to provide a competitive offering of food and beverage facilities for an upscale, full-service convention property. The subject property will offer a significant amount of renovated meeting space throughout the property. Indoor meeting space, exclusive of pre-function areas, is planned to span approximately 26,500 square feet. The hotel's primary ballroom, six breakout meeting rooms, and an appropriate complement of pre-function space will be located on the lower level. Additional meeting space is located on the lobby and mezzanine levels. All existing meeting rooms and adjacent public spaces will be comprehensively renovated as part of the hotel's planned redevelopment.
Meeting and Banquet Space

April-2017 Description of the Proposed Improvements Hotel Arizona – Tucson, Arizona 93
EXISTING HOTEL ARIZONA BALLROOM
The hotel will offer a fitness center, tentatively planned for a vacant space adjacent to the hotel's front desk. The hotel will also offer a third-story outdoor pool, outdoor whirlpool, and sundeck. This area was reportedly in operable condition; however, renovations are expected to take place to meet the selected brand's standards. Other fully renovated amenities are expected to include a full-service business center with various workstations, a gift shop (featuring a grab-n-go market), wireless Internet access in the public areas, and possible retail boutiques. Ice machines are anticipated to be located on all guestroom floors. Overall, the supporting facilities appear to be appropriate for a hotel of this type, and we assume that they will meet brand standards. The hotel currently features standard guestroom configurations and parlor-style rooms. We note that a presidential suite is located on the thirteenth floor of the hotel. The hotel's parlor rooms are located throughout the structure; each parlor serves as a living room that can be connected to standard guestrooms on either side to create a one- or two-bedroom suite. HVS recommends that a portion of these parlor-style rooms be converted to one-bedroom suites as part of the hotel's redevelopment. This is expected to provide future management with the ability to better leverage its rentable inventory, while still maintaining the flexibility of the remaining parlor-style rooms. We note that parlor rooms should feature bathrooms and hide-away beds, allowing them to be used as sellable guestrooms during high-occupancy periods. All guestrooms will offer typical amenities for this upscale
Recreational Amenities
Additional Amenities
Guestrooms

April-2017 Description of the Proposed Improvements Hotel Arizona – Tucson, Arizona 94
product type. In addition to the standard furnishings, rooms are expected to feature an iron and ironing board, a coffeemaker, an alarm clock with iPod docking station, and high-speed Internet access. Overall, the guestrooms should offer a competitive product for this Downtown Tucson neighborhood. Guestroom bathrooms are of a standard size, with either a shower-in-tub or stand-alone shower, commode, and single sink with vanity area, featuring a stone countertop. As part of the property-wide renovation, the floors should be finished with tile, and the walls should be finished with an upscale material that is in line with brand standards. Bathroom amenities will include a hairdryer and complimentary toiletries. Overall, the bathroom design should be appropriate for a product of this type. EXISTING HOTEL ARIZONA SHOWROOM

April-2017 Description of the Proposed Improvements Hotel Arizona – Tucson, Arizona 95
EXISTING HOTEL ARIZONA SHOWROOM CONT.
EXISTING HOTEL ARIZONA SHOWROOM CONT.

April-2017 Description of the Proposed Improvements Hotel Arizona – Tucson, Arizona 96
EXISTING HOTEL ARIZONA SHOWROOM CONT.
The interior guestroom corridors are wide and functional, permitting the easy passage of housekeeping carts. Corridor carpet, wallcovering, signage, and lighting should be in keeping with the overall look and design of the rest of the property. The hotel will be served by the necessary back-of-the-house space, including an in-house laundry facility, administrative offices, and a full-service kitchen (lobby level) and prep kitchen (lower level) to serve the needs of the restaurants and banquet operations. These spaces will be comprehensively renovated and should be adequate for a hotel of this type, allowing for the efficient operation of the property under competent management. We assume that the property will be redeveloped according to all pertinent codes and brand standards. Moreover, we assume its redevelopment will not create any environmental hazards (such as mold) and that the property will fully comply with the Americans with Disabilities Act. Our analysis assumes that, after its opening, the hotel will require ongoing upgrades and periodic renovations in order to maintain its competitive level in this market and to remain compliant with brand standards. These costs should be adequately funded by the forecasted reserve for replacement, as long as a successful, ongoing preventive-maintenance program is employed by hotel staff.
Back-of-the-House
ADA and Environmental
Capital Expenditures

April-2017 Description of the Proposed Improvements Hotel Arizona – Tucson, Arizona 97
The construction budget for the 309-room subject hotel, as provided by the project developer, is illustrated in the following table.
Construction Budget

April-2017 Description of the Proposed Improvements Hotel Arizona – Tucson, Arizona 98
FIGURE 5-2 SUBJECT PROPERTY CONSTRUCTION BUDGET
Component
General/Fire Safety$525,000 $1,699
410,000 1,327$935,000 $3,026
Basic Standard Issues$400,000 $1,294
350,000 1,133 645,000 2,087
Subtotal Bas ic Standa rd Iss ues 1,395,000 $4,515Site
$115,000 $37275,000 243
342,000 1,107$532,000 $1,722
Building Exterior$170,000 $550
25,000 81100,000 324800,000 2,589
$1,095,000 $3,544 Public Areas
$455,000 $1,472 20,000 65
320,000 1,036$795,000 $2,573
Food and Beverage Facilities $250,000 $809
150,000 485500,000 1,618
$900,000 $2,913 Meeting Spaces
$335,000 $1,084 72,500 235
150,000 48550,000 162
100,000 32460,000 194
$767,500 $2,484 Recreational Areas
$150,000 $485 310,000 1,003
$460,000 $1,489 Back of House
$250,000 $809 250,000 809
57,500 18675,000 243
$632,500 $2,047 Guest Support and Circulation Areas
$66,000 $214 15,000 49
510,000 1,650130,000 421150,000 485
60,000 194$931,000 $3,013
Guest Rooms$6,545,000 $21,181
55,000 1782,397,000 7,757
$8,997,000 $29,117
Total $17,440,000 $56,440
Subtotal Guest Rooms
Subtotal Guest Support and Ci rculation Areas
GuestroomsSpecia l ty Sui tesGuest Bathrooms
Guest LaundryCorridorsElevator LobbiesElevatorsSta i rwel l s
Main LaundryStorage RoomsService Corridors
Subtotal Back of Hous e
Vending
Fi tnes s CenterPool Areas
Subtotal Recreationa l Areas
General
Subtotal Meeting Spaces
Bal l rooms Meeting Room Pre-FunctionMeeting Rooms
Subtotal Publ ic Areas
Lounge Faci l i tiesResta urant Faci l i tiesKi tchens
Subtotal Food and Beverage Fa ci l i ties
Cost per RoomCost
General
Subtotal Si te
GroundsSignage
Structure
Subtotal General/Fi re Safety
Entrance/Lobby/Registration AreaRetai l ShopPubl ic Restrooms
Bui ldingPorte Cochere
Subtotal Exterior
Parking
Fi re Safety
TechnologyMechanical/Electrica l/Plumbing
DoorsWindows
GeneralBal l room Pre-Function
Board Rooms

April-2017 Description of the Proposed Improvements Hotel Arizona – Tucson, Arizona 99
Overall, the proposed subject hotel should offer a well-designed, functional layout of support areas and guestrooms. All typical and market-appropriate features and amenities should be included in the hotel's design. We assume that the building will be fully open and operational on the stipulated opening date and will meet all local building codes and brand standards. Furthermore, we assume that the hotel staff will be adequately trained to allow for a successful opening and that pre-marketing efforts will have introduced the product to major local accounts at least six months in advance of the opening date.
Conclusion

April-2017 Projection of Occupancy and Average Rate Hotel Arizona – Tucson, Arizona 100
6. Projection of Occupancy and Average Rate
Along with average rate results, the occupancy levels achieved by a hotel are the foundation of the property's financial performance and market value. Most of a lodging facility's other revenue sources (such as food, beverages, other operated departments, and rentals and other income) are driven by the number of guests, and many expense levels vary with occupancy. To a certain degree, occupancy attainment can be manipulated by management. For example, hotel operators may choose to lower rates in an effort to maximize occupancy. Our forecasts reflect an operating strategy that we believe would be implemented by a typical, professional hotel management team to achieve an optimal mix of occupancy and average rate. The subject property's forecasted market share and occupancy levels are based upon its anticipated competitive position within the market, as quantified by its penetration rate. The penetration rate is the ratio of a property's market share to its fair share. In the following table, the penetration rates attained by the primary competitors and the aggregate secondary competitors are set forth for each segment for the base year.
FIGURE 6-1 HISTORICAL PENETRATION RATES
Over
all
Com
mer
cial/
Gove
rnmen
t
Mee
ting a
nd
Grou
p
Leisu
re
Property
DoubleTree Sui tes by Hi l ton Tucson Wi l l iams Center 97 % 108 % 67 % 92 %DoubleTree by Hi l ton Tucson Reid Park 114 106 98 107Tucson Univers i ty Park Hotel 95 132 122 112Hi l ton Tucson East 122 103 76 105Sheraton Hotel & Sui tes Tucs on 68 95 88 81Aloft Tucson Univers i ty 99 81 132 103Secondary Competi tion 97 54 117 92
Over
all
Com
mer
cial/
Gove
rnmen
t
Mee
ting a
nd
Grou
p
Leisu
re
The Hilton Tucson East achieved the highest penetration rate within the commercial/government segment. The highest penetration rate in the meeting and
Penetration Rate Analysis
Historical Penetration Rates by Market Segment

April-2017 Projection of Occupancy and Average Rate Hotel Arizona – Tucson, Arizona 101
group segment was achieved by the Tucson University Park Hotel, while the Aloft Tucson University led the market with the highest leisure penetration rate. Because the supply and demand balance for the competitive market is dynamic, there is a circular relationship between the penetration factors of each hotel in the market. The performance of individual new hotels has a direct effect upon the aggregate performance of the market, and consequently upon the calculated penetration factor for each hotel in each market segment. The same is true when the performance of existing hotels changes, either positively (following a refurbishment, for example) or negatively (when a poorly maintained or marketed hotel loses market share). A hotel’s penetration factor is calculated as its achieved market share of demand divided by its fair share of demand. Thus, if one hotel’s penetration performance increases, thereby increasing its achieved market share, this leaves less demand available in the market for the other hotels to capture and the penetration performance of one or more of those other hotels consequently declines (other things remaining equal). This type of market share adjustment takes place every time there is a change in supply, or a change in the relative penetration performance of one or more hotels in the competitive market. Our projections of penetration, demand capture, and occupancy performance for the subject property account for these types of adjustments to market share within the defined competitive market. The proposed subject hotel's occupancy forecast is set forth as follows, with the adjusted projected penetration rates used as a basis for calculating the amount of captured market demand.
Forecast of Subject Property’s Occupancy

April-2017 Projection of Occupancy and Average Rate Hotel Arizona – Tucson, Arizona 102
FIGURE 6-2 FORECAST OF SUBJECT PROPERTY'S OCCUPANCY
Market Segment
Commercial/GovernmentDema nd 195,573 200,463 203,470 204,487Ma rket Share 12.6 % 15.1 % 15.9 % 15.9 %Capture 24,661 30,231 32,298 32,459Penetrati on 76 % 91 % 95 % 95 %
Meeting and GroupDema nd 108,557 114,370 119,107 120,197Ma rket Share 22.2 % 23.4 % 24.0 % 24.6 %Capture 24,053 26,779 28,619 29,606Penetrati on 133 % 141 % 144 % 148 %
LeisureDema nd 111,048 113,825 115,532 116,110Ma rket Share 11.1 % 11.9 % 12.7 % 12.7 %Capture 12,316 13,550 14,677 14,751Penetrati on 67 % 72 % 76 % 76 %
Total Room Nights Captured 61,030 70,560 75,594 76,816Avai lable Room Ni ghts 112,785 112,785 112,785 112,785
Subject Occupancy 54 % 63 % 67 % 68 %Ma rket-wide Avai lable Room Ni ghts 677,878 677,878 677,878 677,878
Fair Share 17 % 17 % 17 % 17 %Ma rket-wide Occupied Room Nights 415,179 428,657 438,109 440,794
Market Share 15 % 16 % 17 % 17 %Market-wide Occupancy 61 % 63 % 65 % 65 %Total Penetration 88 % 99 % 104 % 105 %
2019 2020 2021 2022
The redeveloped subject hotel is expected to stabilize with a strong penetration rate due to its new facility, its expected strong nationally recognized brand affiliation, and its favorable location adjacent to the Tucson Convention Center in Downtown Tucson. As such, the subject property is anticipated to stabilize with a penetration level above 100%. Additional insights by segment are presented as follows:
• Within the commercial segment, the proposed subject hotel’s occupancy penetration is positioned at a slightly below-market-average level by the stabilized period due to its overall marketing focus on meeting and group demand. Nonetheless, travelers seeking an upscale, full-service hotel, as well as convenient access to several major employers in Downtown Tucson,

April-2017 Projection of Occupancy and Average Rate Hotel Arizona – Tucson, Arizona 103
will be drawn to the revitalized subject property. The proposed subject hotel will be favorably suited for corporate demand given the hotel's anticipated affiliation with a nationally recognized brand, which should assist in capturing corporate demand associated with travelers loyal to the selected brand.
• The revitalized subject hotel's penetration level in the meeting and group segment is positioned well-above its existing competitors. The subject hotel's adjacent location to the Tucson Convention Center should allow it to become the foremost choice for meetings and events taking place at the facility. Furthermore, the subject hotel is expected to offer a considerable amount of in-house meeting space, which should increase its ability to capture large meetings and events. The subject hotel's ability to capture this demand will be supported by the anticipated experience and sophistication of the selected brand's sales and marketing operation.
• The redeveloped subject hotel is forecast to realize a leisure penetration level below fair share by the stabilized year. Nonetheless, the subject hotel should benefit from a strong amount of leisure demand during the peak season and weekends, considering its proximity to the University of Arizona and several retail outlets, restaurants, and entertainment venues throughout Downtown Tucson.
These positioned segment penetration rates result in the following market segmentation forecast. FIGURE 6-3 MARKET SEGMENTATION FORECAST – SUBJECT PROPERTY
Commercia l /Government 40 % 43 % 43 % 42 %Meeting and Group 39 38 38 39Leisure 20 19 19 19
Total 100 % 100 % 100 % 100 %
2019 2020 2021 2022
Based on our analysis of the proposed subject hotel and market area, we have selected a stabilized occupancy level of 68%. The stabilized occupancy is intended to reflect the anticipated results of the property over its remaining economic life, given all changes in the life cycle of the hotel. Thus, the stabilized occupancy excludes from consideration any abnormal relationship between supply and demand, as well as any nonrecurring conditions that may result in unusually high

April-2017 Projection of Occupancy and Average Rate Hotel Arizona – Tucson, Arizona 104
or low occupancies. Although the subject property may operate at occupancies above this stabilized level, we believe it equally possible for new competition and temporary economic downturns to force the occupancy below this selected point of stability. One of the most important considerations in estimating the value of a lodging facility is a supportable forecast of its attainable average rate, which is more formally defined as the average rate per occupied room. Average rate can be calculated by dividing the total rooms revenue achieved during a specified period by the number of rooms sold during the same period. The projected average rate and the anticipated occupancy percentage are used to forecast rooms revenue, which in turn provides the basis for estimating most other income and expense categories. Although the average rate analysis presented here follows the occupancy projection, these two statistics are highly correlated; in reality, one cannot project occupancy without making specific assumptions regarding average rate. This relationship is best illustrated by revenue per available room (RevPAR), which reflects a property's ability to maximize rooms revenue. The following table summarizes the historical average rate and the RevPAR of the subject property’s future primary competitors.
Average Rate Analysis
Competitive Position

April-2017 Projection of Occupancy and Average Rate Hotel Arizona – Tucson, Arizona 105
FIGURE 6-4 BASE-YEAR AVERAGE RATE AND REVPAR OF THE COMPETITORS
Property
DoubleTree Sui tes by Hi l ton Tucson Wi l l iams Center
$110 - $115 100 - 110 % $70 - $75 95 - 100 %
DoubleTree by Hi l ton Tucson Reid Park
95 - 100 85 - 90 70 - 75 95 - 100
Tucson Uni vers i ty Pa rk Hotel 130 - 140 130 - 140 105 - 110 140 - 150
Hi l ton Tucson East 85 - 90 80 - 85 60 - 65 85 - 90
Sheraton Hotel & Suites Tucson 85 - 90 80 - 85 45 - 50 65 - 70
Al oft Tucson Univers i ty 125 - 130 110 - 120 90 - 95 120 - 130
Average - Prima ry Competi tors $107.13 101.4 % $76.54 102.4 %
Average - Seconda ry Competi tors 93.00 88.0 60.45 80.9
Overall Average $105.66 $74.72
Estimated 2016 Average Room
RateAverage Room
Rate Penetration
Rooms Revenue Per Available
Room (RevPAR)RevPAR
Penetration
The defined primarily competitive market realized an overall average rate of $107.13 in the 2016 base year, improving from the 2015 level of $104.14. The Tucson University Park Hotel (formerly the Marriott) achieved the highest estimated average rate in the local competitive market, by a significant margin, because of its previous strong Marriott brand affiliation and advantageous location next to the University of Arizona. An important rate aspect of this market is the strong demand during February and March and special events at the University of Arizona, which allow area hotels to charge premium rates. The selected rate position for the redeveloped subject hotel, in base-year dollars, takes into consideration factors such as its anticipated national brand affiliation and its location in Downtown Tucson near the Tucson Convention Center and shopping and entertainment venues. To arrive at a base year average rate conclusion for the subject property, we analyzed the estimated performance of the primary competitiors. We chose to benchmark the subject properties average rate potential against the 2016 calendar

April-2017 Projection of Occupancy and Average Rate Hotel Arizona – Tucson, Arizona 106
year performance of the Tucson Unversity Park Hotel, which operated as a Marriott hotel that year. The former Marriott is perceived to represent the market’s average rate ceiling for upscale, full-service accomodations. The below tables illustrate the market and locational adjustments applied to the former Marriott’s 2016 performance, allowing us to arrive at a base year average rate assumption for the redeveloped subject property. FIGURE 6-5 SUBJECT PROPERTY AVERAGE RATE POSITIONING
Marriott Hotel Brand Average $172.00Tucson Univers i ty Park Hotel (Former Marriott) 140.00Percent Correction for Tucson Market -18.6 %
DoubleTree by Hi l ton Brand Average $136.00Less : Tucson Market Correcti on -18.6 %DoubleTree ADR with Market Correction $110.70
(Say) $111.00
*2016 calendar year average rate indications have been estimated for the purpose of analysis

April-2017 Projection of Occupancy and Average Rate Hotel Arizona – Tucson, Arizona 107
FIGURE 6-6 SUBJECT PROPERTY AVERAGE RATE POSITIONING CONT.
Aloft Tucson Univers i ty $125.00Tucson Univers i ty Park Hotel (Former Marriott) 138.00Average Ra te for Superior Loca tion nea r U of A $131.50
DoubleTree Suites by Hi l ton Tucson Wi l l i ams Center $112.00DoubleTree by Hi l ton Tucson Reid Park 95.00Hi l ton Tucson East 90.00Sheraton Hotel & Sui tes Tucson 90.00Average Ra te for Inferior Location in Tucson $96.75
Average Ra te for Superior Loca tion nea r U of A $131.50Average Ra te for Inferior Location in Tucson $96.75Percent Premium for Superior Location near U of A 26.4 %
(Say) 26.0
*2016 calendar year average rate indications have been estimated for the purpose of analysis
Percent Premium for Superior Location near U of A 26.0 %Less : Correction for Inferior Downtown Location (50% reduction) -13.0Downtown Tucs on Percent Premium Assumption 13.0 %
FIGURE 6-7 SUBJECT PROPERTY AVERAGE RATE POSITIONING CONT.
DoubleTree ADR wi th Market Correction $111.00Plus : Downtown Tucson Percent Premium Assumption 13.0 % Subject Property ADR Positioning $125.43
(Say) $125.00
We have selected the rate position of $125.00, in base-year dollars, for the proposed subject hotel. Market-wide rates began to trend upward in 2013, with stronger increases taking place in 2015 and 2016. We expect average rates to continue to grow because of an improving job market in the metropolitan area, supported by the relocation or expansion of many companies, as well as the gradual return of high-rated groups to the market and less rate-resistance from leisure travelers. Based on these considerations, the following table illustrates the projected average rate and the growth rates assumed. As a context for the average rate growth factors,

April-2017 Projection of Occupancy and Average Rate Hotel Arizona – Tucson, Arizona 108
note that we have applied underlying inflation rates of 2.0%, 2.5%, and 3.0% thereafter for each respective year following the base year of 2016.

April-2017 Projection of Occupancy and Average Rate Hotel Arizona – Tucson, Arizona 109
FIGURE 6-8 COMPARISON OF HISTORICAL AND PROJECTED OCCUPANCY, AVERAGE RATE, AND REVPAR – PROPOSED SUBJECT PROPERTY AND MARKET
2014 2015 2016 2017 2018 2019 2020 2021 2022
Hotel Arizona
Occupancy — — 54.1 % 62.6 % 67.0 % 68.1 %Cha nge in Points — — — 8.4 4.5 1.1Occupancy Penetrati on — — 88.4 % 98.9 % 103.7 % 104.7 %
Average Ra te $125.00 $130.63 $135.85 $139.93 $144.12 $148.45 $152.90Cha nge — 4.0 % 3.0 % 3.0 % 3.0 % 3.0 %Average Ra te Penetrati on 118.3 % 118.3 % 118.3 % 118.3 % 118.3 % 118.3 %
RevPAR — — $75.72 $90.17 $99.50 $104.14Cha nge — — — 19.1 % 10.3 % 4.7 %RevPAR Penetra tion — — 104.5 % 117.0 % 122.7 % 123.9 %
2015 2015 2016 2017 2018 2019 2020 2021 2022
Tucson SubmarketOccupancy 67.0 % 68.4 % 70.7 % 70.2 % 69.5 % 61.2 % 63.2 % 64.6 % 65.0 %Cha nge in Points — 1.4 2.3 (0.5) (0.8) (8.2) 2.0 1.4 0.4
Average Ra te $101.60 $103.07 $105.66 $110.42 $114.83 $118.28 $121.83 $125.48 $129.24Cha nge — 1.5 % 2.5 % 4.5 % 4.0 % 3.0 % 3.0 % 3.0 % 3.0 %
RevPAR $68.10 $70.54 $74.72 $77.53 $79.75 $72.44 $77.04 $81.10 $84.04Cha nge — 3.6 % 5.9 % 3.8 % 2.9 % (9.2) % 6.3 % 5.3 % 3.6 %
* The forecast for the proposed subject property does not include rate discounts that are expected to occur during the initial year(s) of operation.
Projected
Historical (Estimated) Projected

April-2017 Projection of Occupancy and Average Rate Hotel Arizona – Tucson, Arizona 110
The final forecast reflects years beginning on January 1, 2019 and corresponds with our financial projections, as shown below.
FIGURE 6-9 MARKET AND SUBJECT PROPERTY AVERAGE RATE FORECAST
Calendar Year 2016 2017 2018 2019 2020 2021 2022 2023 2024
Market ADR $105.66 $110.42 $114.83 $118.28 $121.83 $125.48 $129.24 $133.12 $137.12Projected Market ADR Growth Ra te — 4.5% 4.0% 3.0% 3.0% 3.0% 3.0% 3.0% 3.0%
Proposed Subject Property ADR (Before Discount) $125.00 $130.63 $135.85 $139.93 $144.12 $148.45 $152.90 $157.49 $162.21ADR Growth Rate — 4.5% 4.0% 3.0% 3.0% 3.0% 3.0% 3.0% 3.0%
Proposed Subject ADR Penetra tion (Before Discount) 118% 118% 118% 118% 118% 118% 118% 118% 118.3%
Fiscal Year 2019 2020 2021 2022 2023 2024
Proposed Subject Property Average Rate $139.93 $144.12 $148.45 $152.90 $157.49 $162.21Opening Discount 3.0% 2.0% 0.0% 0.0% 0.0% 0.0%
Average Rate After Discount $135.73 $141.24 $148.45 $152.90 $157.49 $162.21
Real Average Rate Growth — 4.1% 5.1% 3.0% 3.0% 3.0%
Market ADR $118.28 $121.83 $125.48 $129.24 $133.12 $137.12Proposed Subject ADR Penetra tion (After Discount) 115% 116% 118% 118% 118% 118%
ADR Expressed in Base-Year Dol lars Deflated @ Infla tion Rate $127.34 $127.34 $129.94 $129.94 $129.94 $129.94
As illustrated above, a 4.5%% rate of change is expected for the proposed subject hotel's positioned 2016 room rate in 2017. This is followed by growth rates of 4.0%% and 3.0%% in 2018 and 2019, respectively. The Tucson market should experience rate growth through the near term. The proposed subject hotel's rate position should reflect growth similar to market trends because of the proposed hotel's renovated facility, anticipated strong brand affiliation, and location in Downtown Tucson next to the Tucson Convention Center. The proposed subject hotel’s penetration rate is forecast to reach 118.3% by the stabilized period. A new property must establish its reputation and a client base in the market during its ramp-up period; as such, the proposed subject hotel’s average rates in the initial operating period have been discounted to reflect this likelihood. We forecast 3.0% and 2.0% discounts to the proposed subject hotel’s forecast room rates in the first two operating years, which would be typical for a new operation of this type.

April-2017 Projection of Income and Expense Hotel Arizona – Tucson, Arizona 111
7. Projection of Income and Expense
In this chapter of our report, we have compiled a forecast of income and expense for the proposed subject hotel. This forecast is based on the facilities program set forth previously, as well as the occupancy and average rate forecast discussed previously. The forecast of income and expense is expressed in current dollars for each year. The stabilized year is intended to reflect the anticipated operating results of the property over its remaining economic life, given any or all applicable stages of build-up, plateau, and decline in the life cycle of the hotel. Thus, income and expense estimates from the stabilized year forward exclude from consideration any abnormal relationship between supply and demand, as well as any nonrecurring conditions that may result in unusual revenues or expenses. The ten-year period reflects the typical holding period of large real estate assets such as hotels. In addition, the ten-year period provides for the stabilization of income streams and comparison of yields with alternate types of real estate. The forecasted income streams reflect the future benefits of owning specific rights in income-producing real estate. In order to project future income and expense for the proposed subject hotel, we have included a sample of individual comparable operating statements from our database of hotel statistics. All financial data are presented according to the three most common measures of industry performance: ratio to sales (RTS), amounts per available room (PAR), and amounts per occupied room night (POR). These historical income and expense statements will be used as benchmarks in our forthcoming forecast of income and expense.
Comparable Operating Statements

April-2017 Projection of Income and Expense Hotel Arizona – Tucson, Arizona 112
FIGURE 7-1 COMPARABLE OPERATING STATEMENTS: RATIO TO SALES
Comp 1 Comp 2 Comp 3 Comp 4 Comp 5 Subject
Year: 2015/16 2015/16 2015 2014/15 2015/16 2016Meeting Space: 26,215 27,900 30,000 33,000 16,000 26,500
F&B Outlets: 3 2 3 4 2 3Number of Rooms: 340 to 430 220 to 280 300 to 370 300 to 380 320 to 400 309
Days Open: 365 365 363 365 365 365Occupancy: 69% 80% 69% 64% 64% 68%
Average Rate: $145 $138 $131 $132 $143 $130RevPAR: $100 $110 $90 $84 $92 $88
REVENUE Rooms 67.0 % 69.2 % 63.8 % 64.2 % 65.0 % 61.8 % Food & Beverage 25.1 30.1 34.3 35.1 34.2 35.1 Other Operated Departments 7.2 0.6 0.0 0.3 0.2 2.4
Miscel laneous Income 0.7 0.2 1.9 0.4 0.5 0.7 Tota l 100.0 100.0 100.0 100.0 100.0 100.0 DEPARTMENTAL EXPENSES* Rooms 17.8 18.0 21.2 23.0 22.2 19.0 Food & Beverage 62.7 68.7 54.9 60.7 53.5 60.3 Other Operated Departments 58.4 77.9 0.0 258.6 43.5 70.0 Tota l 31.9 33.5 33.0 36.9 32.8 34.6DEPARTMENTAL INCOME 68.1 66.5 67.0 63.1 67.2 65.4OPERATING EXPENSES Adminis trative & General 7.8 9.2 7.7 5.9 4.7 7.3 Info. and Telecom. Sys tems 1.2 0.5 0.0 0.0 1.5 1.1 Marketing 9.2 9.2 11.4 8.0 6.0 6.9 Franchise Fee 3.1 5.1 3.2 4.1 4.8 5.6 Property Operations & Maintenance 3.7 5.3 4.1 4.4 2.8 3.8 Uti l i ties 6.7 4.7 4.0 5.7 3.5 3.6 Tota l 31.7 34.0 30.5 28.1 23.2 28.4HOUSE PROFIT 36.4 32.5 36.5 35.0 44.0 37.1Management Fee 3.0 3.5 2.8 2.8 2.9 3.0INCOME BEFORE FIXED CHARGES 33.4 28.9 33.7 32.3 41.1 34.1
* Departmental expense ratios are express ed as a percentage of departmental revenues
Stabilized $

April-2017 Projection of Income and Expense Hotel Arizona – Tucson, Arizona 113
FIGURE 7-2 COMPARABLE OPERATING STATEMENTS: AMOUNTS PER AVAILABLE ROOM
Comp 1 Comp 2 Comp 3 Comp 4 Comp 5 Subject
Year: 2015/16 2015/16 2015 2014/15 2015/16 2016Meeting Space: 26,215 27,900 30,000 33,000 16,000 26,500
F&B Outlets: 3 2 3 4 2 3Number of Rooms: 340 to 430 220 to 280 300 to 370 300 to 380 320 to 400 309
Days Open: 365 365 363 365 365 365Occupancy: 69% 80% 69% 64% 64% 68%
Average Rate: $145 $138 $131 $132 $143 $130RevPAR: $100 $110 $90 $84 $92 $88
REVENUE Rooms $36,551 $40,218 $32,794 $30,833 $33,443 $32,251 Food & Beverage 13,702 17,465 17,641 16,878 17,577 18,346 Other Operated Departments 3,931 333 0 143 128 1,241
Miscel laneous Income 375 90 952 186 275 372 Tota l 54,559 58,106 51,386 48,039 51,423 52,210 DEPARTMENTAL EXPENSES Rooms 6,509 7,230 6,937 7,095 7,416 6,128 Food & Beverage 8,585 11,993 9,691 10,241 9,395 11,057 Other Operated Departments 2,294 259 0 368 56 869 Tota l 17,387 19,482 16,936 17,704 16,867 18,053DEPARTMENTAL INCOME 37,172 38,624 34,451 30,335 34,555 34,157OPERATING EXPENSES Adminis trative & Genera l 4,260 5,373 3,952 2,812 2,403 3,800 Info. and Telecom. Systems 636 308 0 0 770 600 Marketing 5,040 5,364 5,882 3,855 3,061 3,600 Franchise Fee 1,717 2,939 1,628 1,962 2,448 2,903 Property Operations & Maintenance 2,013 3,091 2,126 2,107 1,463 2,000 Uti l i ties 3,641 2,710 2,071 2,747 1,785 1,900 Tota l 17,308 19,785 15,658 13,483 11,930 14,803HOUSE PROFIT 19,864 18,839 18,793 16,852 22,625 19,354Management Fee 1,632 2,035 1,464 1,357 1,467 1,566INCOME BEFORE FIXED CHARGES 18,232 16,804 17,329 15,496 21,158 17,788
Stabilized $

April-2017 Projection of Income and Expense Hotel Arizona – Tucson, Arizona 114
FIGURE 7-3 COMPARABLE OPERATING STATEMENTS: AMOUNTS PER OCCUPIED ROOM
Comp 1 Comp 2 Comp 3 Comp 4 Comp 5 Subject
Year: 2015/16 2015/16 2015 2014/15 2015/16 2016Meeting Space: 26,215 27,900 30,000 33,000 16,000 26,500
F&B Outlets: 3 2 3 4 2 3Number of Rooms: 340 to 430 220 to 280 300 to 370 300 to 380 320 to 400 309
Days Open: 365 365 363 365 365 365Occupancy: 69% 80% 69% 64% 64% 68%
Average Rate: $145 $138 $131 $132 $143 $130RevPAR: $100 $110 $90 $84 $92 $88
REVENUE Rooms $144.53 $137.88 $130.95 $132.38 $143.26 $129.94 Food & Bevera ge 54.18 59.88 70.44 72.47 75.29 73.92 Other Opera ted Departments 15.54 1.14 0.00 0.61 0.55 5.00
Miscel laneous Income 1.48 0.31 3.80 0.80 1.18 1.50 Tota l 215.73 199.21 205.19 206.26 220.27 210.36 DEPARTMENTAL EXPENSES Rooms 25.74 24.79 27.70 30.46 31.77 24.69 Food & Bevera ge 33.95 41.12 38.70 43.97 40.25 44.55 Other Opera ted Departments 9.07 0.89 0.00 1.58 0.24 3.50 Tota l 68.75 66.79 67.63 76.01 72.25 72.74DEPARTMENTAL INCOME 146.98 132.42 137.57 130.25 148.02 137.62OPERATING EXPENSES Adminis trative & Genera l 16.84 18.42 15.78 12.07 10.29 15.31 Info. and Telecom. Sys tems 2.52 1.06 0.00 0.00 3.30 2.42 Marketing 19.93 18.39 23.49 16.55 13.11 14.50 Franchis e Fee 6.79 10.08 6.50 8.42 10.49 11.69 Property Operations & Maintenance 7.96 10.60 8.49 9.05 6.27 8.06 Uti l i ties 14.40 9.29 8.27 11.79 7.64 7.66 Tota l 68.44 67.83 62.53 57.89 51.11 59.64HOUSE PROFIT 78.54 64.59 75.04 72.36 96.92 77.98Mana gement Fee 6.45 6.98 5.84 5.83 6.28 6.31INCOME BEFORE FIXED CHARGES 72.09 57.61 69.20 66.53 90.63 71.67
Stabilized $

April-2017 Projection of Income and Expense Hotel Arizona – Tucson, Arizona 115
The comparables’ departmental income ranged from 63.1% to 68.1% of total revenue. The comparable properties achieved a house profit ranging from 32.5% to 44.0% of total revenue. We will refer to the comparable operating data in our discussion of each line item, which follows later in this section of the report. HVS uses a fixed and variable component model to project a lodging facility's revenue and expense levels. This model is based on the premise that hotel revenues and expenses have one component that is fixed and another that varies directly with occupancy and facility usage. A projection can be made by taking a known level of revenue or expense and calculating its fixed and variable components. The fixed component is then increased in tandem with the underlying rate of inflation, while the variable component is adjusted for a specific measure of volume such as total revenue. The actual forecast is derived by adjusting each year’s revenue and expense by the amount fixed (the fixed expense multiplied by the inflated base-year amount) plus the variable amount (the variable expense multiplied by the inflated base-year amount) multiplied by the ratio of the projection year’s occupancy to the base-year occupancy (in the case of departmental revenue and expense) or the ratio of the projection year’s revenue to the base year’s revenue (in the case of undistributed operating expenses). Fixed expenses remain fixed, increasing only with inflation. Our discussion of the revenue and expense forecast in this report is based upon the output derived from the fixed and variable model. This forecast of revenue and expense is accomplished through a systematic approach, following the format of the Uniform System of Accounts for the Lodging Industry. Each category of revenue and expense is estimated separately and combined at the end in the final statement of income and expense. A general rate of inflation must be established that will be applied to most revenue and expense categories. The following table shows inflation estimates made by economists at some noted institutions and corporations.
Fixed and Variable Component Analysis
Inflation Assumption

April-2017 Projection of Income and Expense Hotel Arizona – Tucson, Arizona 116
FIGURE 7-4 INFLATION ESTIMATES
Name (Sample from Survey) Firm
Lewis Alexander Nomura Securi ties International 2.6 % 2.4 % 2.1 % 2.2 % 2.2 %Paul Ashworth Ca pi ta l Economics 2.8 3.0 3.2 3.3 3.3Danie l Ba chman Deloi tte LP 2.1 1.8 2.2 2.4 2.4Bernard Ba umohl Economic Outlook Group 2.1 2.3 2.3 2.5 2.5Nariman Behra vesh IHS Global Ins ight 2.5 2.2 2.4 2.4 2.4David Berson Nationwide Insurance 2.6 2.5 2.7 2.8 2.8Bria n Bethune Tufts Univers i ty 1.9 2.1 2.3 2.3 2.3Steven Bl i tz Pa ngea Market Advi sory 2.2 1.9 2.5 3.0 3.0Beth Ann Bovino Standard and Poor's 2.5 2.1 2.2 2.3 2.3Micha el Ca rey Credit Agricole CIB 2.3 2.2 2.4 2.6 2.6Joseph Ca rson Al l ianceBernstein 2.4 3.0 3.0 3.0 3.0Mike Cosgrove Econoclast 2.5 2.5 2.2 2.0 2.0Lou Cra nda l l Wrightson ICAP 2.5 2.7 2.7 2.6 2.6Amy Crews Cutts Equi fa x 1.7 2.0 2.3 2.5 2.5J. Dewey Daa ne Va nderbi l t Univers i ty 1.8 2.0 2.3 2.5 2.5Greg Da co Oxford Economics 2.3 2.2 2.3 2.2 2.2Rajeev Dhawa n Georgia Sta te Univers i ty 2.3 2.0 2.1 2.0 2.0Robert Dietz National Association of Home Bui lders 2.0 2.1 2.1 2.1 2.1Dougla s Dunca n Fa nnie Mae 2.5 2.3 2.2 2.1 2.1Robert Dye Comerica Bank 2.5 2.4 2.3 2.2 2.2Ma ria Fiorini Ra mirez/Joshua Shapiro MFR, Inc. 2.4 2.2 2.4 — — Mike Fratantoni Mortgage Ba nkers Association 2.6 2.3 2.4 2.6 2.6Micha el Gregory BMO Ca pi ta l 2.2 2.3 2.3 2.3 2.3Ja n Hatzius Goldman, Sachs & Co. 2.4 2.6 2.1 2.2 2.2Stuart Hoffman PNC Financia l Services Group 2.3 2.3 2.4 2.4 2.4Derek Hol t Scotiabank 2.0 2.3 2.3 2.3 2.3Constance Hunter KPMG 2.2 2.4 2.1 2.1 2.1
Natha niel Ka rp BBVA Compa ss 2.2 2.4 2.6 2.8 2.8Ja ck Kleinhenz National Reta i l Federation 2.4 2.5 2.6 2.5 2.5Joseph LaVorgna Deutsche Ba nk Securi ties , Inc. 1.8 2.1 2.2 2.3 2.3Edward Leamer/Da vid Shulma n UCLA Anderson Forecast 2.3 2.5 2.8 2.7 2.7John Lonski Moody's Investors Service 1.9 1.6 1.5 1.6 1.6Aneta Markowska Societe Generale 2.5 2.8 2.3 2.2 2.2Jim Meil ACT Research 1.8 2.7 3.0 2.5 2.5Micha el Moran Daiwa Ca pi ta l 2.4 2.3 2.4 2.5 2.5Chad Moutray National Association of Ma nufacturers 2.3 2.8 2.7 2.6 2.6Joel Naroff Naroff Economic Advisors 2.6 2.8 3.0 2.8 2.8Ma rk Nie lson MacroEcon Global Advi sors 1.9 2.2 2.5 2.7 2.7Fra nk Notha ft Corelogic 2.3 2.4 2.5 2.5 2.5Jim O'Sul l i van High Frequency Economics 2.2 2.7 2.8 2.9 2.9Lindsey Piegza Sti fe l , Nicoulas and Company, Incorporated (formerly Sterne Agee)1.8 1.3 1.2 — — Dr. Joel Pra kken/ Chri s Varvares Macroeconomic Advi sers 2.5 2.3 2.0 2.1 2.1Russel l Price Ameripri se Financia l 2.3 2.2 2.2 2.2 2.2Lynn Reas er Point Loma Na za rene Univers i ty 1.8 2.0 2.1 2.2 2.2Ma rtin Rega l ia Chamber of Commerce 1.8 1.8 — — — Ia n Shepherdson Pa ntheon Macroeconomics 2.7 3.0 2.7 2.5 2.5John Si lvia Wel l s Fargo & Co. 2.4 2.5 2.7 2.5 2.5Al len Sinai Deci s ion Economics , Inc. 2.4 2.5 2.4 2.3 2.3Ja mes F. Smith Pa rsec Fina ncia l Mana gement 1.6 1.6 1.7 1.8 1.8Sean M. Sna ith Univers ity of Centra l Florida 3.1 3.3 3.4 3.3 3.3Sung Won Sohn Ca l i fornia Sta te Univers i ty 2.3 2.3 2.3 2.4 2.4Stephen Sta nley Pierpont Securities 2.9 3.3 3.4 3.3 3.3Susan M. Sterne Economic Analys is Ass ociates Inc. 2.5 2.2 2.3 2.5 2.5Ja mes Sweeney CSFB 2.0 2.1 — — — Kevin Swi ft American Chemisty Counci l 2.3 2.5 2.5 2.3 2.3Diane Swonk Dia ne Swonk & Associa tes LLC 2.7 2.4 2.4 2.5 2.5Carl Tannenbaum The Northern Trust 2.0 2.0 2.0 2.0 2.0US Economics Team BNP Paribas 2.2 2.3 2.5 2.6 2.6Bart van Ark The Conference Board 2.2 2.4 — — — Bria n S. Wesbury/ Robert Stein Fi rs t Trust Advi sors , L.P. 2.7 2.8 2.9 3.0 3.0Lawrence Yun National Association of Real tors 3.0 3.1 3.0 2.8 2.8
Averages : 2.3 % 2.4 % 2.4 % 2.5 % 2.5 %
Source: Wal l Street Journal Economic Forecasting Survey, December 2016
Projected Increase in Consumer Price Index (Annualized Rate Versus 12
Months Earlier)June 2017
Dec 2017
June 2018
Dec 2018
Dec 2016

April-2017 Projection of Income and Expense Hotel Arizona – Tucson, Arizona 117
As the preceding table indicates, the financial analysts who were surveyed in December 2016 anticipated inflation rates ranging from 1.6% to 3.1% (on an annualized basis) for June 2017; the average of these data points was 2.3%. The same group expects annualized inflation rates of 2.4% for both December 2017 and June 2018, slightly lower than the 2.5% average inflation rate forecast for December 2018. As a further check on these inflation projections, we have reviewed historical increases in the Consumer Price Index (CPI-U). Because the value of real estate is predicated on cash flows over a relatively long period, inflation should be considered from a long-term perspective. FIGURE 7-5 NATIONAL CONSUMER PRICE INDEX (ALL URBAN CONSUMERS)
National Consumer Percent ChangeYear Price Index from Previous Year
2006 201.6 — 2007 207.3 2.8 %2008 215.3 3.82009 214.5 -0.42010 218.1 1.62011 224.9 3.12012 229.6 2.12013 233.0 1.52014 234.8 0.82015 236.5 0.72016 241.5 2.1
Average Annual Compounded Change2006 - 2016: 1.8 %2011 - 2016: 1.4
Source: Bureau of Labor Statis tics
Between 2006 and 2016, the national CPI increased at an average annual compounded rate of 1.8%; from 2011 to 2016, the CPI rose by a slightly lower average annual compounded rate of 1.4%. In 2016, the CPI rose by 2.1%, an increase from the level of 0.7% recorded in 2015. In consideration of the most recent trends, the projections set forth previously, and our assessment of probable property appreciation levels, we have applied underlying inflation rates of 2.0%, 2.5%, and 3.0% thereafter for each respective year following the base year of 2016. This stabilized inflation rate takes into account normal, recurring inflation cycles. Inflation is likely to fluctuate above and below

April-2017 Projection of Income and Expense Hotel Arizona – Tucson, Arizona 118
this level during the projection period. Any exceptions to the application of the assumed underlying inflation rate are discussed in our write-up of individual income and expense items. Based on an analysis that will be detailed throughout this section, we have formulated a forecast of income and expense. The following table presents a detailed forecast through the fifth projection year, including amounts per available room and per occupied room. The second table illustrates our ten-year forecast of income and expense, presented with a lesser degree of detail. The forecasts pertain to years that begin on January 1, 2019, expressed in inflated dollars for each year.
Forecast of Revenue and Expense

April-2017 Projection of Income and Expense Hotel Arizona – Tucson, Arizona 119
FIGURE 7-6 DETAILED FORECAST OF INCOME AND EXPENSE
2019 (Calendar Year) 2020 2021 Stabilized 2023
Number of Rooms: 309 309 309 309 309Occupancy: 54% 63% 67% 68% 68%Average Rate: $135.73 $141.24 $148.45 $152.90 $157.49RevPAR: $73.29 $88.98 $99.46 $103.97 $107.09Days Open: 365 365 365 365 365Occupied Rooms: 60,904 %Gross PAR POR 71,055 %Gross PAR POR 75,566 %Gross PAR POR 76,694 %Gross PAR POR 76,694 %Gross PAR POR OPERATING REVENUERooms $8,266 59.1 % $26,751 $135.72 $10,036 60.7 % $32,479 $141.24 $11,218 61.7 % $36,304 $148.45 $11,727 61.8 % $37,951 $152.91 $12,078 61.8 % $39,087 $157.48Food 3,883 27.8 12,567 63.76 4,469 27.0 14,464 62.90 4,818 26.5 15,593 63.76 5,018 26.4 16,240 65.43 5,169 26.4 16,728 67.40Beverage 1,337 9.6 4,328 21.96 1,493 9.0 4,833 21.02 1,591 8.7 5,150 21.06 1,653 8.7 5,348 21.55 1,702 8.7 5,509 22.19Other Operated Departments 387 2.8 1,254 6.36 416 2.5 1,346 5.85 436 2.4 1,412 5.77 451 2.4 1,460 5.88 465 2.4 1,504 6.06Miscellaneous Income 116 0.8 376 1.91 125 0.8 404 1.76 131 0.7 423 1.73 135 0.7 438 1.77 139 0.7 451 1.82 Total Operating Revenues 13,990 100.0 45,276 229.71 16,539 100.0 53,526 232.77 18,195 100.0 58,882 240.78 18,984 100.0 61,438 247.54 19,553 100.0 63,279 254.95DEPARTMENTAL EXPENSES *Rooms 1,871 22.6 6,055 30.72 2,038 20.3 6,597 28.69 2,150 19.2 6,959 28.46 2,228 19.0 7,210 29.05 2,295 19.0 7,427 29.92Food & Beverage 3,439 65.9 11,131 56.47 3,701 62.1 11,979 52.09 3,885 60.6 12,573 51.41 4,020 60.3 13,011 52.42 4,141 60.3 13,401 53.99Other Operated Departments 284 73.2 918 4.66 296 71.1 957 4.16 306 70.2 991 4.05 316 70.0 1,022 4.12 325 70.0 1,053 4.24 Total Expenses 5,594 40.0 18,104 91.85 6,036 36.5 19,533 84.94 6,342 34.9 20,524 83.92 6,564 34.6 21,244 85.59 6,761 34.6 21,881 88.16DEPARTMENTAL INCOME 8,396 60.0 27,172 137.86 10,504 63.5 33,993 147.83 11,853 65.1 38,358 156.85 12,420 65.4 40,195 161.94 12,792 65.4 41,398 166.79UNDISTRIBUTED OPERATING EXPENSESAdministrative & General 1,203 8.6 3,893 19.75 1,278 7.7 4,135 17.98 1,337 7.3 4,327 17.70 1,382 7.3 4,472 18.02 1,423 7.3 4,606 18.56Info & Telecom Systems 190 1.4 615 3.12 202 1.2 653 2.84 211 1.2 683 2.79 218 1.1 706 2.84 225 1.1 727 2.93Marketing 1,368 9.8 4,426 22.45 1,332 8.1 4,309 18.74 1,267 7.0 4,100 16.76 1,309 6.9 4,236 17.07 1,348 6.9 4,363 17.58Franchise Fee 744 5.3 2,408 12.21 903 5.5 2,923 12.71 1,010 5.5 3,267 13.36 1,055 5.6 3,416 13.76 1,087 5.6 3,518 14.17Prop. Operations & Maint. 506 3.6 1,639 8.32 605 3.7 1,959 8.52 704 3.9 2,278 9.31 727 3.8 2,353 9.48 749 3.8 2,424 9.77Utilities 601 4.3 1,946 9.88 639 3.9 2,068 8.99 669 3.7 2,164 8.85 691 3.6 2,236 9.01 712 3.6 2,303 9.28 Total Expenses 4,612 33.0 14,926 75.73 4,958 30.1 16,047 69.78 5,197 28.6 16,819 68.77 5,382 28.3 17,419 70.18 5,544 28.3 17,941 72.28GROSS HOUSE PROFIT 3,784 27.0 12,245 62.13 5,545 33.4 17,947 78.05 6,656 36.5 21,540 88.08 7,038 37.1 22,776 91.76 7,248 37.1 23,457 94.51Management Fee 420 3.0 1,358 6.89 496 3.0 1,606 6.98 546 3.0 1,766 7.22 570 3.0 1,843 7.43 587 3.0 1,898 7.65INCOME BEFORE NON-OPR. INC. & EXP. 3,364 24.0 10,887 55.24 5,049 30.4 16,341 71.06 6,110 33.5 19,773 80.86 6,468 34.1 20,933 84.34 6,662 34.1 21,559 86.86NON-OPERATING INCOME & EXPENSEProperty Taxes 483 3.5 1,563 7.93 611 3.7 1,978 8.60 658 3.6 2,129 8.70 708 3.7 2,292 9.23 729 3.7 2,360 9.51Insurance 166 1.2 538 2.73 171 1.0 555 2.41 177 1.0 571 2.34 182 1.0 588 2.37 187 1.0 606 2.44Reserve for Replacement 280 2.0 906 4.59 496 3.0 1,606 6.98 728 4.0 2,355 9.63 759 4.0 2,458 9.90 782 4.0 2,531 10.20 Total Expenses 929 6.7 3,007 15.26 1,279 7.7 4,138 17.99 1,562 8.6 5,055 20.67 1,649 8.7 5,338 21.51 1,699 8.7 5,498 22.15EBITDA LESS RESERVE $2,435 17.3 % $7,880 $39.98 $3,771 22.7 % $12,203 $53.07 $4,548 24.9 % $14,718 $60.18 $4,819 25.4 % $15,595 $62.83 $4,963 25.4 % $16,061 $64.71
*Departmental expenses are expressed as a percentage of departmental revenues.

April-2017 Projection of Income and Expense Hotel Arizona – Tucson, Arizona 120
FIGURE 7-7 TEN-YEAR FORECAST OF INCOME AND EXPENSE
2019 2020 2021 2022 2023 2024 2025 2026 2027 2028
Number of Rooms: 309 309 309 309 309 309 309 309 309 309Occupied Rooms: 60,904 71,055 75,566 76,694 76,694 76,694 76,694 76,694 76,694 76,694Occupancy: 54% 63% 67% 68% 68% 68% 68% 68% 68% 68%Average Rate: $135.73 % of $141.24 % of $148.45 % of $152.90 % of $157.49 % of $162.21 % of $167.08 % of $172.09 % of $177.25 % of $182.57RevPAR: $73.29 Gross $88.98 Gross $99.46 Gross $103.97 Gross $107.09 Gross $110.30 Gross $113.61 Gross $117.02 Gross $120.53 Gross $124.15OPERATING REVENUERooms $8,266 59.1 % $10,036 60.7 % $11,218 61.7 % $11,727 61.8 % $12,078 61.8 % $12,441 61.8 % $12,814 61.8 % $13,198 61.8 % $13,594 61.8 % $14,002 61.8 %Food 3,883 27.8 4,469 27.0 4,818 26.5 5,018 26.4 5,169 26.4 5,324 26.4 5,484 26.4 5,648 26.4 5,818 26.4 5,992 26.4Beverage 1,337 9.6 1,493 9.0 1,591 8.7 1,653 8.7 1,702 8.7 1,753 8.7 1,806 8.7 1,860 8.7 1,916 8.7 1,973 8.7Other Operated Departments 387 2.8 416 2.5 436 2.4 451 2.4 465 2.4 479 2.4 493 2.4 508 2.4 523 2.4 539 2.4Miscellaneous Income 116 0.8 125 0.8 131 0.7 135 0.7 139 0.7 144 0.7 148 0.7 152 0.7 157 0.7 162 0.7 Total Operating Revenues 13,990 100.0 16,539 100.0 18,195 100.0 18,984 100.0 19,553 100.0 20,140 100.0 20,744 100.0 21,366 100.0 22,007 100.0 22,668 100.0DEPARTMENTAL EXPENSES *Rooms 1,871 22.6 2,038 20.3 2,150 19.2 2,228 19.0 2,295 19.0 2,364 19.0 2,435 19.0 2,508 19.0 2,583 19.0 2,660 19.0Food & Beverage 3,439 65.9 3,701 62.1 3,885 60.6 4,020 60.3 4,141 60.3 4,265 60.3 4,393 60.3 4,525 60.3 4,661 60.3 4,801 60.3Other Operated Departments 284 73.2 296 71.1 306 70.2 316 70.0 325 70.0 335 70.0 345 70.0 356 70.0 366 70.0 377 70.0 Total Expenses 5,594 40.0 6,036 36.5 6,342 34.9 6,564 34.6 6,761 34.6 6,964 34.6 7,173 34.6 7,388 34.6 7,610 34.6 7,838 34.6DEPARTMENTAL INCOME 8,396 60.0 10,504 63.5 11,853 65.1 12,420 65.4 12,792 65.4 13,176 65.4 13,571 65.4 13,978 65.4 14,398 65.4 14,830 65.4UNDISTRIBUTED OPERATING EXPENSESAdministrative & General 1,203 8.6 1,278 7.7 1,337 7.3 1,382 7.3 1,423 7.3 1,466 7.3 1,510 7.3 1,555 7.3 1,602 7.3 1,650 7.3Info & Telecom Systems 190 1.4 202 1.2 211 1.2 218 1.1 225 1.1 231 1.1 238 1.1 246 1.1 253 1.1 260 1.1Marketing 1,368 9.8 1,332 8.1 1,267 7.0 1,309 6.9 1,348 6.9 1,389 6.9 1,430 6.9 1,473 6.9 1,517 6.9 1,563 6.9Franchise Fee 744 5.3 903 5.5 1,010 5.5 1,055 5.6 1,087 5.6 1,120 5.6 1,153 5.6 1,188 5.6 1,223 5.6 1,260 5.6Prop. Operations & Maint. 506 3.6 605 3.7 704 3.9 727 3.8 749 3.8 772 3.8 795 3.8 818 3.8 843 3.8 868 3.8Utilities 601 4.3 639 3.9 669 3.7 691 3.6 712 3.6 733 3.6 755 3.6 778 3.6 801 3.6 825 3.6 Total Expenses 4,612 33.0 4,958 30.1 5,197 28.6 5,382 28.3 5,544 28.3 5,710 28.3 5,881 28.3 6,058 28.3 6,240 28.3 6,427 28.3GROSS HOUSE PROFIT 3,784 27.0 5,545 33.4 6,656 36.5 7,038 37.1 7,248 37.1 7,466 37.1 7,690 37.1 7,920 37.1 8,158 37.1 8,403 37.1Management Fee 420 3.0 496 3.0 546 3.0 570 3.0 587 3.0 604 3.0 622 3.0 641 3.0 660 3.0 680 3.0INCOME BEFORE NON-OPR. INC. & EXP. 3,364 24.0 5,049 30.4 6,110 33.5 6,468 34.1 6,662 34.1 6,862 34.1 7,068 34.1 7,279 34.1 7,498 34.1 7,723 34.1NON-OPERATING INCOME & EXPENSEProperty Taxes 483 3.5 611 3.7 658 3.6 708 3.7 729 3.7 751 3.7 774 3.7 797 3.7 821 3.7 846 3.7Insurance 166 1.2 171 1.0 177 1.0 182 1.0 187 1.0 193 1.0 199 1.0 205 1.0 211 1.0 217 1.0Reserve for Replacement 280 2.0 496 3.0 728 4.0 759 4.0 782 4.0 806 4.0 830 4.0 855 4.0 880 4.0 907 4.0 Total Expenses 929 6.7 1,279 7.7 1,562 8.6 1,649 8.7 1,699 8.7 1,750 8.7 1,802 8.7 1,856 8.7 1,912 8.7 1,969 8.7EBITDA LESS RESERVE $2,435 17.3 % $3,771 22.7 % $4,548 24.9 % $4,819 25.4 % $4,963 25.4 % $5,112 25.4 % $5,265 25.4 % $5,423 25.4 % $5,586 25.4 % $5,754 25.4 %
1 1 1 1 1 1 1 1 1 1*Departmental expenses are expressed as a percentage of departmental revenues.
% ofGross

April-2017 Projection of Income and Expense Hotel Arizona – Tucson, Arizona 121
The following description sets forth the basis for the forecast of income and expense. We anticipate that it will take four years for the subject property to reach a stabilized level of operation. Each revenue and expense item has been forecast based upon our review of the proposed subject hotel's operating budget and comparable income and expense statements. The forecast is based upon calendar years beginning January 1, 2019, expressed in inflated dollars for each year. Rooms revenue is determined by two variables: occupancy and average rate. We projected occupancy and average rate in a previous section of this report. The proposed subject hotel is expected to stabilize at an occupancy level of 68% with an average rate of $152.90 in 2022. Following the stabilized year, the subject property’s average rate is projected to increase along with the underlying rate of inflation. Food and beverage revenue is generated by a hotel's restaurants, lounges, coffee shops, snack bars, banquet rooms, and room service. In addition to providing a source of revenue, these outlets serve as an amenity that assists in the sale of guestrooms. With the exception of properties with active lounges or banquet facilities that draw local residents, in-house guests generally represent a substantial percentage of a hotel's food and beverage patrons. In the case of the Hotel Arizona, food and beverage department will include a three-meal restaurant, a signature restaurant, a lobby bar and lounge, and "made market"/grab-n-go; moreover, banquet space is expected to span 26,500 square feet. Although food and beverage revenue varies directly with changes in occupancy, the small portion generated by banquet sales and outside capture is relatively fixed. The proposed subject hotel's food and beverage operation is expected to be an important component of the hotel. Therefore, based upon our review of comparable operating statements, we have positioned an appropriate revenue level given the hotel's planned facility and price point. We would anticipate future moderate growth to occur within this category after the hotel's opening.
FIGURE 7-8 FOOD AND BEVERAGE REVENUE
#1 #2 #3 #4 #5 2019
Food & Beverage RevenuePercentage of Revenue 25.1 % 30.1 % 34.3 % 35.1 % 34.2 % 37.4 % 35.1 %Per Ava i lable Room $13,702 $17,465 $17,641 $16,878 $17,577 $16,895 $18,346Per Occupied Room $54.18 $59.88 $70.44 $72.47 $75.29 $85.72 $73.92
Comparable Operating Statements Proposed Subject Property ForecastDeflated Stabilized
Rooms Revenue
Food and Beverage Revenue

April-2017 Projection of Income and Expense Hotel Arizona – Tucson, Arizona 122
According to the Uniform System of Accounts, other operated departments include any major or minor operated department other than rooms and food and beverage. The proposed subject hotel's other operated departments revenue sources are expected to include the hotel's telephone charges, parking revenues, gift shop sales, valet laundry fees, and in-room movie and game charges. Based on our review of operations with a similar extent of offerings, we have positioned an appropriate revenue level for the proposed subject hotel.
FIGURE 7-9 OTHER OPERATED DEPARTMENTS REVENUE
#1 #2 #3 #4 #5 2019
Percentage of Revenue 7.2 % 0.6 % 0.0 % 0.3 % 0.2 % 2.8 % 2.4 %Per Ava i lable Room $3,931 $333 $0 $143 $128 $1,254 $1,241Per Occupied Room $15.54 $1.14 $0.00 $0.61 $0.55 $6.36 $5.00
Comparable Operating Statements Proposed Subject Property ForecastDeflated Stabilized
The miscellaneous income sources comprise those other than guestrooms, food and beverage, and the other operated departments. The proposed subject hotel's miscellaneous income revenues are expected to be generated primarily by the hotel's commissions earned on the vending sales and other minor collections, such as cancelation fees. Based on our review of operations with a similar extent of offerings, we have positioned an appropriate revenue level for the proposed subject hotel. Changes in this revenue item through the projection period result from the application of the underlying inflation rate and projected changes in occupancy.
FIGURE 7-10 MISCELLANEOUS INCOME
#1 #2 #3 #4 #5 2019
Percentage of Revenue 7.2 % 0.6 % 0.0 % 0.3 % 0.2 % 0.8 % 0.7 %Per Ava i lable Room $3,931 $333 $0 $143 $128 $376 $372Per Occupied Room $15.54 $1.14 $0.00 $0.61 $0.55 $1.91 $1.50
Comparable Operating Statements Proposed Subject Property ForecastDeflated Stabilized
Rooms expense consists of items related to the sale and upkeep of guestrooms and public space. Salaries, wages, and employee benefits account for a substantial portion of this category. Although payroll varies somewhat with occupancy and managers can generally scale the level of service staff on hand to meet an expected occupancy level, much of a hotel's payroll is fixed. A base level of front desk personnel, housekeepers, and supervisors must be maintained at all times. As a
Other Operated Departments Revenue
Miscellaneous Income
Rooms Expense

April-2017 Projection of Income and Expense Hotel Arizona – Tucson, Arizona 123
result, salaries, wages, and employee benefits are only moderately sensitive to changes in occupancy. Commissions and reservations are usually based on room sales, and thus are highly sensitive to changes in occupancy and average rate. While guest supplies vary 100% with occupancy, linens and other operating expenses are only slightly affected by volume. The proposed subject hotel's rooms department expense has been positioned based upon our review of the comparable operating data and our understanding of the hotel's future service level and price point.
FIGURE 7-11 ROOMS EXPENSE
#1 #2 #3 #4 #5 2019
Percentage of Revenue 0.0 % 0.0 % 0.0 % 0.0 % 0.0 % 22.6 % 19.0 %Per Ava i lable Room $0 $0 $0 $0 $0 $6,055 $6,128Per Occupied Room $0.00 $0.00 $0.00 $0.00 $0.00 $30.72 $24.69
Deflated StabilizedComparable Operating Statements Proposed Subject Property Forecast
Food expenses consist of items necessary for the primary operation of a hotel's food and banquet facilities. The costs associated with food sales and payroll are moderately to highly correlated to food revenues. Items such as china, linen and uniforms are less dependent on volume. Although the other expense items are basically fixed, they represent a relatively insignificant factor. Beverage expenses consist of items necessary for the operation of a hotel’s lounge and bar areas. The costs associated with beverage sales and payroll are moderately to highly correlated to beverage revenues. The proposed subject hotel's food and beverage operation is expected to be efficiently managed and operated at an expense level that is in line with other comparable operations.
FIGURE 7-12 FOOD AND BEVERAGE EXPENSE
#1 #2 #3 #4 #5 2019
Percentage of Revenue 62.7 % 68.7 % 54.9 % 60.7 % 53.5 % 65.9 % 60.3 %Per Ava i lable Room $8,585 $11,993 $9,691 $10,241 $9,395 $11,131 $11,057Per Occupied Room $33.95 $41.12 $38.70 $43.97 $40.25 $56.47 $44.55
Comparable Operating Statements Proposed Subject Property ForecastDeflated Stabilized
Other operated departments expense includes all expenses reflected in the summary statements for the divisions associated in these categories. This was previously discussed in this chapter. The proposed subject hotel's other operated
Food and Beverage Expense
Other Operated Departments Expense

April-2017 Projection of Income and Expense Hotel Arizona – Tucson, Arizona 124
departments revenue sources are expected to include the hotel's telephone charges, parking revenues, gift shop sales, valet laundry fees, and in-room movie and game charges. Based on our review of operations with a similar extent of offerings, we have positioned an appropriate revenue level for the proposed subject hotel.
FIGURE 7-13 OTHER OPERATED DEPARTMENTS EXPENSE
#1 #2 #3 #4 #5 2019
Percentage of Revenue 58.4 % 77.9 % 0.0 % 258.6 % 43.5 % 73.2 % 70.0 %Per Ava i lable Room $2,294 $259 $0 $368 $56 $918 $869Per Occupied Room $9.07 $0.89 $0.00 $1.58 $0.24 $4.66 $3.50
Comparable Operating Statements Proposed Subject Property ForecastDeflated Stabilized
Administrative and general expense includes the salaries and wages of all administrative personnel who are not directly associated with a particular department. Expense items related to the management and operation of the property are also allocated to this category. Most administrative and general expenses are relatively fixed. The exceptions are cash overages and shortages; commissions on credit card charges; provision for doubtful accounts, which are moderately affected by the number of transactions or total revenue; and salaries, wages, and benefits, which are very slightly influenced by volume. Based upon our review of the comparable operating data and the expected scope of facility for the proposed subject hotel, we have positioned the administrative and general expense level at a market- and property-supported level.
FIGURE 7-14 ADMINISTRATIVE AND GENERAL EXPENSE
#1 #2 #3 #4 #5 2019
Percentage of Revenue 0.0 % 0.0 % 0.0 % 0.0 % 0.0 % 8.6 % 7.3 %Per Ava i lable Room $0 $0 $0 $0 $0 $3,893 $3,800Per Occupied Room $0.00 $0.00 $0.00 $0.00 $0.00 $19.75 $15.31
Comparable Operating Statements Proposed Subject Property ForecastDeflated Stabilized
Information and telecommunications systems expense consists of all costs associated with a hotel’s technology infrastructure. This includes the costs of cell phones, administrative call and Internet services, and complimentary call and Internet services. Expenses in this category are typically organized by type of technology, or the area benefitting from the technology solution. We expect the
Administrative and General Expense
Information and Telecommunications Systems Expense

April-2017 Projection of Income and Expense Hotel Arizona – Tucson, Arizona 125
proposed subject hotel's information and telecommunications systems to be well managed. Expense levels should stabilize at a typical level for a property of this type. Marketing expense consists of all costs associated with advertising, sales, and promotion; these activities are intended to attract and retain customers. Marketing can be used to create an image, develop customer awareness, and stimulate patronage of a property's various facilities. The marketing category is unique in that all expense items, with the exception of fees and commissions, are totally controlled by management. Most hotel operators establish an annual marketing budget that sets forth all planned expenditures. If the budget is followed, total marketing expenses can be projected accurately. Marketing expenditures are unusual because although there is a lag period before results are realized, the benefits are often extended over a long period. Depending on the type and scope of the advertising and promotion program implemented, the lag time can be as short as a few weeks or as long as several years. However, the favorable results of an effective marketing campaign tend to linger, and a property often enjoys the benefits of concentrated sales efforts for many months. Based upon our review of the comparable operating data and the expected scope of facility for the proposed subject hotel, we have positioned the marketing expense level at a market- and property-supported level.
FIGURE 7-15 MARKETING EXPENSE
#1 #2 #3 #4 #5 2019
Percentage of Revenue 1.2 % 0.5 % 0.0 % 0.0 % 1.5 % 9.8 % 6.9 %Per Ava i lable Room $636 $308 $0 $0 $770 $4,426 $3,600Per Occupied Room $2.52 $1.06 $0.00 $0.00 $3.30 $22.45 $14.50
Comparable Operating Statements Proposed Subject Property ForecastDeflated Stabilized
As previously discussed, the proposed subject property is expected to be franchised under the DoubleTree by Hilton brand. Costs associated with this franchise are summarized in the introductory chapter in this report. Property operations and maintenance expense is another expense category that is largely controlled by management. Except for repairs that are necessary to keep the facility open and prevent damage (e.g., plumbing, heating, and electrical items), most maintenance can be deferred for varying lengths of time. Maintenance is an accumulating expense. If management elects to postpone performing a required repair, they have not eliminated or saved the expenditure;
Marketing Expense
Franchise Fee
Property Operations and Maintenance

April-2017 Projection of Income and Expense Hotel Arizona – Tucson, Arizona 126
they have only deferred payment until a later date. A lodging facility that operates with a lower-than-normal maintenance budget is likely to accumulate a considerable amount of deferred maintenance. The age of a lodging facility has a strong influence on the required level of maintenance. A new or thoroughly renovated property is protected for several years by modern equipment and manufacturers' warranties. However, as a hostelry grows older, maintenance expenses escalate. A well-organized preventive maintenance system often helps delay deterioration, but most facilities face higher property operations and maintenance costs each year, regardless of the occupancy trend. The quality of initial construction can also have a direct impact on future maintenance requirements. The use of high-quality building materials and construction methods generally reduces the need for maintenance expenditures over the long term. We expect the proposed subject hotel's maintenance operation to be well managed. Expense levels should stabilize at a typical level for a property of this type. Changes in this expense item through the projection period result from the application of the underlying inflation rate and projected changes in occupancy.
FIGURE 7-16 PROPERTY OPERATIONS AND MAINTENANCE EXPENSE
#1 #2 #3 #4 #5 2019
Percentage of Revenue 3.1 % 5.1 % 3.2 % 4.1 % 4.8 % 3.6 % 3.8 %Per Ava i lable Room $1,717 $2,939 $1,628 $1,962 $2,448 $1,639 $2,000Per Occupied Room $6.79 $10.08 $6.50 $8.42 $10.49 $8.32 $8.06
Comparable Operating Statements Proposed Subject Property ForecastDeflated Stabilized
The utilities consumption of a lodging facility takes several forms, including water and space heating, air conditioning, lighting, cooking fuel, and other miscellaneous power requirements. The most common sources of hotel utilities are electricity, natural gas, fuel oil, and steam. This category also includes the cost of water service. Total energy cost depends on the source and quantity of fuel used. Electricity tends to be the most expensive source, followed by oil and gas. Although all hotels consume a sizable amount of electricity, many properties supplement their utility requirements with less expensive sources, such as gas and oil, for heating and cooking. The changes in this utilities line item through the projection period are a result of the application of the underlying inflation rate and projected changes in occupancy.
Utilities Expense

April-2017 Projection of Income and Expense Hotel Arizona – Tucson, Arizona 127
FIGURE 7-17 UTILITIES EXPENSE
#1 #2 #3 #4 #5 2019
Percentage of Revenue 3.7 % 5.3 % 4.1 % 4.4 % 2.8 % 4.3 % 3.6 %Per Ava i lable Room $2,013 $3,091 $2,126 $2,107 $1,463 $1,946 $1,900Per Occupied Room $7.96 $10.60 $8.49 $9.05 $6.27 $9.88 $7.66
Comparable Operating Statements Proposed Subject Property ForecastDeflated Stabilized
Management expense consists of the fees paid to the managing agent contracted to operate the property. Some companies provide management services and a brand-name affiliation (first-tier management company), while others provide management services alone (second-tier management company). Some management contracts specify only a base fee (usually a percentage of total revenue), while others call for both a base fee and an incentive fee (usually a percentage of defined profit). Basic hotel management fees are often based on a percentage of total revenue, which means they have no fixed component. While base fees typically range from 2% to 4% of total revenue, incentive fees are deal specific and often are calculated as a percentage of income available after debt service and, in some cases, after a preferred return on equity. Total management fees for the proposed subject hotel have been forecast at 3.0% of total revenue. Depending on the taxing policy of the municipality, property taxes can be based on the value of the real property or the value of the personal property and the real property. The Arizona taxing jurisdiction governing the subject site assesses hotels for real and personal property. Property assessments in this county are reviewed and adjusted annually at market value, referred to as “full cash value.” In addition, each property also has a second “limited value” that cannot exceed the full cash value. The limited value is essentially used to buffer the impact of changes in assessment so that any change is absorbed over a multiple-year period. Properties are generally inspected every three years, with annual adjustments based upon market factors and information compiled by the Arizona Department of Revenue. The County assesses improvements for hotels with over 200 rooms using the income approach to value, while hotels under 200 rooms are assessed using the cost approach via the Marshall & Swift cost estimator. Depreciation is generally based upon age, with commercial properties having an average 50-year life span and a 60% maximum depreciation. Personal property is taxed at a similar rate as real property (less the applicable flood assessment), but full cash and limited values are calculated based on inventories submitted by the property owner; personal property is depreciated annually.
Management Fee
Property Taxes

April-2017 Projection of Income and Expense Hotel Arizona – Tucson, Arizona 128
In 2012, Arizona voters approved Proposition 117, an amendment to the state constitution that provides property tax relief starting in 2015. Going forward, property taxes will be calculated only on the limited property value, and year-over-year value increases will be capped at no more than 5% per year. Annual tax burdens will be calculated by applying both the primary and secondary tax rates to the limited property value. The full cash value (i.e., market value) will continue to appear on the property tax record; however, it will no longer be used to calculate the amount of property tax owed. Because the objective of assessed value is to maintain a specific value relationship among all properties in a taxing jurisdiction, comparable hotel assessments should be evaluated to estimate a probable future assessed value. A review of the assessed values of several comparable hotels located in the local county jurisdiction reveals the following information.
FIGURE 7-18 COUNTY-ASSESSED VALUE OF COMPARABLE HOTELS
YearHotel Built Total
Tucson Univers i ty Park Hotel 1996 $19,999,000 $652,638 $20,651,638Aloft Tucson Univers i ty 1971 9,743,434 0 9,743,434DoubleTree Sui tes by Hi l ton Tucson Wi l l i ams Center 1975 7,500,000 601,103 8,101,103DoubleTree by Hi l ton Tucson Reid Park 1974 14,350,000 1,690,939 16,040,939Hi l ton Tucson East 1987 11,136,000 748,828 11,884,828Sheraton Hotel & Suites Tucson 1985 10,800,000 935,670 11,735,670
Assessments per RoomTucson Univers i ty Park Hotel 250 $79,996 $2,611 $82,607Aloft Tucson Univers i ty 154 63,269 0 63,269DoubleTree Sui tes by Hi l ton Tucson Wi l l i ams Center 142 52,817 4,233 57,050DoubleTree by Hi l ton Tucson Reid Park 287 50,000 5,892 55,892Hi l ton Tucson East 232 48,000 3,228 51,228Sheraton Hotel & Suites Tucson 216 50,000 4,332 54,332
Positioned Subject - Per Room 309 $65,000 $4,500 $69,500
Positioned Subject - Total $20,085,000 $1,390,500 $21,475,500
FCV Personal
# of Rms
Pima County Assessors Office
We have positioned the future assessment levels of the subject site and proposed improvements, as well as the planned personal property, based upon the illustrated comparable data. We have positioned these real property assessments closest to the Aloft Tucson University given the hotel's relatively recent redevelopment, while

April-2017 Projection of Income and Expense Hotel Arizona – Tucson, Arizona 129
personal property has been positioned closest to the DoubleTree Suites by Hilton Tucson Williams Center due to its recent property-wide renovations. Overall, the positioned assessments are well supported by the market data. Tax rates are based on the city and county budgets, which change annually. The following table shows changes in the tax rate during the last several years. FIGURE 7-19 PROPERTY TAX RATES
Tax Code: 0150
Real Property PersonalYear Tax Rate
2014 16.76720 16.767202015 16.96600 16.966002016 16.67890 16.67890
Tax Rate
Combined Combined
Pima County Assessors Office
The most recent combined tax rate in this jurisdiction was reported at 16.67890% for both real and personal property. For the purposes of this appraisal, we have assumed that the tax rate will eventually increase by the underlying rate of inflation. We have based our estimate of the subject property's market value (for tax purposes) on an analysis of county assessments of both the subject property and comparable hotel properties in the local county. The following table details the subject property's assessment history, as well as the calculated tax burden in future years. Arizona law requires the assessor's office to identify if a change in use, addition, or deletion of an improvement to a property has occurred. When there are additional improvements due to new construction, the Rule B process is utilized to calculate the limited property value. Rule B-5 applies to structures that are more than 50% (but less than 100%) completed prior to the deadline for the current valuation year (January 31). For structures that are less than 100% completed, the full cash value (market value) is set at a percentage complete of the market value as if 100% completed. The average ratio between the limited property value and full cash value is 95% of the positioned full cash value. Rule B-6 pertains to property that had a partially completed structure for the previous valuation year but is now complete. In this case, the full cash value represents 100% of market value as completed, while the limited property value is set at a 90% ratio of the full cash value.

April-2017 Projection of Income and Expense Hotel Arizona – Tucson, Arizona 130
FIGURE 7-20 RULE B ANALYSIS – RULE B5
2019(75% Complete)
Pos itioned Ful l Cash Va lue $20,085,000
Ful l Cash Va lue @ 75% of Pos itioned Ful l Cash Va lue
15,063,750
Limited Property Value @ 95% ratio of Ful l Cash Va lue
14,310,563
EstimatedAmount
Source: Ma ricopa County Assessor
FIGURE 7-21 RULE B ANALYSIS – RULE B6
2020(100% Complete)
Pos itioned Ful l Cash Va lue $20,085,000
Ful l Cash Va lue @ 100% of Pos itioned Ful l Cash Va lue 20,085,000
Limited Property Value @ 90% ratio of Ful l Cash Va lue 18,076,500
Source: Ma ricopa County Assessor
EstimatedAmount

April-2017 Projection of Income and Expense Hotel Arizona – Tucson, Arizona 131
FIGURE 7-22 SUBJECT PROPERTY'S ASSESSMENT HISTORY AND FORECAST OF FUTURE TAX BURDEN
Year
Pos itioned $18,076,500 18.0 % $3,253,770 — — 16.68 $542,693
2019 $14,310,563 18.0 % $2,575,901 -20.8 % 2.0 % — $440,4862020 18,076,500 18.0 3,253,770 26.3 2.5 — 567,4152021 18,980,325 18.0 3,416,459 5.0 3.0 — 612,8092022 19,929,341 18.0 3,587,281 5.0 3.0 — 661,833
Forecast Rate of Value Change
Base Rate of Tax Burden
Increase
Combined Real Property Tax
RateTax Forecast - Real PropertyAssessment Ratio
Limited Property Value
(LPV) LPV Assessed
Year
Pos itioned $1,390,500 18.0 % $250,290 — — 16.68 $41,746
2019 $1,390,500 18.0 % $250,290 0.0 % 2.0 % — $42,5812020 1,390,500 18.0 250,290 0.0 2.5 — 43,6452021 1,390,500 18.0 250,290 0.0 3.0 — 44,9542022 1,390,500 18.0 250,290 0.0 3.0 — 46,303
LPV Assessed
Forecast Rate of Value Change
Base Rate of Tax Burden
Increase
Combined Real Property Tax
Rate
Tax Forecast - Personal Property
Full Cash Value (FCV) Assessment Ratio
The insurance expense category consists of the cost of insuring the hotel and its contents against damage or destruction by fire, weather, sprinkler leakage, boiler explosion, plate glass breakage, and so forth. General insurance costs also include premiums relating to liability, fidelity, and theft coverage. Insurance rates are based on many factors, including building design and construction, fire detection and extinguishing equipment, fire district, distance from the firehouse, and the area's fire experience. Insurance expenses do not vary with occupancy.
FIGURE 7-23 INSURANCE EXPENSE
#1 #2 #3 #4 #5 2019
Percentage of Revenue 0.0 % 2.1 % 3.8 % 3.6 % 3.9 % 1.2 % 1.0 %Per Avai lable Room $0 $1,195 $1,936 $1,706 $2,013 $538 $500Per Occupied Room $0.00 $4.10 $7.73 $7.32 $8.62 $2.73 $2.01
Deflated StabilizedComparable Operating Statements Proposed Subject Property Forecast
Insurance Expense

April-2017 Projection of Income and Expense Hotel Arizona – Tucson, Arizona 132
Furniture, fixtures, and equipment are essential to the operation of a lodging facility, and their quality often influences a property's class. This category includes all non-real estate items that are capitalized, rather than expensed. The furniture, fixtures, and equipment of a hotel are exposed to heavy use and must be replaced at regular intervals. The useful life of these items is determined by their quality, durability, and the amount of guest traffic and use. Periodic replacement of furniture, fixtures, and equipment is essential to maintain the quality, image, and income-producing potential of a lodging facility. Because capitalized expenditures are not included in the operating statement but affect an owner's cash flow, a forecast of income and expense should reflect these expenses in the form of an appropriate reserve for replacement. The International Society of Hospitality Consultants (ISHC) oversees a major industry-sponsored study of the capital expenditure requirements for full-service/luxury, select-service, and extended-stay hotels. The most recent study was published in 2014.7 Historical capital expenditures of well-maintained hotels were investigated through the compilation of data provided by most of the major hotel companies in the United States. A prospective analysis of future capital expenditure requirements was also performed based upon the cost to replace short- and long-lived building components over a hotel's economic life. The study showed that the capital expenditure requirements for hotels vary significantly from year to year and depend upon both the actual and effective ages of a property. The results of this study showed that hotel lenders and investors are requiring reserves for replacement ranging from 4% to 5% of total revenue. Based on the results of our analysis and on our review of the proposed subject asset and comparable lodging facilities, as well as on our industry expertise, we estimate that a reserve for replacement of 4% of total revenues is sufficient to provide for the timely and periodic replacement of the subject property's furniture, fixtures, and equipment. This amount has been ramped up during the initial projection period. Projected total revenue. House profit, and EBITDA less replacement reserves are set forth in the following table.
7 The International Society of Hotel Consultants, CapEx 2014, A Study of Capital Expenditure in the U.S. Hotel Industry.
Reserve for Replacement
Forecast of Revenue and Expense Conclusion

April-2017 Projection of Income and Expense Hotel Arizona – Tucson, Arizona 133
FIGURE 7-24 FORECAST OF REVENUE AND EXPENSE CONCLUSION
Year Total%
Change Total % Change Total % Change
Projected 2019 $13,990,000 — $3,784,000 — 27.0 % $2,435,000 — 17.3 %2020 16,539,000 18.2 % 5,545,000 46.5 % 33.4 3,771,000 54.9 % 22.72021 18,195,000 10.0 6,656,000 20.0 36.5 4,548,000 20.6 24.92022 18,984,000 4.3 7,038,000 5.7 37.1 4,819,000 6.0 25.42023 19,553,000 3.0 7,248,000 3.0 37.1 4,963,000 3.0 25.4
Total Revenue House Profit House Profit Ratio
EBITDA Less Replacement ReserveAs a % of
Ttl Rev

April-2017 Feasibility Analysis Hotel Arizona – Tucson, Arizona 134
8. Feasibility Analysis
Return on investment can be defined as the future benefits of an income-producing property relative to its acquisition or construction cost. The first step in performing a return on investment analysis is to determine the amount to be initially invested. For a proposed property, this amount is most likely to be the development cost of the hotel. Based on the total development cost, the individual investor will utilize a return on investment analysis to determine if the future cash flow from a current cash outlay meets his or her own investment criteria and at what level above or below this amount such an outlay exceeds or fails to meet these criteria. As an individual or company considering investment in hotel real estate, the decision to use one’s own cash, an equity partner's capital, or lender financing will be an internal one. Because hotels typically require a substantial investment, only the largest investors and hotel companies generally have the means to purchase properties with all cash. We would anticipate the involvement of some financing by a third party for the typical investor or for those who may be entering the market for hotel acquisitions at this time. In leveraged acquisitions and developments where investors typically purchase or build upon real estate with a small amount of equity cash (20% to 50%) and a large amount of mortgage financing (50% to 80%), it is important for the equity investor to acknowledge the return requirements of the debt participant (mortgagee), as well as his or her own return requirements. Therefore, we will begin our rate of return analysis by reviewing the debt requirements of typical hotel mortgagees. Because the subject property is a proposed hotel, we have relied upon the actual development budget for the proposed subject hotel in performing a cost analysis. As this budget takes into consideration all of the physical, structural, and design elements specific to the property, it is believed to be the most accurate assessment of the actual cost of developing a hotel facility of this type. The details of this budget, prepared by the developers of the Hotel Arizona, are presented in the following table.
Construction Cost Estimate

April-2017 Feasibility Analysis Hotel Arizona – Tucson, Arizona 135
FIGURE 8-1 SUBJECT PROPERTY CONSTRUCTION BUDGET
Component
General/Fire Safety$525,000 $1,699
410,000 1,327$935,000 $3,026
Basic Standard Issues$400,000 $1,294
350,000 1,133 645,000 2,087
Subtotal Bas ic Standard Is sues 1,395,000 $4,515Site
$115,000 $37275,000 243
342,000 1,107$532,000 $1,722
Building Exterior$170,000 $550
25,000 81100,000 324800,000 2,589
$1,095,000 $3,544 Public Areas
$455,000 $1,472 20,000 65
320,000 1,036$795,000 $2,573
Food and Beverage Facilities $250,000 $809
150,000 485500,000 1,618
$900,000 $2,913 Meeting Spaces
$335,000 $1,084 72,500 235
150,000 48550,000 162
100,000 32460,000 194
$767,500 $2,484 Recreational Areas
$150,000 $485 310,000 1,003
$460,000 $1,489 Back of House
$250,000 $809 250,000 809
57,500 18675,000 243
$632,500 $2,047 Guest Support and Circulation Areas
$66,000 $214 15,000 49
510,000 1,650130,000 421150,000 485
60,000 194$931,000 $3,013
Guest Rooms$6,545,000 $21,181
55,000 1782,397,000 7,757
$8,997,000 $29,117
Tota l $17,440,000 $56,440
Subtotal Guest Rooms
Subtotal Guest Support and Circulation Areas
GuestroomsSpecia l ty Sui tesGuest Bathrooms
Guest LaundryCorridorsElevator LobbiesElevatorsSta irwel l s
Main LaundryStorage RoomsService Corridors
Subtotal Back of House
Vending
Fitness CenterPool Areas
Subtotal Recreational Areas
General
Subtotal Meeting Spaces
Bal l rooms Meeting Room Pre-FunctionMeeting Rooms
Subtotal Publ i c Areas
Lounge Faci l i ti esRestaurant Faci l i ti esKitchens
Subtotal Food and Beverage Faci l i ties
Cost per RoomCost
General
Subtotal Si te
GroundsSignage
Structure
Subtotal General /Fi re Sa fety
Entrance/Lobby/Regis tration AreaRetai l ShopPubl i c Restrooms
Bui ldi ngPorte Cochere
Subtotal Exterior
Parking
Fire Sa fety
Technol ogyMechanica l/Electrica l/Plumbing
DoorsWindows
GeneralBal l room Pre-Function
Board Rooms

April-2017 Feasibility Analysis Hotel Arizona – Tucson, Arizona 136
Hotel financing, while still available for most tiers of the lodging industry, has become more challenging to procure since mid-year 2015 given the concerns about rising levels of new supply and potential economic volatility. The CMBS market has been most affected because of this shifting environment. While many lenders remain active, underwriting standards are becoming more stringent. Lenders continue to be attracted to the lodging industry because of the higher yields generated by hotel financing relative to other commercial real estate, and the industry continues to perform strongly in most markets. To varying degrees and with some market selectivity, commercial banks, mortgage REITs, insurance companies, and CMBS and mezzanine lenders continue to pursue deals. Data for the mortgage component may be developed from statistics of actual hotel mortgages made by long-term lenders. The American Council of Life Insurance, which represents 20 large life insurance companies, publishes quarterly information pertaining to the hotel mortgages issued by its member companies. Because of the six- to nine-month lag time in reporting and publishing hotel mortgage statistics, it was necessary to update this information to reflect current lending practices. Our research indicates that the greatest degree of correlation exists between the average interest rate of a hotel mortgage and the concurrent yield on an average-A corporate bond. The following chart summarizes the average mortgage interest rates of the hotel loans made by these lenders. For the purpose of comparison, the average-A corporate bond yield (as reported by Moody's Bond Record) is also shown.
Mortgage Component

April-2017 Feasibility Analysis Hotel Arizona – Tucson, Arizona 137
FIGURE 8-2 AVERAGE MORTGAGE INTEREST RATES AND AVERAGE-A CORPORATE BOND YIELDS
3.0
4.0
5.0
6.0
7.0
8.0
9.0
2007
- 3r
d
2008
- 1s
t
2008
- 3r
d
2009
- 1s
t
2009
- 3r
d
2010
- 1s
t
2010
- 3r
d
2011
- 1s
t
2011
- 3r
d
2012
- 1s
t
2012
- 3r
d
2013
- 1s
t
2013
- 3r
d
2014
- 1s
t
2014
- 3r
d
2015
- 1s
t
2015
- 3r
d
2016
- 1s
t
2016
- 3r
d
Rate
(%)
Sources: American Council of Life Insurance, Moody's Bond Record, HVS
Avg. Interest Rate (%) Avg. A Corp. Bond Yield (%)
The relationship between hotel interest rates and the yields from the average-A corporate bond can be detailed through a regression analysis, which is expressed as follows.
Y = 0.95520400 X + 0.77974091 Where: Y = Estimated Hotel Mortgage Interest Rate
X = Current Average-A Corporate Bond Yield (Coefficient of correlation is 94%) The April 5, 2017, average yield on average-A corporate bonds, as reported by Moody’s Investors Service, was 4.17%. When used in the previously presented equation, a factor of 4.17 produces an estimated hotel/motel interest rate of 4.76% (rounded). Despite the recent interest rate increases, hotel debt remains available at favorable interest rates, though some lenders have pulled out of the market, and underwriting standards have become more stringent. The most prevalent interest rates for single hotel assets are currently ranging from 5.0% to 7.0%, depending on the type of debt, loan-to-value ratio, and the quality of the asset and its market.

April-2017 Feasibility Analysis Hotel Arizona – Tucson, Arizona 138
In addition to the mortgage interest rate estimate derived from this regression analysis, HVS constantly monitors the terms of hotel mortgage loans made by our institutional lending clients. Fixed-rate debt is being priced at roughly 250 to 500 basis points over the corresponding yield on treasury notes. As of April 5, 2017, the yield on the ten-year T-bill was 2.43%, indicating an interest rate range from 4.9% to 7.4%. The hotel investment market has been very active given the strong performance of this sector and low interest rates in recent years. The Federal Reserve, which raised the federal funds rate by 25 bps at the close of 2015 and another 25 bps in March 2017, is anticipated to raise interest rates two more times in 2017. Hotel mortgage interest rates have been slightly influenced by the recent rate increases by the Fed given the contraction in interest-rate spreads; however, future increases by the Fed raises the prospect of a higher cost of debt capital for hotel investors later in 2017. Hotel values have not yet been affected by the rise in the Fed rate; furthermore, debt capital is expected to remain available at favorable interest rates in the near term. At present, we find that lenders that are active in the market are using loan-to-value ratios of 60% to 75% and amortization periods of 20 to 30 years. Based on our analysis of the current lodging industry mortgage market and adjustments for specific factors, such as the proposed property’s location and conditions in the Tucson hotel market, it is our opinion that a 5.00% interest, 25-year amortization mortgage with a 0.070151 constant is appropriate for the proposed subject hotel. In the mortgage-equity analysis, we have applied a loan-to-cost ratio of 65%, which is reasonable to expect based on this interest rate and current parameters. The remaining capital required for a hotel investment generally comes from the equity investor. The rate of return that an equity investor expects over a ten-year holding period is known as the equity yield. Unlike the equity dividend, which is a short-term rate of return, the equity yield specifically considers a long-term holding period (generally ten years), annual inflation- adjusted cash flows, property appreciation, mortgage amortization, and proceeds from a sale at the end of the holding period. To establish an appropriate equity yield rate, we have used two sources of data: past appraisals and investor interviews. Hotel Sales – Each appraisal performed by HVS uses a mortgage-equity approach in which income is projected and then discounted to a current value at rates reflecting the cost of debt and equity capital. In the case of hotels that were sold near the date of our valuation, we were able to derive the equity yield rate and unlevered discount rate by inserting the ten-year projection, total investment (purchase price and estimated capital expenditure and/or PIP) and debt assumptions into a valuation model and solving for the equity yield. The overall capitalization rates for the historical income and projected first-year income are based on the sales price
Equity Component

April-2017 Feasibility Analysis Hotel Arizona – Tucson, Arizona 139
“as is.” The following table shows a representative sample of hotels that were sold on or about the time that we appraised them, along with the derived equity return and discount rates based on the purchase price and our forecast.
FIGURE 8-3 SAMPLE OF HOTELS SOLD – FULL-SERVICE & LUXURY
Hotel Location
George Washington Univ. Inn Washington, D.C. 95 Dec-16 11.2 % 18.3 % 4.5 % 4.6 %Hi l ton Bel levue Bel levue, WA 353 Dec-16 10.8 18.6 7.5 8.5Hi l ton Phoenix Ai rport Phoenix, AZ 259 Nov-16 9.9 17.5 7.9 8.2Affinia Ma nhattan New York, NY 618 Nov-16 8.8 14.8 5.1 4.8Ra diss on Whittier, CA 202 Oct-16 10.2 18.3 3.3 7.5Hol iday Inn Houston Webs ter Webster, TX 109 Oct-16 11.3 22.1 7.0 8.0Marriott San Francisco Ai rport San Mateo, CA 476 Sep-16 10.3 16.9 8.6 8.0Hi l ton Orange County Ai rport Irvine, CA 306 Sep-16 10.3 18.9 7.3 7.7Sheraton Sal t La ke Ci ty Center Sal t Lake Ci ty, UT 362 Aug-16 12.6 21.8 9.4 9.5Westin Ha rbour Is land Tampa, FL 299 Jul -16 8.5 14.3 5.9 6.7Hi l ton Melvi l le, NY 305 Jul -16 10.5 18.5 8.6 8.4Hyatt Regency Tech Center Denver, CO 451 Jul -16 9.0 15.6 7.3 7.6John Jeffries Hous e Boston, MA 46 Jul -16 7.2 10.5 3.4 —Marriott San Jose, CA 510 Jul -16 10.4 17.7 6.5 8.0Hi l ton Sui tes Phoenix, AZ 226 Jun-16 9.0 15.5 11.9 10.5Rosewood Cres cent Hotel Da lla s , TX 220 Jun-16 9.0 15.7 4.0 5.7Hi l ton Tampa, FL 521 Jun-16 9.5 17.2 6.5 7.3NYLO New York, NY 282 Jun-16 9.9 17.2 5.8 6.3Marriott Atlanta, GA 341 Jun-16 10.9 19.1 8.2 7.7Hol iday Inn Hotel & Sui tes Lima , OH 116 Jun-16 12.3 22.0 13.6 12.4DoubleTree by Hi l ton Newark, NJ 504 Jun-16 9.9 15.8 5.7 6.1Ra diss on Downtown Austin, TX 413 May-16 10.5 17.2 3.9 4.3DoubleTree by Hi l ton Washington, D.C. 220 Apr-16 10.3 17.9 5.6 2.2Wine Country Inn Saint Helena, CA 29 Mar-16 10.9 19.2 5.9 6.3Hol iday Inn Mobi le, AL 97 Mar-16 10.2 18.4 7.9 8.0Hi l ton Sui tes Brentwood, TN 203 Mar-16 11.0 22.7 7.5 8.8Hyatt Regency Rochester Rochester, NY 338 Feb-16 10.9 17.1 10.7 5.2Hol iday Inn Li ttle Rock, AR 150 Feb-16 11.3 19.5 10.0 12.3La Jol la Inn La Jol la , CA 23 Feb-16 11.8 20.2 7.0 7.7Sheraton Saint Louis , MO 288 Feb-16 11.2 17.2 — —Equinox Golf Res ort & Spa Manches ter Vi l lage, VT 195 Feb-16 10.1 19.1 7.0 7.2Marriott Sal t Lake Ci ty, UT 217 Feb-16 11.1 19.2 8.9 10.3Renaiss ance Chicago, IL 332 Feb-16 10.3 16.7 5.8 7.0Lambertvi l le Hous e Lambertvi l le, NJ 26 Jan-16 11.1 19.0 8.2 8.2Strand Hotel New York, NY 177 Jan-16 6.8 10.3 4.5 4.7Hyatt Regency Valencia , CA 244 Jan-16 10.7 19.8 7.2 8.6Marriott Detroi t Troy Troy, MI 350 Jan-16 9.7 17.4 6.2 8.1Crowne Plaza Orange County Costa Mes a, CA 224 Jan-16 8.7 15.6 4.5 6.3
Source: HVS
Year Year Oneof Rooms of Sale Yield YieldEquity Historical
Overall RateBased on Sales Price
ProjectedPropertyTotal
Number Date
Investor Interviews - During the course of our work, we continuously monitor investor equity-yield requirements through discussions with hotel investors and brokers. We find that equity-yield rates currently range from a low in the low-to-mid teens for high-barrier-to-entry "trophy assets"; the upper teens for high quality, institutional-grade assets in strong markets; and the upper teens to low 20s for

April-2017 Feasibility Analysis Hotel Arizona – Tucson, Arizona 140
quality assets in more typical markets. Equity-yield rates tend to exceed 20% for aging assets with functional obsolescence and/or other challenging property- or market-related issues. Equity return requirements also vary with an investment’s level of leverage. Higher loan-to-value ratios are becoming more prevalent, allowing for increased equity returns. The following table summarizes the range of equity yields indicated by hotel sales and investor interviews. We note that there tends to be a lag between the sales data and current market conditions, and thus, the full effect of the change in the economy and capital markets may not yet be reflected. FIGURE 8-4 SUMMARY OF EQUITY YIELD OR INTERNAL RATE OF RETURN
REQUIREMENTS
Source Data Point Range Average
HVS Hotel Sa les - Ful l -Service & Luxury 10.3% - 22.7% 17.7%HVS Hotel Sa les - Select-Service & Extended-Stay 14.2% - 22.4% 19.1%HVS Hotel Sa les - Budget/Economy 15.6% - 25.3% 20.8%
HVS Investor Interviews 13% - 25%
Based on the assumed 65% loan-to-cost ratio, the risk inherent in achieving the projected income stream, and the anticipated market position of the subject property, it is our opinion that an equity investor would expect to receive a 17.5% internal rate of return over a 10-year holding period, assuming that the investor obtains financing at the time of the project’s completion at the loan-to-cost ratio and interest rate set forth. Inherent in this valuation process is the assumption of a sale at the end of the ten-year holding period. The estimated reversionary sale price as of that date is calculated by capitalizing the projected eleventh-year net income by an overall terminal capitalization rate. An allocation for the selling expenses is deducted from this sale price, and the net proceeds to the equity interest (also known as the equity residual) are calculated by deducting the outstanding mortgage balance from the reversion. We have reviewed several recent investor surveys. The following chart summarizes the averages presented for terminal capitalization rates in various investor surveys during the past decade.
Terminal Capitalization Rate

April-2017 Feasibility Analysis Hotel Arizona – Tucson, Arizona 141
FIGURE 8-5 HISTORICAL TRENDS OF TERMINAL CAPITALIZATION RATES
7.0
8.0
9.0
10.0
11.0
12.0
13.0
2007
2008
2009
2010
2011
2012
2013
2014
2015
2016
2017
Term
inal
Cap
Rat
e (%
)
PWC - Full-Service PWC - Limited-ServiceSitus RERC - First Tier Situs RERC - Second TierPWC - Select-Service Situs RERC - Third Tier
FIGURE 8-6 TERMINAL CAPITALIZATION RATES DERIVED FROM INVESTOR SURVEYS
Source Data Point Range Average
PWC Rea l Es tate Investor Survey - 1s t Quarter 2017 Select-Service Hotels 7.0% - 10.75% 9.0% Ful l -Service Hotels 7.0% - 10.0% 8.4% Luxury Hotels 5.5% - 9.5% 7.2%
USRC Hotel Investment Survey - Mid-Year 2016 Ful l -Service Hotels 7.5% - 9.0% 8.0%
Si tus RERC Real Estate Report - 3rd Quarter 2016 Fi rs t Tier Hotels 6.5% - 10.5% 8.5%
For purposes of this analysis, we have applied a terminal capitalization rate of 9.0%. Our final position for the terminal capitalization rate reflects the current market for hotel investments. Terminal capitalization rates, which have remained stable over the past few years, have yet to reflect any change in investor expectations. Terminal cap rates are at the low end of the range for quality hotel assets in markets with high barriers to entry and at the high end of the range for older assets or for those

April-2017 Feasibility Analysis Hotel Arizona – Tucson, Arizona 142
suffering from functional obsolescence and/or weak market conditions, reflecting the market's recognition that certain assets have less opportunity for significant appreciation. As the two participants in a real estate investment, investors and lenders must evaluate their equity and debt contributions based on their particular return requirements. After carefully weighing the risk associated with the projected economic benefits of a lodging investment, the participants will typically make their decision whether or not to invest in a hotel or resort by determining if their investment will provide an adequate yield over an established period. For the lender, this yield will typically reflect the interest rate required for a hotel mortgage over a period of what can range from seven to ten years. The yield to the equity participant may consider not only the requirements of a particular investor, but also the potential payments to cooperative or ancillary entities such as limited partner payouts, stockholder dividends, and management company incentive fees. The return on investment analysis in a hotel acquisition would not be complete without recognizing and reflecting the yield requirements of both the equity and debt participants. The analysis will now calculate the yields to the mortgage and equity participants during a ten-year projection period. The annual debt service is calculated by multiplying the mortgage component by the mortgage constant.
Mortgage Component $35,594,000Mortgage Constant 0.070151 Annual Debt Service $2,496,948
The yield to the lender based on a 65% debt contribution equates to an interest rate of 5.00%, which is calculated as follows.
Mortgage-Equity Method

April-2017 Feasibility Analysis Hotel Arizona – Tucson, Arizona 143
FIGURE 8-7 RETURN TO THE LENDER
Total Annual Present Worth of $1 DiscountedYear Debt Service Factor at 4.9% Cash Flow
2019 $2,497,000 x 0.952963 = $2,380,0002020 2,497,000 x 0.908138 = 2,268,0002021 2,497,000 x 0.865421 = 2,161,0002022 2,497,000 x 0.824714 = 2,059,0002023 2,497,000 x 0.785922 = 1,962,0002024 2,497,000 x 0.748954 = 1,870,0002025 2,497,000 x 0.713725 = 1,782,0002026 2,497,000 x 0.680153 = 1,698,0002027 2,497,000 x 0.648161 = 1,618,0002028 28,809,000 * x 0.617673 = 17,795,000
Value of Mortgage Component $35,593,000
*10th year debt service of $2,497,000 plus outstanding mortgage balance of $26,312,000
The following table illustrates the cash flow available to the equity position, after deducting the debt service from the projected net income. FIGURE 8-8 NET INCOME TO EQUITY
Net IncomeAvailable for Total Annual Net Income
Year Debt Service Debt Service to Equity
2019 $2,434,840 - $2,497,000 = ($62,160)2020 3,770,691 - 2,497,000 = 1,273,6912021 4,547,836 - 2,497,000 = 2,050,8362022 4,818,942 - 2,497,000 = 2,321,9422023 4,962,876 - 2,497,000 = 2,465,8762024 5,112,279 - 2,497,000 = 2,615,2792025 5,265,467 - 2,497,000 = 2,768,4672026 5,423,102 - 2,497,000 = 2,926,1022027 5,585,842 - 2,497,000 = 3,088,8422028 5,753,559 - 2,497,000 = 3,256,559
In order for the present value of the equity investment to equate to the $19,167,000 capital outlay, the investor must accept a 14.8% return, as shown in the following table.
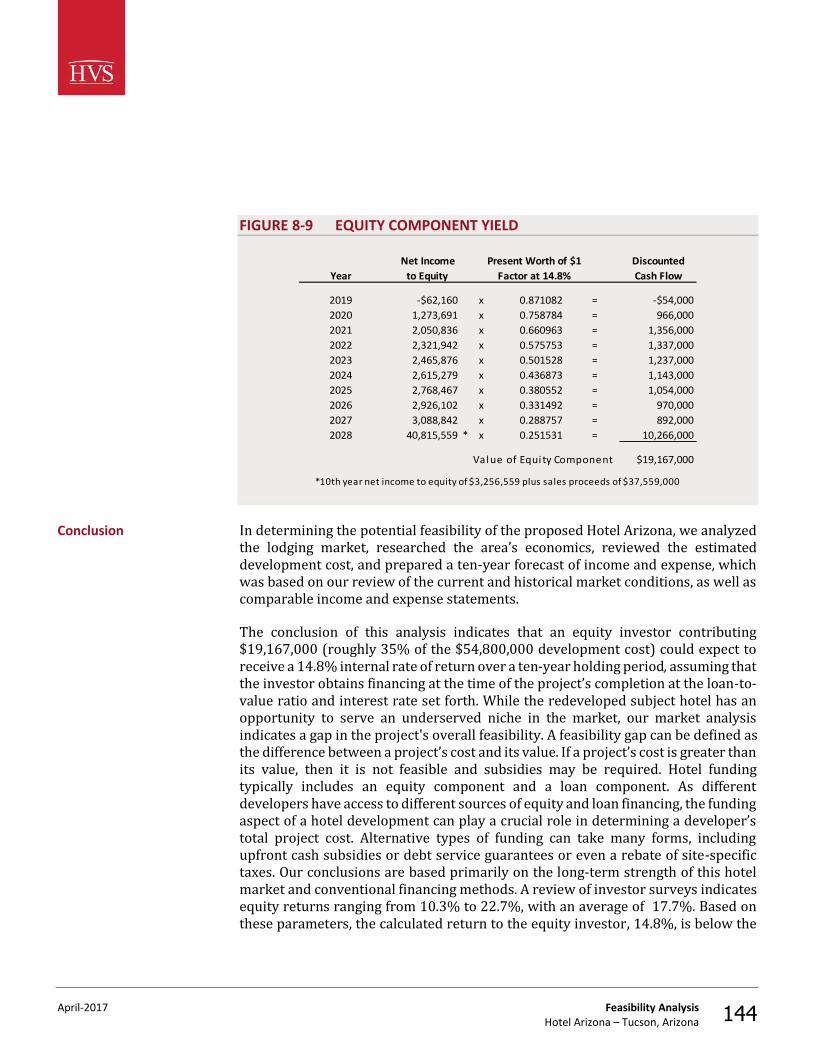
April-2017 Feasibility Analysis Hotel Arizona – Tucson, Arizona 144
FIGURE 8-9 EQUITY COMPONENT YIELD
Net Income Present Worth of $1 DiscountedYear to Equity Factor at 14.8% Cash Flow
2019 -$62,160 x 0.871082 = -$54,0002020 1,273,691 x 0.758784 = 966,0002021 2,050,836 x 0.660963 = 1,356,0002022 2,321,942 x 0.575753 = 1,337,0002023 2,465,876 x 0.501528 = 1,237,0002024 2,615,279 x 0.436873 = 1,143,0002025 2,768,467 x 0.380552 = 1,054,0002026 2,926,102 x 0.331492 = 970,0002027 3,088,842 x 0.288757 = 892,0002028 40,815,559 * x 0.251531 = 10,266,000
Value of Equi ty Component $19,167,000
*10th year net income to equity of $3,256,559 plus sales proceeds of $37,559,000
In determining the potential feasibility of the proposed Hotel Arizona, we analyzed the lodging market, researched the area’s economics, reviewed the estimated development cost, and prepared a ten-year forecast of income and expense, which was based on our review of the current and historical market conditions, as well as comparable income and expense statements. The conclusion of this analysis indicates that an equity investor contributing $19,167,000 (roughly 35% of the $54,800,000 development cost) could expect to receive a 14.8% internal rate of return over a ten-year holding period, assuming that the investor obtains financing at the time of the project’s completion at the loan-to-value ratio and interest rate set forth. While the redeveloped subject hotel has an opportunity to serve an underserved niche in the market, our market analysis indicates a gap in the project's overall feasibility. A feasibility gap can be defined as the difference between a project’s cost and its value. If a project’s cost is greater than its value, then it is not feasible and subsidies may be required. Hotel funding typically includes an equity component and a loan component. As different developers have access to different sources of equity and loan financing, the funding aspect of a hotel development can play a crucial role in determining a developer’s total project cost. Alternative types of funding can take many forms, including upfront cash subsidies or debt service guarantees or even a rebate of site-specific taxes. Our conclusions are based primarily on the long-term strength of this hotel market and conventional financing methods. A review of investor surveys indicates equity returns ranging from 10.3% to 22.7%, with an average of 17.7%. Based on these parameters, the calculated return to the equity investor, 14.8%, is below the
Conclusion

April-2017 Feasibility Analysis Hotel Arizona – Tucson, Arizona 145
average of market-level returns given the anticipated cost of approximately $54,800,000. The analysis is based on the extraordinary assumption that the described improvements have been renovated as of the stated date of opening. The reader should understand that the subject property's structure does exist as of the date of this report. Our feasibility study does not address unforeseeable events that could alter the redevelopment project and/or the market conditions reflected in the analyses; we assume that no significant changes, other than those anticipated and explained in this report, shall take place between the date of inspection and stated date of opening. The use of this extraordinary assumption may have affected the assignment results. We have made no other extraordinary assumptions specific to this feasibility study. However, several important general assumptions have been made that apply to this feasibility study and our studies of proposed hotels in general. These aspects are set forth in the Assumptions and Limiting Conditions chapter of this report.

April-2017 Statement of Assumptions and Limiting Conditions Hotel Arizona – Tucson, Arizona 146
9. Statement of Assumptions and Limiting Conditions
1. This report is set forth as a feasibility study of the proposed subject hotel; this is not an appraisal report.
2. This report is to be used in whole and not in part. 3. No responsibility is assumed for matters of a legal nature, nor do we render
any opinion as to title, which is assumed marketable and free of any deed restrictions and easements. The property is evaluated as though free and clear unless otherwise stated.
4. We assume that there are no hidden or unapparent conditions of the sub-soil or structures, such as underground storage tanks, that would affect the property’s development potential. No responsibility is assumed for these conditions or for any engineering that may be required to discover them.
5. We have not considered the presence of potentially hazardous materials or any form of toxic waste on the project site. We are not qualified to detect hazardous substances and urge the client to retain an expert in this field if desired.
6. The Americans with Disabilities Act (ADA) became effective on January 26, 1992. We have assumed the proposed hotel would be designed and constructed to be in full compliance with the ADA.
7. We have made no survey of the site, and we assume no responsibility in connection with such matters. Sketches, photographs, maps, and other exhibits are included to assist the reader in visualizing the property. It is assumed that the use of the described real estate will be within the boundaries of the property described, and that no encroachment will exist.
8. All information, financial operating statements, estimates, and opinions obtained from parties not employed by TS Worldwide, LLC are assumed true and correct. We can assume no liability resulting from misinformation.
9. Unless noted, we assume that there are no encroachments, zoning violations, or building violations encumbering the subject property.
10. The property is assumed to be in full compliance with all applicable federal, state, local, and private codes, laws, consents, licenses, and regulations (including the appropriate liquor license if applicable), and that all licenses, permits, certificates, franchises, and so forth can be freely renewed or transferred to a purchaser.

April-2017 Statement of Assumptions and Limiting Conditions Hotel Arizona – Tucson, Arizona 147
11. All mortgages, liens, encumbrances, leases, and servitudes have been disregarded unless specified otherwise.
12. None of this material may be reproduced in any form without our written permission, and the report cannot be disseminated to the public through advertising, public relations, news, sales, or other media.
13. We are not required to give testimony or attendance in court because of this analysis without previous arrangements, and shall do so only when our standard per-diem fees and travel costs have been paid prior to the appearance.
14. If the reader is making a fiduciary or individual investment decision and has any questions concerning the material presented in this report, it is recommended that the reader contact us.
15. We take no responsibility for any events or circumstances that take place subsequent to the date of our field inspection.
16. The quality of a lodging facility's onsite management has a direct effect on a property's economic viability. The financial forecasts presented in this analysis assume responsible ownership and competent management. Any departure from this assumption may have a significant impact on the projected operating results.
17. The financial analysis presented in this report is based upon assumptions, estimates, and evaluations of the market conditions in the local and national economy, which may be subject to sharp rises and declines. Over the projection period considered in our analysis, wages and other operating expenses may increase or decrease because of market volatility and economic forces outside the control of the hotel’s management. We assume that the price of hotel rooms, food, beverages, and other sources of revenue to the hotel will be adjusted to offset any increases or decreases in related costs. We do not warrant that our estimates will be attained, but they have been developed based upon information obtained during the course of our market research and are intended to reflect the expectations of a typical hotel investor as of the stated date of the report.
18. This analysis assumes continuation of all Internal Revenue Service tax code provisions as stated or interpreted on either the date of value or the date of our field inspection, whichever occurs first.
19. Many of the figures presented in this report were generated using sophisticated computer models that make calculations based on numbers carried out to three or more decimal places. In the interest of simplicity, most numbers have been rounded to the nearest tenth of a percent. Thus, these figures may be subject to small rounding errors.

April-2017 Statement of Assumptions and Limiting Conditions Hotel Arizona – Tucson, Arizona 148
20. It is agreed that our liability to the client is limited to the amount of the fee paid as liquidated damages. Our responsibility is limited to the client, and use of this report by third parties shall be solely at the risk of the client and/or third parties. The use of this report is also subject to the terms and conditions set forth in our engagement letter with the client.
21. Evaluating and comprising financial forecasts for hotels is both a science and an art. Although this analysis employs various mathematical calculations to provide value indications, the final forecasts are subjective and may be influenced by our experience and other factors not specifically set forth in this report.
22. This study was prepared by TS Worldwide, LLC. All opinions, recommendations, and conclusions expressed during the course of this assignment are rendered by the staff of TS Worldwide, LLC as employees, rather than as individuals.

April-2017 Certification Hotel Arizona – Tucson, Arizona 149
10. Certification
The undersigned hereby certify that, to the best of our knowledge and belief: 1. the statements of fact presented in this report are true and correct; 2. the reported analyses, opinions, and conclusions are limited only by the
reported assumptions and limiting conditions, and are our personal, impartial, and unbiased professional analyses, opinions, and conclusions;
3. we have no present or prospective interest in the property that is the subject of this report and no personal interest with respect to the parties involved;
4. we have no bias with respect to the property that is the subject of this report or to the parties involved with this assignment;
5. our engagement in this assignment was not contingent upon developing or reporting predetermined results;
6. our compensation for completing this assignment is not contingent upon the development or reporting of a predetermined result or direction in performance that favors the cause of the client, the attainment of a stipulated result, or the occurrence of a subsequent event directly related to the intended use of this study;
7. our analyses, opinions, and conclusions were developed, and this report has been prepared, in conformity with the Uniform Standards of Professional Appraisal Practice;
8. Ryan M. Wall personally inspected the property described in this report; 9. no one other than those listed above and the undersigned prepared the
analyses, conclusions, and opinions concerning the real estate that are set forth in this report; Ryan M. Wall has not performed services, as an appraiser or in any other capacity, on the property that is the subject of this report within the three-year period immediately preceding acceptance of this assignment;
10. the reported analyses, opinions, and conclusions were developed, and this report has been prepared, in conformity with the requirements of the Code of Professional Ethics and the Standards of Professional Appraisal Practice of the Appraisal Institute;
11. the use of this report is subject to the requirements of the Appraisal Institute relating to review by its duly authorized representatives; and

April-2017 Certification Hotel Arizona – Tucson, Arizona 150
12.
DRAFT REPORT Ryan M. Wall Vice President TS Worldwide, LLC State Appraiser License (AZ) 32100

Convention, Sports & Entertainment Facilities Consulting Chicago, Illinois
DRAFT May 31, 2017 Induced Demand Analysis Tucson Convention Center
A-1
A. Induced Demand Analysis
HVS conducted an induced demand analysis for the Tucson Convention Center (“TCC”) considering the reopening of the 309-room Hotel Arizona on a site adjacent to the TCC. As a part of this analysis, HVS performed the following tasks.
1. Compiled data on 14 competitive convention centers and hotels in the southwestern U.S.,
2. Analyzed four years of historical demand for the TCC and lost business reports,
3. Prepared a forecast of event demand for the TCC assuming the reopening of the proposed hotel, and
4. Projected the incremental room nights in the Tucson market associated with the increases in TCC demand.
The TCC is the main convention and trade show venue in the market. The venue is centrally located in downtown Tucson, Arizona. Owned by the city of Tucson and operated by a private management company, the convention complex includes the exhibit, banquet and meeting space, as well as an arena and two performing arts venues. Constructed in 1971, the TCC has 205,000 square feet of event space. In 2014, the facility underwent a $7.8 million renovation funded through the Rio Nuevo Multipurpose District. The renovation focused on enhancing arena patron amenities, including new concession stands, seats, and lighting and speaker systems, along with improvements to arena entrances and restrooms. After securing a minor-league hockey tenant, a 2016 renovation featured $3.7 million in new locker rooms, team weight room, and team offices. The following figure presents the floor plan of the TCC complex.
The Tucson Convention Center

Convention, Sports & Entertainment Facilities Consulting Chicago, Illinois
DRAFT May 31, 2017 Induced Demand Analysis Tucson Convention Center
A-2
FIGURE A-1 TUCSON CONVENTION CENTER
Source: Tucson Convention Center
TCC’s exhibit space is located on the lower level of the convention center. The main exhibit hall measures approximately 90,000 square feet and is divisible into two sections measuring approximately 30,000 and 60,000 square feet. The adjacent Galleria connects the exhibit hall and the grand ballroom. The 24,000-square foot North Hall is adjacent to the TCC Arena, which can also accommodate additional 30,000 square feet of exhibition when necessary. Located on the Mezzanine Level of the TCC, the 20,000-square foot Grand Ballroom is divisible into three sections and can accommodate up to 1,200 persons in a

Convention, Sports & Entertainment Facilities Consulting Chicago, Illinois
DRAFT May 31, 2017 Induced Demand Analysis Tucson Convention Center
A-3
banquet setting. The adjacent Grand Lobby provides approximately 11,000 square feet of multi-purpose space. Meeting planners use this space for pre-event registration, merchandise sales, and receptions. The Galleria allows access to the lower level and the main exhibit hall. TCC meeting rooms are located on the concourse level overlooking the Arena. The center’s eight meeting rooms provide 700 to 1800 square feet of breakout space appropriate for meetings, training sessions, and other small group events. The TCC arena has capacity for 7,440 attendees. Primary tenants include the University of Arizona hockey teams and the Tucson Roadrunners of the American Hockey League (“AHL”). In addition to previously described exhibit hall, banquet, meeting space, and arena the TCC also has an two performing arts facilities accessible from the main building via an outdoor walkway. The outdoor area provides additional space for receptions and outdoor events. The Tucson Music Hall seats 2,289 and is home to the Tucson Symphony Orchestra and hosts local and touring dance and music shows. The Leo Rich Theater can seat 511 patrons and is the smallest performing venue at the TCC. The Theater is often used for opening ceremonies and presentations for large events; it also hosts a wide range of local and touring performing arts groups like the Arizona Friend of Chamber of Music and the Tucson Academy of Ballet. This analysis of comparable venues provides a basis for developing program recommendations and forecasts of event demand and financial operations. Event planners select host cities for their events based the overall package that a city may offer. Several factors determine a city’s overall strength and potential in the meetings market. These factors include the attributes of the convention facilities, lodging supply, the economic and demographic profile of the community, transportation access, tourism amenities, and overall destination appeal. HVS compares the function spaces, adjacent hotel capacities, and other characteristics of the markets relevant to the success of the venues. We conclude with an assessment of the relative strengths and weaknesses of the TCC. HVS analyzed two sets of venues: • Hotels and resorts in the Tucson metropolitan area that offer significant
amounts of function space for events that compete with the TCC for conferences and large meetings, and
• Convention centers in Arizona and other medium-sized markets throughout the southwestern U.S. that compete with the TCC for state and regional business.
HVS analyzed the comparable venues listed in the figure below.
Comparable Venues

Convention, Sports & Entertainment Facilities Consulting Chicago, Illinois
DRAFT May 31, 2017 Induced Demand Analysis Tucson Convention Center
A-4
FIGURE A-2 COMPARABLE PROPERTIES
Name of Venue Location
Tucson Area CompetitorsTucson Convention Center 145,524Westi n La Pa loma Res ort & Spa 46,524Hi l ton Tucs on El Conquis tador 42,062JW Marriott Tucson Res ort 41,170Cas i no Del Sol Resort 19,642DoubleTree Tucson Rei d Park 16,297Loews Ventana Canyon Res ort 15,542
Regional CompetitorsPhoenix Convention Center Phoenix, AZ 870,690Albuquerque Convention Center Albuquerque, NM 238,205Cox Bus iness Center Tul sa , OK 194,103Tucson Convention Center Tucson, AZ 145,524Palm Springs Convention Center Palm Springs , CA 132,190Fres no Convention Center Fresno, CA 123,738Ontario Convention Center Ontario, CA 115,187El Pas o Convention Center El Paso, TX 94,900Mes a Convention Center Mesa, AZ 29,377
Sources: Respective Venues
Total Function Space
Each of the above properties offer meeting and conference space for a variety of group event types, including small conventions, conferences, meetings, weddings, and other social events. An analysis of the sizes and capacities of the various components of the properties help inform a competitive assessment of the TCC. As the primary convention venue in the state of Arizona, we include the Phoenix Convention Center. But, due to its size, the TCC is only partially competitive with the Phoenix venue. Critical for several types of events such as conventions, tradeshows, and consumer shows, the amount and quality of exhibition space determines the size and type of events that a venue can accommodate. The following figure compares exhibit capacity in the regional competitors.
Exhibit Space Assessment

Convention, Sports & Entertainment Facilities Consulting Chicago, Illinois
DRAFT May 31, 2017 Induced Demand Analysis Tucson Convention Center
A-5
FIGURE A-3 EXHIBIT SPACE COMPARABLE PROPERTIES
Phoenix Convention Center Phoeni x 584,500 13Albuquerque Conventi on Center Albuquerque 160,646 4
Tucson Convention Center Tucson 113,940 2Cox Bus iness Center Tulsa 102,600 3
Palm Springs Convention Center Pal m Spri ngs 92,545 5El Pas o Convention Center El Paso 80,000 3Ontario Conventi on Center Ontario 69,325 2Fresno Convention Center Fresno 67,000 3
Mes a Convention Center Mesa 15,000 1Average 142,840 4
Sources: Respective Venues
The TCC has the only exhibition hall in the local market, and its exhibit capacity compares favorably with most of its regional competitors. Banquet space is important for convention centers as facility operators attempt to grow food service revenues at their facilities and event planners seek a higher level of service for their attendees. In addition to social events (such as weddings and fundraisers) that host banquets, several other types of events, such as conventions and tradeshows, typically require food services in a ballroom setting. Consequently, the size of the ballroom can determine a venue’s event size capacity. Divisibility of the ballroom determines a venue’s capability to host simultaneous events that require banquet space. The figure below compares of available banquet space in the comparable properties.
Ballroom Space Assessment

Convention, Sports & Entertainment Facilities Consulting Chicago, Illinois
DRAFT May 31, 2017 Induced Demand Analysis Tucson Convention Center
A-6
FIGURE A-4 BALLROOM SPACE IN COMPARABLE PROPERTIES
Tucson Area Competitors sf # divisionsJW Marriott Tucs on Resort 34,506 22
Westi n La Pa loma Resort & Spa 30,927 7Hi l ton Tucson El Conquis tador 23,540 8
Tucson Convention Center 20,164 3Cas ino Del Sol Resort 18,000 5
Loews Ventana Canyon Resort 12,014 10DoubleTree Tucs on Reid Park 9,278 8
Average 21,204 9Regional Competitors
Phoenix Conventi on Center Phoenix 118,800 9Albuquerque Convention Center Albuquerque 31,164 3
Cox Bus iness Center Tulsa 21,388 3Tucson Convention Center Tucson 20,164 3
Palm Springs Conventi on Center Palm Springs 20,016 4Ontario Convention Center Ontario 19,626 3Fresno Conventi on Center Fresno 13,129 7
Mes a Convention Center Mesa 5,100 2El Pas o Convention Center El Paso 0 0
Average 31,173 4Sources: Respective Venues
Many local properties have large, flexible ballroom spaces suitable for a variety of corporate and social events. The TCC has an average amount of banquet capacity and divisibility when compared to the competitive sets. Meeting rooms can accommodate sub-groups as they break out of larger general sessions at conventions and conferences. Additionally, these smaller rooms can accommodate self-contained meetings, training sessions, seminars, classes, and a variety of small meeting functions. The optimum amount of meeting space can vary depending on a facility’s target market. The following figure presents a comparison of available meeting space in the comparable properties and the TCC.
Meeting/Break-out Room Assessment

Convention, Sports & Entertainment Facilities Consulting Chicago, Illinois
DRAFT May 31, 2017 Induced Demand Analysis Tucson Convention Center
A-7
FIGURE A-5 MEETING SPACE IN COMPARABLE PROPERTIES
Tucson Area Competitors sf # roomsHi l ton Tucson El Conquis tador 18,522 19
Westi n La Pa loma Resort & Spa 15,597 17Tucson Convention Center 11,420 10
DoubleTree Tucs on Reid Park 7,019 9JW Marriott Tucs on Resort 6,664 8
Loews Ventana Canyon Resort 3,528 6Cas ino Del Sol Resort 1,642 3
Average 9,199 10Regional Competitors
Phoenix Conventi on Center Phoenix 167,390 107Albuquerque Convention Center Albuquerque 46,395 30
Cox Bus iness Center Tulsa 42,415 35Ontario Convention Center Ontario 26,236 24
Palm Springs Conventi on Center Palm Springs 19,629 15El Pas o Convention Center El Paso 14,900 17Fresno Conventi on Center Fresno 11,609 11
Tucson Convention Center Tucson 11,420 10Mes a Convention Center Mesa 9,277 11
Average 38,808 29Sources: Respective Venues
Greater amounts of meeting space and a greater number of meeting rooms, increase a venue’s ability to host larger events and simultaneous smaller functions. Venues with smaller amounts of dedicated meeting space often rely on flexible ballroom space for breakout meetings. The TCC has an above average amount of meeting space in the local market, but falls well below the average when compared regionally. The quality and proximity of hotel supply represents one of the most important selection factors for facility users in recent years. To attract out-of-town groups, an adequate supply of nearby hotel rooms should support the lodging needs of delegates, exhibitors, and other attendees. Event planners consider proximity and connectivity as critical factors when evaluating the overall hotel packages available in competing communities. The number of rooms offered at hotels adjacent or connected to the convention center is the key point of comparison. Other important factors include hotel brands, service levels, building ages, management, ease of access, and available meeting and banquet spaces in these hotels. The figure below compares the number adjacent hotel rooms in the comparable venues.
Adjacent Hotel Capacity

Convention, Sports & Entertainment Facilities Consulting Chicago, Illinois
DRAFT May 31, 2017 Induced Demand Analysis Tucson Convention Center
A-8
FIGURE A-6 ADJACENT HOTEL CAPACITY IN COMPARABLE PROPERTIES
Tucson Area CompetitorsJW Marriott Tucs on Res ort 575
Westi n La Pa loma Resort & Spa 487Hi l ton Tucson El Conquis tador 428Loews Ventana Canyon Res ort 398DoubleTree Tucs on Reid Park 287
Cas ino Del Sol Res ort 215Tucson Convention Center 0
Average 398Regional Competitors
Phoenix Convention Center Phoenix 1,000Ontario Convention Center Ontari o 484
Cox Bus iness Center Tuls a 417Palm Springs Convention Center Palm Springs 410
Fresno Convention Center Fres no 320Albuquerque Convention Center Albuquerque 295
Mesa Convention Center Mes a 275Tucson Convention Center Tucson 0
El Paso Convention Center El Pas o 0Average 457
Sources: Respective Venues
For integrated facilities, function space is typically proportional to the number of guest rooms it serves. Depending on the market and the ability to host city-wide events which require multiple hotel properties, the amount of function space per attached guest rooms can vary greatly. The TCC currently lacks an attached or adjacent hotel property. Most comparable convention centers have 300 to 500 attached rooms. Local area population data can provide evidence of a community’s overall economic size and ability to support public services and visitor amenities for convention center users. Because most convention centers primarily target out-of-town users, local area population figures rarely have a direct correlation with overall demand potential. However, population and income data can provide a basis for understanding a community’s ability to support and sustain a convention center, the surrounding neighborhood and market. Additionally, population can determine the demand potential for certain types of events such as locally generated meetings, banquets, religious events, graduation ceremonies, and consumer shows. The following figures present metropolitan area population and median household income data for the markets surrounding the regionally competitive set.
Market Population and Income

Convention, Sports & Entertainment Facilities Consulting Chicago, Illinois
DRAFT May 31, 2017 Induced Demand Analysis Tucson Convention Center
A-9
FIGURE A-7 METRO POPULATION OF COMPARABLE MARKETS
Market 2016 Population
Phoenix 4,584,155 Mesa 4,584,155 Ontario 4,460,387 Palm Springs 4,460,387 Tucson 1,023,093 Tulsa 992,640 Fresno 976,043 Albuquerque 915,897 El Paso 868,683
Sources: Esri
FIGURE A-8 MEDIAN HOUSEHOLD INCOME OF COMPARABLE MARKETS
Market 2016 Median HH Income
Ontario 56,973 Palm Springs 56,973 Phoenix 54,993 Mesa 54,993 Tulsa 51,532 Albuquerque 49,651 Fresno 47,405 Tucson 46,092 El Paso 40,447
Sources: Esri
While the Phoenix-Mesa and Riverside-Ontario metro areas have significantly higher population bases, Tucson ranks favorably among the remaining competitive markets with just over one million residents. Tucson’s median household income is below average. The density and breadth of a city’s corporate base indicates demand potential in the meetings industry. Businesses generate demand for conventions, conferences, training, and other industry-specific events. The following figures demonstrate how the area compares with the competitive markets with respect to the total number of business establishments.
Corporate Comparison

Convention, Sports & Entertainment Facilities Consulting Chicago, Illinois
DRAFT May 31, 2017 Induced Demand Analysis Tucson Convention Center
A-10
FIGURE A-9 BUSINESS ESTABLISHMENTS IN COMPARABLE MARKETS
Market 2016 Business Establishments
Phoenix 150,364 Mesa 150,364 Ontario 130,514 Palm Springs 130,514 Tulsa 39,996 Albuquerque 36,866 Tucson 34,432 Fresno 33,377 El Paso 23,372
Sources: Esri
Roughly following population, the number of business establishments in the Phoenix-Mesa and Riverside-Ontario metro areas are significantly higher. Compared to Tucson, most competitors have larger corporate bases from which to generate local event demand. Transportation links, including airports, play a critical role in the success of convention centers that target regional and national user groups. As one of the best indicators of an airport’s ability to enhance a convention center’s draw, air service capacity, generally measured as total annual passenger volume, indicates the relative convenience of a destination. The following figure presents 2016 passenger traffic data for the primary airports serving the competitive sets FIGURE A-10 PASSENGER VOLUME IN COMPARABLE MARKETS
Market Primary Airport Annual Passengers
Phoenix Phoenix Sky Harbor International Airport 43,383,528 Mesa Phoenix Sky Harbor International Airport 43,383,528 Albuquerque Albuquerque International Sunport 4,775,098 Ontario LA/Ontario International Airport 4,251,903 Palm Springs LA/Ontario International Airport 4,251,903 Tucson Tucson International Airport 3,283,243 Tulsa Tulsa International Airport 2,810,537 El Paso El Paso International Airport 2,807,734 Fresno Fresno Yosemite International Airport 1,538,802
Sources: Respective Airports
Air Service Capacity

Convention, Sports & Entertainment Facilities Consulting Chicago, Illinois
DRAFT May 31, 2017 Induced Demand Analysis Tucson Convention Center
A-11
The passenger counts at Tucson International Airport indicate a moderate level of capacity for out-of-state travel. Removing Phoenix Sky Harbor as an outlier, Tucson’s passenger volume suggests easier access from a greater number of destinations than several of its regional competitors. A study of comparable cities and venues indicates the competitiveness of the TCC in the local and regional group meetings markets. Tucson has several large resort properties that compete on a regional and national level for conferences and meetings. The TCC offers exhibit capacity not found in other local venues. When compared to the regional market, the TCC’s event function spaces are about average in size and flexibility. The comparable destination analysis suggests that Tucson’s overall market size and demographics reflect a mid-sized market with a slightly below average demand potential compared to the regional markets with which it will compete for group meetings business. HVS reviewed lost business reports compiled prior to the closure of the Hotel Arizona in 2012. Since that time, the TCC has not participated actively in the group meetings market, focusing primarily on the annual Tucson Gem, Mineral & Fossil Showcase, religious conferences, and local events. Lost business data is not available for any year after 2012. Nonetheless, the historical lost business reports provide insight into event planner preferences and reasons for not selecting the TCC for their events. The following figure provides a summary of lost room nights by reason. FIGURE A-11 PERCENTAGE OF LOST ROOM NIGHTS BY REASON
35%
32%
19%
14%
1%
Other/Unknown
Downtown Hotel package inadedequate
Board vote/Meeting cancelled
Venue inadequate, not available
Lack of air service
Source: Visit Tucson
Conclusion and Implications for Tucson
Lost Business Analysis and Destination Assessment

Convention, Sports & Entertainment Facilities Consulting Chicago, Illinois
DRAFT May 31, 2017 Induced Demand Analysis Tucson Convention Center
A-12
The majority of event planners did not indicate a reason for not selecting the TCC, but for those events that did specify a reason, most of the lost room nights could be attributed to the inadequacy of the downtown hotel package. This indicates that events could be recaptured with proper hotel development. Destination Marketing Association International (“DMAI”) conducted a survey of Tucson community and government leaders, customers, DMO management, and other stakeholders. The survey identified the importance of destination criteria, such as air access and meeting infrastructure, and quantified Tucson’s performance in these criteria. For each criteria, a score of five indicates excellence while a score of 1 indicates that Tucson performs poorly. Key findings include following. • Hotel accommodations received a 3.24 rating with low ratings on both the
location and number of hotels serving the TCC. • Convention and meeting facilities received a 2.79 rating with high marks for
unique venues for special events and low ratings for the convention center meeting spaces. Respondents feel that the city does not have the necessary facilities to compete today and for the next 25 years.
• Domestic air access received an average rating of 2.68 on a five-point scale. International air access is notably inferior in terms of flights, capacity, and cost.
• Attractions and entertainment receive a 3.72 rating with respondents noting many high-quality dining and cultural attractions, but a shortage of retail opportunities.
The DMAI study identifies several areas for improvement in Tucson destination marketing efforts, including the development of a headquarters hotel as one of the most important objectives to address in the next three to five years. Other ongoing initiatives to improve tourism amenities and communications will improve knowledge of Tucson as an event destination and help the TCC secure events. The TCC provided HVS with detailed event information on events that occurred at the facility for calendar years 2013 through 2016. Event information included event name, type of event, start and end dates, and attendance. Based on this information HVS categorized events into standard event categories that will be used throughout the remainder of this report. The following figure presents the detailed event and attendance history at the TCC for the past four years.
Historical Demand

Convention, Sports & Entertainment Facilities Consulting Chicago, Illinois
DRAFT May 31, 2017 Induced Demand Analysis Tucson Convention Center
A-13
FIGURE A-12 TCC HISTORICAL DEMAND
Event Type 2013 2014 2015 2016
EventsTucson Gem & Minera l Show 1 1 1 1 Conventions & Conferences 3 3 1 1 Tradeshows 7 5 5 7 Consumer Shows 16 18 23 31 Meetings 51 35 43 54 Banquets 22 19 38 49 Rel igious Conferences 10 9 8 9 Assembl ies 29 27 32 41 Sports/Competi tions 2 4 7 3 Tenant Sports 13 14 13 32 Concerts & Enterta inment 97 82 100 104 Other 4 1 8 7
Total 255 218 279 339
Total AttendanceTucson Gem & Minera l Show 21,800 21,800 21,800 21,800 Conventions & Conferences 2,500 3,600 2,000 1,800 Tradeshows 12,400 9,400 6,100 5,200 Consumer Shows 66,600 51,300 64,000 50,800 Meetings 23,300 11,000 7,700 13,400 Banquets 15,400 13,400 14,200 20,500 Rel igious Conferences 51,500 57,000 44,000 59,000 Assembl ies 50,700 65,800 40,500 70,300 Sports/Competi tions 5,000 13,000 16,300 13,800 Tenant Sports - - 3,800 72,100 Concerts & Enterta inment 236,900 158,000 207,300 175,100 Other 8,600 6,000 10,700 18,100
Total 494,700 410,300 438,400 521,900
Source: TCC, restated by HVS
The TCC currently hosts a variety of events, including two events for the Tucson Gem & Mineral show. Most events attract a local base of attendees who do not require lodging. The number of events and number of attendees has increased in recent years, primarily due to a new minor league hockey tenant and increases in other local uses. The TCC does not currently compete for regional and national conventions and conferences. While the function spaces at the TCC are suitable for these events, the inability to provide adequate lodging for event attendees impedes booking these high impact events. According to Visit Tucson and TCC management, the

Convention, Sports & Entertainment Facilities Consulting Chicago, Illinois
DRAFT May 31, 2017 Induced Demand Analysis Tucson Convention Center
A-14
introduction of a quality hotel adjacent to the TCC would significantly increase the center’s ability to attract more conventions and conferences. Assuming the reopening of the 309-room Hotel Arizona in January of 2019, HVS projected event demand projections on the following research and analysis:
• Historical TCC event demand, • Industry data and trends reports, • Key market and economic indicators, • Comparable venue program and demand data, and • Discussions with representatives from the TCC and Visit Tucson.
HVS estimates that event demand would ramp up and stabilize in 2021. The figure below breaks out event projections through stabilization by the type of event. Total and average attendance figures represent individual event attendees. A brief description of the event types and explanation of demand projections follows.
Demand Projections

Convention, Sports & Entertainment Facilities Consulting Chicago, Illinois
DRAFT May 31, 2017 Induced Demand Analysis Tucson Convention Center
A-15
FIGURE A-13 DEMAND PROJECTIONS
Event Type Historical 2019 2020 2021
EventsTucson Gem & Mineral Show 1 1 1 1Conventions & Conferences 1 6 9 12Tradeshows 7 7 7 7Consumer Shows 31 31 31 31Meetings 54 54 54 54Banquets 49 49 49 49Rel igious Conferences 9 9 9 9As sembl ies 41 41 41 41Sports/Competitions 3 4 5 6Tenant Sports 32 32 32 32Concerts & Enterta inment 104 104 104 104Other 7 7 7 7
Total 339 345 349 353
Average AttendanceTucson Gem & Mineral Show 21,800 21,800 21,800 21,800Conventions & Conferences 1,800 1,000 1,000 1,000Tradeshows 700 700 700 700Consumer Shows 1,600 1,600 1,600 1,600Meetings 200 200 200 200Banquets 400 400 400 400Rel igious Conferences 6,600 6,600 6,600 6,600As sembl ies 1,700 1,700 1,700 1,700Sports/Competitions 4,600 4,600 4,600 4,600Tenant Sports 2,300 2,300 2,300 2,300Concerts & Enterta inment 1,700 1,700 1,700 1,700Other 2,600 2,600 2,600 2,600
Total AttendanceTucson Gem & Mineral Show 21,800 21,800 21,800 21,800Conventions & Conferences 1,800 6,000 9,000 12,000Tradeshows 5,200 5,200 5,200 5,200Consumer Shows 50,800 50,800 50,800 50,800Meetings 13,400 13,400 13,400 13,400Banquets 20,500 20,500 20,500 20,500Rel igious Conferences 59,000 59,000 59,000 59,000As sembl ies 70,300 70,300 70,300 70,300Sports/Competitions 13,800 18,500 23,100 27,700Tenant Sports 72,100 72,100 72,100 72,100Concerts & Enterta inment 175,100 175,100 175,100 175,100Other 18,100 18,100 18,100 18,100
Total 521,900 530,800 538,400 546,000

Convention, Sports & Entertainment Facilities Consulting Chicago, Illinois
DRAFT May 31, 2017 Induced Demand Analysis Tucson Convention Center
A-16
Tucson Gem & Mineral Show—The Tucson Gem, Mineral & Fossil Showcase is an annual event that includes 40 separate events in venues throughout Tucson. In total, the event attracts 48,000 attendees and generates 150,000 room nights in the market. The two largest shows, the American Gem Trade Association GemFair (“AGTA”) and the Tucson Gem & Mineral Society (“TGMS”) are held in the TCC. For the demand analysis, we combined these two events into a single event. Conventions & Conferences—Conventions require a combination of exhibition, banquet, and meeting space. Conferences are multi-day events like conventions that require a mix of banquet and breakout space set-up and occasional assembly space, but they do not require any exhibit hall set-up. Conventions are typically multi-day events that require daily food service for their attendees. Tradeshows—Tradeshows provide a means for wholesalers and retailers to transact business with industry buyers. As such, tradeshows are typically exhibit-oriented events in which people display and demonstrate products. Tradeshows require some meeting and meal space; however, they require much less space than conventions. Consumer Shows—Consumer shows are ticketed public events that attract local and regional attendees, such as home and garden shows and car shows. These events require some meeting space for support and back of house uses. Food and beverage services would be limited to concessions. Meetings—Meetings require breakout meeting space but would not use banquet or exhibit space. Food service is limited to coffee breaks, breakfasts, or luncheons in meeting rooms. A variety of groups host meetings and conferences, including, corporations, associations, civic organizations, religious groups, and government agencies. Meetings and conferences can take place in breakout meeting space. In addition to meals, ballrooms and multipurpose rooms can also handle larger meetings or several smaller simultaneous meetings as needed. Banquets—Banquets are stand-alone social events, luncheons, and other meals typically booked by local corporations, social and civic organizations, and private clients. Flexible ballroom spaces allow for a variety of banquet sizes and multiple simultaneous events. Religious Conferences—Religious conferences are meetings and assemblies that attract out-of-town attendees. The primary source of religious conferences are the seven annual Christian Congregation for Jehovah’s Witness events.

Convention, Sports & Entertainment Facilities Consulting Chicago, Illinois
DRAFT May 31, 2017 Induced Demand Analysis Tucson Convention Center
A-17
Assemblies—Assemblies include graduations, religious services, and lectures. Produced by any type of organization, assemblies are always public events. Additionally, assemblies only require a plenary set-up. Sports & Competitions—Sports and competitions events include sports tournaments, gaming events, dance and cheerleading events, and other competitions that may set up courts, mats, tables, and other playing surfaces in the arena, exhibit halls or ballrooms depending on space needs. Sports can attract regional base but typically attract local attendees. Tenant Sports—Tenant sports include games featuring the University of Arizona hockey teams and the Tucson Roadrunners AHL team. Concerts & Entertainment Events—The TCC is home to two music tenants, the Tucson Symphony Orchestra and the Arizona Friends of Chamber Music. Other entertainment events include touring concerts, comedy shows, and family shows. Other—Other events include support for local sports competitions, press conferences, photo shoots, and ancillary uses by tenant sport teams. HVS calculated the potential generation of room nights by the TCC events. These room nights represent the total room nights generated in the Tucson market. The following figure presents the assumptions used to generate room night estimates. HVS based room night assumptions on historical Visit Tucson data and other industry research. The figure includes only those events that generate rooms nights in the market. FIGURE A-14 DEMAND PROJECTIONS
Type of Event Length of Stay
Percent Lodgers
Tucson Gem & Minera l Show 3.50 90%Conventions & Conferences 3.00 5%Consumer Shows 2.00 3%Rel igious Conferences 1.00 95%Sports/Competi tions 2.00 5%Tenant Sports 1.00 2%
The introduction of the Hotel Arizona would result in a greater number of higher impact conventions, conferences, and sports competitions in Tucson. The following
Room Night Projections

Convention, Sports & Entertainment Facilities Consulting Chicago, Illinois
DRAFT May 31, 2017 Induced Demand Analysis Tucson Convention Center
A-18
figure presents an estimate of historical room nights and the resulting incremental room nights generated after the proposed hotel development through a stabilized year of demand. FIGURE A-15 ROOM NIGHT PROJECTIONS
Event Type Historical 2019 2020 2021
Tucs on Gem & Minera l Show 68,600 68,600 68,600 68,600Conventions & Conferences 200 4,800 7,200 9,600Cons umer Shows 3,000 3,000 3,000 3,000Rel igious Conferences 32,000 32,000 32,000 32,000Sports/Competi tions 700 900 1,200 1,400Tenant Sports 1,000 1,000 1,000 1,000
Total 105,500 110,300 113,000 115,600
In a stabilized year, HVS estimates that the expanded TCC would generate 115,600 room nights in the local area market, approximately 10,000 more than currently generated by TCC events. Some of these room nights would result from contract blocks with groups and others would result from individual hotel reservations. HVS intends for demand projections to show the expected levels of event numbers and attendance. Projections show smooth growth over time. However, event demand may vary significantly from year to year. Unpredictable local and national economic factors can affect businesses. Event demand often moves in cycles based on rotation patterns and market conditions. Therefore, HVS recommends interpreting the demand projections as a mid-point of a range of possible outcomes and over a multi-year period, rather than relying on projections for any one specific year.