feasibility study of the salt mine route - pvc · dt 00 b 017d page : 3 content pages 1. context...
TRANSCRIPT

Centre de Tarnos • avenue du 1er Mai • Z.I. • F 40220 Tarnos • Tél. : (33) (0)5 59 64 86 48 • Fax (33) (0)5 59 64 49 64 Adresse commerciale : Parc Technologique de Bois d'Arcy - ZAC du Pas du Lac 10, avenue Ampère - BP 284 - 78053 St Quentin-en-Yvelines Cedex
Tél : (33) (0)1 39 30 60 00 - Fax : (33) (0)1 39 30 09 50 Société Anonyme au capital de 20 000 000 F RCS Paris B 422 511 204 - Code APE 742 C
DT 00 B 017 D
Issue B : 3/3/00
Issue D : 14/4/00 Page : 1
Feasibility Study of the Salt Mines Storage Route ------------------------ Step 2 report ------------------------
Comparison of the salt mines storage with competing routes for MSWI residues
management
Study intended for ECVM (European Council of Vinyl Manufacturers)
Checking JACQUINOT Bernard Expert Senior ENVIGEPRO
Author KIRRMANN Clément Project Manager ENVIGEPRO
RESPONSABILITIES NOM Prénom Fonction Pole ou Société Date Visa
DIFFUSION :
ECVM Mr. De Grève (1 ex)
Mrs Unni Musdalslien (1 ex) (by E-mail)
ECVM (10 copies) Sept 14th, 2000
Bertin Technologies Clément Kirrmann Bernard Jacquinot
BC.001.A

DT 00 B 017D Page : 2
Référence interne DT 00 B 017 D Système hôte WORD 8 (97) / CK
Fonds documentaire CK/ DtmswiA.doc Dossier d’affectation Général
Nomenclature de gestion affaire 00559 lot 2 Document contractuel OUI
HISTORIQUE DES EVOLUTIONS
Indice Date MODIFICATIONS
(raisons principales, paragraphes et pages concernés, références des demandes de modification, ...)
Authors / Checking
A
B
C
D
D’
'
08/02/00
23/2/00
24/2/00
13/3/00
17/3/00
28/3/00
14/4/00
26/9/00
Basis of document
Draft version DT MSWI A.doc, sent to Mrs Unni Musdalslien
Registered as DT 00 B017
Corrections and complements associated to mail 16/3
Review by BJ + few corrections before mail 17/3
Correction and complements requested by ECVM Corrections after mails from Dr.Mügge & Mrs Musdalslien 14/4 Inclusion of some tables and documents in annexes.
Files : • Main text : dtmswi_step2_d.doc • end of Annexe A : Austria/Massenströme1997_engl.ppt • Annexe D : directory fiches_présentation (2 files) • Annexe E : [Sud00] articles available in directory article_Sud0uest
(Sud00_article1.doc…) (3 files) (all these files are include as hypertext links in the present file) On paper only : (available on request but not really important for diffusion) Article [Sud00c], article Usine Nouvelle on Stocamine, Commercial informations on UEV salt mine storage
C.KIRRMANN
C.KIRRMANN / B.JACQUINOT
C.KIRRMANN
BC.002.A

DT 00 B 017D Page : 3
CONTENT PAGES
1. CONTEXT AND OBJECTIVES 6 1.1 General Objectives of the study 6 1.2 Specification of the Step 2 study 6 1.3 Detailed specifications for the STEP 2 study 7 1.4 Preliminary warning (read me first) 7
2. MSWI DATA 8 2.1 MSW production, and part incinerated in Europe 8 2.2 MSW composition in Europe 9
2.2.1 Typological MSW Composition 9 2.2.2 MSW Immediate analysis 10 2.2.3 MSW Elemental composition 10
Usual Pb Content in MSW 11 2.3 Part of incineration and other MSW treatments in Europe 12 2.4 MSWI location and corresponding capacities 13 2.5 Classification according to Gas Treatment Systems 15 2.6 Residue production in Europe 18
2.6.1 Sorts of residues 18 2.6.2 Amounts of residues per incinerated mass 19 2.6.3 Estimation of overall amounts of residues in Europe 20 2.6.4 Comparison to some particular situations 22 2.6.5 Comparison to German mine-valorisation amounts 23
2.7 Final destination of the residues 24 2.7.1 Solid residues (bottom ash or APC residues) 24 2.7.2 Liquid residues 25 2.7.3 Quantities involved 25
2.8 Discussion on the various residues management policies in Europe 25 2.8.1 Fly ash 25 2.8.2 Residues from dry and semidry processes 26 2.8.3 Residues from the wet process 27
3. IMPACT OF PVC ON THE QUANTITY AND HAZARDOUSNESS OF THE RESIDUES 28
3.1 General aspects on PVC composition and main applications 28 3.2 Chlorine content 29
3.2.1 Chlorine content in PVC products 29 3.2.2 Chlorine content in PVC incinerated 29
3.3 Heavy metal content in PVC 29 3.3.1 Origin of Heavy Metals 29 3.3.2 HM in average PVC products 30
3.4 Effect of PVC on the composition of MSW 31 PVC content in MSW 31

DT 00 B 017D Page 4
3.4.2 HM in average PVC incinerated 32 3.4.3 PVC effect on Cl and HM content of MSW 33 3.4.4 Other HM, Cl, S, data for comparison 33
3.5 Impact of PVC on the quantity and hazardousness of the residues 35 3.5.1 Main effects of PVC 35 3.5.2 PVC influence on the Neutralisation residues 35
3.6 PVC producers involved in salt mines storage activity 40
4. TECHNICO-ECONOMIC COMPARISON OF SALT MINES STORAGE WITH THE COMPETING ROUTES 41
4.1 Final destination of the residues in Europe 41 4.2 Specification of the residues for each destination 41 4.3 Cost comparison 42
4.3.1 Costs for Storage or disposal 42 4.3.2 Transport costs 44 4.3.3 Example of price estimation for residue disposal in France 45 4.3.4 Costs for disposal in a salt mine storage 45 4.3.5 Costs for disposal in a mine recycling site 46 4.3.6 Incineration costs for comparison 46
5. CONCLUSION 47
6. REFERENCES 50
Annexe A. Miscellaneous data on MSW incineration
Annexe B. Calculation of amounts of residues
Annexe C. Energy recovery from municipal waste, and share of PVC (not contractual)
Annexe D. Commercial sheet (project)
Annexe E. Various documents

DT 00 B 017D Page 5
LIST OF TABLES AND FIGURES
Table 1 - European Statistics and MSW production ......................................................................................... 8
Table 2a - Amount and composition of MSW in Europe and for each country ................................................. 9
Table 2b - Average composition of MSW in EC and evolution ....................................................................... 10
Table 2c - Composition of MSW as a fuel (immediate analysis)..................................................................... 10
Table 2d - Main elements distribution in MSW from EC in 1996 .................................................................... 11
Table 2e – Lead content in MSW .................................................................................................................... 11
Table 3 - MSW Production and ways of treatment.......................................................................................... 12
Figure 1 - % MSW incinerated per country ..................................................................................................... 14
Figure 2 - Number of plants per country.......................................................................................................... 14
Table 4 - Number of Plants and capacities per country in Europe.................................................................. 14
Table 5a - Comparison of 3 sources giving statistics on MSWI plants in Europe........................................... 15
Table 6 - MSWI capacities and numbers of plants for the 3 types of GTS. .................................................... 16
Figure 3. Evolution of GTS Process distribution in France ............................................................................ 17
Figure 4. Mass Flow-chart in incineration of MSW.......................................................................................... 18
Table 7a - Nature of APC residues as a function of GTS. .............................................................................. 19
Table 7b - Amounts of residues according to [FZK97].................................................................................... 20
Table 7c - Amounts of APC residues for different GTS. ................................................................................. 20
Table 7d - APC residues production ratios in Europe..................................................................................... 21
Table 7e - Mean APC residues production per country in Europe.................................................................. 21
Figure 5 - PVC use per destination ................................................................................................................. 28
Table 9a – Composition in soft or rigid PVC, and Chlorine contents in incinerated PVC............................... 29
Table 9b - Typical Metal Contents in PVC Products ....................................................................................... 30
Table 10 - Calculation of mean HM content (Sn, Zn, Pb) in PVC in the Netherlands..................................... 30
Table 11 - Parts of plastics and PVC incinerated with MSW .......................................................................... 31
Table 12 - Heavy metal content in incinerated PVC in the Netherlands......................................................... 32
Table 13a - PVC contribution to elementary composition of MSW (partial).................................................... 34
Table 13b - PVC contribution to complete elementary composition of MSW ................................................. 34
Table 14a - Estimated amounts of residue components in APC, and effect of PVC...................................... 36
Table 14b – Stoechiometric ratios for HCl treatment ...................................................................................... 37
Table 14b’ – Stoechiometric ratios for S treatment ......................................................................................... 37
Table 14d - Influence of PVC on the quantity of residues : comparison to Rij99 results ................................ 38
Table 14c - Estimated average amounts of residues, and effect of PVC ....................................................... 38
Table 15a - Estimated average amounts of leachates in 50 years, and effect of PVC................................... 40
Table 15b - Effect of PVC on leachability of residues ..................................................................................... 40
Table 16 - Solid residues storage costs (∈/tonne) .......................................................................................... 43

DT 00 B 017D Page 6
1. CONTEXT AND OBJECTIVES
1.1 General Objectives of the study
This study is aimed at evaluating the present situation of MSW incineration in terms of management of the residues as well as of corresponding quantities involved, with a special attention to the route for storage in salt mines and to the influence of PVC.
The salt mine question is presented in step 1 report. It shows the present situation and discuss its possible evolution in the next years. Deep underground storage is done only in Germany (3 active mines : Herfa-Neurode, Heilbronn, Zielitz, 1 project : Borth), in France (1 mine : Wittelsheim), and is intended in the UK (1 project in Bostock). A lot of other mines (coal and salt mines) in Germany practising mine-valorisation can accept ultimate residues from incineration, although these residues are classified as hazardous. While deep storage should continue for a long time without difficulties, and may be developed, the future of mine-recycling practices highly depends on permanence of German legal situation and local authorisations.
The second part of the present study concerns the evaluation of the technical and economical interest of this way to manage the residues from MSW incineration.
It begins by a synthesis of various data on MSW incineration in Europe, on quantities of residues, and on the effect of PVC on the amounts and composition of residues. A large collection of data was used and checked to obtain the most relevant average figures, and their usual ranges.
A cost comparison is presented to estimate the competitivity area for salt mines in comparison with alternative surface landfilling possibilities.
1.2 Specification of the Step 2 study
STEP 2 : COMPARISON OF THE SALT MINES STORAGE WITH COMPETING ROUTES FOR MSWI RESIDUES MANAGEMENT :
This step of the study is aimed at evaluating the different competing routes already exploited : - landfill storage (type of class to be identified) after stabilisation as in France, Belgium and Italy - landfill storage without stabilisation (Great Britain, Belgium (Flandres), Denmark (temporary
storage...) - Salt mines storage (mainly in Germany, but also in Denmark, France, Austria, Switzerland) - Reutilisation in mine-filling (mainly in Germany) - Storage/Quarry-filling (Langøya in Norway, where a part of the residues from Denmark are sent) (difficult to classify) - Building and road construction. For this purpose, an average composition of MSW and its PVC content will be identified to determine the nature, composition and quantity of residues. The impact of PVC content in the MSW will then be evaluated in terms of quantity, quality and corresponding cost of the residues in given scenarios for their final destination.

DT 00 B 017D Page 7
Then the different routes for MSW residues management will be compared in terms of specification requirements and cost (apart from transportation). Transportation costs will be further considered and the maximum distance from the incinerator to the mines determined for keeping the competitiveness of salt mines storage. This will also enable the evaluation of the corresponding capacities of residues production to be possibly addressed to the different salt mines.
1.3 Detailed specifications for the STEP 2 study
1. MSWI data 1.1. Capacity produced, corresponding quantity incinerated in Europe ( most recent datas) 1.2. MSWI location in CE and corresponding capacities 1.3. Residues produced in Europe (tons/year)
- Bottom Ash - Fly Ash - Salts - Fly Ash + Salts when mixed - Liquid effluents
1.4. Final destination of the residues (type by type) and quantities involved in Europe - Landfill - Road application - Salt mines - Other storages
2. Impact of PVC on the quantity and hazardousness of the residues (type by type) 3. PVC producers involved in salt mines storage activity 4. Technico-Economic comparison of salt mines storage with the competing routes
4.1. Specification of the residues for each destination 4.2. Cost comparison - apart from transportation - current transportation cost for each type of destination - maximum transportation cost to salt mines for keeping this route competitive
5. Conclusion : overall appraisal of the salt mines storage for MSWI residues
1.4 Preliminary warning (read me first)
This study being focused towards obtaining best useful data, comments and explanations are limited and much place is given to tables and numbers. Accuracy of values is not expected to very high in the MSW domain (10% to more than 100% deviations may be found), and evolution is continuous. A great part is thus given to comparisons and possible ranges, and choice of good average values. Wider explanations can be found in various sources given as references.
We hope the reader can directly find the useful values and bases of calculations, and could easily correct values and corresponding conclusions if updated or more accurate data (especially cost data) become available.

DT 00 B 017D Page 8
2. MSWI Data
2.1 MSW production, and part incinerated in Europe
Considering the whole European Community, overall key figures from recent data [Oec97] are :
• Amount of MSW produced : 155 000 ktons/year.
• for a population of 375 Millions
This gives an average amount of 400 kg / year / capita.
• 21% of MSW are incinerated
Table 1 gives details per country, with additional data on Switzerland and Norway, considered in overall "EC17" figures.
Details on incineration per country will be further discussed, after general data on MSW nature and content.
European statistics Country Abb. Area Population density MSW(*) MSW
km2 Million inhab. inhab./km2 kt/year kg/inhab. Austria A 83857 8,0 95 3841 480Belgium B 30518 10,2 334 4781 469Germany D 357046 82,1 230 25777 314Denmark DK 43092 5,2 121 2788 535Spain E
(SP) 504782 39,3 78 14296 364
Finland SF 338145 5,1 15 2100 412France F 543965 58,7 108 28000 477United Kingdom UK 244129 58,5 240 20000 342Greece GR 131957 10,4 79 3200 308Ireland IRL 70283 3,7 53 1550 419Italy I 301225 57,6 191 27000 469Luxembourg L 2586 0,4 164 218 514Netherlands NL 41160 15,7 380 8956 572Portugal P 92389 10,0 108 3500 351Sweden Sw 449964 8,8 20 3900 443
EC15 countries 3235098 373,6 115 149907 401
Max 543965 82,1 380 28000 572Min 2586 0,4 15 218 308Switzerland CH 2660 Norway Nw 2637
EC 17 countries 155204 Area and population : January 1999 ("INTERPLAN" diary 2000) (*) MSW amounts OECD 1995 - ratio in kg/inhab is calculated from these data. EC 17 = EC 15 + CH + Nw
Table 1 - European Statistics and MSW production

DT 00 B 017D Page 9
2.2 MSW composition in Europe
The composition of domestic wastes is usually described from three different points of view :
- typological MSW composition (nature of raw elements, e.g. plastic content)
- Immediate analysis (combustion characteristics, e.g. combustible part)
- Elemental composition (chemical elements, e.g. Cl and HM contents)
2.2.1 Typological MSW Composition
The composition of MSW depends directly on the evolution of the MSW management practices and especially on the extension of the sorting at source. It is submitted to high fluctuations according to countries and versus time, due to differences in the definitions of MSW and to the different conditions encountered in countries (social conditions, location, season...).
In general, MSW includes household waste, bulky waste, small commercial and non-hazardous industrial wastes (trade waste), and market and garden residuals when not sorted at source.
Table 2a gives contribution of main elements : putrescibles (= organic matters), papers, plastics, glass, metals, miscellaneous (textile and others), based on 1995 OECD data [Oec97].
Country Amount of MSW OECD 1995
Putrescibles / fines
Paper Plastic Glass Metals Miscell (textiles incl.)
k tons / yr kg/y/capita Wgt % Wgt % Wgt % Wgt % Wgt % Wgt % A 3841 480 50 22 7 9 5 8 B 4781 470 37 16 7 7 4 29
CH 2660 250 38 29 15 3 3 12 D 25777 320 44 24 7 9 6 10
DK 2788 530 36 20 5 4 2 35 E (SP) 14296 370 44 21 11 7 4 13
F 28000 470 29 25 11 13 4 18 GR 3200 310 49 20 9 5 5 13
I 27000 470 40 22 7 8 3 20 IRL 1550 430 29 33 9 6 3 20 L 218 530 44 19 8 7 3 20
Nw 2637 620 18 31 6 4 5 36 NL 8956 580 38 26 6 6 3 21 P 3500 350 35 23 12 5 3 23
Sw 3900 440 44 30 7 8 2 9 SF 2100 410 32 26 6 6 3 29 UK 20000 340 19 37 10 9 7 18
EC 15 149907 398 36,1 25,1 8,6 8,8 4,4 17,0 EC 17 155204 396 35,9 25,3 8,7 8,6 4,4 17,3
Source = OECD (1995) - EUROSTAT (1993) France composition data from ADEME Waste characterization campaign of 1993 (published in 1996).
Table 2a - Amount and composition of MSW in Europe and for each country
Values per capita are slightly different than the value given in table 1 but should be more consistent, because table 1 uses population in 1998 instead of 1995. Average for Europe is nevertheless identical (400 kg/y/capita).
Some compositions given in this table should be valid only for "raw" MSW, i.e. before possible separation of some materials for recycling and composting. Compositions for "incinerated MSW"
DT 00 B 017D Page 10
can thus be slightly different.
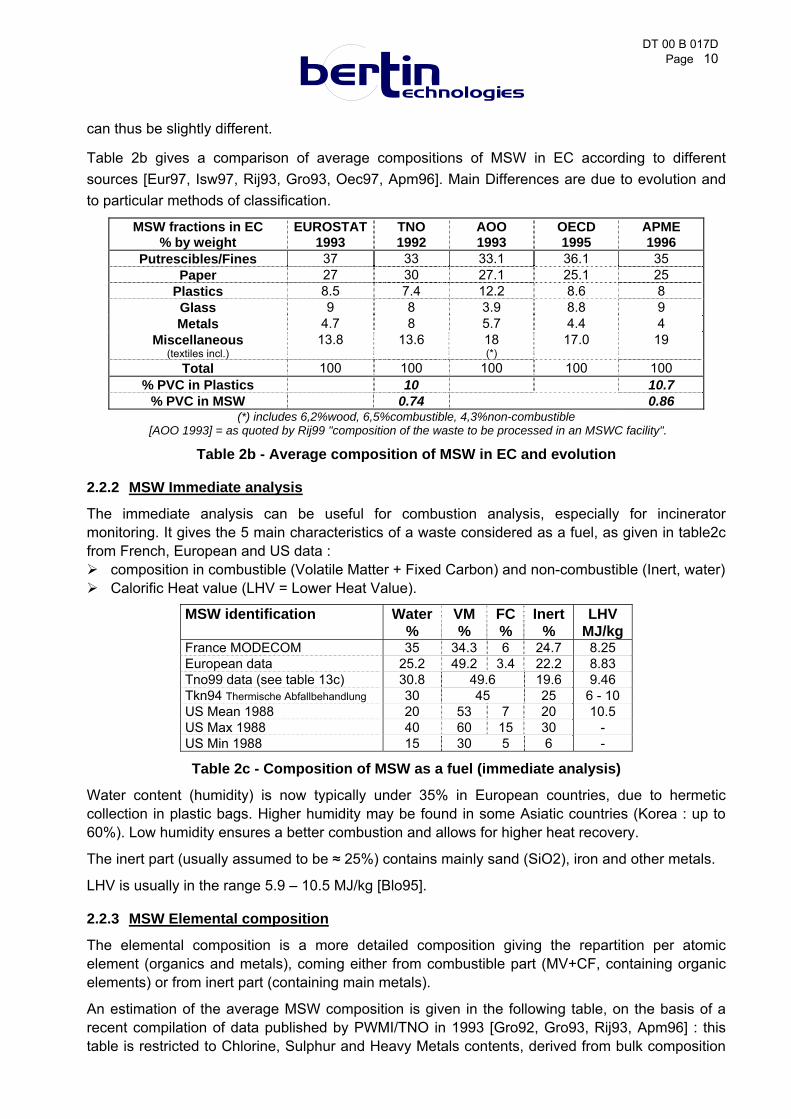
Table 2b gives a comparison of average compositions of MSW in EC according to different sources [Eur97, Isw97, Rij93, Gro93, Oec97, Apm96]. Main Differences are due to evolution and to particular methods of classification.
MSW fractions in EC % by weight
EUROSTAT1993
TNO 1992
AOO 1993
OECD 1995
APME 1996
Putrescibles/Fines 37 33 33.1 36.1 35 Paper 27 30 27.1 25.1 25
Plastics 8.5 7.4 12.2 8.6 8 Glass 9 8 3.9 8.8 9 Metals 4.7 8 5.7 4.4 4
Miscellaneous (textiles incl.)
13.8 13.6 18 (*)
17.0 19
Total 100 100 100 100 100 % PVC in Plastics 10 10.7
% PVC in MSW 0.74 0.86 (*) includes 6,2%wood, 6,5%combustible, 4,3%non-combustible
[AOO 1993] = as quoted by Rij99 "composition of the waste to be processed in an MSWC facility".
Table 2b - Average composition of MSW in EC and evolution
2.2.2 MSW Immediate analysis
The immediate analysis can be useful for combustion analysis, especially for incinerator monitoring. It gives the 5 main characteristics of a waste considered as a fuel, as given in table2c from French, European and US data :
composition in combustible (Volatile Matter + Fixed Carbon) and non-combustible (Inert, water) Calorific Heat value (LHV = Lower Heat Value).
MSW identification Water %
VM %
FC %
Inert %
LHV MJ/kg
France MODECOM 35 34.3 6 24.7 8.25 European data 25.2 49.2 3.4 22.2 8.83 Tno99 data (see table 13c) 30.8 49.6 19.6 9.46 Tkn94 Thermische Abfallbehandlung 30 45 25 6 - 10 US Mean 1988 20 53 7 20 10.5 US Max 1988 40 60 15 30 - US Min 1988 15 30 5 6 -
Table 2c - Composition of MSW as a fuel (immediate analysis)
Water content (humidity) is now typically under 35% in European countries, due to hermetic collection in plastic bags. Higher humidity may be found in some Asiatic countries (Korea : up to 60%). Low humidity ensures a better combustion and allows for higher heat recovery.
The inert part (usually assumed to be ≈ 25%) contains mainly sand (SiO2), iron and other metals.
LHV is usually in the range 5.9 – 10.5 MJ/kg [Blo95].
2.2.3 MSW Elemental composition
The elemental composition is a more detailed composition giving the repartition per atomic element (organics and metals), coming either from combustible part (MV+CF, containing organic elements) or from inert part (containing main metals).
An estimation of the average MSW composition is given in the following table, on the basis of a recent compilation of data published by PWMI/TNO in 1993 [Gro92, Gro93, Rij93, Apm96] : this table is restricted to Chlorine, Sulphur and Heavy Metals contents, derived from bulk composition

DT 00 B 017D Page 11
in putrescibles, paper, plastics, glass and metals.
A more complete elemental analysis, giving contents in organics (C, H, O, N, S, P, Cl, F, Br), and metals (Hg, Cd, As, Co, Cr, Cu, Mn, Ni, Pb, Sb, Se, Sn, V, Zn), is given in table 13c (from [Tno99]).
MSW fractions in EC
APME 1996 % by Weight
Chlorine g/kg
Sulphur g/kg
Heavy Metals g/kg
Putrescibles/Fines 35 7.56 2.85 2.108 Paper 25 3.69 2.52 0.561
Plastics 8 23.64 0.23 1.241 Glass 9 0.1 - 0.9665 Metals 4 0.32 0.11 18.491
Miscellaneous (textiles incl.) 19 10.0 3.6 4.4 Total 100 7.38 2.33 2.64
Table 2d - Main elements distribution in MSW from EC in 1996 According to table 2d, Chlorine, Sulphur and HM basic contents, in g/kg are :
Cl : 7.4 g/kg usual range 5 to 10 g/kg S : 2.3 g/kg usual range 1 to 4 g/kg HM : 2.6 g/kg (including 0,7 g/kg Pb, see below)
These values can be compared to values given in table13c, and values measured on a set of selected incinerators [Ber99], all values in g/kg : Table 2d range [Tno99] [Ber99] [Ber99]
range [Veh97a] range
Tnk94 range (g/kg dry)
Cl 7.4 g/kg 5 - 10 5.9 g/kg 7.2 g/kg 6 - 8.6 5 - 8 1 -10 S 2.3 g/kg 1 - 4 1.9 g/kg 3.0 g/kg 1 - 4 1 – 3 0.3 - 5 HM 2.6 g/kg 3.8 g/kg 2.0 g/kg 0.4 - 4.2 Cu : 0.2 – 1
Zn : 0.6 – 2 Pb : 7 - 20 Cd : 0.1 - 0.5
The Cl content is in fact much dependent on the plastic content, especially of PVC. These data must be considered as including the average effect of PVC (effect discussed in §3).
Usual Pb Content in MSW
Lead is the main heavy metal present in PVC products. It is thus is important to know its average content in MSW for assessing the effect of PVC on MSW behaviour (question discussed in §3). Miscellaneous values can be found in the literature :
Average range unit Source Country Comments 455 430 - 1200 mg/kg [Rei89] Germany
Switzerland
1350 700 - 2000 mg/kg dry [ThK94] Europe Unusually high. Old? source Dr.Leman [Lem92] 466 456 - 476 mg/kg wet [Tno96] The Netherlands 653 648 - 657 mg/kg dry [Tno96] The Netherlands 817 mg/kg dry [Pol96] France (3% from plastics, 65% from metals, 5% from glass
Less than 3% Pb comes from PVC) 700 400 - 1000 mg/kg [Veh97b] Europe major sources = pigments, stabilizers, alloys, accumulators
(*) 670 mg/kg wet [Tno99] The
Netherlands Derived from Krajenbrink 1996
(* ) according to various sources (International Ash Working Group 1995, Handbook 1995, Jonhke 1994).
Table 2e – Lead content in MSW The value of 670 mg/kg seems to representative of the average value.

DT 00 B 017D Page 12
2.3 Part of incineration and other MSW treatments in Europe
The distribution of Municipal Solid Wastes according to the different ways of treatment in Europe (incineration, landfill, compost, recycling) is shown in table 3.
Sources of data : • EEWC report published 1997 (Juniper study) [Eew97] • European Statistics from 1993-1996 published in 1997 by ISWA [Isw97] • Last data published by OECD for 1995 [Oec97] • Eurostat report corresponding to data from 1993 [Eur97] (EUROSTAT 93)
MSW ANNUAL PRODUCTION AND WAYS OF TREATMENT IN EUROPE Country MSW total
Amount* incinerated Landfill Compost Recycling Amount
incinerated Amount
incinerated Amount
incinerated
k tonnes / yr Wgt % Wgt % Wgt % Wgt % kt/yr kt/y kt/yr
OECD 95 OECD 95 OECD 95 ISWA 96 Juniper 97 A 3841 17 40 18 25 653 407 510 B 4781 31 55 6 8 1482 - 2151 D 25777 25 34 8 33 6444 9569 13121
DK 2788 56 21 11 12 1561 2593 2814 E (SP) 14296 5 83 12 0 715 672 1072
Fr 28000 37 55 7 1 10360 9542 10830 GR 3200 0.5 92.5 - 7 1 - 0
I 27000 5 95 - - 1400 2100 3407 IRL 1550 - 92 - 8 0 - 0 L 218 58 4 4 34 126 - 150
NL 8956 25 38 22 15 2234 2348 3600 P 3500 - 88 12 - 0 - 0
Sw 3900 41 40 3 16 1600 672 2094 SF 2100 2 62 3 33 50 - 50 UK 20000 12.5 82.5 - 5 2500 1713 2140 CH 2660 76 7 5 12 2021 2844 2722 Nw 2637 17 68 1 14 448 417 440
EC 15 149910 19,4% 64,5% 6,4% 9,7% 29130 35474 40193
EC 17 155200 20,4% 63,5% 6,3% 9,8% 31600 38735 45101
EC17 = EC15+CH+Nw
Table 3 - MSW Production and ways of treatment
Fairly similar figures are given by [Bon99]. Other data on current situation and trends can be found in [Fzk97].
This table shows that incineration is much more a common practice in Northern European countries, as it can be seen on the European map (figure 1) :
• > 40% for Switzerland, Luxembourg, Denmark, Sweden, • 25% to 40% : France, Belgium, Netherlands, Germany • 12 to 21 % for Norway, Austria, United Kingdom (atypical low % for Northern countries) • < 8 % for Italy, Spain, Portugal, Greece
With the exception of Finland (2%), for relatively small amounts.
These percentages were almost the same in 1991 [Jhn92], excepted for NL (46% - now 25%) and Sweden (55%, now 41%). If exact, it means a sharp decrease of incineration part in these countries, probably in advantage of recycling.

DT 00 B 017D Page 13
For all Europe, MSW treatments are distributed by the following average percentages (values calculated in above table) :
MSW Treatments in Europe
(1995-1997)
6% composted
10% recycled
20% incinerated
64% landfilled
Other data Above percentages are based on OECD95 data. ISWA96 and Juniper97 (last columns of table 3), given for comparison purpose, have higher overall amounts than OECD data (38735 and 45101 kt/year instead of 45100). This is due not only to evolution from 1995 to 1997, but also to the nature of these values : part of “Juniper data” are in fact based on capacities of incinerators and not on effective quantities, and this explains a overall amount 16% higher than ISWA96 and 45% higher than OECD95, although these last data take into account a greater number of incinerators (see below). Clearly, these statistics do not include accurate enough information to distinguish the various origins of differences.
Overall value for EC15 Various overall value can be found for Europe (EC15) : • OECD 95 (table 3): 29130 kt/yr
• ISWA96 (table 3) : 35474 kt/yr
• Juniper97 (table 3) : 40193 kt/yr
• Jun.97+correction (table 4) : 43784 kt/yr
• Laurent Bontoux [Bon99] : 43700 kt/yr
We shall further base various estimations on a forfeit base of 40 000 kt/year incinerated MSW.
2.4 MSWI location and corresponding capacities
Table 4 gives the number of plants and capacities of MSWI units in Europe. (From Juniper 97 data, with corrections from various source) There are around 230 MSW incineration units, mainly located in Northern Europe, as shown on the map (figure 2).

DT 00 B 017D Page 14
Figure 1 - % MSW incinerated per country Figure 2 - Number of plants per country
COUNTRY Number of plants
Capacity (kt/year)
Mean capacity per unit (kt/year/plant)
AUSTRIA 3 510 170 BELGIUM 18 2406 134 DENMARK 26 2854 110 FINLAND 1 50 50 FRANCE 79 10771 136 GERMANY 51 13462 264 GREECE 1? ITALY 22 2197 100 LUXEMBOURG 1 150 150 NETHERLANDS 11 5638 513 PORGUGAL 1 SPAIN 7 1242 177 SWEDEN 15 2094 140 UK 7 2140 306 Other 3 270 90 NORWAY (*) 9 470 52 SWITZERLAND 26 3002 115
TOTAL EC15 244 43784 179 TOTAL EC17 279 47256 169
(*) Norway : 1998 data. Two more plants opened in 1999.
Table 4 - Number of Plants and capacities per country in Europe
There are great differences in the numbers of plants and their capacities according to different

DT 00 B 017D Page 15
sources, as shown in table 5a (comparison of 4 sources).
SOURCE JUNIPER 1997 Plants > 30 kt/year
ISWA 1996 Plants > 10 kt/year
OECD 1995 1991 [Jhn92]
COUNTRY Number of plants
Capacity (kt/year)
Number of plants
Capacity (kt/year)
Number of plants
Capacity (kt/year)
Number of plants
amounts (kt/year)
AUSTRIA 3 510 2 407 22 1630 2 300 BELGIUM 17 2151 - 18 27 720 DENMARK 26 2814 34 2593 32 2400 48 1500 FINLAND 1 50 - 1
France 77 10830 95 9542 297 11408 260 6350 GERMANY 43 13121 36 9569 138 ??? 49 9300
ITALY 32 3407 15 2100 204 1912 54 2000 LUXEMBOURG 1 150 - 1 1 140 NETHERLANDS 11 3600 6 2348 12 2700 11 2805
NORWAY 5 440 5 417 12 50 440 SPAIN 7 1072 6 672 20 625 22 697
SWEDEN 15 2094 21 1827 21 1700 22 1550 SWITZERLAND 26 2722 28 2845 30 2488 48 2300
UK 7 2140 12 1713 214 33 2780 TOTAL EC 15 230 40285 211 29361 970 20675 530 28142
TOTAL EC 17 271 45101 260 34033 1021 24863 628 30882
Table 5a - Comparison of 3 sources giving statistics on MSWI plants in Europe
This is due to different capacities criteria used for the data collection (Juniper [Eew97] and ISWA sources take into account only the plants with capacities greater than 10 or 30 kt/year), and also to a constant evolution of the incinerators park.
Other data may be found in [Bon99], which also uses Juniper1997 as a basis, with corrections from various sources. It obtains a slightly higher overall amount for Europe (EC15) of 43 700 kt/year.
2.5 Classification according to Gas Treatment Systems
The type of GTS (Gas Treatment System) has a direct influence on the quantity and composition of the APC residues (Air Pollution Control residues, including solid residues and liquid effluents generated during the Gas Treatment), in relation with the concentration of the acid compounds to neutralise (mainly HCl and SOx).
Following EC's classification, the Gas Treatment Systems have been distributed among 3 categories : Dry, Semi-Dry and Wet Processes. Semi Wet/wet processes (wet + evaporation of liquid effluents) are included in Semi-Dry GTS.
Each GTS has specific characteristics in terms of Neutralisation Agent nature, required excess quantities, and corresponding generation of residues.
Table 6 shows the distribution of incinerators in EC as a function of GTS [Eew97].
Totals Gas Treatment Systems COUNTRY Dry process Semi-dry process Wet process Others
(nb = number Capacity Capacity Capacity Capacity Capacity

DT 00 B 017D Page 16
of MSWI) nb kt/year nb kt/year % nb kt/year % nb kt/year % nb kt/yr % AUSTRIA 3 510 3 510 100% BELGIUM 17 2151 1 55 3% 8 741 34% 8 1355 63% DENMARK 26 2741 8 482 18% 7 790 29% 11 1469 54% FINLAND 1 50 1 50 100% FRANCE 63 9209 16 1439 16% 18 2277 25% 29 5493 60% GERMANY 57 13427 19 4217 31% 38 9210 69% ITALY 32 3407 13 1106 32% 1 84 2% 18 2217 65% LUXEMBOURG
1 150 1 150 100%
NETHERLANDS
11 5223 1 60 1% 4 1683 32% 6 3480 67%
NORWAY 5 440 2 225 51% 3 215 49% SPAIN 7 1200 2 515 43% 5 685 57%SWEDEN 15 2088 6 778 37% 9 1310 63% SWITZERLAND
24 2722 1 85 3% 23 2637 97%
UK 7 2140 4 1140 53% 3 1000 47% TOTAL EC17 269 45458 53 5485 12% 63 11392 25% 148 27896 61% 5 685 2%TOTAL EC15 240 42296 51 5260 12% 62 11307 27% 122 25044 59% 5 685 2%
Table 6 - MSWI capacities and numbers of plants for the 3 types of GTS. Source : Updated Juniper 1997 (Plants capacities >30 kt/year) [Eew97] , updated from several sources.
Notes that semi-wet/wet processes are included in the semi-dry processes. We have identified 41 such plants in Europe :
Belgium 5 plants 480 kt/yr France 3 plants 480 kt/yr Germany 33 plants 7700 kt/yr (*)
Total 41 plants 8660 kt/yr
(*) including 5 plants with pure wet scrubbing for 1510 kt/y. The distribution of APC systems when related to the amount of incinerated MSW leads to the following percentages for all Europe (line EC17 in above table) :
• Dry processes : 12% • Semi-dry processes : 27% • Wet processes : 61% (including wet/semi-wet)
Comments.
Compared to our different sources, partial updating of these results was attempted, but it is difficult to improve estimations. Juniper 1997 data are not always consistent with other sources, and there is a constant evolution of GTS processes due to the more and more severe regulation for gas emission, and also to the evolution towards suppression of liquid residues in some countries (in Germany, all new incinerator must be effluent free).
This constant evolution is illustrated by the French evolution from 1992 to 1997 shown on figure 3.

DT 00 B 017D Page 17
72
33,4
28
15
3,3
5
12
13
13
14,6
19,4
21
11,7
47
40,6
51
0% 10% 20% 30% 40% 50% 60% 70% 80% 90% 100%
1992 TNO (> 10 kt/year)
1995 TNO (> 10 kt/year)
1997 ALSTHOM (> 10 kt/year)
1997 JUNIPER (> 30 kt/year)
Gas Treatment System Distribution (% capacity)
WETS-DRYDRYUnknown or filter only
Figure 3. Evolution of GTS Process distribution in France
Time

DT 00 B 017D Page 18
2.6 Residue production in Europe
2.6.1 Sorts of residues
The residues from incineration can be divided into 3 main ways (figure 4) : • Primary residue from combustion : Bottom Ash or Slag (coarse ash) • Residue from gas treatment : APC residues (solids + possible liquid effluent) • Emissions at the stack (gas effluent + some residual solids)
Bottom ashes represent the highest amount (around 30% of incinerated mass, see next paragraph). Their typical composition is 30 to 50% glass, 30 to 60% sand, 10 to 20% scrap iron and other metals, 5 to 20% water.
Figure 4. Mass Flow-chart in incineration of MSW
According to the possible Gas Treatment Processes employed to meet the gas effluent specifications, the APC final residues may have different nature and composition. They include the following residues, in separate of combined form :
• Boiler Ash
• Cyclone Ash Fly Ash (solid residues)
• Filter Ash (fly ash from filtration steps (fabric filter or ESP)
• Neutralisation residues : solid residues
• Liquid effluent (containing salts if not treated) Neutralisation residues
• Filter cakes from treatment of liquid : solid residues
1 000
250
Furnace
5 5 20 12
Boiler Filter APC
(Neutrali -zation)
Bottom ash
MSW Emissions
APC residues

DT 00 B 017D Page 19
Gas treatment process
Reactant Nature of APC
residues
Type of APC residues
Dry Semi-Dry Semi-wet
Lime Ca(OH)2 Bicarbonate
Solid [Fly Ash + salts] (mixed) or
Fly Ash / Salts Wet Lime
NaOH Solid
+ liquid Fly Ash / Liquid effluent / Filter cake
Semi-wet Wet
Lime + NaOH
Solid Fly Ash / Salts or Fly Ah + Salts / Filter cakes
Table 7a - Nature of APC residues as a function of GTS.
Neutralisation residues are mainly composed of the Neutralisation salts (NaCl, CaCl2, CaOHCl, …) according to neutralisation agent employed as well as to its required excess (NaOH, Ca(OH)2, Na2CO3).
2.6.2 Amounts of residues per incinerated mass
Quantities of residues are usually expressed in mass ratios “residues/incinerated waste”, or mass percentage of incinerated MSW.
The production of bottom ash should correspond to the inert part in MSW, which is around 20% to 30% (see §2.2.2), plus some unburned material (< 3%). It is often assumed that the average production is 300 kg/ton (30%), or more commonly 250 kg/ton (25%) of MSW incinerated. [Rij99] gives a wider range of 20% to 35% but accepts a lower representative value of 215 kg/ton (with 15% humidity) in overall evaluations.
The production of pure fly ash depends on the primary combustion set-up. They are mainly related to the carry-over of particles from the waste bed, and are thus dependent on the grid type and mixing system, on the primary air distribution, and on gas circulation (co-flowing or opposite flowing, depending on the flue gas outlet position). For example, a reduction of speed of primary air flowing through the waste layer can reduce the amount of fly ashes. Some particles are produced in the flame (ZnO, soot,…) and their generation (or destruction) depends on other parameters (HM contents, secondary air distribution). It can explain differences between units, although no statistics are published on that question, to our knowledge.
The production of other APC residues (neutralisation residues) highly depends on the GTS system.
Following ranges are usually considered for residue ratios :
• fly ash (boiler ash + filter ash) = 14 to 34 kg/t
• salts (neutralisation products) = 0 to 60 kg/t depending on the S and Cl contents of MSW, on the nature of the reactant, and on the type of GTS (no solid salts to be considered with wet processes with effluent release, 14 to 50 kg/t for other Gas treatment systems)
Some processes (dry or semi-dry) do not have specific filtration for Fly Ash which are collected with the neutralisation products.
Slightly different figures are given by [FZK97] (table 7b), which makes a more detailed distinction between different types of residues (bottom ash = grate ash + grate sifting, fly ash = boiler ash + filter ash). This reference gives a lower amount of fly ash, attributed to a recent evolution towards a "more gentle combustion", in Germany. This “more gentle” combustion should mean a lower carry-over of particles from the waste layer (e.g. optimized air blowing system).

DT 00 B 017D Page 20
type of residue kg per ton MSW Comments grate ash 200-350 (or 250 - 400? ) grate sifting 1-5 usually mixed with grate ash boiler ash 5 filter ash 10-15 decreased from 30 (more gentle combustion)
(20 in below diagram) wet scrubber (APC)
12 mostly used in Germany. Salts have to be evaporated (in Germany).
dry system no data
Table 7b - Amounts of residues according to [FZK97]
Depending on the gas treatment system, average solid residues amounts have been estimated from chemical calculations assuming a Chlorine content of 7g/kg and a sulphur content of 2g/kg in MSW (table 7c) (see details below, in table14a and comments, and in annexe B). A similar analysis is presented in [Ber99]. These values are compared to [Rij99] recent values.
Gas treatment process
APC residues kg/ton of MSW our evaluation
kg/ton of MSW for comparison
[Rij99] Dry Salts (Neutralisation residues) +
fly ash (commonly mixed)
51.7 = 25 + 26.7 40.6 (D)
= 15.2 + 25.4
Dry with Bicar “ 38.1 = 25 + 13.1 Not evaluated
Semi-Dry Neutralisation residues + fly ash (commonly mixed)
50.3 = 25 + 25.3 35.5 (C)
= 15.2 + 20.3
Wet filter cakes + fly ash 29.3 = 25 + 4.25 16.8 (A)
= 15.2 + 1.6
Semiwet-Wet filter cakes + fly ash 39.4 = 25 + 14.4 30.2 (B)
= 15.2 + 6.9 + 8.1
Simple Filtration Fly ash 25 15.2 Not considered
Table 7c - Amounts of APC residues for different GTS.
[Ber99] “fly ash” basic value or 25 g/kg is an average value (in a range of 10 to 34 g/kg for a set of 8 European facilities).
Our "Wet GTS" values are in the [FZK97] range of 27 - 32 kg/ton for boiler ash + filter ash + wet scrubber residues.
The calculated overall range for APC residues is 30 to 59 kg/t, which is consistent with the range given above for salts and fly-ash (30 to 60).
The [Rij99] values are 20 to 30% lower, because they are based on 39 % less fly ash, and a lower Cl content in MSW (Cl = 5.9 g/kg and S = 1.9 g/kg). The basic value of 15.2 for fly ash (dry value) seems rather low to be representative of the whole Europe. It corresponds to a value measured on the Alkmaar facility (NL) which can be considered as an advanced facility (14 g/kg, according to [Ber99]). It could be representative of the more modern units but not of the current average.
Furthermore, if boiler ash are added to bottom ash, as suggested by the flow chart of [Rij99] figure 3, the value of 15.2 is in agreement with the German values of 15 g/kg for “filter ash” for an advanced facility (table 7b). According to the same source, boiler ash is 5 g/kg. Total fly ash (boiler ash + filter ash) is then 20 g/kg. Our value of 25 for European average is slightly higher.
Anyway, no better precision may be expected from available statistics.
2.6.3 Estimation of overall amounts of residues in Europe
Overall estimation of APC residues production in Europe can be obtained from distribution of GTS

DT 00 B 017D Page 21
in Europe (table 6) and ratios of residue production given in table 7c. Calculation shown in table 7d gives respective average productions from 24.2 to 39 kg/tonMSW for the three sets of estimated ratios.
GTS % in Europe kg/ton of MSW Ber99D Ber99E Rij99
Dry 14% 58.7 51.7 40.6 Semi-Dry 22% 52.5 50.2 35.5
Wet 64% 30 29.3 16.8 Simple Filtration neglected 25 25 15.2 Total or average 100% 39 37 24.2
Table 7d - APC residues production ratios in Europe
Detailed estimation for production of APC residues for each country is given by table 7e, with calculation based on the second estimation of [Ber99E], and on overall incineration capacities (thus overestimated). It gives a production of residues of 1690 kt/year.
GTS Dry process
Semi-dry process
Wet process
Others Mean APC ratios
Incinerated MSW
Estimated amounts
Available data
Ultimate storage
APC ratios kg/ton 51,7 50,2 29,3 25 kg/ton Capacity APC APC APC COUNTRY % MSW processes by GTS types kt/year kt/year kt/year kt/year AUSTRIA 100% 29,3 510 15 12 0,6BELGIUM 3% 34% 63% 37,1 2151 80 DENMARK 18% 29% 54% 39,3 2741 108 FINLAND 100% 51,7 50 3 FRANCE 16% 25% 60% 38,0 9209 350 255 255GERMANY 31% 69% 35,9 13427 482 400ITALY 32% 2% 65% 37,1 3407 126 LUXEMBOURG 100% 51,7 150 8 NETHERLANDS 1% 32% 67% 36,3 5223 190 NORWAY 51% 49% 40,8 440 18 SPAIN 43% 57% 35,8 1200 43 40 40SWEDEN 37% 63% 37,6 2088 79 SWITZERLAND 3% 97% 30,0 2722 82 UK 53% 47% 51,0 2140 109
TOTAL EC17 12% 25% 61% 2% 37,2 45458 1690
Table 7e - Mean APC residues production per country in Europe
For further calculations, owing to the fact that the mean calculated APC ratios seems somewhat lower than our estimation (depending on the country, see next paragraph), we have chosen a rounded estimation of 33 kg/ton (which is between our estimation and [Rij99] estimation).
We also have to base the calculation on actual incinerated amounts of MSW, which are lower than incineration capacities. For all Europe, it thus gives the following rounded amounts :
40 000 kt/yr incinerated MSW (average estimation from available data, see tables 3 and 5a)
10 000 kt/yr bottom ash (average 250 kg/tMSW) 1 320 kt/yr APC residues (base 33 kg/ tMSW)

DT 00 B 017D Page 22
2.6.4 Comparison to some particular situations
The accuracy of the estimations of APC ratios and amounts can be evaluated from comparison with available data for some countries, especially when overall production of residues can be known and compared to overall incinerated amounts.
France
In France, annual storage of APC residues in CSDU (ultimate waste disposal centres) is 255 kt/yr (source: ADEME, see annex in step1 report, and additional data on France in annex to this report), for an overall mass of 10 800 kt of MSW incinerated : it corresponds to an overall APC/MSWI ratio of 24 kg/tMSW instead of the above estimation of 38 kg/tMSW (60% higher).
Our calculated APC ratio seems overestimated as compared to overall ratio. No explanation was found apart from a possible effect of temporary storages (a part of amounts is temporary stored in incineration facilities), and that in some cases, fly ashes can be mixed with bottom ashes and thus don’t go to class I disposal sites. This can explain that the amount going to disposal centres would be lower than the actual amount produced. But this last practice should not represent a significant proportion, as it is not allowed in France and may only concern some small units.
Example of a French MSWI plant equipped with a wet system (see annex), shows that this ratio can actually be reduced to 19 kt/ tMSW, salts rejected in rivers or sea being around the same amount.
Germany
In Germany, liquid effluents have to be evaporated to prevent the release of salts in the rivers. Above estimation of 482 kt/yr (based on 36 kg/tMSW) should not be far from real value. It is nevertheless 20% higher than the German value given by [Dpu97] (400 kt/yr, which corresponds to 30 kg/tMSW). Amounts of residues may be lower due to optimised gas treatment, according to [Fzk97].
Spain
From Spanish statistics giving overall productions of residues (see data on Spain in annex), the following APC ratios per type of GTS are derived :
ESP only 23 to 30 kg/tMSW. with semi-dry 50 kg/tMSW. Mean value 40 kg/tMSW (overall amount of 40 kt for 1000 ktMSW in 1998)
These values are in agreement with the mean ratios used in above calculations, and the overall ratio of 40 is slightly higher than the above estimation of 36 kg/tMSW for Spain.
Austria
For Vienna-Spitttelau plant, main incinerator in Austria, APC residues are around 22 kg/tMSW.(see table "Austria Data"). It is lower than the estimated value of 30 kg/tMSW given above, based on usual wet systems. It may be due to the well-advanced flue gas treatment for this unit, as it is claimed to be.
Filter cakes residues, which represents only 1,1 kg/tMSW., are sent to Heilbronn in Germany, while slag and fly ash are used for making special concrete in disposal centres :
"After separate transport of slag (in covered wagons) and filter ash (in silo transporters) to a special processing plant, these two residues are sieved, scanned to remove any ferrous scrap, mixed with cement and water, and used in landfill construction for border walls as a slag-filter ash concrete with an eluate (leaching) quality approaching that of drinking water.

DT 00 B 017D Page 23
The ferrous scrap removed from the raw slag at the plant itself is returned to the material cycle (steel production). The filter cake is transported to Germany by rail in big bags, and used there as infill in a disused salt mine."
For all Austria (3 plants over 30 t/h), it gives a fair estimation of 560 t/year sent to German Mines.
(Current cost for transportation and storage : 490 € / ton).
Comments on Norway & Denmark
In Norway, the Langøya center receives an annual amount of 40 kt of fly ash, mainly from Norway and Denmark (see Step1 report). Taking the calculated amounts of 20 kt/year for Norway + 114 kt/year for Denmark, it should mean that Denmark sends around 17% of APC to Langøya, if Norway sent 100%. Denmark sends the other part to German mines or to local temporary storage (see additional details hereunder).
Comments on The Netherlands
Proportion of wet systems in The Netherlands is slightly higher than France, and practice is the same : salts can be eliminated with the liquid effluent , especially for plants located near the sea. We don’t have data on overall production.
2.6.5 Comparison to German mine-valorisation amounts
Overall figure of 1500 kt/yr APC residues can be compared to total amount of residues sent to German mines for mine-valorisation :
676 kt/yr hazardous residues (APC + other residues) disposed of in mine-valorisation in Germany (in 1997).
This amount should mainly includes APC residues, but also some other hazardous wastes. Part coming from MSWI is not known (90%?), and amounts going to underground storage are not included. Main part of APC residues should logically be accepted in mine-valorisation centres (which are cheaper), depending on their quality (HM content, leachability). Low quality APC residues should be sent to underground storage (e.g. Austrian filter cakes residues are sent to Heilbronn).
Estimation of APC involved in mine valorisation
Assuming the percentage of 90%, it gives a rough estimation of :
600 kt/yr APC residues are used in mine-valorisation sites in Germany
It represents 45% of the whole European production of APC residues (above estimation of 1320 kt/yr).
We can note that owing to the current capacity of German mines, the whole European APC residue production could be sent to Germany if it were economically and politically viable.
Comparison to production from Germany and nearby countries
Amounts of APC produced in Germany and neighbouring countries are :
400 kt/yr APC residues for Germany
394 kt/yr APC residues for Switzerland + Denmark +Netherlands
It shows that only a part (around 50%) of APC residues from neighbouring countries are sent to German mine-valorisation facilities.

DT 00 B 017D Page 24
2.7 Final destination of the residues
The management of the residues depends of the practices, regulation and site availability as a function of the country considered. In any case the residue has to fulfil with the regulation in force prior to be stored in its final destination.
2.7.1 Solid residues (bottom ash or APC residues)
Solid residues are possibly addressed either to landfills to be stored with possible stabilisation treatment, road construction applications or salt mines storage.
Different types of final destination of the solid residues have to be considered :
1) Valorisation - Road application (incorporation in filling or covering material)
- Mine-valorisation (incorporation in filling or building material), in salt or coal mines (Germany only)
2) Landfill for hazardous wastes - Landfill in Underground storage (Salt mines) - Landfill in surface sites equipped for hazardous wastes (CET or Class I type in France) (Langøya in Norway is classified as such a landfill site but is also doing valorisation).
Usually, bottom ash go to valorisation in road application (provided they respect quality criteria) (see example of French situation in below frame), and APC residues (Salt+Fly ash) to landfills - after being packed in "big bags" or transported in special tankers for powdered products - where they can be mixed with cement for stabilisation.
French classification of bottom ash As given in the French regulation “circulaire de mai 1994”. • Catégorie V : leachability < 5% : can be directly utilized (valorized) • Catégorie M : leachability < 10%: can be utilized after temporary storage for
aging (maximum 1 year) or stabilization. It goes to catégorie V if leachability is correct, catégorie S if not.
• Catégorie S : leachability > 10%: no possible utilization, must be sent to CET2 landfills
See for example some leaching test in [Sch94] (with a method for improving the quality of bottom ash).
Very few utilisation of APC residues takes place, except :
in the Netherlands, where 30 to 50% of fly ash is used as a filler in asphalt [Bor94, Van99]
In Germany, where APC residues are used for mine-filling in mine-valorisation sites (probably more than 90% of these residues, 10% going to deep storage mines). In coal mines, APC residues are pumped as a cement grout admixture used as mine building material.
In Norway, where the disposal of fly ash (in the Langoya centre) contributes both to neutralisation of acid residues and to the filling of an old quarry. In that site, alkaline dry and semidry residues are mixed with waste sulphuric acid and landfilled in a deep, former limestone quarry as an impure gypsum product (see step1 report).

DT 00 B 017D Page 25
Landfills for hazardous waste must normally be equipped with leachate collection systems. In some countries, residues have to be stabilised (by solidification and/or chemical stabilisation) prior to disposal.
Future and current landfills will have to apply the recent European Directive on landfill (discussed in the Step1 report), which has to be adapted to each European country before 2001.
Some countries, e.g. Denmark and the Netherlands, are currently considering residue management options and investigating various treatment concepts and processes. In the meantime, the residues are placed in temporary storage facilities or landfills or exported to the German underground facilities or the Norwegian treatment and storage facility at Langøya.
2.7.2 Liquid residues
Liquid residues are released in the environment (in rivers, or in the ocean for some units in The Netherlands), after being treated for pollutants removal (HM, acids, solids, pH control to 7).
The possibility to release liquid effluents in the environment becomes more and more limited. Most of the wet gas treatment previously exploited in Belgium and Germany have been replaced by dry, semi-dry, semi-wet or mostly semi-wet/wet systems.
2.7.3 Quantities involved
No other data on quantities involved per type of destination and residues were found, except for the figures presented in §2.6.
Next paragraph gives complementary details on residue management.
2.8 Discussion on the various residues management policies in Europe
2.8.1 Fly ash
Fly ash, i.e. the particulate material collected by electrostatic precipitators or fabric filters upstream of the neutralisation systems, is generally classified and treated in much the same way as the dry and semidry residues are.
They are placed in hazardous waste landfills with or without prior treatment. The most common treatment form in the EU member states is probably solidification/stabilisation with Hydraulic binders (cement or cement-like substances) often supplemented with the admixing of various proprietary additives. This is done e.g. in Austria, Belgium, Germany and France (Veh97c, Vra99, Fly97). In some cases the fly ash is washed prior to solidification/stabilisation to remove the readily soluble salts (mostly chlorides). This is done in Switzerland (Veh97c). Methods for chemical stabilisation of fly ash with phosphates, carbon dioxide, ferrous sulphate and other chemicals (with or without prior washing of the ash) are under development but not yet in general

DT 00 B 017D Page 26
use. In some member states, e.g. Germany and Denmark, fly ash pre-collected at incinerators with wet scrubbing systems is mixed with the sludge from treatment of the scrubber liquid effluent and landfilled (Fly97). The purpose of this treatment should be for the fly ash to absorb excess liquid from the sludge and for the sludge to bind/reduce some of the potentially soluble trace elements in the fly ash, thereby reducing their leachability. More sophisticated treatment methods such as the 3R process in which the fly ash is extracted with the acid scrubber liquid effluent from the wet scrubbing process and subsequently fed back on the grate to be sintered, are only in use at very few incinerators (Veh99). High temperature treatment methods such as melting and vitrification are currently not being applied to fly ash in full scale in Europe due to the high Energy requirements and the technical difficulties involved.
2.8.2 Residues from dry and semidry processes
There is no qualitative difference between the composition and the management options and practices for residues from the dry and semidry processes, respectively. The only difference concerns the excess of neutralisation agent : due to higher stoechiometric ratio , the residues from dry processes generally have a higher content of unreacted neutralisation agents than the semidry residues have. Dry and semidry residues will therefore be discussed together.
It is quite common to collect the excess reactants and the reaction products from the dry and semidry processes together with the fly ash. In some countries, e.g. Belgium, the fly ash is filtrated upstream of the neutralisation systems, and the dry and semidry residues consists of reaction products and excess neutralisation agents with only very small amounts of fly ash. With few exceptions (most notably Hg), most of the contaminants and trace elements are associated with the fly ash, and the fly ash containing residues from the dry and semidry processes may therefore be regarded as fly ash diluted with reaction products and excess neutralisation agents.
Several processes have been designed to recover calcium chloride and sodium chloride from the dry and semidry APC residues, but to our knowledge few or none of these processes are currently used commercially (Fly97).
The dry and semidry residues are generally placed in hazardous or special landfills with or without solidification/stabilisation (Belgium, France, Great Britain, Sweden) or they are stored in excavated salt mines (Germany). In the Netherlands and Denmark, the residues are placed in temporary storage, awaiting the development of appropriate technology and new regulations. As mentioned previously, part of the residues produced in Denmark are exported to a Norwegian treatment and landfilling facility (Langøya). The same solidification/stabilisation methods (cement and other additives) that is used for fly ash are also applied to the residues from the dry and semidry processes. Because of the high contents of soluble salts, the amounts of cement and other additives necessary are higher and the results in terms of stability and reduction of the leachability of contaminants as well as economics are less satisfactory than for fly ash (Fly97, Veh97c). The most promising stabilisation processes for dry and semidry residues are based on initial or

DT 00 B 017D Page 27
simultaneous removal of the soluble salts by an aqueous extraction followed by the actual stabilisation step. This washing operation produces a saline extract with a content of trace elements, which must be treated prior to discharge.
The technical and economical problems associated with high temperature treatment (melting and vitrification) of dry and semidry residues are even more pronounced than for fly ash and no such processes are in commercial operation.
Particular case of dry process using sodium bicarbonate
Using NaHCO3 as neutralisation agent, it is possible to find an industrial utilisation of the neutralisation residues. Such unit is already in operation in Italy (Rosignano) , and another unit with a capacity of 50 kt is under construction in Nancy (France) for strartup in summer 2001.
Such practice can clearly reduce the amount of residues from incineration to send to landfill.
2.8.3 Residues from the wet process
In the wet process the fly ash is always pre-collected upstream of the wet scrubbers. The waste streams from the process may consist partly of sludge from treatment of the wastewater and partly of treated wastewater containing the soluble salts, mostly the chlorides. The purpose of the wastewater treatment is to reduce the content of trace elements in the wastewater to a very low level.
In some EU member states (e.g. Denmark), where most of the MSW incinerators are located near the sea, the discharge of treated, saline wastewater with a low content of trace elements presents no problem. In other member states where most or all incinerators are located inland, far away from the sea, the discharge of saline wastewater may not be acceptable, and in those cases the wastewater from the scrubbing System is evaporated to produce a dry residue consisting of salts and various impurities. This is e.g. common practice in Austria, Germany and the Netherlands. On few incinerators, HCl is recovered from the acid scrubber effluent by distillation (Veh97c). It is also possible to recover gypsum by separate treatment of the wastewater from the second scrubbing stage in two-stage scrubbing systems (e.g. in Spittelau, Austria, see annexe).
The dry Solids from the evaporation of the liquid effluent is treated similarly to the dry and semidry residues (without fly ash). The sludge from treatment of the wet scrubber effluent will often appear as a filter cake, which may be landfilled at a special or hazardous waste landfill after stabilisation or mixing with fly ash. The treated wastewater is discharged to the sewage System or directly into a receiving water body.

DT 00 B 017D Page 28
3. Impact of PVC on the quantity and hazardousness of the residues
3.1 General aspects on PVC composition and main applications
PVC is a chlorinated hydrocarbon polymer consisting of a linear carbon chain for which alternate carbon atoms have one of their hydrogen atoms replaced by a chlorine atom. The chlorine in PVC represents 57% of the weight of the pure polymer without any additives. Pure PVC will be designed as "resin" and the term "polymer" will be used for the different types of PVC compounds.
According to the targeted application the PVC polymer formula can vary in large proportions because of additives incorporated into the polymer as filler, stabiliser, lubricant, plasticiser, pigment or flame retardant. PVC products can be classified in two major categories, rigid PVC and soft (or plasticised) PVC.
Building and construction : mainly rigid PVC Packaging : plasticised and rigid PVC Wire, cables and elec. : plasticised PVC Leisure : plasticised and rigid PVC Transport : mainly rigid PVC Furniture, office equipment : plasticised and rigid Clothing footwear : plasticised Domestic appliances : rigid and plasticised
Clothing Footwear3%
Leisure4%
Wire, cable & Elec.9%
Packaging15%
Building & Const.54%
Furniture, Office Eq.3%
Transport3%
Domestic appliances1%
Other uses8%
Figure 5 - PVC use per destination
Hazardouness of PVC incineration may come from two problems :
Effect of Chlorine content (main effect) : production of Chloride Acid HCl, which has to be neutralized in the APC system and can influence combustion conditions, especially heavy metals partitioning, dioxines production, and leaching properties of residues

DT 00 B 017D Page 29
57% Cl in pure PVC 14% - 53% Cl in PVC products 37% - 50% Cl in incinerated PVC
PVC Chlorine contents
Effect of Heavy Metal content (minor effect) : mainly Cd, and also Sn, Pb, V, Zn.
3.2 Chlorine content
3.2.1 Chlorine content in PVC products
Chlorine content in pure PVC resin is 57% (exact value for C2H3Cl is 56.8%).
The resin content of PVC products - and consequently the Chlorine content - are highly dependent on the formulation of the polymers.
Chlorine concentration therefore varies from 53% in rigid products (93% PVC resin) to 34% in films (60% PVC resin) and 25% in cable covering (44% PVC resin). This concentration can go down to 14% in flooring applications (25% resin).
3.2.2 Chlorine content in PVC incinerated
Industrial wastes (e.g. cable covering and flooring applications) are not to be incinerated with domestic Waste ; only a part of the PVC production is devoted to incineration for end-of-life products. For the effect of PVC on MSW, we have to consider the average composition of incinerated PVC, and not the average composition of PVC produced.
Following table gives the average chlorine content in PVC incinerated, according to various sources. It ranges from 37% to 50%, calculated from estimation of part of soft PVC and Rigid PVC in MSW. Sources
Nieuwenhuysen 1996 [Nie96]
De Groot 1993 [Gro93]
Reimann 1991 [Rei91]
Rijpkema 1993 [Rij93]
Rijpkema 1999 [Rij99]
Rasmussen 1995 [Ras95]
Mark 1995 [Mar95]
% Soft PVC 50 34 30 50 28.6 50 % Rigid PVC 50 66 70 50 46.0 50
%Cl in incinerated PVC 41 45 50 41 37.3 48 40
Table 9a – Composition in soft or rigid PVC, and Chlorine contents in incinerated PVC
A mean value of 45 % can be accepted for calculations of Cl contribution (Calculation presented in [Ber99] are based on 50%). Note that recent analysis by [Rij99] results in a Cl content of 37.3%, lower than all previous estimations.
3.3 Heavy metal content in PVC
3.3.1 Origin of Heavy Metals
Heavy metals in PVC only come from additives used for particular products such as Pipes, Fittings, profiles and Cable covering.
Table 9b [Buh98, Ecv98, Ber99] gives typical ranges for Pb, Sn, Cd, Ba, Zn, Ca, contents in PVC products (packaging or other products), depending on stabiliser types added to resin.

DT 00 B 017D Page 30
Stabiliser Type Main Metal Metal Content (%) in PVC Packaging Other Products
Lead compounds Pb Lead Not used 0.5-2.5 Organotins Sn Tin 0.1-0.2 0.3-0.5
Cadmium compounds (usage restricted by EC/91/338)
Ba Cd Pb
Barium Cadmium Lead
Not used “ “
0.1-0.2 0.1-0.3 1.0-1.8
Barium/Zinc compounds (only for plasticised applications)
Ba Zn
Barium Zinc
Not used “
~ 0.1 < 0.1
Calcium/Zinc compounds Ca Zn
Calcium Zinc
0.1 < 0.1
~ 0.1 < 0.1
Table 9b - Typical Metal Contents in PVC Products
3.3.2 HM in average PVC products
Table 10 gives a calculation of the mean HM contents for PVC in the Netherlands, from percentages of different PVC manufactured products. It considers only Sn, Zn and Pb.
It is based on TNO values [Tno96] for annual production and composition (which is slightly different from the above pie chart composition).
Table 10 - Calculation of mean HM content (Sn, Zn, Pb) in PVC in the Netherlands
It shows that : Sn is present in rigid foil (30mg/kg), but is only 1 mg/kg on the total PVC production. Zn content can go up 600 mg/kg and represents only 78 mg/kg on the average. Pb content can go up to 14 g/kg (=1,4%) and represents 0,81% of the total PVC production.
This percentage corresponds to the use of 1256 tonnes of Pb for producing 155 ktonnes of PVC per year (overall cross-checking could be done with values obtained from the PVC industry).
The composition of the PVC incinerated in MSW is different : only some types of PVC have to be considered, as shown further on.
Overall PVC production in the Netherlands, and Heavy metals contentsProduct and classification NL-market Composition (%) Heavy metals contents
(mg/kg)Heavy metals production
(t/year)
soft/rigid kt/ year % PVC Organic (plasticizer)
inorganic (filler) Sn Zn Pb Sn Zn Pb
Rigid foil rigid 6 4% 90 7 3 30 0,18 0 0Soft foil soft 5 3% 60 30 10 400 0 2 0Vinyl carpets soft 13 8% 53 33 14 600 0 7,8 0Cable isolation soft 15 10% 46 28 26 14000 0 0 210Boots soft 1,2 1% 43 51 6 500 1500 0 0,6 1,8Roof lining soft 4,8 3% 50 35 15 350 0 1,68 0Construction Elements rigid 7 5% 80 6 14 2000 0 0 14Pipes rigid 103 66% 91 6 3 10000 0 0 1030Total PVC 155 100% 80,3 12,5 7,3 1 78 8102 0,2 12,1 1255,8

DT 00 B 017D Page 31
Average PVC content in MSW in Europe
• 0,74% (TNO 1992, Mar95)
• 0,86% (APME 1996)
• 0,64% (TNO 1996, Rij99)
• 0,70% (ECVM, EVC99) [Pcv99]
• 0,73% (Rasmussen Ras95)
• 0.9 % (current calculation)
3.4 Effect of PVC on the composition of MSW
3.4.1 PVC content in MSW
PVC content in MSW from 0,4 to 1,6%, depending on the country (table 11) and also on sources. Differences between countries can be due to recycling policy and also to quality of statistics methods.
Minimum values (0.4% to 0.6%) are found for Netherlands, Norway and Italy.
Maximum values are found for France (1.2%) and
Switzerland (1.35%).
Debate on France data Value given for France has been modified.
In fact, raw data from ADEME 1993 [Pol96] gives a surprisingly higher value of 16 % PVC in the plastic fraction of MSW instead of an average value of 10%. But this value was supported by [Rij93] (1990 data : 21% PVC in plastics, 6% plastics in MSW, thus > 1.3% PVC in MSW). An even higher value of 2.2% can be derived from [Pol96], for MSW before recycling. It turns into 1.6% assuming 40% recycling for PVC bottles and packages.
Due to development of recycling practices in France, and especially to replace of many PVC packages by PET (peak change in 1997/98), real PVC percentage should now be much lower than this value. That is why we replaced the value of 16% PVC in plastics by 12% (highest percentage of other countries), which gives a value of 1.2% PVC in MSW.
Source : values of percentages (%plastics, and share of PVC in plastics) are taken from ISWA 1996, excepted for France (see above explanation).
Table 11 - Parts of plastics and PVC incinerated with MSW
Average percentage for Europe is calculated in table 11 by weighing percentages by annual amounts incinerated, from OECD 95 data, excluding countries for which no data on PVC content
PVC in French MSW in 1993 ADEME data, on dry MSW [Pol96]
• 1,5% PVC bottles/packages • 0,4% other PVC packages • 0,3% other PVC products
Total PVC 2.2% 1.6% if 40% packages are recycled
Part of plastics and PVC incinerated with MSWMSW % MSW Incinerated Percentages en %wgt
Country annual amount incinderated MSW % plastics % PVC in % PVCkt/yr wgt % kt/y in MSW plastics in MSW
A 3841 17 653 7% 9% 0,63%B 4781 31 1482 7% 10% 0,70%CH 2660 76 2021 15% 9% 1,35%D 25777 25 6444 7% 10% 0,70%DK 2788 56 1561 5% 12% 0,60%E (SP) 14296 5 715 11% 12% 1,32%F 28000 37 10360 10% 12% 1,20%I 27000 5 1400 7% 8% 0,56%L 218 58 126 8% 10% 0,80%Nw 2637 17 448 6% 8% 0,48%NL 8956 26 2234 6% 7% 0,42%UK 20000 12,5 2500 10% 10% 1,00%total and Average 140954 21,3 29944 8,7% 10,5% 0,92%without CH and Nw 135657 20,3% 27475 8,3% 10,8% 0,90%without France 112954 17,3% 19584 8,1% 9,6% 0,77%

DT 00 B 017D Page 32
are available. It results in the following mean percentages for PVC : 1.1% using the original French value of 1.6% PVC in MSW (ADEME1993 value) 0.9% using the corrected value of 1.2% (result shown in the table) 0.77% by eliminating France from calculation (result shown in the table) 0.70% by eliminating France and Switzerland (not shown)
Accuracy of original data per country is questionable, as other sources give average PVC content for Europe between 0.64 and 0.86% (see above frame).
It may come from differences of composition between raw MSW and incinerated MSW (composition after extraction for recycling), and also from the general evolution.
For further calculations, we have considered an average value of 0.8 % PVC in European incinerated MSW.
3.4.2 HM in average PVC incinerated
Table 12 (from [Tno96, Nie96]) gives corrected calculation for HM content in incinerated PVC, using above composition, and estimated TNO values for the part incinerated for each category of PVC products.
PVC Contents in Municipal Solid Wastes in the Netherlands Average concentrations in MSW
Product and classification NL-market Processed in MSWC Composition (%) Heavy metals contents
(mg/kg)Chlorine content
soft/rigid kt/ year % product kt/year % PVC Organic (plasticizer)
inorganic (filler) Sn Zn Pb % Cl
Rigid foil rigid 6 100% 6 41% 90 7 3 30 51,3Soft foil soft 5 100% 5 34% 60 30 10 400 34,2Vinyl carpets soft 13 10% 1,3 9% 53 33 14 600 30,2Cable isolation soft 15 0,5% 0,075 1% 46 28 26 14000 26,2Boots soft 1,2 100% 1,2 8% 43 51 6 500 1500 24,5Rooflinings soft 4,8 0% 0 0% 50 35 15 350 28,5Construction Elements rigid 7 1% 0,07 0% 80 6 14 2000 45,6Pipes rigid 103 1% 1,03 7% 91 6 3 10000 51,9Totals 155 9% 14,7 100% 72,5 20,8 6,8 12,3 230,3 905,6 41,3
Table 12 - Heavy metal content in incinerated PVC in the Netherlands
It gives the following HM contents in PVC incinerated, that can be compared to contents in PVC produced :
Sn 12 mg/kg PVC incinerated 1 mg/kg PVC produced. Zn 230 mg/kg PVC incinerated 78 mg/ kg PVC produced. Pb 906 mg/kg PVC incinerated 8102 mg/ kg PVC produced.
(0,09 % PVC incinerated 0,81% kg PVC produced).
Main Pb contributors are items "cable isolation" and "Pipes". Less than 1% of these categories of PVC are incinerated. It explains the lower average Pb content in incinerated PVC. On the opposite, Sn and Zn have higher contents in incinerated PVC than in produced PVC.
Note that we have taken 0,5% instead of 0% for cables processed in MSWC. This explains a slightly higher value than given by TNO [Tno96b] (750 mg/kg).
This value can be compared to the average value of 500 mg Pb/kg plastic in MSW fractions, from other TNO data : PVC is a higher Pb contributor than other plastics.
Table 12 gives also a calculated mean chlorine value of 41,3% in the PVC incinerated in MSW, consistent with the mean value of 45% given above.

DT 00 B 017D Page 33
3.4.3 PVC effect on Cl and HM content of MSW
Effect of PVC can be evaluated by comparing the contribution of PVC to the average contents in Chlorine and lead in MSW.
PVC contributions
(base: 45% Cl /PVC and 0.8% PVC in MSW, 45% Cl in PVC, 906 mg Pb per kg MSW, 230 mg Zn)
PVC contribution to Cl in incinerated MSW : 3.6 g/kg PVC contribution to Pb in incinerated MSW : 7.2 mg/kg
Usual content in incinerated MSW (see § 2.2 )
Cl content: 7.4 g/kg Pb content: 670 mg/kg
PVC shares
PVC contributes to 49% of Cl content in MSW, and to 1.1% of Pb content in MSW, on the basis of 0.9 % PVC in MSW.
Respective shares given by [Rij99] are 41% for Cl and 0.74% for Pb, on the basis of 0.64 % PVC in MSW (see table 13b ).
These values are in the range given in [Ber99] (38% to 66%).
Our value for Pb (1.1%) may be overestimated, but other sources mention quite higher values : • 10 % (in the Netherlands) [Min97] • 6 % (in Denmark) [Depa98, Rei91] • 3 % (in Sweden) [Mer99]
The values of 6% and 10% are however clearly overestimated. 10% would correspond to the hypothetical case in which all sorts of PVC (including cable isolation and pipes) would be put in domestic incineration. Pb influence of 6% given in [Rei91] was obtained with a very large rigid PVC content (U-PVC ≈ 0.7% ) in MSW.
Anyway, accuracy of these estimations is low because it cumulates all uncertainties on PVC content in MSW, composition of PVC found in MSW, and average composition of MSW. It highly depends on the collecting and recycling policies in different countries.
3.4.4 Other HM, Cl, S, data for comparison
Table 13a, from [Ber99/Rij93] data, presents the PVC influence on the MSW composition, determined for 0.7% PVC in MSW, PVC being a 50/50 mixture of rigid (U-PVC) and flexible PVC (P-PVC). This source is consistent with the above values for the share of Cl and Pb (respective contributions of 39% and 1%). More recent TNO results [Rij99] give a more complete analyse including other metals (table 13b). From both results it appears that the influence of PVC on heavy metal content in MSW is significant only for cadmium, for which it represents a contribution of 7% (table13b) or 11% (table 13a). This contribution is much higher than for lead and tin (Pb ≈1%, Sn ≈2%, V≈1% ). Contributions to other HMs (Hg, As, Co, Cr, Cu, Mn, Ni, Sb, Se, Zn,...) are lower than 1%. The situation for Cadmium is being changing, because Cadmium additives are now only permitted in PVC profiles and not in other products. The lower contribution of 7% can be considered to be more representative of current situation.

DT 00 B 017D Page 34
1st evaluation , from Rij93 data Elements standard PVC - U PVC -P PVC waste Contribution of 0.7%PVC from MSW MSW (rigid) (flexible) (50% U) in MSW Influence in %
Cl g/kg 7,4 510 320 415 2,905 39%S " 2,4 0 0 0 0 0%Cd mg/kg 6,4 100 100 100 0,7 11%Pb " 570 1470 240 855 5,985 1,1%As " 8,3 0,5 0,5 0,5 0,0035 0,04%Sn " 4,4 25 0 12,5 0,0875 2,0%Zn " 710 0 450 225 1,575 0,2%Other Metals " 1354 396 370 383 2,681 0,2%
• PVC-U : Unplasticised (e.g. pipes, windows frame) (rigid, strong, weather proof) • PVC-P : Plasticised (e.g. cable covering, floor covering, some packaging) (flexible)
Table 13a - PVC contribution to elementary composition of MSW (partial)
2nd evaluation , from Rij99 data
Basic percentages for calculations PVC-P/total=
50% PVC/MSW= 0,64%
Elements standard PVC - U PVC -P PVC waste Contribution of PVC from MSW wet MSW (rigid) (flexible) (50% U) in MSW Influence in %
C g/kg 274,4 357,3 420,4 389 2,49 0,9%H " 38,3 45,4 54,6 50 0,32 0,8%O " 165,1 9,7 48,2 29,0 0,19 0,1%N " 9,1 Cl " 5,9 459,7 286,3 373 2,39 40,5%S " 1,9 0 0 0 0,00 0,0%P " 1,0 F " 0,11 Br " 0,15
ash " 196,1 28 90,5 59,25 0,38 0,2%water " 307,94 100 100 100 0,64 0,2%LHV MJ/kg 9,46 16,17 19,98 18,075 0,12 1,2%Hg mg/kg 0,6 0,09 0,09 0,09 0,0006 0,10%Cd " 8,5 90 90 90 0,58 6,78%As " 7,4 0,45 0,45 0,45 0,0029 0,04%Co " 13 0,9 0,9 0,9 0,0058 0,04%Cr " 190 23 23 23 0,15 0,08%Cu " 1630 230 230 230 1,47 0,09%Mn " 110 23 23 23 0,15 0,13%Ni " 100 9 9 9 0,06 0,06%Pb " 670 1320 220 770 4,93 0,74%Sb " 31 9 9 9 0,058 0,19%Se " 4,8 no data 0 Sn " 4,5 23 11,5 0,074 1,64%V " 26 45 45 45 0,29 1,11%Zn " 1000 410 205 1,31 0,1%
total HM " 3795,8 1773,44 1060,44 1416,94 9,068 0,2%
Table 13b - PVC contribution to complete elementary composition of MSW Source : [Rij99] (TNO study R99/462)

DT 00 B 017D Page 35
Recap
♦ Cl contribution 50 % (3.6 g/kg for a usual content of 7.4 g/kg Cl in MSW) ♦ Cd contribution 7 % (0.6 mg/kg for a usual content of 8.5 mg/kg Cd in MSW) ♦ Pb contribution 1 % (7.2 mg/kg for a usual content of 670 mg/kg Pb in MSW) ♦ HM contribution 0.2 % (9 mg/kg for a usual content of 3800 mg/kg HM in MSW)
3.5 Impact of PVC on the quantity and hazardousness of the residues
3.5.1 Main effects of PVC
As already mentioned, the hazardousness of PVC incineration comes from two points :
Effect of Chlorine content (main effect) : production of Chloride Acid HCl, which has to be neutralized in the APC and can influence combustion conditions, especially heavy metals partitioning and dioxines production, and finally leaching properties of residues
Effect of Heavy Metal content (minor effect) : mainly Cd, and also Pb, Zn, Sn.
PVC thus can change composition and amounts of residues from combustion :
Increase of the amount of APC residues, due to the increase in neutralisation agents needed for neutralisation of HCl, proportionally to the amount of Cl coming from PVC
Increase of the chlorine content of fly ash
Changes in HM partitioning between residues (less HM in bottom ash, more HM in APC residues).
This last effect (transfer of HM from bottom ash to Fly ash and other APC residues) is due to the formation of HM chlorides or oxi-chlorides in the combustion, which are highly volatile at combustion temperatures. This effect could be favourable, as it may improve the quality of bottom ash for recycling purpose (better leaching characteristics). However, according to [Ber99], this effect is not significant in usual MSWI combustion conditions.
3.5.2 PVC influence on the Neutralisation residues
The presence of PVC in MSW has a direct effect on the quantity of chlorine in the raw gas and therefore on the corresponding necessary gas treatment efficiency. The higher chlorine content in the gas requires additional neutralisation agent supply and therefore affects the quantity of residues or effluents generated by the different Gas Treatment Systems.
Gas Treatment Residues relating to the use of PVC are mainly composed of chlorine salts and neutralisation agent excess. According to the Gas Treatment System these can be either sodium salts NaCl, Na2CO3 (dry process with sodium bicarbonate, wet process with sodium hydroxide), or calcium compounds CaCl2, CaOHCl, Ca(OH)2 (for processes using lime).
Due to the lack of availability of APC residues representing situations where no PVC would be incinerated, no direct comparisons of the quantities and hazardousness of the various types of residues produced with and without incineration of PVC can be made.
Instead of such direct data, an estimation can be done in terms of the amounts of residues

DT 00 B 017D Page 36
depending on the APC. This approach includes four APC types : the dry process, the semidry process, the wet process and the semiwet-wet process.
1) Effect on the amount of residues per type of APC
The estimated amounts of APC residues components for 4 types of gas treatment systems have been estimated within the study presented in [Ber99].
The quantities of residues attributable to PVC were calculated in scenarios where the most severe emission limits for HCl (10 mg/Nm3) are met, except for the standard dry process with standard grade lime which is not likely to meet this specification.
Results are listed in table14a. It shows the amounts of residues produced, in kg per tonne of incinerated waste, with and without PVC. It also gives the absolute increase in kg/t MSW, and the share of PVC (increase divided by the “with PVC” case) ; note that percentages expressed in terms of increases instead of shares would result in slightly higher percentages. Data with PVC correspond to data already presented in table 7c (our estimation).
Amount produced (kg per tonne of waste incinerated)
Effect of PVC
Gas treatment process and respective residues
Without PVC With PVC kg / t MSW % share (w/w)
Dry process: • Acid gas cleaning residue • Fly ash Total
19.5 23.8 43.3
26.7 25.0 51.7
+ 7.2 + 1.2 + 8.4
26%
16 %
Dry process with Bicar: • Acid gas cleaning residue • Fly ash Total
9.1
23.8 32.9
13.1 25.0 38.1
+ 4.0 + 1.2 + 5.2
30%
14 %
Semidry process: • Acid gas cleaning residue • Fly ash Total
19.8 23.8 43.6
25.3 25.0 50.3
+ 6.5 + 1.2 + 6.7
26%
13 %
Wet process: • Fly ash • Filter cake Total
23.8
4.3 28.1
25.0
4.3 29.3
+ 1.2
+ 0 + 1.2
4.8%
4.1%
Semiwet-wet process: • Acid gas cleaning residue • Fly ash (total) Total
10.0 23.8 33.8
14.4 25.0 39.4
+ 4.4 + 1.2 + 5.6
31%
14 %
Table 14a - Estimated amounts of residue components in APC, and effect of PVC
These calculations are based on rounded values, slightly different than above values : • Cl content in MSW : 3.5 g/kg without PVC, 7 g/kg with PVC (⇔ 0.7%PVC in MSW ∗50%Cl)
(PVC is assumed to double the Chlorine content in MSW) • S content in MSW : 2 g/kg • 66 Cl and 50% S neutralized in gas treatment step (other part goes to bottom ash and for a
lower part to fly ashes) • Stoechiometric ratios from 1.10 to 2 for HCl according to GTS (table14b) • Stoechiometric ratios from 1.10 to 4 for SO2 according to GTS (table14b’)

DT 00 B 017D Page 37
GTS N.A. Products Basic S.R. N.A. Neutr. residues (formula) (formula) ratio kg N.A./ kgCl kg / kgCl
Dry with lime (standard grade lime)
Ca(OH)2 Ca(OH)Cl, H2O 2 2.08 3.11
Dry with Bicar NaHCO3 NaCl, Na2CO3 1.05 2.48 1.72 Semi-dry Ca(OH)2 Ca(OH)Cl, H2O 1.7 1.77 2.80 Wet: NaOH +
Ca(OH)2
NaCl + CaCl2 1.1 1.14 1.96 (effluent)
Semiwet-wet Ca(OH)2 NaCl + CaCl2 1.1 1.14 1.91
Table 14b – Stoechiometric ratios for HCl treatment GTS N.A. Products Basic S.R. N.A. Neutr. residues (formula) (formula) ratio kg N.A./ kgS kg / kgS
Dry with lime Ca(OH)2 CaSO4,2H2O 4 9.25 12.32 Dry with Bicar NaHCO3 Na2SO4, Na2CO3 1.2 6.30 5.09 Semi-dry Ca(OH)2 CaSO4,2H2O 4 9.25 12.32 Wet: Ca(OH)2 CaSO4 1.1 2.54 4.25 Semiwet-wet Ca(OH)2 CaSO4,2H2O 1.1 2.54 5.61
Table 14b’ – Stoechiometric ratios for S treatment
These stoechiometric ratios are typical values based on chemical analyses, validated by comparison with experimental data gathered on a set of selected incinerators. Actual stoechiometric ratios can be different, and may vary according to type of unit and country emission standards (decreased thanks to recycling of excess neutralisation agent or optimising system, increased for obtaining lower pollutant emission levels).
Details on these calculations are given in annexe B.
Table 14 a shows that the influence of PVC on the amount of acid gas cleaning residues ranges from 4% to 31% , according to the type of Gas Treatment System.
PVC Influence on pure fly ash (without neutralisation products) is less than 5%.
Influence on overall residues amounts ranges from 4% to 16%.
These percentages are fairly equivalent to PVC allocations given by [Rij99] (14.5% for scrubber residue, 16.4% for semi-dry scrubber residue, 11.6% for filter cakes in wet system) (and 34% salt residue in wet system with effluent evaporation). Detail comparison is presented as follows.
Comparison to PVC effect in [Rij99]
Table 14d gives comparative results from Rijpkema [Rij99].
He assumes fly ash mass ratio of 15.2 g/kgMSW, and respective contents of 37.3%Cl in PVC, and 0.64%PVC in MSW. He also assumes a reduced stoechiometry for extra Cl associated with PVC, due to some compensation by SO2.
The lower amount of fly ash (15.2 instead of 25 g/kgMSW) was discussed above (corresponds to the Alkmaar MSWI unit, while we consider a rough average value for Europe, see comments on table 7c in § 2.6.2).
GAS TREATMENT BOTTOM ASH
FLY ASH
DRY (D)
SEMI-DRY (C)
WET (A)
SEMI WET – WET (B)
Neutralisation Agent. Lime BICAR Lime Lime Lime Stoechio. ratio. for HCl 2.5 - 1.8 1.1 1.1

DT 00 B 017D Page 38
Stoechio. ratio. for HCl from PVC
1.5 - 1.3 1.1 1.1
Our stoechio. for HCl 2 1.05 1.7 1.1 1.1 Residue usual amounts (kg/tonne MSW)
215 15.2 25.4 - 20.3 1.6 15
Our usual amounts, kg/t MSW 250 25.0 26.7 13 25.7 1.2 14.4 Cl effect (kg/kgCl) for Cl from PVC x 0.18 0.012 1.55 - 1.39 0.08 1.23 PVC effect (kg/kgPVC) x∗.37 0.066 0.005 0.580 - 0.520 0.029 0.458 Allocation to PVC 0.19% 0.19% 14.5% - 16.4% 11.6% 19.5% Our Chlorine effect (kg/kg neutr. Cl) y/.66 3.11 1.72 2.80 1.96(*) 1.91 Our Chlorine ratio (kg/kg Cl in MSW) y 0.46 0.34 2.05 1.14 1.85 1.29 (*) 1.26 Our PVC effect (kg/kgPVC) y∗0.5 0.23 0.17 1.02 0.57 0.93 0.65 (*) 0.63 Our allocation to PVC 4.8% 26% 30% 26% 4.8% 31%
(*) in liquid effluent (kg dry matter/kg ref.)
Table 14d - Influence of PVC on the quantity of residues : comparison to TNO [Rij99] results
We obtain quantities of APC residues around 1 kg residue per kg PVC (0.57 to 1.02), while [Rij99] gives around 0.5 kg residue per kg PVC (0.46 to 0.58). We thus obtain higher allocations to PVC.
This is not only due to a lower Cl content in PVC in [Rij99] (37.3% instead of 50%), but to different approaches of the stoechiometry linked to Cl from PVC :
• We assume that for dry and semi-dry systems, stoechiometry must take into account the formation of Ca(OH)Cl, H2O rather than CaCl2 (see annex B). Formation of CaOHCl is discussed in [All97] and [Joz95]. Such effect explains the high stoechiometric ratio (around 2) usually needed for dry and semi-dry treatments.
• We don’t take into account the SO2 compensation effect, because SO2 neutralisation reactions are slower than HCl neutralisation reactions.
• From data on experimental behaviour, we assume that only 66% of Cl is neutralised by Gas treatment, other part being absorbed in bottom ash and fly ash (accuracy of such percentage is of course questionable but it is in the range of uncertainties) ; [Rij99] gives a percentage of 74% neutralised in Gas treatment (see §A.5. Chlorine Balance).
2) Effect on the amount of residues in overall European production
From European statistics on Gas Treatment System given above (12% dry, 25% semi-dry, 61% wet), we have computed the average effect of PVC on the amount of APC residues in overall European production. Table14b gives amounts of residues values calculated with and without PVC, from a first evaluation [Ber99D], and from updated values given in table 14a (2nd evaluation, [Ber99E]). Semi-Wet wet processes are included in semi-dry processes in both evaluations.
GTS Dry process
Semi-dry process
Wet process
Others Mean APC ratios
Incinerated MSW
% MSW processes by GTS types kg/ton kt/year TOTAL EC17 12% 25% 61% 2% 45500
APC amounts in kg per ton of MSW in kt/year
1st evaluation [Ber99D] With PVC 58,7 52,5 30 25 39,0 1776 Without PVC 44,9 41,3 28,7 23,7 33,7 1535 PVC share 24% 21% 4% 5% 14% 241
2nd evaluation [Ber99E] With PVC 51,7 50,7 29,3 25 37,3 1697 Without PVC 43,3 43,7 28,1 23,8 33,8 1537 PVC share 16% 14% 4% 5% 9% 160
Table 14c - Estimated average amounts of residues, and effect of PVC

DT 00 B 017D Page 39
It shows the allocation of PVC for each type of Gas Treatment System : • 16% share for the dry process • 14% share for the semi-dry process • 4% for the wet process • 5 % for the simple filtration process not relevant (negligeable part of APC systems)
In wet systems, the amount of solid residues is lower, because some liquid residues (salt water) can be rejected into rivers and seas, depending on the country and the location.
Taking into account proportions of each GTS in Europe (12%, 25%, 61% 2%), it gives an overall effect due to the PVC of 10% share in amounts of residues.
Assuming this average value of 10%, overall European production of solid residues directly due to PVC can then be estimated to 130 kt/year on a total of 1 320 kt/year, on the basis of 40 000 kt MSW incinerated per year.
3) Effect on hazardousness of residues
The effect of PVC on APC residues is directly related to the effect on the MSW composition, which has been shown to be a substantial increase in the chlorine contents, a significant increase in Cadmium content (≈ 11%), and less significant increases in other heavy metals contents (Pb ≈1%, Sn ≈2%, V≈1% ). A large part of these elements are found in APC residues, mainly in chloride form).
Bottom ash
As already stated (and explained in [Ber99]), in the current temperature range of combustion conditions for MSW incineration, the higher chlorine content has no significant effects on the transfer of other Heavy Metals and trace elements from bottom ash to gas treatment residues, although some studies show such a possibility, which would improve the leachability characteristics of bottom ashes.
PVC has thus an negligible effect on the amount and composition of bottom ash.
Fly ash (primary filter ash)
Fly ash (from primary filter step) contributes between 11% to 15% of the neutralisation of the HCl. Its chlorine content is consequently subject to variations following the Cl content in the waste.
Recent studies [Ber99] show that the Cl content in fly ash varies between 1.8 to 13.2 % (or 4 to 10.2 % according to other studies).
All APC residues
The increase in chloride salts content of fly-ash and APC residues has a direct influence on leaching properties of the residues.
Table 15a gives an attempt to quantify this effect from laboratory experiments on leachability of residues [Ber99]. It gives the amount of leachates corresponding to a period of 50 years, for each type of residues, without and with PVC (basic Liquid to Solid ratio L/S = 1 l/kg). It is based on the assumption that the waste contains 7.0 kg Cl/tonne in the presence of PVC and 3.5 kg Cl/tonne without PVC.

DT 00 B 017D Page 40
The corresponding relative increases due to PVC are given in table 15b.
For all residues, the incineration of PVC (which concentration in MSW is 0.6 to 0.8 %) appears to increase the content of leachable salts (primarily chlorides of Ca, Na and K) up to a factor of about 2.
Effect on the leaching of trace elements/heavy metals (-7% to +5% for Cd, 0% Pb in table 15b) is not significant. This is supported by the fact there isn’t any available data showing that the leaching of trace elements/heavy metals would increase significantly as a result of the incineration of PVC. Component
Dry residue (incl. FA)
Semidry residue (incl. FA)
Wet + fly ash Fly ash (FA)
without PVC
with PVC
without PVC
with PVC
without PVC
with PVC
without PVC
with PVC
g/t g/t g/t g/t g/t g/t g/t g/t Chloride Sulphate Ca Na K Cd Pb
119000
1300 53000 8900
13000 0.46 3400
200000
1300 89000 15000 22000 0.43 3400
65000
140 32000 7700
10000 0.17 15
130000
140 56000 13000 17000 0.16 15
29000 2400 3500 9900 9900
0.00038 0.00045
55000 2400 5400
19000 19000 0.0004 0.00045
49000 3000 5900 15000 19000
7.0 9.1
94000 3000 5800 29000 37000
7.3 9.1
Table 15a - Estimated average amounts of leachates in 50 years, and effect of PVC
Components Dry residue
(incl. FA) Semidry residue
(incl. FA) Wet + fly ash Fly ash (FA)
Chloride 68% 100% 90% 92% Sulphate 0% 0% 0% 0% Ca 68% 75% 54% -2% Na 69% 69% 92% 93% K 69% 70% 92% 95% Cd -7% -6% 5% 4% Pb 0% 0% 0% 0%
Table 15b - Effect of PVC on leachability of residues Source : Leachability results come from column leaching tests carried out by VKI on dry residues from I/S Nordforbrænding, semidry residues from I/S Amagerforbrænding, wet scrubber sludge mixed with fly ash from Göteborg [Hje92] and fly ash from I/S Vestforbrænding [Hje93].
3.6 PVC producers involved in salt mines storage activity
Solvay SA will be involved in such activity, by Solvay Salz (+ associated partners) when the new underground storage site is opened in Borth.

DT 00 B 017D Page 41
4. Technico-Economic comparison of salt mines storage with the competing routes
4.1 Final destination of the residues in Europe
According to the national policies and corresponding regulations in force, the solid residues from Gas Treatment can be stabilised by a cement-based binding, and then stored in different final destinations as shown below:
Belgium : Class 1 special landfill for non-stabilised residues in Flanders Class 2 landfill for stabilised residues in Wallonia
France : special landfill disposal (class 1) after stabilisation to meet the leaching criteria
Netherlands : landfill
Germany : salt mines storage or reutilization (mine-recycling)
Austria : salt mines storage in Germany for filter cakes (Heilbronn), special landfill disposal for others
Italy : landfill after stabilisation
Great Britain : landfill
Denmark : on-site landfill (situation at Kommunekemi) or sent to Norway (Langøya)
No stabilisation is required for salt mine storages (as practised in France or Germany).
4.2 Specification of the residues for each destination
In any case, the characteristics of residues have to be determined before being accepted in landfills or recycling sites.
Specification of quality of residues (leachability, HM content) should mainly be taken into account for recycling purpose, or for allowing disposal in landfill for non-hazardous wastes. In these case, it is important to know all characteristics which could have an environmental effect or change the quality of the final product (concrete, filling material, road material).
These specifications less concern the usual case when residues are sent to landfills for hazardous wastes (as in it is the case for all APC residues in France), apart from the need for stabilisation. The amount of binding product needed for stabilisation increases with the soluble content, but this parameter doesn’t seem to be taken into account in acceptance or cost criteria by disposal site operators.
Particular case of salt mines deposit
For underground deposit in salt mines, criteria for acceptation are lower than for other sites, as no stabilisation is required. Usual criteria are [Uev00] :
- not explosive - not spontaneous combustible - no generation of toxic or explosive gases - no reactions between the wastes or with the rock salt - no spreading of diseases

DT 00 B 017D Page 42
- no penetrant smell - sufficient stability
Fulfilment of such criteria should rise no problem for residues from incineration. Incinerator fly-ash and flue-gas cleaning residues were the first categories of waste for Heilbronn deposit. Salt mines are considered to be an ideal disposal place for these kinds of waste.
Particular case of salt mine-filling valorisation sites
For mine-filling, main additional criteria for acceptation of residues is that the compressibility under the maximum overburden pressure may not be higher than 22% [Uev00], in order to obtain the best resistance and avoid any collapse of the mine (which is the purpose of the filling). Such a criteria may be achieved by a proper mixing of the waste with some mine salt residues (covering of big bags with salt tailings), or with incineration slag (bottom ashes), or other mine techniques.
Another acceptation criteria is that residues are in a form which is easy to handle.
All residues from incineration of domestic wastes should fulfil these criteria.
Note that stabilisation is not required in salt mines, but is required in other mines, mainly coal mines (firstly in order to increase resistance, especially if the residue is used in building material ; secondly to limit leachability).
New legal base
All current practices, excepted mine-valorisation, will have to comply to the April 1999 European Council Directive 199/31/EC, which gives general principle for waste acceptance criteria and procedures for landfill of waste. According to that directive, a special classification is given to salt mine deep storage, but acceptation criteria are still to be defined by a technical committee. But this should not bring basic changes to current practices.
4.3 Cost comparison
Cost for disposal of residues has to include : - transportation cost - storage or disposal costs - stabilisation cost if necessary and not included in disposal costs
Handling and packaging are included or not considered in the analysis . Typical costs will be estimated, and an estimation of maximum transportation cost to salt mine for keeping this route competitive will me assessed.
4.3.1 Costs for Storage or disposal
Costs for disposal have been estimated from literature data and from direct contact with some companies.
Prices depends on quantities (price is higher for small quantities because of analysis and handling procedures), on type of residues and on type of storage.
The table 16 shows the different costs for the management of the solid residues from Gas Treatment (fly ash, neutralisation salts, filter cake) up to their final destination. This includes the cost of stabilisation when required.

DT 00 B 017D Page 43
Country Nature of the residues Stabilisation
required Type of final
storage cost
(∈/tonne) Source
Belgium (Wallonie)
Fly ash and Salts Yes Landfill Class 2 155 Ber99
France All solid residues Yes CET Landfill Class 1 215 - 260 (Δ) “ No Salt mine storage 200 Sto99
Italy All solid Yes Landfill Class 2 135 - 160 Ber99
Netherlands Fly ash Neutralisation Salts
Filter cake
No No No
Landfill
110 100 100
Ber99
Germany Any Any
Other (non hazardous ?)
No No (*) No (*)
Salt Mine storage Mine recycling
“
225 - 450 50 - 150
15
Oko98,UEV Oko99
(*)
Austria Fly ash Filter cake
No (*) No
Landfill Salt Mines
130 (*) 460 (see comment)
Ber99, Spi00
Great Britain Fly ash and Salts No Landfill 75 Ber99
Belgium (Flandres)
Fly ash and Salts No Landfill Class 1 120 to 130 Ber99
Denmark Fly ash and Salts No Landfill 80 Ber99
Norway Fly ash and Salts No Quarry recycling/storage
Unknown(◊) 80 ?
Table 16 - Solid residues storage costs (∈/tonne)
(Δ) For France, see data on French Class I and some interviews in annexe. Prices given by phone without stabilisation
are 110 -183 €/t. Prices with stabilisation are in the range 229 -259 €/t. Salt mine price is 216 €/t. All prices including
French special tax on pollutant activities of 18 €/t. Range given by [Ber99] is 210 – 240 €/t.
(*) From Mr. J.Mügge :The price for the « Bergversatz » (mine recycling) is extremely dependent on the characteristics of
the material itself (Chemical nature, kind of additional work which has to be used to convert it in a building material
suitable for mine filling, legal classification...) Although minimum price given for some mines is 15 €/ton, no mine will
accept APC residues at such a price. Usual price for APC residues is in the range of 100 € to 140 € (this is in the range
given by the Green Öko-Institut 50-150).
(◊) but “quite competitive with the prices to German salt mines” (see annex on Norway disposal site in previous report)
Main source of cost values is [Ber99], which is based on information given by operators from each country.
UEV/Heilbronn : basic price given for underground deposit is 230 €/t (450 DM/t). Price can be higher for low density
packages, from 230 to 269 € (450 to 920 DM/t), with a minimum weight of 1 tonne. [UEV00].
K+S recycling : last price found in newspapers [Sud00] is 600 to 700 F/t (91 to 108 € /ton) for French APC residues
coming from Angoulème MSWI (152 to 305 €/t with transport). This exceptional case in France has just been accepted
by the French government but causing some problems. Authorization was cancelled on March 24th [Sud00b].
The table shows a large range for the cost for residue disposal, from 50 to 460 €/ ton.
The highest cost, given for Austria, is the price for storage of filter cakes (490 €/ton, rail transport included). This contract was signed 10 years ago, and should be renegotiated in 2000. Price will certainly be lowered, due to recent price drop for residue storage in Germany. It currently corresponds to the highest price given by Oko98 and Oko99.

DT 00 B 017D Page 44
Other costs range from 50 to 240 €/ton.
Usual prices should be closer to the French price (200 €/ton, transport not included).
Apart from salt mines, the cost mainly depends on the need to stabilise the residue prior to storing, and we can thus consider two categories :
- with stabilisation : 175 ∈/tonne (range : 135 – 240, exceptionally up to 460) - without stabilisation : 105 ∈/tonne (actual range : 50 - 130)
Extra cost for stabilisation around 70 ∈/tonne can be attributed to PVC for 25 % (average leachability increase).
For mine disposal, as practised only in Germany (see previous report), stabilisation is mainly done in recycling sites, where fly ash or APC residues are mixed with other materials for making building material, especially in coal mines. No stabilisation is basically necessary in salt mines (recycling or storage sites), as leachability is not to be considered in a salt layer : residues can be stored in big bags or in various mixture forms. In that case, the “with stabilisation” case may be cheaper, due to the fact it is practised in cheaper mine-valorisation sites (provided highly leachable residues are really accepted). The main difference is the classification of storage :
- salt mine deep storage : 200 ∈/tonne to 450 ∈/tonne - salt mine recycling : 100 ∈/tonne (range 90 - 140 ∈/tonne)
Higher costs for deep storage can be attributed to stronger management criteria (obligation to fulfil local and European Directives on landfill of residues).
Lower costs for mine recycling can be attributed to the fact that residues (especially fly ashes) are well-adapted materials for mine-filling, and that it reduces costs for assuring security and safe closing of mines. Management practices refer to mining regulations, which have looser environment obligations (especially for leachability controls and book-keeping).
4.3.2 Transport costs
Transport costs highly depend on the way of transportation and on the quantities involved.
• For road transport, a typical cost is 0.06 €/t-km for quantities around 23 t (one truck). Range derived from [Sud00] is 0.06 to 0.20 €/t-km. Ranges obtained by questioning different transport companies in Europe (see annexe A : transport data) is 0.04 - 0.12 €/t-km. We can assume a mean cost of 0.10 €/ton/km.
• For rail transport : should have equivalent or lower costs for large quantities, but prices are difficult to be obtained (no price obtained from French Railways (Ecorail) or Spanish Railways (Renfe). Price obtained from a German company (Schenker-BTL) is 0.07 €/t-km for transport in 4 wagons. Each wagon can carry around 40 t residues in big bags (maximal mass 50 t).
• For ship transport : lowest cost for large quantities. Range 0.015 to 0.03 €/t-km for 300 to 1000 km and quantities 250 t or 500 t. Temporary storage of APC residues, and regrouping should be needed.

DT 00 B 017D Page 45
Compared to current disposal costs, transport prices are negligible for usual distances. For road transport on a distance of 800 km, its share is around 15% in overall disposal cost.
Usual distances between incineration plants and disposal centres are lower than this distance.
4.3.3 Example of price estimation for residue disposal in France
This example concerns a MWSI plant located in southwest France, and sending residues to a long-distance disposal centre for ultimate wastes.
CET (Class 1) disposal centre (usual price including stabilisation) 240 €/t
Transport (700 km) by road 40 €/t
Total (VAT not included) 280 €/t
Total per mass of MSW incinerated (assuming 33 g/kgMSW) 9 €/t
The estimated price for CET is in the usual range of 215 – 260 €/t in France (see above table).
The transport price assumes bulk transport with lowest handling costs. It represents 14% of overall costs.
For usual situation, distances are lower than these values. In France, such long distance is forbidden if nearer CET1 centres exist, except in special cases with legal authorization (*).
This shows that the main cost is usually the disposal cost.
(*) Exceptional recent authorization for Angoulème MSWI (see above comment) (cancelled before application) has been possible only by classifying APC residues as mine material. This classification is logic when sending residues to mine-valorisation sites, but raised some questions (if really accepted, why not allow such practise in France ? – why considering two different classifications for the same residues ?…), apart from other political or ecological, or industrial issues….
4.3.4 Costs for disposal in a salt mine storage
Assuming a basic price of 200 €/t (official price StocaMine – negociated prices may be lower), overall disposal cost to this mine would be (for distance from 200 to 1500 km) :
P = 200 + Distance (km) * 0.10 € /t
It would be competitive to sent residues to this mine rather than a nearby centre assumed to offer a price 40 €/t higher, up to a additional distance of 400 km.
Of course, this depends highly on negotiation contracts, and on the regulation dispositions which could impose using use nearby centres (according to a proximity principle) or would not allow transport on too long distances.
Long distance transport by ship should much easily be accepted (*), and is basically adapted to such wastes (transport time is out of question) but would mean extra cost for handling from MSWI plants to rivers and from rivers to mines, and temporary intermediate storage in order to “massify”.
(*) for example, such transport was practised for German MSW to an incineration plant in Bordeaux (France) (distance > 2000 km) but should now be forbidden for MSW, although a new technique of MSW wrapping (clearly authorized but with no legal classification) could now allow such transport in very good conditions.

DT 00 B 017D Page 46
4.3.5 Costs for disposal in a mine recycling site
In the case of disposal in German mine recycling sites, much lower cost would make long distance transport competitive.
Assuming a price of 100 €/ton for disposal, it gives a overall price of (for distance from 200 to 1500 km) :
P = 100 + Distance (km) * 0.10 € /t
To reach the same level as deep storage (200 €/t), distance may be increased by 1000 km.
At these conditions, it would be advantageous for all countries around Germany to send their whole production of residues to the German mines. The main obstacle comes from both political and environmental points of view (well illustrated by the recent example on the question of export of APC residues from France to Germany [Sud00] (copy in annexe).
For this case, the distance from Angoulème to German mines is of the order of 1000 km, and K+S offered the lowest cost conditions (or at least the best overall economical option).
Note that all values are based on a transport price of 0.10 €/t/km, and that could change depending on fuel price.
Contrary to the exagerated point of view of the [Sud00] newspaper article, APC transport must not be considered as highly dangerous. The classification of APC residues as hazardous wastes is mainly from a disposal point of view.
Lower transport costs by ship or rail would be limited by extra handling costs, negligible for long distances (> 1000 km), and that could make German mines competitive for any incinerators in Europe.
4.3.6 Incineration costs for comparison
Costs for elimination of final residues can be compared to the incineration cost for MSW in Europe.
Usual range is 67 to 100 €/t.
Assuming a APC residue ratio of 33g/kgMSW and an elimination cost of 180 €/t, this elimination cost represents around 6.6 €/tMSW and around 8% of total incineration cost.

DT 00 B 017D Page 47
5. Conclusion
In this conclusion, we gives a recapitulation of average key typical values concerning the situation of APC residue disposal in Europe.
Attention should be given to uncertainties : precision of these values can not be better than 20%.
No high overall precision can currently be expected on the question of MSW, due to large discrepancies and continuous evolution in practises, type of classification, composition, incineration techniques and residue management for domestic wastes around Europe.
MSW production in Europe
♦ Amount of MSW produced in Europe >150 000 ktons/year.
♦ average individual amount 400 kg / year / capita.
MSW incineration in Europe
Incineration is mainly practised in Northern Europe, where it can represent up to 76% of MSW, while it is lower than 5% in Southern countries (Spain, Italy, Greece). For the European average, it gives around 20 to 25% incinerated.
♦ 230 large incinerator plants (over 30 t/h)
♦ 20-25% of MSW are incinerated (range 1% to 76% for different countries)
♦ Overall incineration capacity 45 000 ktons / year
♦ Amount of MSW incinerated 40 000 ktons / year
♦ Gas Treatment systems (GTS) : 61% wet, 25 % semi-dry, 12% dry
♦ 10 000 kt/yr bottom ash produced from MSW (250 kg/ tMSW)
♦ 1 320 kt/yr APC residues (fly ash + neutralisation products) (33 kg/ tMSW)
Disposal costs (average or more probable values) for APC residues
♦ Overall range for landfill 50 to 460 €/ton
♦ Surface disposal site : ≈ 200 ∈/tonne but highly variable
♦ salt mine deep storage : same
♦ salt mine recycling : ≈100 ∈/tonne
Assuming that 45% of the whole European production of APC residues goes to mine-valorisation in Germany, it gives :

DT 00 B 017D Page 48
♦ average disposal cost ≈ 180 ∈/tonne.
♦ 238 Million €/yr for disposal of APC residues
♦ Disposal of APC residues represents around 8% of total incineration costs.
Effect of PVC in MSW
The influence of PVC on MSW composition is mainly related to the chlorine content of the waste sent to incineration : PVC is responsible for 38 to 66 % of the chlorine content in MSW (total Cl in MSW containing PVC : 6.4 to 10.5 g Cl / kg MSW, average 7.2 g Cl/kg).
PVC also influences some Heavy Metals content in the MSW : mainly Cadmium, as 7 to 11% of Cd in MSW is attributable to PVC. Its share is 1.7% for tin (Sn), 1% or less for other HMs (Pb, V, Zn, …). Average typical values are :
♦ 0.8 % PVC in MSW (320 kt/year)
♦ 45 % Cl in the PVC incinerated with MSW
♦ Cl contribution 50 % (3.6 g/kg in a usual content of 7,4 g/kg Cl in MSW)
♦ Cd contribution 7 % (0.6 mg/kg in a usual content of 8.5 mg/kg Cd in MSW)
♦ Pb contribution 1 % (7.2 mg/kg in a usual content of 670 mg/kg Pb in MSW)
♦ HM contribution 0.2 % (9 mg/kg in a usual content of 3800 mg/kg HM in MSW)
Effect of PVC on APC residues from incineration of MSW
The presence of PVC in MSW has a direct effect due to the higher quantity of chlorine in the raw gas, which requires additional neutralisation agent supply and therefore affects the quantity of residues or effluents generated by the different Gas Treatment Systems (GTS) or Air Pollution Control (APC).
PVC effect represents :
♦ 19 % increase of residues from dry APC
♦ 18 % increase from semi-dry APC
♦ 5 % increase from wet APC without evaporation (major part of salt residues being rejected with the liquid effluent)
♦ 5 to 31 % higher leachability of APC solid residues (due to neutralisation salts).
♦ 10% of overall solid APC residues (fly ash + neutralisation products) from MSW incineration in Europe, i.e. 130 kt/year.
Effect of PVC on disposal costs of incineration residues
♦ Extra costs due to higher leachability : the higher need for stabilisation results in possible

DT 00 B 017D Page 49
extra costs for disposal < 65 €/ton, a priori included in landfill prices
♦ No extra cost in case of disposal in salt mines (no stabilisation required)
♦ main cost increase is due to the increased amount of residues (+10%) : ≈ 24 Million €/year
Salt Mines storage
♦ Good solution, from a technical point of view, for ultimate storage of APC residues (long-term viability, no stabilization required, costs currently comparable or lower than surface Class 1 landfill for hazardous waste).
♦ Enough capacity : the whole European APC residue production could be sent to Germany if it were economically and politically viable. Currently around 40% to 45% (rough estimation) is sent to salt mines.
♦ For special landfill storage, main cost is the disposal cost (transport < 15% of overall price up to 800 km distance)
♦ Low cost practised in mine-recycling sites would make their use competitive up to long distances. Assuming 0.10 €/ton/km (road transport, mean price), we can consider following possible cost decrease :
- 40 €/ton (200 instead of 240) : competitive up to 400 km.
- 140 €/ton (100 instead of 240) : competitive up to 1400 km.
- 190 €/ton (50 instead of 240) : competitive up to 3200 km.
Conclusion for mine-recycling sites
Cumulating lowest costs for mine-recycling and lower transport costs (ship for long distances) with optimized handling could make storage in German mines economically competitive for any incinerator in Europe. But such a solution is clearly bounded to the sustainability of the mine-recycling sites, which is not yet clearly sure, for political reasons. It should nevertheless continue at least for the next 7 years, but with a narrow market, restricted to Germany and some neighbouring countries. A recent attempt of a French plant to send APC residues to such sites failed, due to political pressures, although it was possible to classify APC residues as mine-material, thus by-passing the legal restriction on long-distance and international transport of wastes.
Conclusion for underground storage sites
If the international market was opened to the transport of APC residues to deep underground landfill storage sites, it will not be competitive up to long distances, because storage costs are not significantly lower than for usual surface landfills. And transport of APC residues on long distance can be forbidden, especially in France where residues must be sent to the nearest storage site (proximity principle).

DT 00 B 017D Page 50
6. References
All.97 KM. Allal and all. Determination of the thermodynamical dato of Calcium hydroxychloride. Revue de l'institut Français du plastique Vol 52-N°3 mai juin.
Apm96 APME, Plastics consumption and recovery in Western Europe, 1996.
Ber99 Bertin Technology study on MSW and Incineration of PVC. Chaudron Valéry, Bernard Jacquinot, De Vaugiraud Patrick (Bertin Tarnos), Hjelmar Ole (VKI-Water Quality Institute), Vehlow Jürgen (FZK)
Ber99D Same report, Version D (July.1999).
Ber99E Same report, Version E/F (Feb.2000).
Blo95 Antoine Blouet Décision Environnement n°35 – Avril 1995 Dossier déchets “Usine d’incinération d’ordures ménagères”
Bon99 Laurent Bontoux. The incineration of waste in Europe : issues and perspectives. Institute for prospective technological studies, Seville. EUR 18717 EN. March 1999.
Bor94 Born, J.G.P. : Quantities and Qualities of Municipal Waste Incinerator Residues in the Netherlands, pp. 811-820 in Goumans, J.J.J.M., H.A. van der Sloot and Th.G. Aalbers (eds.): Environmental aspects of construction with waste materials. Studies in Environmental Science 60, Elsevier Science B.V. Amsterdam, 1994.
Buh98 R. Bühl, PVC Heat Stabilisers uses and HSE aspects, Technical Information Meeting PVC, Brussels, 28 January 1998. (see also Ecv98)
Depa98 The Danish Environmental Protection Agency, Lead : use, problems and further efforts; Environmental project n°377, 1998, table 4.13 : "Sources of lead in MSW for incineration, stabilisers in PVC :6 %"
Dpu97 Versatzhandbuch Studie zum bergbaulichen Versatz von Rauchgasreinigungsrückständen aus Abfallverbrennungsanlagen. Deutsche Projekt Union GmbH, Essen + Südwestdeutsche Salzwerke AG, Heilbronn, 1997.
Eew97 European Energy from Waste Coalition, Energy from Waste Plants: Databook of European Sites, Report prepared by Juniper Consultancy Services Ltd, November 1997.
Ecv98 European Industry Position Paper on PVC and Stabilisers. ECVM / ELSA (European Lead Stabilisers Association) + ORTEP (Organotin Environmental Programme Association) (21 pages)
Eur97 Eurostat, Environment Statistics 1996, Theme 8 Series A, Statistical Office of the European Communities, Luxembourg, 1997.
Fly97 Flyvbjerg, J. & O. Hjelmar (1997): APC residues from municipal solid waste incinerators 3. Survey of the possibilities of recovery, treatment, utilization and disposal. Arbejdsrapport fra Miljøstyrelsen nr. 92. The Danish Environmental Protection Agency, Copenhagen, Denmarkl (in Danish, English summary).
Fzk97 See Veh97d (Thermal Treatment of Waste in Europe, L’Aquila, 7-10 July 1997).
Gro92 J.L.B. Groot, L.P. Rijpkema, The influence of Plastics on the combustion of Municipal Solid Waste, TNO-report n°92-903 for APME, 1992.
Gro93 J.L.B. Groot, Separate sorting experiments of the Plastic fraction of Municipal Solid Waste, TNO-report n°4148/93 for RIVM/LAE, Delft, 1993.
Hje92 O. Hjelmar, Residues from acid flue gas cleaning at MSWIs : Experimental work. Environmental report n°193. Danish Environmental Protection Agency.
Hje93 O. Hjelmar, Leaching of fly ash from MSWIs. Report prepared for the Danish Environmental Protection Agency. VKI, Horsholm, Denmark.
Isw97 ISWA Working Group on Thermal Treatment of Waste, Energy from Waste State-of-the Art

DT 00 B 017D Page 51
Reports: Statistics 1993-1996, International Solid Waste Association (ISWA),Copenhagen, DK, 1997
Jhn92 Bernt Johnke (Umweltbundesamt), “Waste incineration – an important element of the integrated waste management system in Germany”. Waste management and research (192), 10, 303-315.
Joz95 Woyciech Jozewicz - In. Eng. Chem. Res. 1995, 34, 607-612
Lem92 Dr. Leman, M. Abfalltecnik, Vorlesungsmanuscript, Dübendorf 1992 (quoted by [TnK94]).
Mar95 F.E. Mark, Energy Recovery Through Co-Combustion of Mixed Plastics Waste and Municipal Solid Waste, Polymer Recycling, Vol. 1, No. 2, 1995.
Mar95b F.E. Mark, The role of Plastics in Municipal Solid Waste Combustion, PWMI, 1995
Mar95c F.E. Mark, Energy Recovery- Analysis of Plastics in Municipal Solid Waste, Association of Plastics Manufacturers in Europe, Feb 1995.
Mer99 Mersiowski, I. Stegmann, R. Ejlertsson, J. Svensson B. (1999). Long-term behaviour of PVC products under soil-buried and landfill conditions, Technical Universitys of Hamburg-Harburg, Germany; Linköping University, Sweden, p. 238.
Min97 Ministry of Housing Spatial Planning and Environment, Position paper of the Netherlands of PVC, 1997, p9.
Nie96 H. Nieuwenhuijsen, The composition of PVC in municipal solid waste, Publication PVC Informatiecentrum, Leidschendam, Juni 1996.
Oec97 OECD Environmental Data , Compendium 1997
Oko98 Dossier Bergversatz : Hintergrunddossier. Die zweifelhaften Erfolge der Verwertung in Deutschland Beispiel: Abfälle als Bergversatz. Öko-Institut. http:/www.oeko.de/deutsch/umwelt/dosberg.htm. 14.01.1998.
Oko99 Entsorgung in der Unterwelt. Öko-Institut e.V.warnt vor Sondermüll-Entsorgung in stillgelegten Bergwerken. http:/www.oeko.de/deutsch/presse/preberg.htm. 17/12/1999.
[Ablagerung auf Sondermülldeponien oder die Verbrennung in Spezialöfen zwischen 450 und 900 DM pro Tonne verlange, im Bergwerk nur zwischen 100 un 300 DM.]
Pol96 Les ordures ménagères en France - Données de Référence : rapport final étude Modecom ADEME. POLDEN Insavalor, Pascale Naquin, Laurence Volatier, Emmanuel Vernus, Mars 1996.
This paper gives up to 2.2% PVC in dry waste (without recycling of plastic bottles): 1,5% for bottles and packages, 0,4% for other packages, 0,3% for other PVC compounds. These figures seem not reliable.
Ras95 H.V. Rasmussen, Affaldsforbraeding i forbindelse med PVC-afalen, Arbejdsrapport fra Miljostyrelsen, N. 39, Miljostyrelsen, Copenhagen, 1995.
Rei89 Dieter O.Reimann. Heavy Metals in domestic refuse and their distribution in incinerator residues. Waste Management & Research -1989, v.7,57-62.
Rei91 D.O. Reimann, Extra flue gas-related costs in residual waste incineration attribuable to PVC, Müll und Abfall, 1991.
Rij93 L.P.Rijpkema, Survey of Municipal Solid Waste Combustion in Europe, TNO Institute of Environmental and Energy Technology, Report Nº92-304, August 1993.
Rij99 L.P.Rijpkema, PVC and municipal solid waste combustion : Burden or benefit ? TNO Institute of Environmental and Energy Technology, Report TNO-MEP - R 99/462, December 1999.
Sch94 J.Schneider, J.Vehlow, H.Vogg (FZK). Improving the MSWI bottom Ash Quality by simple in-plant measures. Environmental aspects of construction with waste material, proceeding from. Int. Conf. on Environmental implications of construction materials and technology developments, Masstricht, Ther Netherlands, 1-3 June 1994, pp. 605-620.
Spi00 Data sent by Mr.Reil Eberhard, 24/2/00 [email protected], Wien-Spittelau plant. Spittelau web site : [email protected], web adress : [email protected].
Sto99 StocaMine. Courrier du 4 novembre 1999. "StocaMine est le premier site de stockage souterrain en France. Ce stockage est réversible. Pour ce faire, StocaMine provisionne un montant à la tonne stockée de manière à constituer un fond permettant d'assurer le déstockage et le retraitement éventuel des déchets. Cette somme est incluse dans les prix qui sont remis à nos clients. StocaMine devient dès lors responsable des déchets se trouvant dans ses blocs de stockage". Notre prix de stockage pour les REFIOM est de 1300 F H.T. la tonne".

DT 00 B 017D Page 52
Sud00 Newspaper article. Sud Ouest “Dangereux trafic- des déchets ultimes exportés vers l’Allemagne – Déchets toxiques à vendre”. Mercredi 15 mars 2000. Pages 1 et 2.
Sud00b Newspaper article. Sud Ouest “Déchets ultimes- Ils resteront en France, Pierre Verdet. Samedi 25 mars 2000. (see annexe E)
Sud00c Newspaper article.“ Reconversion du bassin de Lacq. Soucis en sous-sol. Poubelle ou décharge maline ? « L’étanchéité est garantie ». Sud-Ouest, Vendredi 31 mars 2000, pages 1 et 6. D.B.-S. «L’injection d’effluents pollués dans le sous-sol de Lacq, pratiquée depuis 1978, est-elle dangereuse ? Ce procédé est jugé utile pour a chimie fine autour de laquelle s’organise la reconversion du site. Dominique Voynet pourrait y mettre un terme. Inquiétude des élus et industriels.»
ThK94 Thomé-Kozmiensky. Thermische Abfallbehandlung, EF-Verlag für Energie und Umbwelttechnik GMBH. Berlin 1994.
Tno96 Specific processing costs of waste materials in a municipal solid waste combustion facility, TNO Report, L. P. Rijpkema, Institute of Environmental Sciences, Energy Research and Process Innovation, 07/11/96 TNO-MEP - R 96/248 appendix C. (table from Nieuwenhuysen.) (includes a table of elemental composition of Municipal Solid Waste)
Tno96b TNO report TNO-MEP-T99/... Appendix A, draft report version 6, issued 1996. includes data from Krajenbrink 1996.
Tno99 See [Rij99] or [Tno96b]
UEV00 Documentation sent by UEV-Umwelt, Entsorgung und Verwertung GmbH, March 2000. • Preise fûr die abfalleinlagerung Untertagedeponie Heilbronn • Liste der Abfälle, nach EAK sortiert, die gem. dem Planfeststellungsbeschluss vom 11. August 1998, AZ 8983-04.41-2/4
für die Untertagedeponie Heilbronn zugelassen sind. • Analysenparameter für Antragsanalyse (Mindestumfang) • Annahmebedingungen für abfälle “Untertagedeponie Heilbronn” (2 pages) • Annahmebedingungen für Versatzstoffe “Versatzbergwerk Kochendorf” (1 page) • The Heilbronn repositories – an example for safe underground waste disposal (6 pages, article frm Dr.Gerd
P.Bohnenberger, Südwestdeutsche Salzwerke AG, Salzgrund 67, 74076 Heilbronn)
Van99 Van der Sloot, H.A.: Personal communication, ECN, Petten, The Netherlands, 1999.
Veh95 Vehlow J., (FZK). State of the art in Emissions Control and Residue Quality : a rational Point of view. European Conf. On the Future of European Thermal Waste Treatment, Paris Sept. 7-8, 1995 (19 pages).
Veh97a Vehlow J., (FZK). Waste combustion and the dioxin issue. KIST Europe Environmental Technology Workshop, Saarbrücken, Feb13-14,1997.
Veh97b Vehlow J. (FZK). Modern strategies in waste incineration. UTA International, 1/97.
Veh97c Vehlow J.,, (FZK). Behandlung der Rückstände thermischer Verfahren. Manusskript für Die Österreichische Abfallwirtschaft – Hohe Ziele, hohe Kosten? Österreichische Abfallwirtschaftstagung 1997. Schriftenreihe des Österreichischen Wasser- und Abfallwirtschaverbandes, Heft 111, S. 69-85, 1997.
Veh97d J. Vehlow, Forschungszentrum Karlsruhe (FZK), Thermal Treatment of Waste in Europe - Regulatory Framework and Implemented Technology. FZK Technik und Umwelt, Institut für Technische Chemie, Bereich Thermische Abfallbehandlung. 1st Nat. Cong. "Valorization and Recycling of Industrial Wastes", L’Aquila, 7-10 July 1997.
Veh99 J. Vehlow, Results from Würzburg Incinerator, Personal Communication, 1998/1999.
Vra99 Vrancken, K.: Personal communication, Vito, Mol, Belgium, 1999.

DT 00 B 017D Page A - 1
ANNEXE A
Miscellaneous data on MSW incineration and ultimate waste storage
France Austria Spain

DT 00 B 017D Page A - 2
Ultimate Waste Data for France (1998) CSDU : Centres de Stockage de Déchets Ultimes (Ultimate Waste Disposal centre)
REFIOM : Résidus d'Epuration des Fumées de l'Incinération d'Ordures Ménagères (APC from MSWI)
Waste France Imports Total Hazardous Industrial Waste 802 576 562 803 138 • Stabilised part 432 746 562 359 301 • APC (REFIOM) 261 454 261 454 Sewage Sludge 3428 3 428 Common Industrial Waste 87 975 87 975 Inert Waste 23 734 23 764 Municipal Wastes 104 790 104 790
TOTAL 1 022 503 562 1 023 095
These values don't take into account additives such as binders used for stabilisation.
For hazardous Industrial Waste, binders represent 20% added mass to total waste.
For the part which is stabilised, binders represent 80% added mass. For the total of hazardous Industrial Waste, they represent 20% added mass.
Classification of CET ("Centres d'enfouissement technique")
• CET de classe I : destiné à recevoir les déchets industriels spéciaux ultimes, il doit être implanté sur un site imperméable (perméabilité < 10-9 m/s sur une épaisseur de 5 m)
• CET de classe II : destiné à recevoir les ordures ménagères et les déchets assimilés, il est situé sur un site semi-imperméable, (perméabilité < 10-9 m/s sur 3 m ou < 10-9 m/s sur 1 m et 10-6 sur 5 m)
• CET de classe III : destiné à recevoir les déchets inertes, il peut être implanté sur un site perméable
Some regulation aspects
• Arrêtés du 18/02/92 : Stockage de certains déchets industriels spéciaux ultimes et stabilisés. Installations existantes J.O. du 16 avril 1993, installations nouvelles J.O. du 30 mars 1993
• Arrêté du 18/02/94 :Modification de l'arrêté du 18 décembre 1992 relatif au stockage de certains déchets industriels spéciaux ultimes et stabilisés pour des installations existantes J.O. du 26 avril 1994
According to these acts, stabilisation is compulsory for hazardous industrial wastes, Waste of category A (REFIOM/APC, powdered waste from metallurgy, mineral wastes from chemical treatment), and category B.
• Loi du 13/07/92
Each French region must have a Class I site for ultimate waste disposal before 2002.
After 2002, ultimate wastes which cannot be valorised (≈ recycled) or treated will be the only ones which can be stored.

DT 00 B 017D Page A - 3
Ultimate Waste Disposal Centres in France (1999)
CSDU : Centres de Stockage de Déchets Ultimes (Ultimate Waste Disposal center) ("Class 1" disposal site)
13 CSDU are now open in France (see map) (11 of which were already opened in 1996).
• Argence (calvados) CGEA-ONYX 02.31.73.04.50 • Bellegarde (Gard) France-Déchets 01 42 91 66 66 • Champteusse sur Baconne (Maine et Loire) SEDA (France-Déchets) • Changé Laval Service (ou Séché?) • Guitrancourt (Yvelines) EMTA 01.34.97.25.65 • Jeandelaincourt(54) France-Déchets • Laimont (Meuse) DECTRA 03.26.04.82.62 • Pontailler sur Saöne (Cöte d'or) France-Déchets • Saint-Cyr des Gâts (Vendée) TOP Ouest • Tourville la Rivière (Seine Maritime) SERAF (France-Déchets) • Vaivre (Doubs) ECOSPACE 03.80.72.91.11 • Villeparisis (Seine et Marne) France-Déchets • Wittelsheim-Mine Joseph Else (68). StocaMine (EMC + TREDI + MDPA) 03.89.57.84.00
A project for a new site in region "Rhône-Alpes" (Marboz(01) or Sury Le Comtal(42)) was presented in October 1998. Sources :
• Data from ADEME Angers, fax from Katia Becaud, Département Industrie, Milieux et Technologies, 02 41 91 40 58 Fax 02 41 91 40 02, Stockage de classe I, 8 dec.1999.
• Updated map given by ADEME Angers, fax from Christian Militon, tel 02 41 20 41 22.
• List given by Bertin documentation department, and updated according to data from France Déchets and ADEME
.

DT 00 B 017D Page A - 4
Miscellaneous answers from companies managing ultimate
wastes for storage in CET Class 1 in France 1) France Déchet - 01 42 91 66 66 – map of French site sent by Internet. No answer to price
questions (answer yet expected).
2) SocaMine : see preceeding report (1300 F/t). No answer to last mail on legal problems, but some answers by phone, only on technical questions (answer probably delayed by legal departments of mother companies)
3) CGEA-Onyx, Argences (14) - 02.31.73.04.50, CET 02.31.23.92.68. All residues have to respect criteria given by “Arrêté du 18 décembre 1992”, such as soluble fraction < 10%. Usual parameters concern leachability (levels of Pb, Ni, Cd, As, Hg, DCO, soluble fraction, pH…). No usual problems for acceptation of APC residues. Wastes must come from nearest CET1 in France, excepted with special authorization, in case of unavailability of another CET. Effect of ratio of stabilisation agent? No such parameter, but preliminary analysis is compulsory, before acceptation or before any price estimation. Need for stabilisation depends on APC type :
Wet Filter cake : can almost be accepted without treatment ESP Filter ash : powdered form (stabilisation required anyway for powders) lime APC residues high soluble fraction
Price dependant on salt quantities ? not really. Depends first whether stabilisation is required or not. Also whether it is delivered in bulk or big bag (higher price).
No stabilisation (pure storage) : 1000 to 1200 F/t (152 €/t to 183 €/t) With stabilisation : 1500 to 1700 F/t (229 to 259 €/t) (42 to 51% higher) Added tax (taxe sur les activités polluantes : 120 F/t (18 €/t extra cost)
4) Dectra, Laimont (55)- 03.26.04.82.62 answer yet expected
5) Ecospace, Vaivre (70) - 03.80.72.91.11 - answer yet expected
6) EMTA, Guitrancourt (78) -- 01.34.97.25.65 take wastes only after stabilisation, done by another company (SERP Industrie, 01 34 97 25 00).
Price without stabilisation 600 à 700 F/t 92 à 107 €/t (special tax and TVA not included).
7) SERP Industries, 01 34 97 25 10. The cost depends on nature (lower for sludge, higher for pasty or powered products) Acceptation criteria are such as organic matter <2500 mg/l, phenol < 50 mg/l. No parameter concerning salt content, neither ratio of stabilisation agent. This is included in
package price of 1480 F for APC (226 €/t), lower price for sludge being 1080F/t. An additional tax is 120 F/t (taxe sur les activités polluantes)
Without stabilisation : 720 à 820 F/t 110 à 125 €/t With stabilisation : 1600 F/t 244 € /t

DT 00 B 017D Page A - 5
Transport of wastes in France
Miscellaneous data
Wastes in France (1998) 883 Millions tons per year
29.5 Mt MSW (déchets ménagers et assimilés) (434 kg/hab) 22.5 Mt City Wastes (déchets des collectivités locales) (ex Sewage treatment sludges) 50.0 Mt Common Industrial Wastes (déchets industriels banals, DIB) 7.0 Mt Hazardous Industrial Wastes (déchets industriels spéciaux, DIS) 420.0 Mt Agriculture and Food Industry Wastes 0.7 Mt Hospital Wastes 354.3 Mt Builder’s yard wastes
Source : L’Officiel des transporteurs n°2013 – 9 janvier 1999.
Transport costs for Wastes OM (raw MSW), distance 50 km : 15F/m3 1 F/t-km (0.15 €/t-km)
DIS (Special Industrial Wastes): 120 - 735 F/t (1998) or 150 - 900 F/t (1999) (7 to 42% of elimination costs) 0.86 to 4.6 F/t-km (0.13 to 0.70 €/t-km), average distance 195 km
DIB (Common Industrial Wastes): 250 F/t (50% of elimination costs) 3 F/t-km (0.46 €/t-km), average distance 80 km
Source : Quels coûts pour les déchets? L’Officiel des transporteurs n°2013 – 9 janvier 1999.
Transport of waste from Angoulème to Germany (1000 km) [Sud00] : 400 – 1300 F/t (61 €/t to 200 €/t, ie. 0.06 €/t-km to 0.2 €/t-km).
Average road price : 1F/t-km (0.15 €/t-km). Lower cost 0.40 F (0.06 €)/t-km ? - Possible with large amounts and long distances [Christian Riper, ADEME, 04 93 95 79 73].
Collection cost (for comparison) Average 360 F/t Range 200 – 400 F/t (simple collection) 350 – 400 F/t (selective collection by the people) 550 – 700 F/t (organised direct selective collection) Additional transport 40 – 60 F/t Average total 500 F/t
Source : Environnement & Technique, janvier 2000 n°193
Transport of Wastes Transport of waste : 0.85% by boat
Ecorail : subsidiary of French Railways (SNCF/CTT Sceta), created in 1997 for doing transport of Domestic and Industrial Wastes, in mixed rail/road form. 50MF annual turnover, expected to increase to 200 MF by 2002. For REFIOM transport, contact Mr.Vincent Combrouze, 01 44 85 86 75, secr. 01 44 85 86 87 (doesn’t want to give any estimation : SNCF is not known to be particularly « transparent » on the question of prices).
Source : L’alternative à la route, La réplique d’Ecorail. L’Officiel des transporteurs n°2013 – 9 janvier 1999 + phone contact.

DT 00 B 017D Page A - 6
Bibliography : Book written by Mr. Christian Riper (ADEME Valbonne Sophia Antipolis) on transport of waste in France (“Guide sur la gestion des déchets ménagers et assimilés : transport et logistique” 150 pages. Editions ADEME Angers. Référence 3010, Prix 250F).
Average distances for wastes according to way of transportation
Road : 36 km
Rivers : 87 km
Railways : 310 km (average distance for scrap iron : 400 km)
Source : Transports Actualités n°652, 29 mai1998.
Fluvial Transport According to VNF (Voies Navigables de France), (M. Philippe MAUGE, Région Ile de France 01 40 58 27 40) : Tranport costs are from 0,10 to 0,20 F /tonne-km (0.015 to 0.03 €/ton-km) for short distance. For long distance, say 1000 km on a 250 t barge, it will be the lowest price 0,10 F/tonne-km. It depends on handling cost, which are lower for bulk transport (which is current for bottom ash) (“faible délai de planche”), and higher for big bags (transport costs include immobilisation costs). Organisation of this transport must be regular and well organized to be cheeper. Bulk transport for APC residue is possible with special barge for powered products (i.e. fluidized bed barge for cement or smelting slag). (Loading time reduced to 200 –300 tonnes/h)
Barge 250 tonnes for usual transport in France Barge 500 tonnes for transport to Germany : possible by the Northern canal way.
Legislation Proximity principle restricting long distance transport of wastes.
If destinated to mine re-utilization in Germany, APC residues could be classified as mine materials and get round the proximity principle [Sud00]. But such recent authorization was recently cancelled [Sud00b], after strong reaction of competitors, green movements and press.

DT 00 B 017D Page A - 7
Price data for transport of wastes in Europe
Kobenhavn (Denmark) -> Frankfurt (850 km) : (1 € = 1.96 DM) • 2100 – 2350 DM for a 24.5 ton truck : 0.052 – 0.058 €/t-km (oral answer from a German
company).
• 6000 DM for 50 tonnes by truck : 0.072 €/t-km (+85 DM per hour wait) (Internationale Spedition KRUG)
• 5500 DM per wagons (for 50 ton in 1 or 4 wagons) : 0.066 €/t-km (or x 4 ? not clear) (in big bags, Schenker-BTL, Abtl Railcargo, Heidelberg)
Birmingham (UK) -> Frankfurt (850 km) : (1 € = 0,61 £) (by Road + train or ferry)
• 750 £ for a 23 t truck : 0.063 €/t-km (European, Dover)
• 850 £ for a 25 t (13.6m long) truck : 0.066 €/t-km (Churchill Freight, London)
• 2600 £ for ≈ 20 t containers (Carrols Transport, Hounslow)
• 1400 £ per truck (Chiltern Air Freight Ltd, Slough)
• 2000 £ per container (J.C.A. UK, London)
• 1 £/kg in container 80 m3 (Eagle, London)
• 3000 £ for 50 t (0.116 €/t-km) (Worldwide International, London)
• 2950 £ for 50 t in 2 trucks (0.113 €/t-km) (Fleet Shipping International, London)
• 485 £/kg for 10 t , 2450 £ for 50 t (0.095 €/t-km) (Davies Turner&Co, Kent)
Overall range : 0.06 - 0.12 €/t-km
Madrid (Spain) -> Frankfurt (1500 km) : (1 € = 166 pstas) • train : at least 6 wagons no answer yet (RENFE)
• 470 000 pstas in 2 trucks, for 50 t (0.038 €/t-km) (Transfesa) no transport in tank trucks (bulk form)
Overall ranges for the 3 cases : 0.04 - 0.12 €/t-km

DT 00 B 017D Page A - 8
MSW in France (1998 data) Other data for comparison
MSW incineration in France in 1998 Juniper97 OECD95
ISWA 96
Capacity range <48 k/yrt 48 à 80kt/yr > 80 kt/yr total > 30 kt/yr
corr. > 10 kt/yr
MSWI number 186 24 38 248 79 77 297 95MSW amounts (kt/yr) 2500 1300 7000 10800 10360Overall capacity (kt/yr)
10771 10830 11408 9542
MSW incinerated in France Ratio to MSW incinerated
Annual Mass incinerated
bottom ash APC including fly
ash
total BA+APC
Bottom ash APC ratio total BA+APC
débit déchets mâchefers REFIOM sous-produits
mâchefers REFIOM sous-produits
tons/an tons/an tons/an tons/an kg/tons kg/tons kg/tons 10 800 000 2 926 000 254 500 3 180 500 270,9 23,6 294,5
Residues per category tons (1998) Total déchets incinérés
MSWI 10 800 000
mâchefers bottom ash 2 735 000 ferraille Scrap iron 175 000 REFIOM APC 249 000 cendres seules Fly Ash alone 5 500 autres Others 16 000 total sous-produits 3 180 500 Main part of fly ash is included in APC, but some fly ash can also be included in bottom ash (bottom ash and fly ash can be mixed in small units) Source : ADEME Février 2000 (Jean-Louis Bergey)
Ultimate Waste Data for France (1998) Stockage des déchets en CSDU : les tonnages 1998
Waste France Imports Total Dangerous Industrial Waste 802 576 562 803 138 · Stabilised part 432 746 562 359 301 · APC (REFIOM) 261 454 261 454 (equivalent to above
figure) Sewage Sludge 3428 3 428 Common Industrial Waste 87 975 87 975 Inert Waste 23 734 23 764 Municipal Waste 104 790 104 790 TOTAL 1 022 503 562 1 023 095 These values don't take into account additives such as binders used for stabilisation. ♦ For dangerous Industrial Waste, binders represent 20% added mass to total waste. ♦ For the part which is stabilised, binders represent 80% added mass. ♦ For the total of dangerous Industrial Wastes, they represent 20% added mass. Source : ADEME Décember 1999 (Katia Becaud) (original table in ..\France\MSWFrance.xls)

DT 00 B 017D Page A - 9
Example of a French MSWI (UIOM) equipped with a wet system
Caractéristiques générales
Overall caracteristics
Capacité
capacity 6 t/h
Tonnage annuel
Amount 45000 t/yr
Traitement de fumées (GTS)
humide avec lavage des cendres (wet scrubbing + ash washing)
Residus Residues Ratio to MSW
incin. 1) mâchefers Bottom ash - 2) Cendres sous refroidisseur Fly Ash 255 t/yr A 5,7 kg/t
(humidité 2 à 2,5%) 3) REFIOM lavés (CV+boues de
STEP) filter cake+ thick sludge 583 t/yr C 13,0 kg/t
humidité humidity 30 à 35 % D 4,2 kg/t 4) Liquide liquid effluent 4 m3/h
concentration Chlore Cl concentration 30 g/l concentration sel (total) Salt conc.(total) 32 g/l B 19,8 kg/t
Bilan des résidus de traitement de fumées
Total solid APC residues (humid) sent to CET (Class I) A+C 18,6 kg/t Total APC residues, dry, including salt in liquid effluents A+C+B-D 34,2 kg/t
Source : Benesse-Marenne, personnal communication Price estimation for residue disposal
CET (Class 1) disposal center
(N/B) 1600 FHT/t 244 Euro/t
Transport (700 km)
260 FHT/t 14% 40 Euro/t
Total (VAT non included) per mass of residues 1860 FHT/t 284 Euro/t Total per mass of MSW incinerated
5,3 Euro/t
1 Euro = 6.55957 FF
(N/B) Nîmes/Bellegarde ( France Déchets)
NB. Owing their high quality, residues could be put in Class II landfill (lower disposal price) (original table in ..\France\MSWFrance.xls)

DT 00 B 017D Page A - 10
Austria Data Wien - Spittelau
Overall caracteristics Nominal capacity (for 2 lines) 36 t/h Annual nominal capacity 250 000 t/yr Annual Amount (1999) 263 625 t/yr GTS : ESP + Wet scrubber + DeNOx by SCR (see figure) Year built 1971 Flue gas scrubber 1986 DeNOx (SCR) 1989 Energy recovery type CHP Electricity 6 MWe Heat 60 MWth Consumptions, per tonne MSW Freshwater 731 kg/t Soda lye 2,8 kg/t Lime 3,6 kg/t Ammonia 3,1 kg/t Gas 17,6 Nm3/t chemicals 0,17 kg/t Active carbon unknown kg/t Residues Mass ratio to incinerated
MSW Slag 225,9 kg/t Gypsum 1,7 kg/t Ferrous scrap 24,5 kg/t Filter ash 18,9 kg/t Filter cake 1,1 kg/t Cleaned waste water 440,0 kg/t Total APC residues 21,7 kg/t Total solid residues 272,1 kg/t Part going to German Mines (by rail in big bags) (*) 1,1 kg/t Part used in a "slag-filter ash concrete" 271,0 kg/t
(*) current cost 490 Euro/t Wien - Flötzersteig
Annual nominal capacity (3 lines) 200 000 t/yr Same operator (Fernwärme Wien), opened in 1963 and same residue management
Wels and Lenzing
Other operator. Wels rebuilt in 1995 Annual nominal capacity Wels 60 000 t/yr no precise data on residue management Lenzing : not given in Juniper97 study, under construction in Juniper95
RECAP
Number of units over 30 t/h (Juniper 97) 3 Overall capacity for units over 30 t/h 510 kt/yr Estimated amounts going to German Mines 561 t/yr Sources from data sent by Mr.Reil Eberhard, 24/2/00 [email protected] Spittelau web site : [email protected] Spittelau web adress : [email protected] Municipal Solid Waste incineration in Europe, Juniper Consultancy Service, 1995 Energy from Waste Plants. Databook of European Sites, Juniper Consultancy Service, 1997 Estimated amounts asked by ASA for export to Kochendorf 7000 t in 1998 (March 1998) (Z.I.99/07/0116-8)
(original table in MSWdat.xls/Austria)

DT 00 B 017D Page A - 11
Spittelau Thermal Waste Treatment Plant : Specific mass flow 1997
..\austria\Spittelau_Massenströme1997_engl.ppt (répertoire austria) Spittelau_Massenströme1997_engl.ppt(même répertoire)

DT 00 B 017D Page A - 12
Municipal Wastes and incineration in Spain Annual Production
Total 15000000 tons/an
incinerated 1140000 tons/an (Juniper1997= 1072 kt
Waste final destination
destination
%mass tons/an
recycling 2,94% 441000 uncontrolled landfills 11,76% 1764000 controlled landfills 62,18% 9327000 compost 15,68% 2352000 incinerated 7,45% 1117500
Total 100,01% 15000000
Mean Content (composition moyenne) 44% Matières organiques Organic Matter
21,20% Papier Papers 10,60% Plastiques Plastics
7% verre glass 3,40% métaux ferriques ferrous metals 0,70% métaux non ferriques non-ferrous metals
1% bois wood 12,10% Autres Others
100% Total Total
1998 Data on Municipal Waste incineration in Spain (7 MWI units) MSWI Location
(Region) Availability Annual Mass
incinerated bottom ash APC
UIOM Région Disponibilité débit déchets mâchefers REFIOM % tons/an tons/an tons/an
Madrid 90,0% 268830 27500 13500Mallorca : Palma 2 Palma de M. 91,3% 300000 81000 (*) 15000Sant Adria de Besos Barcelona 85,0% 240000 63500 7250Melilla North Africa 93,2% 35000 9000 900Tarragona Cataluna 85,0% 145000 36000 3300Mataró Cataluna no data Girona Cataluna no data Total 988830 217000 39950 Percentage of mass incinerated 100% 21,9% 4,8 - 6,1%
(*) APC mean value of the range 9000-21000 given for Palma2 MSWI Projets La Coruña Galicia Bilbao Euskadi Main flue gas treatment systems Semi-dry process for 2 units, no data for others Residues destination Bottom ash --> roads, filling material APC, fly ash --> landfills (after possible stabilisation, handling in big bags) Possible landfill in salt mines ? discussed within the frame of Bilbao MSWI project MSW Policy ♦ No development of incineration ♦ Better landfill control ♦ Priority to recycling ? Main sources for these data : Proceeding of "Conferencia International Sobre Residuos y Energia", Madrid, Escuela Technica Superior de Mecanica,
October 27 and 28, 1999. Club español de lo residuos. (given by JCM, phone Feb.00)

DT 00 B 017D Page A - 13

DT 00 B 017D Page A - 14
MSW in Spain : Comparison of recent data to Juniper 1997 1998 Data on Municipal Waste incineration in Spain (7 MWI units) Ratios calculated from 1998
data Juniper 1997 data
MSWI Location (Region)
Availability Annual Mass
incinerated
bottom ash APC MSWI Bottom ash APC ratio Opened Nominal Capacity
lines GTS
UIOM Région Disponibilité débit déchets mâchefers REFIOM mâchefers REFIOM tons/yr % tons/an tons/an tons/an kg/tons kg/tons tons/an
Madrid 90,0% 268 830 27 500 13 500 Madrid 102 50 1994 200 000 3 semi-dry Mallorca : Palma 2
Palma de M.
91,3% 300 000 81 000 15 000 (*) Palma 2 270 50 1995 315 000 2 semi-dry
Sant Adria de Besos
Barcelona 85,0% 240 000 63 500 7 250 Sant Adria de Besos
265 30 1975 380 000 3 ESP
Melilla North Africa 93,2% 35 000 9 000 900 Melilla 257 26 1995 37 000 1 Tarragona Cataluna 85,0% 145 000 36 000 3 300 Tarragona 248 23 1991 78 000 2 ESP Mataró Cataluna no 1998 data Mataró 1994 170 000 2 ?
Girona Cataluna no 1998 data Girona 1984 51 000 2 ESP Vigo closed ? (no recent indication) 1972 (60 000) Mondragon closed in 1999 ? (*) 1980 (48 000) Jaen, Vielhy closed ? (no recent indication) 1993,..
Totals 988 830 217 000 39 950 219 40 1 231 000 Percentage of mass incinerated 100% 21,9% 4,8 - 6,1% (*) "planned to close" in Juniper 1995 study (*) APC mean value of the range 9000-21000 given for Palma2 Total including Mataró and Girona, assuming Jun1997 data for these plants Total including Mondragon, without Melilla
7 plants 1 209 830 t/year Total 1995 7 plants 1 242 000 t/year

DT 00 B 017D Page B - 1
ANNEXE B
Amounts of residues in neutralisation step

DT 00 B 017D Page B - 2
Neutralization of HCl by lime
Chemical mechanisms
• Reactions with HCl in dry and semi-dry systems :
In dry and semi dry systems, neutralisation is a two-step reaction to form CaCl2: HCl + Ca(OH)2 → CaOHCl + H2O (1) HCl + CaOHCl → CaCl2 + H2O (2)
This means that in presence of lime excess only Hydroxichloride CaOHCl is formed. Second reaction is slower than the first one (kinetics factor 1 to 7). Furthermore, it has been observed that CaCl2 and Ca(OH)2 - when mixed together - react to form Hydroxichloride CaOHCl. [Al 97], [Joz 95]. For these reasons, CaOHCl is more likely to be formed than CaCl2.
Calcium oxichloride crystallises with one mole of water forming CaOHCl, H2O.
The quantity of water associated with calcium chloride CaCl2 can vary as a function of the process employed to dry the salt as well as the corresponding temperatures :
In the case of spray drying at a temperature below 130°, CaCl2 crystallises with two moles of water forming CaCl2,2H2O
For spray drying operated above 130°C,CaCl2, H2O can also be present
For calcium chloride drying by external heat transfer CaCl2,6H2O has to be considered
In the solid salt from spraying systems, 0.5 to 2% of free water is present in the solid residue.
For the calculations presented below, we assume that the gas treatment residue is handled properly. This means that is collected in proper packages (big bags or drums) and not stored in the open in order to prevent any extra water impregnation from rain or atmospheric humidity. CaCl2 is known to be hygroscopic and used for ambient air drying. The same hygroscopic behaviour has not been reported for CaOHCl, but should exist at a lower level. In fact, hygroscopic behaviour of APC residues is not usually reported as important : that also tend to prove that the major component is CaOHCl and not CaCl2.
The general reaction Ca(OH)2 +2HCl → CaCl2,2H2O is commonly referred to in the literature and is used as the reference. For a given stoechiometric ratio, the type of product (CaCl2 , CaOHCl) does not affect the of neutralization agent because the stoechiometry is related to the CaCl2 reaction. It neither affect the quantities of solids recovered after the neutralisation, because the water content per chlorine is the same in CaCl2, 2H2O and CaOHCl, H2O (see calculation of mass coefficients below)
• Reactions with HCl in wet processes
In the presence of liquid, removal of HCl from the Raw Gas does not require neutralisation : HCl is soluble enough to be absorbed in the liquid forming an acid solution :
HClgas → (HCl)solution → H+ + Cl-
In some German Incinerators, HCl is recovered as a solution to be valorised. This of course

DT 00 B 017D Page B - 3
drastically limits the quantities of the residues attributable to PVC (only 5 plants are equipped with this process).
In other processes, HCl is mainly neutralised by lime ; its absorption occurs mainly in the first scrubber and its neutralisation ends up in the water treatment.
• Reactions with HCl in semiwet-wet processes
The same process are exploited in the semi wet - wet process : HCl is neutralised in the wet scrubber as in the wet process, then the liquid is sprayed into the gas stream.
CaCl2 present in the liquid is converted into dry CaCl2,2H2O. Possible treatment of the liquid can be carried out prior its evaporation.

DT 00 B 017D Page B - 4
Neutralization of HCl by lime Reactions and mass ratios
1) Stoechiometry neutralisation reactions
• assuming formation of CaCl2 Acid + Neut. Agent Salt (choride) Anhydrous case 2 HCl + Ca (OH)2 CaCl2, 2H2O CaCl2 (+2H2O) Molar mass 73 74 147 111 (+ 36)
Per kg Cl 1.028 1.042 2.07 1.563
• assuming formation of CaOHCl,H2O Acid + Neut. Agent Salt
(oxichloride) Anhydrous case
HCl + Ca (OH)2 CaOHCl,H2O CaOHCl (+H2O) Molar mass 36.5 74 110.50 92.5 (+18) Per kg Cl 1.028 2.085 3.11 2.61
Stoechiometric ratio are conventionally related to CaCl2, and thus corresponds in both cases to the same ratios of neutralisation agent to chlorine. Minimum stoechiometric ratio required for complete reaction producing oxichloride is then S.R.=2.
At stoechiometry (S.R.=1), 1 kg Chlorine produces 1.56 anhydrous CaCl2, or 2.07 kg CaCl2 salt, or 2.61 kg anhydrous oxichloride, or 3.11 kg CaOHCl, H2O.
2) With various stoechiometric ratio R Acid + Neut. Agent salt Excess N.Agent Anhydrous
case
2 HCl + R * Ca (OH)2 CaCl2, 2H2O + (R-1) Ca (OH)2 (CaCl2) Molar mass 73 R * 74 147 + (R-1) * 74 111 Per kg Cl 1.028 R * 1.042 2.07 + (R-1) * 1.042 1.563
Quantity of residue per kg Cl, for the 4 cases (4 different salts assumed to be produced) : Stochiometric Ratio CaCl2,2H2O anhydrous CaCl2 CaOHCl,2H2O anhydrous CaOHCl
R 2.07+(R-1)*1.042 1.56+(R-1)*1.042 3.11 + (R/2-1) * 2.085 2.606 + (R/2-1) * 2.085
1 2.07 1.56 Incomplete reaction Incomplete reaction 1.3 2.38 1.88 “ “ 1.5 2.59 2.08 “ “ 1.7 (assumed for semi-dry processes)
2.80 2.30 “ “
1.8 2.90 2.40 2 (assumed for dry processes)
3.11 2.61 3.11 2.61
2.2 3.32 2.81 3.32 2.81 3 4.15 3.65 4.15 3.65

DT 00 B 017D Page B - 5
Neutralization of SO2 by lime Reactions and mass ratios
Stoechiometry assuming formation of calcium sulphate CaSO4
Reaction SO2 + Ca(OH)2 + 1/2 O2 → CaSO4 + H2O
Molecular weight 64 74 16 136 18
Mass ratio kg/kg S 2 2.31 0.5 4.25 0.56
Stoechiometry assuming formation of hydrated sulphate CaSO4, 2H2O
Reaction SO2 + Ca(OH)2 + 1/2 O2 + H2O → CaSO4 , 2 H2O
Molecular weight 64 74 16 18 172
Mass ratio kg/kg S 2 2.31 0.5 0.56 5.37
Conclusion :
At stoechiometry, 1 kg Sulphur produces 4.25 kg anhydrous residue or 5.37 kg hydrated residue.

DT 00 B 017D Page B - 6
Neutralization with sodium bicarbonate
(dry processes)
Neutralisation with Sodium Bicarbonate : NaHCO3 is only used in the dry process in the form of powder. NaHCO3 is ground just before being injected to achieve a solid with high porosity and specific area.
Reactions with HCl : HCl + NaHCO3 → NaCl + CO2 + H2O
The excess of bicarbonate is transformed into carbonate : 2NaHCO3 → Na2CO3 + H2O + CO2
168 g of NaHCO3 excess lead to 106 g of carbonate Na2CO3 and this therefore reduces the quantity of residues produced.
No crystallisation water has been measured neither for NaCl nor for NaHCO3 and Na2CO3
Reactions with SOx : 2NaHCO3 + SO2 → Na2SO3 + H2O + 2CO2
2NaHCO3 + SO3 → Na2SO4 + H2O + 2CO2
Reaction with SO3 is faster that with SO2. In general the reaction is faster than with lime. The intermediate formation of NaHSO3 could exist but this compound has never been identified in the residues.
The excess of NaHCO3 is also transformed in Na2CO3. Na2SO3 is oxidised into Na2SO4 in
presence of oxygen from the gas and in the residue only Na2SO4 can be identified : Na2SO3 + ½ O2 → Na2SO4
Stoechiometry with HCl (S.R.=1)
Reaction HCl + NaHCO3 → NaCl + CO2 + H2O Molecular weight 36.5 84 58.5 44 18 Mass ratio kg/kg Cl 1.03 2.37 1.65 1.24 0.51
1 kg Cl requires at least 2.37 kg NaHCO3 and produces 1.65 kg NaCl.
Stoechiometry with SO2(S.R.=1)
Reaction SO2 + 2 NaHCO3 + ½ O2 → Na2SO4 + 2 CO2 H2O Molecular weight 64 168 16 142 88 18 Mass ratio kg/kg S 2 5.25 0.5 4.44 2.75 0.56
1 kg S requires at least 5.25 kg NaHCO3 and produces 4.44 kg Na2SO4.

DT 00 B 017D Page B - 7
Specific SR for HCl and SO2 neutralisation with Sodium Bicarbonate :
For the determination of the specific stoichiometric ratios for HCl and SO2 with NaHCO3, no satisfactory data could be identified in the literature. We thus used non-published results such as evaluations from operators of incineration plants as well as from the bicarbonate suppliers.
Due to the larger specific area of bicarbonate, the steric limitation to SO2 neutralisation is obviously lower than for lime. It is confirmed by experimental overall stoichiometric ratios which are between 1.05 to 1.5 as measured in different incineration plants.
Nevertheless the concurrence of HCl and SO2 neutralisation still exists and SO2 is likely to require more excess of bicarbonate.
A realistic evaluation for HCl specific S.R. is close to 1.05 : this can be considered as a maximum as plants already operate successfully with an overall S.R. of 1.05.
For Neutralisation of SOx, we have assumed S.R. =1.2.
Reaction with HCl with S.R.=1.05
Reaction HCl + 1.05 NaHCO3 → NaCl + 1.025 CO2+ 1.025 H2O + 0.025 Na2CO3
Molecular weight 36.5 1.05 * 84 58.5 1.025 * 44 1.025 * 18 0.025 * 106 Mass ratio kg/kg Cl 1.0
3 2.48 1.65 1.27 0.52 0.07
1 kg Cl requires 2.48 kg NaHCO3 and produces 1.65 kg NaCl and 0.07 kg Na2CO3.
Reaction with SO2 with S.R.=1.2
Reaction SO2 + 2.4 NaHCO3 + ½ O2 → Na2SO4 + 2.2 CO2 + 1.2 H2O + 0.2 Na2CO3 Molecular weight 64 2.4 * 84 16 142 2.2 *44 1.2 * 18 0.2 * 106 Mass ratio kg/kg S 2 6.3 0.5 4.44 3.03 0.67 0.66
1 kg S requires 6.30kg NaHCO3 and produces 4.44 kg Na2SO4 and 0.66 kg Na2CO3.

DT 00 B 017D Page C - 1
ANNEXE C
Energy recovery from Municipal Waste, and share of PVC
(Not contractual rough estimation)

DT 00 B 017D Page C - 2
Energy recovery from Municipal Waste, and effet of PVC incineration
Juniper 1997 data Total energy recovered 43000 GWh/year Thermal 73% 31390 GWh/year Electricity 27% 11610 GWh/year Installed capacity 7000 MW Number of active sites > 30 kt/year 275 Waste capacity 47 Mt/year
Derived results
Energy per kg MSW 1kWh= 3600 kJ A 3294 kJ/kg Thermal 73% 2404 kJ/kg
Electricity 27% 889 kJ/kg average LHV for MSW B 8830 kJ/kg Recovery ratio C=A/B 0,373 Heat recovery ratio 73% ∗C 0,272 Electricity recovery ratio 27% ∗C 0,101
Theoretical recovery ratio
Heat losses (unburned material + miscellaneous) D 5% Heat loss in flue gas (unrecovered heat) E 12% Theoretical recovery ratio F=1-D-
E 83%
Recovery efficiency of MSW incineration
Overall recovery from MSW incineration G= C 37% Valorisation ratio (actual/theorcetical) H=G/F 45%
Estimation of LHV of PVC compounds
LHV for pure PVC J= 20900 kJ/kg Average % of pure PVC in PVC compounds K 80,30% Estimated LHV for PVC L=J*K 16782,7 kJ/kg
Estimated selling price of energy
possible selling price of heat (mid-pressure steam) in France 10,7 Euro/MWh in Italy 10,9 Euro/MWh in Belgium 12,5 Euro/MWh average HP= 11,4 Euro/MWh
Selling price of electricity EP= 30 Euro/MWhe
Actual income from MSW incineration Heat recovery (above figure) 31390 GWh Electricity recovery (above figure) 11610 GWh Heat income 11,4 Euro/MWh 358 M.Euro Electricity income 30 Euro/MWh 348 M.Euro Total income 706 M.Euro
Maximal possible Energy production from PVC incineration
Lower Heat Value L 16783 kJ/kg Heat recovery ηΗ= 70% ηΗ∗F∗L 9751 kJ/kg Electricity recovery ηΕ= 30% ηΕ∗F∗L 2428 kJ/kg Heat income 11,4 Euro/MWh 30,9 Euro/t Electricity income 30 Euro/MWh 20,2 Euro/t Total income 41,4 Euro/MWh 51,1 Euro/t
Actual energy production from PVC incineration
Lower Heat Value L 16783 kJ/kg Heat recovery ηΗ= 0,272 ηΗ ∗ L 4570 kJ/kg Electricity recovery ηΕ= 0,101 ηΕ ∗ L 1690 kJ/kg Heat income 11,4 Euro/MWh 14,5 Euro/t

DT 00 B 017D Page C - 3
Electricity income 30 Euro/MWh 14,1 Euro/t Total income 28,6 Euro/t Ratio to theoretical income 56%
Actual income from PVC incineration
PVC incinerated (0.8%MSW) 376 kt Maximal theoretical income 19,2 M.Euro Actual income 10,7 M.Euro
(table from pvcmsw.xls/recovery)
pvcmsw.xls

DT 00 B 017D Page D - 1
ANNEXE D
Commercial sheet (project of publishable sheet)
(authorization submitted to ECVM)
♦ English version
..\fiches_présentation\Storage_residues_sheet.ppt
or Storage_residues_sheet.ppt
♦ French version
..\fiches_présentation\Fiche_Stockage_résidus.ppt
or Fiche_Stockage_résidus.ppt

DT 00 B 017D Page E - 1
ANNEXE E
Various documents on waste storage
♦ Articles [Sud00]
♦ Articles [Sud00b]
Available on paper only :
♦ Articles [Sud00c] on Lacq/Morcenx underground disposal
♦ Article Usine Nouvelle n°2675 on StocaMine
♦ Information from UEV (Heilbronn + Kochendorf)

DT 00 B 017D Page E - 2
Articles from Sud-Ouest du 15 mars 2000 [Sud00] See file ..\France\article_Sud0uest\Sud00_article1.doc
..\France\article_Sud0uest\Sud00_article2.doc
Local links (if files are put in the same directory) :
See files Sud00_article1.doc
Sud00_article2.doc

DT 00 B 017D Page E - 3
Article from Sud-Ouest, Samedi 25 mars 2000 [Sud00b]
Fac-similé of image available in file ..\France\article_Sud0uest\Sud00_article3.doc
Or Sud00_article3.doc
DECHETS ULTIMES Ils resteront en France
PIERRE VERDET
En adressant hier une note à tous
les préfets, pour leur demander de «
soulever une objection systématique à
toute demande d'exportation de
REFIOM vers un autre Etat membre en
vue de son élimination »,. Dominique
Voynet a rapidement corrigé une erreur
apparente de son cabinet.
On se souvient que Philipe
Vesseron, directeur de la prévention
des pollutions et des risques majeurs
dans son ministère, avait autorisé
l’exportation vers l'Allemagne de ces
dangereux déchets toxiques, issus des
fumées de l'incinération des déchets
ménagers, pour y servir de remblais
dans d'anciennes mines de sel et de
potasse (« Sud-Ouest» des 14 et 16
mars).
Cette décision avait provoqué la
colère des professionnels du déchet,
mais aussi des associations écologistes
comme FNE et même d'élus verts
comme Noël Mamère. Celui-ci déclarait
hier soir:
« C'est une réaction sage et
nécessaire de la ministre, il fallait qu’elle
dise le droit. Elle l'a fait et nous
considérons désormais cette affaire
comme un incident qui ne doit pas se
renouveler »
Les élus verts du Conseil régional
d’Aquitaine se félicitaient également de
la décision de la ministre. «Cette
circulaire réaffirme la primauté du droit
communautaire au sens de la directive
du 15 juillet 1975, qui considère cette
opération de remblaiement dé mines
comme une opération d'élimination et
non de valorisation comme la législation
allemande le permet de façon
scandaleuse », affirmait leur président,
Jean Lissar.
Ces déchets devront donc continuer
à être dirigés vers les centres
d’enfouissement de classe 1 créés sur le
sol français, même si le si le prix est
beaucoup plus élevé que celui proposé
par les sociétés minières allemandes,
comme l’avaient immédiatement
remarqué de nombreuses collectivités
locales.
..\France\article_Sud0uest\article3_text.DOC (copie séparée de cet article)