feasibility study: production of...
TRANSCRIPT

FEASIBILITY STUDY: PRODUCTION OF RECYCLED 3DPRINT FILAMENT
MARCH, 2016
Content

FEASIBILITY STUDY: PRODUCTION OF RECYCLED 3D PRINT FILAMENT
1. Summary................................................................................................................................3
2. Introduction............................................................................................................................4
3. Background............................................................................................................................4
3.1 3D Printing Market...........................................................................................................4
3.2 3D Filament Market.........................................................................................................5
4. Background Recycling Filament............................................................................................6
4.1 Process of recycling..........................................................................................................6
4.2 Ethical Filament................................................................................................................6
4.3 Filament Cost....................................................................................................................7
5. Market Possibilities for Filament...........................................................................................7
5.1 International Market.........................................................................................................8
5.2 Comparison with International Market Prices..................................................................9
5.3 Shipping Costs..................................................................................................................9
5.4 Last Mile Distribution....................................................................................................11
5.5 Domestic Market, East Africa........................................................................................11
5.6 Comparison with Domestic Market Prices.....................................................................11
6. Plastic Collection Tanzania..................................................................................................12
6.1 Direct Recycling with Waste Pickers.............................................................................12
6.2 Recycling through a Waste Recycler..............................................................................12
7. Strengths, Weaknesses, Opportunities and Threats, Tanzania Filament..............................12
7.1 Strengths.........................................................................................................................12
7.2 Weaknesses.....................................................................................................................13
7.3 Opportunities..................................................................................................................13
7.4 Threats............................................................................................................................13
8. Key Takeaways and Next Steps...........................................................................................14
9. Annex...................................................................................................................................15
2

FEASIBILITY STUDY: PRODUCTION OF RECYCLED 3D PRINT FILAMENT
1. Summary
3D filament is the basic consumable resource that most types of 3D printers use for printing.As a traditional printer needs ink cartridges in order to print, 3D printers need plasticfilament. Most of the filament produced today is from virgin, unused petroleum based plasticwhich generates not only increasing amounts of global waste but contributes to carbonemissions, resulting in significant environmental damage. This provides a unique recyclingopportunity to make filament out of used, plastic waste, specifically from PET plastic, whichis the basis of soda bottles, consumed by many people around the world.
This section summarizes the main findings of the feasibility assessment of filamentproduction from recycled PET plastic waste and aims to identify market potential, challengesand opportunities, and the range of costs and benefits associated with several alternatives.The main findings are summarized below.
The 3D printing market is booming: it was globally valued at US$2.5 billion in 2013, and isestimated to grow to a staggering $16.2 billion market by 2018. Similarly, the market forpolymers used in 3D printing for the production of filament reached $310 million in 2014 andis estimated to grow to $1.4 billion by 2019.1
Overall, additive manufacturing has become one of the most widely accepted emergingtechnologies and its services are being used by various industries like medical, automotive,consumer products, military, academics and others. However this new technology is notrestricted to large industries and instead has also reached individual consumers. According toa recent Forbes article, a survey of 1,000 U.S. consumers found that one in three Americanswould consider buying a 3D printer for their home in 2014.
Filament is produced through a simple six-step process: collect, clean and shred, extrude andspool, test package, and ship. The two main things needed are a supply of good quality, cleanplastic and an extruder machine. Based on some basic assumptions, the cost of producing aspool of filament amounts to approximately $2.84 p/kg.
Currently the largest 3D printer markets are the USA, Germany, Netherlands and China. TheMiddle East and African markets are also expanding rapidly. The domestic East Africanmarket is currently very limited due to lack of knowledge, infrastructure and clear use cases,but has a high potential for growth. The target market for recycled PET filament can be eitherbusinesses (companies, universities, FabLabs) and/or individual consumers (3D printenthusiasts or home owners), both local and international.
Globally, a spool of filament is priced between $19-$175p/kg depending on material,diameter (mm), colour or other specific characteristics. In Tanzania, a spool of filament cancost up to $60-$80 including shipping costs from China.
Among the main challenges of the production of recycled PET filament is complexity of thedistribution. This is particularly true if shipping to many locations as the shipping costs riskbeing very high. In fact, average shipping costs from Tanzania to different locations in
1� http://www.3dprinterworld.com/article/14-billion-plastics-sales-from-3d-printing-2019, accessed March 2016
3

FEASIBILITY STUDY: PRODUCTION OF RECYCLED 3D PRINT FILAMENT
Europe, the US, India or China range between $4,757 and $7,110 or $0.93 and $0.67 perspool, for a 20ft and 40ft container respectively. If the containers are not filled, the price perspool will be much higher. In addition to the shipping costs, import/export duties and tariffsneed to be kept in mind. Each country has different regulations, requirements and fees. Lastmile delivery can be as low as $8 (~€7) within a country such as the Netherlands (up to 10kg)but significantly more if the product has to be shipped overseas (e.g. up to $35 between theUK and the US).
Ensuring an ongoing, clean and high quality supply of plastic is also a significant challenge toproducing recycled PET filament. This can be done either by working directly with wastepickers or through a third party (i.e. a local recycler who in turn works with waste pickers).
Additional challenges identified are creating a social brand in a market which is currentlyunbranded and increasing the popularity of PET filament as opposed to more widely usedplastics such as ABS and PLA. On the other hand, there are significant opportunities inproducing recycled PET filament. As mentioned above, the 3D printing market in booming inthe US and Europe and growing rapidly in many other areas. In addition, the market forrecycled filament is still relatively small and currently unbranded. There is a uniqueopportunity to create a strong social brand and to stay ahead of the technological revolution.
2. Introduction
3D filament is the basic consumable resource that most types of 3D printers use. As atraditional printer needs ink cartridges in order to print, 3D printers need plastic filament.Plastic filament is available in a variety of types of material, colours, diameters and lengths.An easy and nice material to print with is PET (PolyEthylene Terephthalate) and has becomewell known from plastic beverage bottles.
On the other hand, for more than 50 years global production of plastic has been on the rise.Some 299 million tons of plastics were produced in 2013, compared to 5.5 million tons in the1950s.2 Recycling remain insufficient and millions of tons of plastics end up in landfills andoceans each year.
So why produce 3D filament from virgin petroleum based plastic, increasing the amount ofglobal waste, carbon emissions and environmental damage, when it can be done usingrecycled bottles? This report studies the feasibility of filament production from recycled PETplastic waste and aims to identify market potential, challenges and opportunities and therange of costs and benefits associated with several alternatives.
2 � http://www.worldwatch.org/global-plastic-production-rises-recycling-lags-0 ; , accessed March 2016
4

FEASIBILITY STUDY: PRODUCTION OF RECYCLED 3D PRINT FILAMENT
3. Background
3.1 3D Printing Market
In 2013 the 3D printing market, including 3D printer sales, materials and associated serviceswas valued at US$2.5 billion globally, and estimated to grow to a staggering $16.2 billionmarket by 2018.3 Some experts even predict the market to exceed $21 billion in worldwiderevenue by 2020.4
Additive manufacturing is one of the most widely accepted emerging technology and itsservices are being used by various industries like medical, automotive, consumer products,military, academics and others. Alongside the usage of 3D printers in various industries, entrylevel printers which produce products of relatively smaller volumes are also currentlyavailable and mainly purchased by hobbyists educational institutes and design firms.
54%
14%
13%
12%6%United States
Japan
Germany
China
UK
Currently the United States has the largest marketshare amounting to 38%, significantly more than any other country. Behind the US are Japan,Germany, China, and the UK (Figure 1).
According to a 2015 Reuters report, the highest growth in the 3D printing market is beingprimarily seen in the US. Asia Pacific (APAC) and the European markets will contributesignificant revenue growth over the next years.5 However, the 3D printing revolution is notrestricted to these markets: a recent report by the International Data Corporation (IDC)
predicts that the spending on 3D printing in theMiddle East and Africa (MEA) market will
more than double over the coming years, growing to $1.3 billion by 2019.6 IDC argues thatthe world’s emerging markets will present a clear growth opportunity to the 3D printingindustry and their hardware and services.
3.2 3D Filament Market
3D filament is the basic consumable resource for many 3D printers. The market for polymersused in 3D printing reached $310 million in 2014 and is estimated to grow to $1.4 billion by2019.7
3� , accessed February 2016
4� , accessed February 2016
5� , accessed February 2016
6� , accessed February 2016
5
Figure 1. Largest 3D Printing Markets

FEASIBILITY STUDY: PRODUCTION OF RECYCLED 3D PRINT FILAMENT
A 2014 report on plastics in the 3D printing market states that a growing user base in theconsumer and professional markets for high value-added plastic materials for 3D printersrepresents "a high-margin opportunity for materials companies, equipment manufacturers andothers in the 3D printing supply chain”.8 Analysing key opportunities in the market for plasticmaterials used in 3D printing, the report considers novel plastics for 3D printing and assessesopportunities in newer plastic materials categories. The conclusions is that, in weight terms,three types of plastics – ABS, PLA and nylon – are expected to represent the biggest share ofthe 3D printed materials market accounting for more than 13,000 metric tons by 2019.
PET has become well known as a plastic from the popularity of plastic bottles. In its originalstate PET filament is a colourless and clear material, but when it is heated or cooled down thematerial changes its transparency. The material has more crystalline structure when allowedto cool down slowly after printing. The filament is fairly stiff and lightweight material, whichmakes it strong and impact-resistant.9
4. Background Recycling Filament
4.1 Process of recycling
There are six main operational stages in the process of producing and distributing 3Dfilament from recycled plastic, shown in Figure 2 below. The main steps are:
1. Collect: good quality plastic waste is collected for example through recyclingsuppliers or waste pickers;
7� , accessed February 2016
8� , accessed February 2016
9� , accessed March 2016
6

FEASIBILITY STUDY: PRODUCTION OF RECYCLED 3D PRINT FILAMENT
2. Clean and shred: the plastic is cleaned, driedand shredded into flakes according to preferredsize (commonly 6mm); 3. Produce: the filament is converted into 3Dprint filament through a machine called anextruder. According to the size and speed of theextruder different amounts of filament can beproduced per day;4. Test: appropriate testing with professionals inthe field needs to be done to ensure quality;5. Ship: recyclable packaging is used and thefilament is ready to be sent to the final consumer;6. Share: profits can be reinvested into localcommunities to help build sustainable future.
Some examples of businesses currently producingfilament from waste are:
- Dimension Polymers (USA): Developsengineering-grade 3D printing filaments fromrecycled ABS plastic. Their product ensures aminimum of 95% recycled plastic;
- Refil (Netherlands): Refil makes fully recycledABS filament from car dashboards (100%recycled material) and PET filament made fromold PET bottles (90% recycled material);
- B-Pet: Recycles PET waste into fully functional3D printing materials.
4.2 Ethical Filament
“Ethical filament”10 takes one step further: it is filament which not only is produced fromrecycled material but which also tackles a social issue. Technology and development charityTechfortrade, social enterprise Dreambox Emergence, and Michigan TechnologicalUniversity together have founded the Ethical Filament Foundation which aims to ensure thatsocial, economic and environmental requirements are met in the production of 3D filament.The Foundation aims to:
- Set the benchmark for the production of ethically produced 3D printer filamentmade from recycled plastic;
- Reduce the environmental impact of 3D printing by cutting the use of virgin plasticand encouraging that of recycled materials;
- Provide a sustainable form of income for waste pickers, some of the poorest globalcommunities;
- Encourage discussion and debate around the use of 3D printing technology toimprove the lives of those in developing nations.
10� , accessed February 20 16
7
Figure 2. Process of Recycling Filament
FEASIBILITY STUDY: PRODUCTION OF RECYCLED 3D PRINT FILAMENT
4.3 Filament Cost
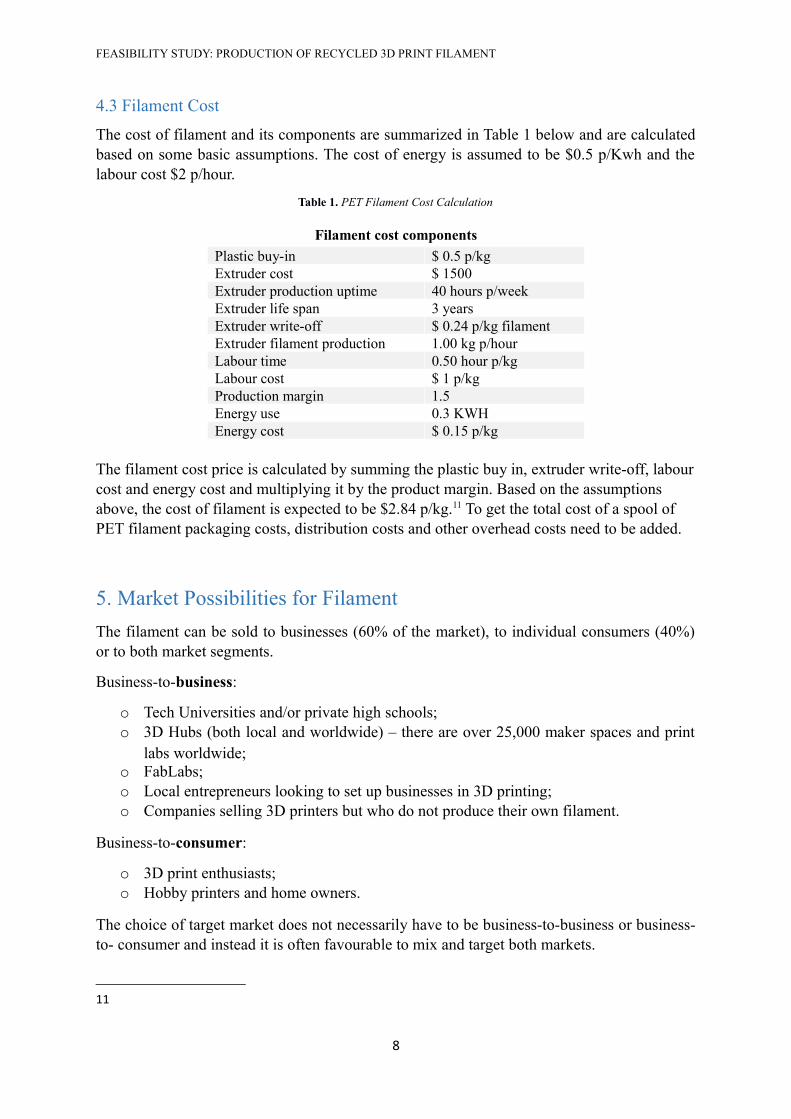
The cost of filament and its components are summarized in Table 1 below and are calculatedbased on some basic assumptions. The cost of energy is assumed to be $0.5 p/Kwh and thelabour cost $2 p/hour.
Table 1. PET Filament Cost Calculation
Filament cost components
Plastic buy-in $ 0.5 p/kgExtruder cost $ 1500Extruder production uptime 40 hours p/weekExtruder life span 3 yearsExtruder write-off $ 0.24 p/kg filamentExtruder filament production 1.00 kg p/hourLabour time 0.50 hour p/kgLabour cost $ 1 p/kgProduction margin 1.5Energy use 0.3 KWHEnergy cost $ 0.15 p/kg
The filament cost price is calculated by summing the plastic buy in, extruder write-off, labourcost and energy cost and multiplying it by the product margin. Based on the assumptions above, the cost of filament is expected to be $2.84 p/kg.11 To get the total cost of a spool of PET filament packaging costs, distribution costs and other overhead costs need to be added.
5. Market Possibilities for Filament
The filament can be sold to businesses (60% of the market), to individual consumers (40%)or to both market segments.
Business-to-business:
o Tech Universities and/or private high schools;o 3D Hubs (both local and worldwide) – there are over 25,000 maker spaces and print
labs worldwide;o FabLabs;o Local entrepreneurs looking to set up businesses in 3D printing;o Companies selling 3D printers but who do not produce their own filament.
Business-to-consumer:
o 3D print enthusiasts;o Hobby printers and home owners.
The choice of target market does not necessarily have to be business-to-business or business-to- consumer and instead it is often favourable to mix and target both markets.
11
8

FEASIBILITY STUDY: PRODUCTION OF RECYCLED 3D PRINT FILAMENT
According to a recent Forbes article, a report commissioned with research agency OnePollsurveyed 1,000 U.S. consumers and found that one in three Americans would consider buyinga 3D printer for their home in 2014. From this one third, 65 percent of consumers wereinterested in creating and printing customized items for the home.12 However, more recentarticles do not show that one in three Americans has indeed bough a 3D printer, and this caseremains specific to the US.
Selling filament to businesses provides a larger customer base as it targets differentinstitutions, networks or companies, and the volume of sales for businesses is likely to behigher.
Overall, the 3D print market is rapidly growing in both market segments and therefore salesshould be targeted to both businesses and consumers.
5.1 International Market
An interesting online tool called the ‘3D Printing Community Map’13 maps locations where tobuy 3D printers and filament and maps maker- and market-spaces worldwide (Figure 3). Itshows that overall the highest concentrations of 3D-print locations are in the US (in line withother literature), followed by Europe. The map is not comprehensive, but provides a goodidea of the industry distribution. Worldwide, the biggest markets are the Netherlands,Germany, UK, USA, and China, however spending on 3D printing in the Middle East andAfrica market is expected to more than double in the coming years.
Figure 3. 3D Printing Community Map
5.2 Comparison with International Market Prices
Worldwide prices for plastic filament range between $19 and $175 p/kg depending onmaterial, diameter (mm), colour or other specific characteristics. In cases when there are highshipping costs, a kilo of filament can be as much as $40 or $50. This can create barriers forlocal communities interested in 3D printing to access the necessary supplies.
12� http://www.forbes.com/sites/tjmccue/2014/03/19/3d-printing-in-the-home-1-in-3-americans-ready-for-3d-printer/#613b82db238e, accessed March 2016
13� , accessed March 2016
9

FEASIBILITY STUDY: PRODUCTION OF RECYCLED 3D PRINT FILAMENT
The Table below provides a price comparison of filament made from different kinds of plasticin countries with a large 3D printing market. The prices compare 1kg-spools of 1.75mmnatural filament.
Table 2. Comparison of filament prices
Company Name Country Type of plastic Price/kg(USD)
DEU PLA/ABS $ 41 - 59UK PLA $ 37
USA PLA/ABS $ 20.99NL PLA $ 39.95NL PLA $ 21.70CH PLA/ABS $ 14 - 19
USA PETG $ 38 - 55NL PET (recycled) $ 39.95
USA PET $ 35CH PETG $ 25 - 35
5.3 Shipping Costs
The main challenge with international sales are logistics and distribution. The firstdistribution phase is shipping the filament from Tanzania to warehouses located in largemarkets such as Europe and the US. From these warehouses the filament can be sent insmaller amounts directly to end consumers (whether businesses or individuals).
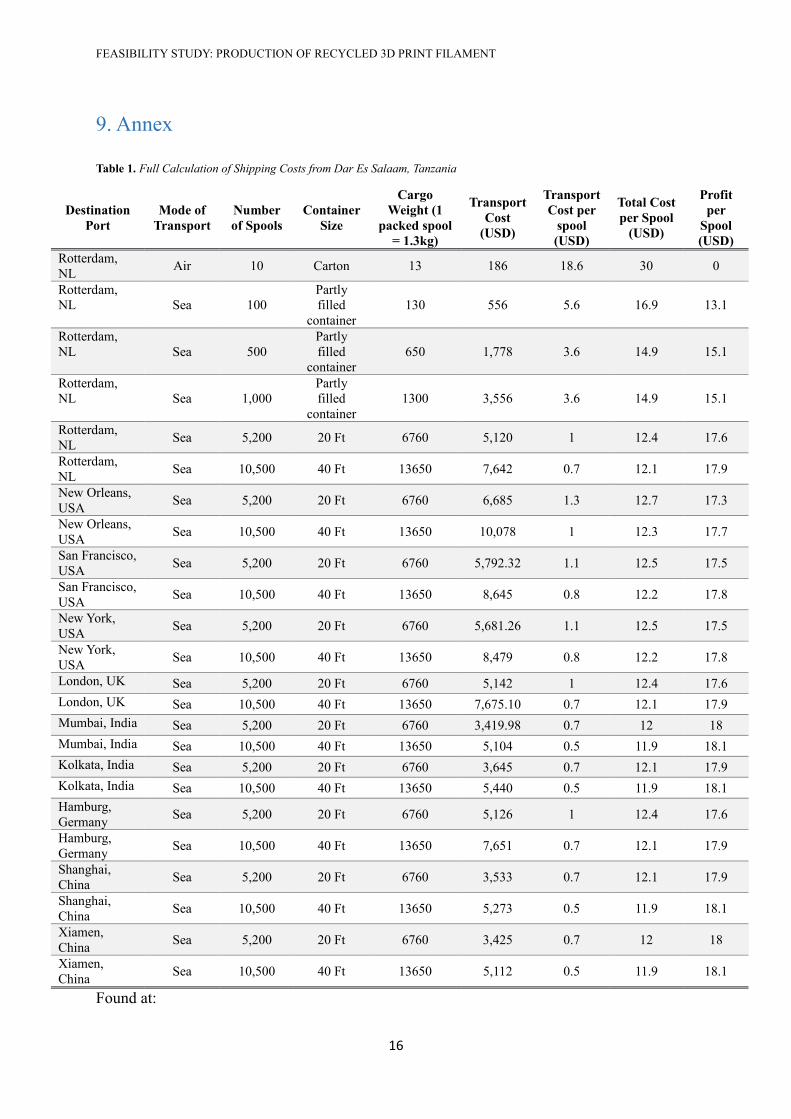
Shipping from Tanzania is expensive, and therefore the aim is to fill a full 20- or 40Ftcontainer. A 40ft container can contain approximately 10,500 spools of filament and a filled20ft container contains about 5,200 spools. Shipping costs per unit are minimized when thecontainers are filled (unit-cost of $0.93 and $0.67 for 20ft and 40ft containers respectively).The Table below assumes Tanzania as the country of origin and provides cost estimates fordifferent destinations. The containers are assumed to be filled to their capacity. The averagecost of a 20ft container is $4,757 (min $3,420; max $6,685) and for a 40ft container $7,110(min $5,104, max $10,078).
Table 3. Shipping Costs Calculations (from Dar Es Salaam, Tanzania), www.searates.com
20ft Container 40ft Container
DestinationTransport Cost
(USD)Transport Costper Spool (USD)
Transport Cost(USD)
Transport Costper Spool
(USD)Rotterdam, NL 5,120 1.0 7,642 0.7New Orleans, USA 6,685 1.3 10,078 1.0San Francisco, USA
5,792 1.1 8,645 0.8
New York, USA 5,681 1.1 8,479 0.8London, UK 5,142 1.0 7,675 0.7Mumbai, India 3,420 0.7 5,104 0.5Kolkata, India 3,645 0.7 5,440 0.5Hamburg, Germany 5,126 1.0 7,651 0.7Shanghai, China 3,533 0.7 5,273 0.5
10

FEASIBILITY STUDY: PRODUCTION OF RECYCLED 3D PRINT FILAMENT
Xiamen, China 3,425 0.7 5,112 0.5
Average 4,757 0.93 7,110 0.67
In Tanzania, exports are free of duty and taxes, however the process does require severaldocuments and certifications like all other typical import/export formalities.14 There is anEconomic Partnership Agreement (EPA) between Eastern Africa and the EU, which includesimmediate duty-free quota-free access to the EU market for all EAC exports.15 Shipping tothe US is slightly more complicated even though Tanzania is eligible for preferential tradebenefits under the African Growth and Opportunity Act. Goods need to go through theCustoms Border Protection and a series of forms are required and excise duties need to bepaid.16
If shipping from the EU to the US or vice versa, tax and customs duties need to be paid. Table4 summarizes the duties and tax rates for a number of countries.
Table 4. Fees and Tariff Rates
CountryFee for 20Ft
Container (USD)
Weighted MeanApplied Tariff Rate
(%)United States $1,298 1.5%United Kingdom $1,050 1.0%Netherlands $975 1.0%Canada $1,680 1.5%
5.4 Last Mile Distribution
Tables 5 shows cost estimates of shipping one spool of filament (1.3kg / 2.9lbs) to differentlocations within the EU through the Dutch postal services. The prices within the EU arereasonable, while for distribution over larger distances further research is needed to find themost cost-efficient method.
Table 5. Last Mile Distribution from the Netherlands
Carrier: Post NL (€) Up to 2kg 2-5kg 5-10kg 10-20kg 20-30kg
From NL to severalEU countries
€13,00 €19,50 €25,00 €34,00 €45,00
Within NL €6,95 €6.95 €6,95 €13,25 €13,25
As these estimates are for smaller quantities of filament (30kg are approximately 23packaged spools) and therefore more likely to address the business-to-consumer market.
14� , accessed April, 2016
15� , accessed April, 2016
16� , accessed April, 2016
11

FEASIBILITY STUDY: PRODUCTION OF RECYCLED 3D PRINT FILAMENT
5.5 Domestic Market, East Africa
The domestic East African market is currently very limited. In Kenya, for instance, there arearound 40 active 3D printers and that the total yearly filament market is not more than 400kga year. However, the problems 3D printing is solving are most apparent in developingcountries. Problems such as low capital for local manufacturing, relatively high transport anddistribution costs and lack of products that fit specific local needs. Furthermore, in manyemerging markets there are often high import tariffs which means local production is morecost-competitive.
This leads us to believe there is a large potential for growth in the 3D printing market indeveloping countries. By keeping the CAPEX investment of an extruder low anyone with thetechnical capabilities and network can create a profitable filament business quite rapidly.
5.6 Comparison with Domestic Market Prices
Currently in Tanzania, the cost of one kilogram (kg) of filament can rise to as much as $60 oreven $80, including fees for shipping from China. This creates a barrier for the burgeoninglocal communities interested in 3D printing to access the necessary supplies. Instead, filamentcan be sourced directly from recycled plastic providing a valuable lower cost alternativewithout compromising on quality
Our cost calculations, based on an initial investment of $1,000 in extruder investment and alocal sales price of $20 (Around $10 lower than market alternatives) a filament productioncan be profitable at 200kg of yearly sales. Detailed breakdown of these costs can be found inAnnex table 2.
The technical feasibility of such a low-cost extruder to serve local markets in currently beingtested in the next phase of the ReFab Dar project.
6. Plastic Collection Tanzania
The model for sourcing plastic for local filament production can be roughly divided into twomodels. Either work with established recycling centres or by directly sourcing plastic withwaste pickers.
6.1 Direct Recycling with Waste Pickers
Direct recycling with waste pickers involves selecting trusted waste pickers to find highquality clean bottles. Advantages of directly working with waste pickers is that you havecontrol of the entire plastic chain, you can easily track impact and monetary exchanges andyou are not dependent on a third party. This however does mean you have to investsignificant time on building up a local network, set up a tracking system for monetaryexchange (for instance through mobile phone payments), rigorously control and check theplastic quality input and create clear instructions for cleaning and sorting and create your ownfacilities to shred the bottles and possible a washing facility.
12

FEASIBILITY STUDY: PRODUCTION OF RECYCLED 3D PRINT FILAMENT
6.2 Recycling through a Waste Recycler
Working through a waste recycler involves finding a trustworthy local partner that can deliverhigh quality, clean plastic for filament production. Advantages of this model are that, if youfind the right partner, you have a continuous source of quality plastic with little or no effortwhich means you can focus on the primary production process. Disadvantages are that youare reliant on a third party for which you are often a small part of their entire productionprocess (general recycling business processes 700,000 kgs of plastic a month, which is morethan the global yearly filament sales) and you have little control over how value isredistributed to waste pickers.
7. Strengths, Weaknesses, Opportunities and Threats, TanzaniaFilament
7.1 Strengths
• Easy to scale up production – Production can be scaled up easily with a relatively low additional capital investment (low-cost extruder machine);
• Flexible Production – With the low capital Expenditure production can easily be adapted to specific customer needs, for instance custom colouring, diameter sizing or scenting of the filament;
• Cost-Competitive – As the filament is produced locally the costs of distribution and transport are cut significantly. Furthermore local production makes sure import tariffs are avoided. Even at small scale production a filament producer would be able to be cost-competitive;
• Sustainability – Clear environmental sustainability incentive that ties into the overall branding of the product;
• Material – PET has proven to be a very viable material for 3D printing and in terms of material properties is more than competitive with ABS.
7.2 Weaknesses
Plastic Supply – ensuring a continuous supply of clean plastic is one of the largest challenges in recycled filament production. Local recyclers either do not have the machines or the quality control systems needed for the level of quality 3D print filament needs. Furthermore, with the decline in the number of recycling businesses inTanzania these partners are harder to find;
Quality and Consistency – 3D print filament is a very specialized product, it needs to be precisely round, the diameter can only differ by 0.05 mm and any grain of sand would clog up a 3D printer. To achieve this consistent quality is harder in the low-techsmall-scale setting compared to industrial processes;
PET 3D printing unfamiliar – printing with PET plastic is not as established as “the famous two” - PLA and ABS;
Small local market – The current 3D printing market in Tanzania is rather small, where estimates are that there are less than 50 active printers in the entire country.
13

FEASIBILITY STUDY: PRODUCTION OF RECYCLED 3D PRINT FILAMENT
Although the market has potential, especially with the start of locally made affordable3D printers, it is still in its infancy stage.
7.3 Opportunities
• Potential growth of local 3D printing market - 3D printing has the potential to solve a lot of problems in developing regions around local production and import dependency. As with mobile banking the lack of local infrastructure might help leapfrog 3D print technologies in these countries;
• Easy to scale to new markets - Once some of the main challenges around plastic supply and extrusion are solved it is relatively easy to scale to new (fledgling) markets.
7.4 Threats
• Changes in technology limiting the need for filament – 3D printing technology is rapidly changing. While FDM (Fusion deposition modelling) is still the most widely uses technology, new technologies might emerge that do not use filament. One notable development is the Carbon3D, M1 Resin based 3D printer;
• Larger international competitors entering local market at more mature stages – If the local 3D printing market grows than international competitors will see the advantages of setting up shop locally;
• Changes in bottle production limiting the use of PET (PEF, Avantium for example). Companies such as Avantium are looking into ways to replace PET with a more sustainable PEF version, which is biodegradable. This might mean it is no longer suited for filament.
8. Key Takeaways and Next Steps
There is a clear business case for the production of recycled filament in developing countries.However, there were several challenges in sourcing a clean plastic supply. First of all, the lowplastic prices meant a lot of local recycling partners are going out of business. Our primarypartner, a social enterprise in Dar es Salaam focussed on PET recycling, shut down twomonths into the project.
Second, there are very little to none operational hot wash systems in Tanzania to generate theclean plastic we need for production. To test the technical feasibility, we imported post-industrial plastic from Nairobi. In terms of cleanliness this seems promising but the plasticalso had fine plastic dust causing technical challenges with extrusion, which we are currentlysolving. An alternative we will be exploring in the coming months is to work directly withwaste pickers to hand pick clean bottles and find a small scale shredder to create productionready plastic.
Third, the current 3D print market is relatively small and the 3D printing ecosystem needs toovercome certain challenges for it to be viable (technical schooling, local 3D printermanufacturing, local use-cases). Last of all, technical challenges around filament extrusion
14
FEASIBILITY STUDY: PRODUCTION OF RECYCLED 3D PRINT FILAMENT
(Water, dust, roundness, diameter consistency) need to be solved before the product is marketready.
The next steps to create a viable local filament business are:
Perfect the extruder design so that it is ready to produce consumer ready filament; Create local network of plastic collectors that can supply high quality PET plastic on a
continuous basis; Establish production site, ideally close to collection point, that can consistently
produce small amounts of filament for the local market; Set up the impact framework for redistribution of profits back to waste pickers; Partner with local 3D printing partners trying to establish a 3D printing ecosystem.
15
FEASIBILITY STUDY: PRODUCTION OF RECYCLED 3D PRINT FILAMENT
9. Annex
Table 1. Full Calculation of Shipping Costs from Dar Es Salaam, Tanzania
DestinationPort
Mode ofTransport
Numberof Spools
ContainerSize
CargoWeight (1
packed spool= 1.3kg)
TransportCost
(USD)
TransportCost per
spool(USD)
Total Costper Spool
(USD)
Profitper
Spool(USD)
Rotterdam, NL
Air 10 Carton 13 186 18.6 30 0
Rotterdam, NL Sea 100
Partlyfilled
container130 556 5.6 16.9 13.1
Rotterdam, NL Sea 500
Partlyfilled
container650 1,778 3.6 14.9 15.1
Rotterdam, NL Sea 1,000
Partlyfilled
container1300 3,556 3.6 14.9 15.1
Rotterdam, NL
Sea 5,200 20 Ft 6760 5,120 1 12.4 17.6
Rotterdam, NL
Sea 10,500 40 Ft 13650 7,642 0.7 12.1 17.9
New Orleans, USA
Sea 5,200 20 Ft 6760 6,685 1.3 12.7 17.3
New Orleans, USA
Sea 10,500 40 Ft 13650 10,078 1 12.3 17.7
San Francisco,USA
Sea 5,200 20 Ft 6760 5,792.32 1.1 12.5 17.5
San Francisco,USA
Sea 10,500 40 Ft 13650 8,645 0.8 12.2 17.8
New York, USA
Sea 5,200 20 Ft 6760 5,681.26 1.1 12.5 17.5
New York, USA
Sea 10,500 40 Ft 13650 8,479 0.8 12.2 17.8
London, UK Sea 5,200 20 Ft 6760 5,142 1 12.4 17.6
London, UK Sea 10,500 40 Ft 13650 7,675.10 0.7 12.1 17.9
Mumbai, India Sea 5,200 20 Ft 6760 3,419.98 0.7 12 18
Mumbai, India Sea 10,500 40 Ft 13650 5,104 0.5 11.9 18.1
Kolkata, India Sea 5,200 20 Ft 6760 3,645 0.7 12.1 17.9
Kolkata, India Sea 10,500 40 Ft 13650 5,440 0.5 11.9 18.1
Hamburg, Germany
Sea 5,200 20 Ft 6760 5,126 1 12.4 17.6
Hamburg, Germany
Sea 10,500 40 Ft 13650 7,651 0.7 12.1 17.9
Shanghai, China
Sea 5,200 20 Ft 6760 3,533 0.7 12.1 17.9
Shanghai, China
Sea 10,500 40 Ft 13650 5,273 0.5 11.9 18.1
Xiamen, China
Sea 5,200 20 Ft 6760 3,425 0.7 12 18
Xiamen, China
Sea 10,500 40 Ft 13650 5,112 0.5 11.9 18.1
Found at:
16

FEASIBILITY STUDY: PRODUCTION OF RECYCLED 3D PRINT FILAMENT
Table 2. Financial Plan Local Filament Production
Year 1 Year 2 Year 3 Year 4 Year 5 Year 6
Shilling - EURO conversion rate*
0.0005
Tanzanian shilling to Euro
Extruder Efficiency 1 kg filament per hour
Extruder Working Hours
40 per week
2 kg of waste buy in per kilo filament
Labour Costs
Low skilled (non-production -factory)
2,000 Tanzanian shilling per hour 2,000 2,200 2420 2662 2928 3221
Medium skilled
5,000 Tanzanian shilling per hour 5,000 5,500 6050 6655 7321 8053
High skilled(production)
10,000
Tanzanian shilling per hour 10,000
11,000 12,100
13,310
14641 16105
Average filament purchase Household Customer
2 kg per year
Average filament purchase Professional Customer
80 kg per year
Energy consumption2,000 KWH/H per year per
extruderSale Price (50% of market rate)
25 Euro/kilo
Inflation Tanzania 7%
Salary Raise (year on year)
10%
Plastic Preparation Worker Efficiency
4 kilo per hour
Number of working weeks per year
50
Number of Extruders 1 2 3 6 11 32
Cost of Extruder 2000 Euro/piece
Cost of Laptop/Computer
1000 Euro/piece
Number of Computers 1 2 3 6 11 32
Cost of Training per extruder
5000 Euro/extruder
Increase in the number of extruders
1 1 1 3 5 21
Marketing Costs 8000 Euro/extruder
Annual Maintenance Charges
2200 Euro/extruder 2200 2354 2519 2695 2884 3086
Rent per Extruder 3000 Euro 1000 1070 1145 1225 1311 1403
Cost of Energy 500 Shilling/KWh
Cost of Energy (EUR) 0.250 Euro/KWh 0.250 0.268 0.286 0.306 0.328 0.351
Waste recycling price (normal)
0.150 Euro/Kilo
Waste Buy-In (with redistribution)
3 Euro/kilo
Filament waste kg needed per kilo
1.5
Distribution Cost (packaging, shipping)
3 Euro/kilo
Yearly Tax Rate 30%
17

FEASIBILITY STUDY: PRODUCTION OF RECYCLED 3D PRINT FILAMENT
Production worker time 0.1 hour per kg
Extruder production costs
1500 Euro/extruder
Number of waste pickers collecting one local person can manage
20 per person
Waste pickers pick up rate
10 kg per day
Number of waste pickers needed
1 1 1 1 1 2
Mobile tracking cost10 $ per waste picker
Transport cost 0.05 $ per kg
Table 3. Financial Plan for Local Filament Production
All Figures in EURO Year 1 Year 2 Year 3 Year 4 Year 5 Year 6
REVENUESNumber of Home customers 50 100 200 300 500 500
Number of Professional Customers 0 0 1 3 5 10
Filament Sold (kilos) 100 200 480 840 1400 1800
Revenue from Filament Sold (EUR) 2,500 5,000 12,000 21,000 35,000 45,000
COSTSPersonnel Costs
Salary Local: Low Skilled Labour (Production) 1,000 2,000 2,000 2,000 2,000 2,000
Salary Local: Low Skilled Labour (Plastic Preparation) 500 2,200 2,420 2,662 2,928 3,221
Total Personnel Costs 1,500 4,200 4,420 4,662 4,928 5,221
Rent & office
Factory - Rent - 1,070 1,145 1,225 1,311 1,403
Total Rent Costs - 1,070 1,145 1,225 1,311 1,403
Cost of Goods Sold
Raw Material (Waste Buy-In) 450 900 2,160 3,780 6,300 8,100
Distribution & Packaging 300 600 1,440 2,520 4,200 5,400
Total Cost of Goods Sold 750 1,500 3,600 6,300 10,500 13,500
Marketing & Customer Acquisition - - 500 1,000 2,000 4,000
Total Operating Costs 2,250 6,770 9,665 13,187 18,739 24,124
Operating Profit (EUR) 250 - 1,770 2,335 7,813 16,261 20,876
Tax (@ 30%) 701 2,344 4,878 6,263
Net Profit (EUR) 250 - 1,770 1,635 5,469 11,383 14,613
Total Number of Extruders 1 1 1 1 1 1
Capex extruder 1500 0 0 0 1500 0
Computers / Laptops 1,000 - - - 1,000 -
Total Capex Costs 2,500 - - - 2,500 -
Net Earnings - 2,250 - 1,770 1,635 5,469 8,883 14,613
Figure 1. SWOT Analysis for Production of Recycled Filament
18

FEASIBILITY STUDY: PRODUCTION OF RECYCLED 3D PRINT FILAMENT
19
STRENGTHS- Locally filament can be sold at lower prices due to lack of transport costs and import tariffs. - Low capital expenditure, can be first-to-market at early stage of market development- Sustainable alternative to virgin-based filament in a market where sustainibility is deemed important- Flexibility in production (colouring and sizing)
WEAKNESSES- Ensure continuous supply of quality plastic- Distribution complexity and high shipping costs- Unpopularity of PET filament in the industry- High monitoring costs associated with the redistributing profits to local communities
OPPORTUNITIES- 3D printing market growth (both worldwide and locally) - Create a social brand in a currently unbranded market- The model is easy to replicate in locations with similar conditions
THREATS
- Changes in technology limiting the need for filament- Larger international competitors entering local market at more mature stages- Changes in bottle production limiting the use of PET (PEF, Avantium for example)
SWOT Analysis