february 14th, 2011 volatile outlook leads to cautious ... · euro corporates + pan european corp...
TRANSCRIPT
15/02/2011 Allianz Investment Management SE
1/19
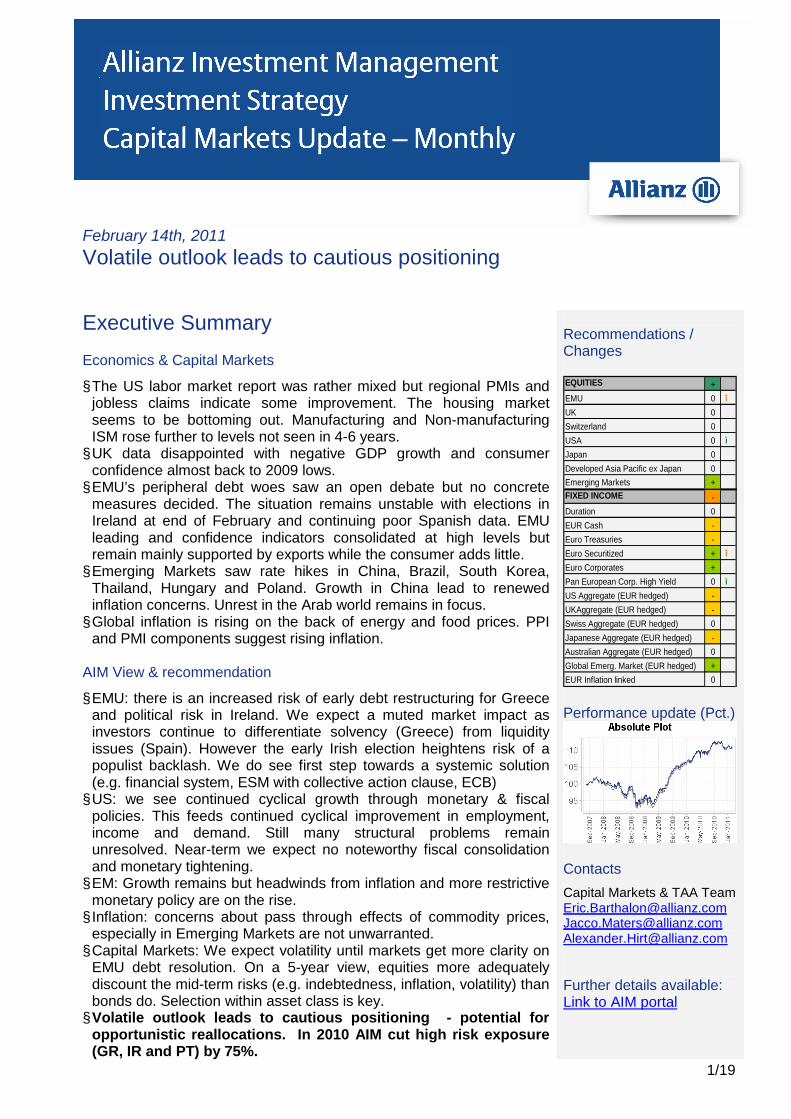
February 14th, 2011 Volatile outlook leads to cautious positioning
Executive Summary Economics & Capital Markets
§ The US labor market report was rather mixed but regional PMIs and jobless claims indicate some improvement. The housing market seems to be bottoming out. Manufacturing and Non-manufacturing ISM rose further to levels not seen in 4-6 years. § UK data disappointed with negative GDP growth and consumer
confidence almost back to 2009 lows. § EMU’s peripheral debt woes saw an open debate but no concrete
measures decided. The situation remains unstable with elections in Ireland at end of February and continuing poor Spanish data. EMU leading and confidence indicators consolidated at high levels but remain mainly supported by exports while the consumer adds little. § Emerging Markets saw rate hikes in China, Brazil, South Korea,
Thailand, Hungary and Poland. Growth in China lead to renewed inflation concerns. Unrest in the Arab world remains in focus. § Global inflation is rising on the back of energy and food prices. PPI
and PMI components suggest rising inflation. AIM View & recommendation
§ EMU: there is an increased risk of early debt restructuring for Greece and political risk in Ireland. We expect a muted market impact as investors continue to differentiate solvency (Greece) from liquidity issues (Spain). However the early Irish election heightens risk of a populist backlash. We do see first step towards a systemic solution (e.g. financial system, ESM with collective action clause, ECB) § US: we see continued cyclical growth through monetary & fiscal
policies. This feeds continued cyclical improvement in employment, income and demand. Still many structural problems remain unresolved. Near-term we expect no noteworthy fiscal consolidation and monetary tightening. § EM: Growth remains but headwinds from inflation and more restrictive
monetary policy are on the rise. § Inflation: concerns about pass through effects of commodity prices,
especially in Emerging Markets are not unwarranted. § Capital Markets: We expect volatility until markets get more clarity on
EMU debt resolution. On a 5-year view, equities more adequately discount the mid-term risks (e.g. indebtedness, inflation, volatility) than bonds do. Selection within asset class is key. § Volatile outlook leads to cautious positioning - potential for
opportunistic reallocations. In 2010 AIM cut high risk exposure (GR, IR and PT) by 75%.
Recommendations / Changes EQUITIES +EMU 0 î
UK 0Switzerland 0USA 0 ì
Japan 0Developed Asia Pacific ex Japan 0Emerging Markets +FIXED INCOME -Duration 0EUR Cash -Euro Treasuries -Euro Securitized + î
Euro Corporates +Pan European Corp. High Yield 0 ì
US Aggregate (EUR hedged) -UKAggregate (EUR hedged) -Swiss Aggregate (EUR hedged) 0Japanese Aggregate (EUR hedged) -Australian Aggregate (EUR hedged) 0Global Emerg. Market (EUR hedged) +EUR Inflation linked 0 Performance update (Pct.)
Contacts
Capital Markets & TAA Team [email protected] [email protected] [email protected] Further details available: Link to AIM portal

15/02/2011 Allianz Investment Management SE
2/19
Index Capital Markets Review.................................................................................................................3 Economics Review........................................................................................................................5 Focus Topics .................................................................................................................................8
AIM’s 2011 Global Scenarios.......................................................................................................8 AIM’s Hot Topics........................................................................................................................10
AIM Outlook .................................................................................................................................11 Performance Report...................................................................................................................11 Fixed Income – View..................................................................................................................12 Fixed Income – Chart of the month ............................................................................................13 Equities – View ..........................................................................................................................15 Equities – Chart of the month.....................................................................................................16 Currencies – View......................................................................................................................17 AIM quarterly return forecasts....................................................................................................18 AIM recommendations ...............................................................................................................19
15/02/2011 Allianz Investment Management SE
3/19
Capital Markets Review
Executive summary Peripheral debt concerns moved to the back of investor’s minds as it did for politicians. Peripheral spreads stabilized and even tightened somewhat with the EUR rebounding significantly. However yields rose throughout regions. A US treasury advisory committee proposed the Treasury to issue 100y bonds. Japan was downgraded to AA- by S&P, while Moody’s warned that the US may soon be put on rating watch. Equities in Developed Markets reached 2½ year highs on rather supportive economic news flow, a solid start of the earnings season in the US as well as on M&A and IPO activity. Equity flows turned negative for Emerging Markets while Developed Markets saw inflows. Emerging Markets saw measures of monetary tightening to fight inflation. The Tunisian and Egyptian revolutions sent jitters through markets. Market Review Government Bonds: • Fitch downgraded Greece’s long-term foreign and local currency issuer default ratings BB+, or
junk, from BBB-. S&P downgraded Ireland to A- (neg. outlook), still leaving it 1 notch better than Moody’s and Fitch.
• Greece’s bill placement raised EUR 1.95bn 26-week at yields of 4.9 % – only marginally higher than the last sale in November. Foreign investors bought 40%, more than previously. Spain successfully placed EUR 6bn of treasury bills. The Portuguese bond auction also went well. Nomura however remarked that the ECB bought a significant amount of this, effectively monetizing the entire auction. ECB sovereign bond buying came to a virtual halt thereafter. Italy sold EUR 7bn 12-month bills at a bid-to-cover of 1.6. The yield was 2.06%, in line with market expectations, and the auction was covered 1.6 times.
• The EFSF saw EUR 40bn in bids for EUR 5bn in 5-year bonds. Japan bought 20% of the issue. The bonds were priced at 2.8%, 8bps above mid-swap or 48bps above Bunds. Japan’s finance minister, said the government would use some of its USD 1,096bn foreign exchange reserves to buy European government bonds.
• EU officials have called for an overhaul of the EFSF to make it more flexible and potentially increase it at the next EcoFin meeting. A key proposal under consideration is to use the fund to buy the bonds of struggling countries.
• The EU summit agreed on an extraordinary meeting on March, 4th and voluntary pact for competitiveness. The Franco-German plan proposed more “economic government” at the Eurozone level, suggesting 6 measures to raise competitiveness, like raising the retirement age, aligning corporate tax rates and debt brakes to prevent rampant spending. The later was endorsed by Spain but with some reservations.
• According to Otmar Issing, the ECB’s former chief economist, the monetary union will be put in danger by the misguided response of Eurozone governments to the sovereign debt crisis.
• A German politician and an economic advisor to the German government commented Germany should prepare for a Greek restructuring.
• A group of officials (incl. IMF) have proposed pushing Portugal into a bail-out with a smaller group even supporting a credit line to Spain, according to the FT.
• ECB board members Smaghi and Gonzalez Paramo warned of the risk of imported inflation pressures. ECB Orphanides said that markets had gone too far in anticipating rate rises.
• Bundesbank head Axel Weber resigned, putting him out of the race for Trichet’s succession. • The Fed Beige Book said that the economy continued to expand moderately with labor
markets appearing to firm somewhat. • A US treasury advisory committee proposed the treasury issue 100y bonds. US 30y treasury
yields hit the highest in 9 month. • Japan was downgraded to AA- by S&P, while Moody’s warned that the US may soon be put on
ratings watch.

15/02/2011 Allianz Investment Management SE
4/19
• In the wake of the Tunisian president’s ouster, Egyptian and Yemeni leaders said they would not seek re-election, and Jordan’s king replaced his government this week in efforts to curb unrest. Algeria could see protests on Feb 12, Bahrain groups have called for demonstrations on Feb 14 and a Libyan opposition group is urging protesters to gather on Feb 17.
Credit: • Spain announced a further recapitalization of its savings banks through its recapitalization fund
(FROB). The Spanish finance minister, said the extra capital needed would not exceed EUR 20bn - at the low end of analysts' estimates – and would bring Core Tier 1 to 8%.
• EONIA rose by 40bps since mid January to 1.3%, above ECB target. Equities: • Fresh highs were reached in both the US and Europe. • Ongoing stream of IPO and M&A announcements as companies put cash balances to work. • Out of 145 Stoxx 600 companies that have reported so far, 59% reported earnings above
expectations. This is less than 66% in Q3 reporting, but better than the long term average of 57%. The share of positive sales surprises in Q4 is 64%, above the earnings level.
Currency: • EUR surged to an 8-week high as a newspaper suggested Germany was working on a plan to
allow Greece to buy back its own debt with EFSF fund (to be denied by both Greece and Germany). After a strong rally the Euro dipped on a ECB rate hike appearing more remote.
Commodities: • Floods in Queensland have severely disrupted global supplies of coking coal, a vital
steelmaking ingredient pushing steel prices by more than 1/3 in two months. • Oil prices broke through the $100 a barrel level for the first time in more than two years, amid
market fears that Egypt’s turmoil will hit oil flows. The IEA said it saw few problems at $100. • Copper reached new highs, temporarily exceeding 10,000 $/MT. • Gold was dragged down by strong PMIs, partly offset by USD weakness.
Chart 1: Market Snapshot January and 2011 ytd in EUR
Month Jan Ytd 2011
Source: IDS, AIM

15/02/2011 Allianz Investment Management SE
5/19
Economics Review United States:
10/02/2011 1Green numbers indicate actual is better than previous and consensus.Red numbers indicates actual is worse than previous and consensus.
Ex-autos the increase was even less (0.5%)0.6%0.8%0.8%Retail Sales (Dec) mom
The drop was due to a 500k drop in the labor force. Non-farm payrolls only increased by a disappointing 36k, far below expectations of 140k.
9.0%9.5%9.4%Unemployment (Jan)
No change in wording0.25%0.25%0.25%FOMC Rate Decission
Led by a 4.4% increase in consumer spending. The core PCE was low (0.3%) but in line with expectations
3.2%3.5%2.6%GDP (Q4A) yoy
To be up 3.4% yoy. Savings rate down to 5.3%0.4%0.4%0.3%Personal Income (Dec) mom
To be up 4.1% yoy (2.8% in real terms).0.7%0.5%0.4%Personal Spending (Dec) mom
The highest reading since May 2004. Details strong with employment at its highest level since 1973. Prices paid also significantly up
60.85857ISM Manufacturing (Jan)
Repeating the strength of the manufacturing survey, also in employment with the highest level since may 2006
59.457.157.1ISM Non-Manufacturing (Jan)
The highest level of sales since the homebuyer tax credit expired in spring 2010. Median prices increased 8.5% yoy. The supply of homes is now at the lowest level since 1968. Pending home sales recorded the 5th gain in six months. Case Shiller prices still down.
329k300k280kNew Home Sales (Dec)
China sold $11.2bn net in Treasuries. UK had an increase of $34.2bn.
85.1bn40.0bn27.6bnTICS Data (Nov)
Receipts grew 8.2% yoy whereas spending only grew by 2.1%. Interest payments grew a staggering 21.3% yoy.
-80.0bn-84.0bn-91.4bnMonthly Budget Statement (Dec)
Driven by utility output because of cold weather. Manufacturing output rose 0.4%. Capacity utilization is now at 76.0%
0.8%0.5%0.4%Industrial Production (Dec) mom
Core inflation came in at 0.8%, showing the importance of the 4.6% mom rise in energy prices
1.5%1.3%1.1%CPI (Dec) yoy
Economic indicators Prev. Consensus
Current Comment
Euroland:
10/02/20111
Green numbers indicate actual is better than previous and consensus.Red numbers indicates actual is worse than previous and consensus.
Further rise on energy and food.2.4%2.3%2.2%EMU: CPI (Jan) yoy
Up 0.8% mom, higher than in previous month. With durable goods prices up 1.4% yoy, intermediates by 6.2% and the energy sector by 11.3% there may be more in the pipeline.
5.3%5.2%4.5%EMU: PPI (Dec) yoy
Comment that inflation will only move below ECB target of 2% towards the end of the year. The ECB will very closely monitor this. Markets read this as a rate hike being delayed.
1.0%1.0%1.0%ECB: Rate decision
In December there were 73k fewer people unemployed. German unemployment in January dropped to 7.4%; Spain saw January net jobless claims rise by a very high 130k mom to 4.2m, the rise compares to a rise 182k yoy.
10.0%10.1%10.1%EMU: Unemployment Rate (Dec)
Dec at -0.6% mom accelerates decline from -0.3% in Nov and flat in Oct, so Q4 overall saw lower qoq consumption.
-0.9%0.2%0.1%EMU: Retail Sales (Dec) yoy
As a surprise to analysts the index reached a 9 months high, lead by Germany and Italy, which reached a 4½ y high. The output price index rose close to the recent peak of July 2008.
57.356.956.9EMU: PMI Manufacturing (Jan)
Further rise in PMI for Germany (60) and France (58). Ireland moved from contraction (47) to expansion (53) while Spanish PMI recovered 3-Pts. (49), getting closer to expansion and Italy remains fairly neutral (50). Hiring intentions provide a reliable induction and for Germany they reached the highest since 1990 and also rose for France.
55.955.255.2EMU: PMI Services (Jan)
Deficit continues to be driven by goods and income. 12-month cumulated is at a deficit of 0.5% of GDP. Current transfers show lower outflows than in recent months.
-11.2na-9.8EMU: Current Account (Nov) Eur bn
At long-term average and highest since 2007.-11.4-12-11EMU: Consumer Confidence (Jan)
Lifted by Energy, Capital Goods and Intermediates as Consumer Goods were flat. Also while industrial production is higher by 7.4% yoy durable consumer goods are flat and non-durable goods up by 2.7%. For the month German IP dropped 0.7% mom while all other major countries grew.
1.2%0.5%0.7%EMU: Industrial Production (Nov) mom
Exports almost flat while imports rose a seasonally adjusted 3.3% yoy. French Trade balance shrunk by 2.4bn to -0.1bn and hence is a main reason for the narrowing in the EMU surplus – maybe due to volatile aircraft deliveries.
-1.9bn1.7bn3.5bnEMU: Trade Balance (Nov) EUR bn
Economic indicators Prev. Consens Current Comment

15/02/2011 Allianz Investment Management SE
6/19
United Kingdom:
11/02/2011 1Green numbers indicate actual is better than previous and consensus.Red numbers indicates actual is worse than previous and consensus.
Headline inflation at 1.0% mom. Core accelerated more than expected to 2.9% yoy with goods stable at 1.7% but services rising by 3.9%. Expect further rise on VAT hike.
3.7%3.4%3.3%CPI (Dec) yoy
This first drop since Q3/2009 leaves GDP up 1.7% yoy. Output in production increased 0.9% while output in construction (-3.3%) and services (-0.5%) lead the decline. Without bad weather growth had probably been flat.
-0.5%0.4%0.7%GDP (Q4) qoq
Consumer credit shows a net repayment of GBP 0.2bn. Mortgage approvals also dropped to lowest since Mar 09.
-1.3%na-1.4%Money Supply (Dec) yoy
This is the highest level on record. 62.058.058.3PMI Manufacturing (Jan)
Weather impacted rebound. 54.551.349.7PMI Services (Jan)
The current budget improved slightly. Public sector net debt (excl. fin. interventions) was GBP 889.1bn (59.3% GDP). The unadjusted measure of public sector net debt was 154.9%.
16.8bn16.3bn25.5bnPublic Sector Borrowing (Dec) GBP
Lowest since March 2009. Most notable being in the “major purchase” index, which dropped 21 points.
-29na-21GfK Consumer Confidence (Jan)
Still net buyer inquiries are down and below vendor instructions. The stock-sales-ratio dropped to the lowest since May 2009. House prices saw some stabilization in prices.
-39%-44%-44%RICS house price balance (Dec)
Slow but steady improvement. Claimant Count and ILO Unemployment stable at 4.5% and 7.9%, respectively. At +2.1% wages and salaries continue to decline in real terms.
-4.0k0.0k-1.2kJobless Claims Change (Dec)
Food store sales decreased 3.4%. After January 2009 VAT hike sales dropped and gradually recovered till December.
0.0%1.3%1.8%Retail Sales Volume (Dec) yoy
Of this a higher than expected 4.2% yoy inflation fed through to output prices with 2.9% in core output price inflation.
12.5%10.2%9.0%PPI Input Prices (Dec) yoy
Excl. oil and erratic items, the volume of goods exports rose by 3.4% mom and the volume of imports rose by 0.3%
-4.10bn-3.80bn-3.95bnTrade Balance (Nov) GBP bn
Minutes show that a further member is in favor of a rate hike. Hence there were 2 votes for a hike while it remains one vote for further quantitative easing, leaving 6 for unchanged policy
0.5%0.5%0.5%BOE: rate announcement
Economic indicators Prev. Consens Current Comment
Japan:
Current index rose by 1.4 points101.0100.997.7Leading Coincident Index (Nov P)
To be up 4.6% yoy. Inventories rose 1.4% mom3.1%2.8%1.0%Industrial Production (Dec P) mom
Showing the lose monetary policy of the BoJ5.5%na7.0%Monetary Base (Jan) yoy
Core deflation at -0.7%, also above expectations0.0%-0.1%0.1%CPI (Dec) yoy
Deepening deflationary fears-0.4%1.0%-0.2%Labor Cash Earnings (Dec) yoy
Driven by exports to China. In 2010 the trade surplus grew 24.4% and with that doubled compared to 2009
707.3bn523.9bn425.7bnAdj. Merchants Trade Balance (Dec)
Down 3.3% in real terms. Retail sales also contracted-2.0%-0.6%-0.4%Overall Household Spending (Dec) yoy
The lowest level in 10 months4.9%5.1%5.1%Unemployment (Dec)
Households’ confidence retraced 0.3 points40.2na40.6Consumer Confidence (Dec)
Consumer-related industries suffered, whereas business-related showed an increase.
0.6%0.5%0.5%Tertiary Industry Index (Nov) mom
The fourth decline in a row.-0.1%0.2%-0.2%All Industry Activity Index (Nov) mom
The third decline in a row was led by a slump in non-manufacturing orders, causing the government to cut its assessment.
-3.0%2.0%-1.4%Machine Orders (Nov) mom
Also the current situation improved by 1.5 points43.9na41.4Eco Watchers Outlook (Dec)
Exports declined by 0.8% mom, whereas imports increased by 4.3% over the same period.
1145.1bn1149.7bn1462.6bnAdjusted Current Account (Nov)
Economic indicators Prev. Consens Current Comment

15/02/2011 Allianz Investment Management SE
7/19
Emerging Markets:
Mexico: Finance Secretary Cordero stated that authorities “are paying close attention” to recent currency dynamics and capital flows.
Food prices (weight over 14% in the WPI basket), adjusted for seasonal trends, jumped by over 7% in a month.
8.43%8.4%7.48%India: WPI (Dec.) yoy
Inflationary pressures remain high due to global fuel and food prices, and wage growth.
6.50%na6.25%India: CB Policy Rate
Russia: Central Bank left interest rates unchanged at 7.75% (against expectation of 25bp hike) and increased reserve requirement from 2.5% to 3%. CB commented that it takes measures to contain inflation and to limit risks associated with capital inflows.
Faster growth in output and new orders, offset by slower employment. Input price inflation accelerated.
53.5na53.5Russia: HSBC Manufacturing PMI (Jan)
Fastest expansion sine 2005 (beginning of survey). Driven by growth in output, new orders, employment, and inflation.
57.2na56.4Turkey: HSBC Manufacturing PMI (Jan)
Production, new orders and employment fell, while input prices increased.
52.9na53.9China: Official Manufacturing PMI (Jan)
Accelerated growth in new orders and employment for manufacturing and services. Price inflation eased but still robust.
52.9na52.3Brazil: HSBC Composite PMI (Jan)
In contrast with other indicators that show strong growth. On cumulative basis IP expanded 10.7%; fastest since 1986.
-0.7%+0.9%-0.2%Brazil: Industrial Production (Dec) mom, sa
Growth accelerated especially in industrial production and retail sales. Fixed investment growth moderated, albeit at high level.
9.8%9.4%9.6%China: GDP (Q4) yoy
Rapid increase in agricultural prices, higher property prices and rising inflation expectations increase likelihood of broader-based price controls and aggressive macro policy responses.
4.6%4.6%5.1%China: CPI (Dec) yoy
Inflation above 3% target caused hike for a third month in a row.6.00%na5.75%Hungary: CB Policy Rate
Israel: Government to establish sovereign wealth fund for oil and gas windfalls. The state take in recent oil/gas finds could be as high as 62%. No immediate impacts on currency expected and flagship Tamar deposit is planned to be launched in 2013.
Additional hikes expected in order to tackle inflationary pressures. Central Bank resumed FX intervention through currency swaps.
11.25%11.25%10.75%Brazil: CB Policy Rate
Lowest rate ever recorded. High employment levels put pressure on wages and boost consumption and hence pose inflation risk.
5.3%na5.7%Brazil: Unemployment Rate (Dec)
Transport & housing on the upside, albeit slower growth for food.0.76%na0.69%Brazil: IPCA-15 Inflation (Jan) mom
Fiscal tightening as core CPI is expected to remain above 2.5% target level along with rising pressure from wages.
3.75%3.75%3.50%Poland: CB Policy Rate
Higher oil prices, higher revenues from taxes and duties, lower expenditure and earlier than expected fiscal tightening reduced budget clearly below 5.3% official target level.
-3.9%-4.2%-6.2%Russia: Budget Balance/GDP (2010)
Better than expected as revenues grew stronger than expenses. -3.9%na-5.5%Turkey: Budget Balance/GDP (2010)
Surprising cut. Central Bank hiked reserve requirement rates from 8% to 12%, including FX deposits and maybe FX swaps.
6.25%6.50%6.50%Turkey: CB Policy Rate
Thailand: +25 bps rate hike to 2.25%. Minutes highlight pressures from factor costs (e.g. minimum wages raised by the highest since 1994)
China: FX reserves increased 0.2trn USD to 2.85trn(end 2010)
Smallest increase in 13 months. Aggressive measures introduced to calm property market, incl. home purchase restrictions in allmajor cities and tax on properties held less than 5 years. Localgovernments are required to set price targets for new properties.
6.4%7%7.7%China: Property Prices (Dec.) yoy
China: The PBoC increased RRR by 50bps to reach a record 19% (17% for smaller banks). It will withdraw around CNY360bn of liquidity from the banking system. New lending reached CNY500bn in the first week of 2011. Further hikes are expected.
Slowdown probably due to base effects.17.9%24%34.9%China: Exports (Dec.) yoy
Biggest decline was in the consumer goods sector (-6.9% m/msa) after the large October increase due to the festive season.
2.7%6.6%11.3%India: IP (Nov.) yoy
South Korea: +25bps rate hike to 2.75%. Also the government said it aims to freeze utility prices and reduce food tariffs to curb inflation.
Expansion in new business. Weaker new export orders and employment. Inflation continue to accelerate.
56.8na56.7India: HSBC Manufacturing PMI (Jan)
Suggests large non-FDI inflows given the below-average trade surplus and assuming that net FDI inflows were stable yoy. New loans rose CNY7.95trn in 2010, exceeding the PBoC's target of CNY7.5trn (Actual: 480.7bn)
19.7%19%19.5%China: M2 Growth (Dec.) mom
Economic indicators Prev. Consens Current Comment

15/02/2011 Allianz Investment Management SE
8/19
Focus Topics
AIM’s 2011 Global Scenarios
Details § Peripheral Debt Restructuring (40% probability): Within EMU there is an increased risk of
early debt restructuring for Greece and political risk in Ireland. We expect a muted market impact as investors continue to differentiate solvency (Greece) from liquidity issues (Spain). However the early Irish election heightens risk of a populist backlash. We do see first step towards a systemic solution (e.g. financial system, ESM with collective action clause, ECB). For the US we see continued cyclical growth through monetary & fiscal policies. This feeds continued cyclical improvement in employment, income and demand. Still many structural problems remain unresolved. Near-term we expect no noteworthy fiscal consolidation and monetary tightening. Emerging Market’s growth remains but headwinds from inflation and more restrictive monetary policy are on the rise. Inflation concerns about pass through effects of commodity prices, especially in Emerging Markets are not unwarranted.
§ EMU Escalation (25% probability): In contrast to our central scenario a tougher restructuring in Greece and potentially Ireland leads to contagion. Market fear spreads not only to Portugal but Spain and to a lesser extent Italy. High spread volatility persists as markets are supported by various liquidity commitments, but overall disappointed by the limited progress on solvency issues stemming from fiscal austerity, internal devaluation and structural reform.
§ Bull Case (10% probability): Improving confidence and growth overshadow peripheral restructuring. The global economy continues to follow the same pattern of growth as in 2010, pulled up by the strong performance of Asian economies (Chinese Fixed investments). However growth becomes more sustainable by rising consumption in the US, Emerging Markets but also Europe. EU sees only moderate drag on growth from lower government spending, also thanks to strong German growth. Plans to lower fiscal deficits are seen as credible.
Chart 2: AIM’s 2011 global scenarios
Source: AIM

15/02/2011 Allianz Investment Management SE
9/19
§ US Sovereign Crisis (15% probability): The combination of disappointing US growth (despite QE) with awareness of European dynamics turns market attention to US debt levels, which are worse than in Greece. US treasuries and the USD are under severe market pressure. The US policy response (“more of the same”), both monetary and fiscal, compounds the problem.
§ China Slowdown (10% probability): A cyclical slowdown liable to be amplified by structural factors: Cyclical inflationary pressures trigger policy action. Investment boom ends and leads to an inflation burst (forced savings). Structural growth potential is curbed by exhausted easy growth (from migration and factor productivity to labor and productivity growth). Growth is slowing to 5-7% and inflation rising to 7-10%. Japan will be most hit by its high exposure to and reliance on China plus operating leverage. Commodity exporters (BRI & Australia) will see less direct impact since growing demand is still facing limited supply but foreign investments and hot money may re-introduce volatility (AUD).

15/02/2011 Allianz Investment Management SE
10/19
AIM’s Hot Topics
Some Greek Puzzle January 24th, 2011 § There remain some grey areas in Greek public accounts § The actual fiscal stabilization is not as large as reported § The Greek government itself does not seem to be confident in the success of its strategy § Greek solvency has most likely continued to deteriorate in 2010 § Some form of at least partial debt restructuring will come sooner rather than later, some time in
2011 Link to full report Ireland: your debt is my debt? February 3rd, 2011 § Ireland epitomizes many crucial European problems § Its boom in the first decade of the century illustrates the fact that the EMU-area is not yet an
optimal currency area § It shows that public debt sustainability is an elusive concept, which cannot be assessed
without giving due consideration to private debt § Ireland’s bust since 2007-2008 is a rare case of debt-deflation in the developed world since
the 1930’s § The upcoming general elections on February 25th will test the political commitment to
cooperative strategies within the EMU § Holders of bank bonds are exposed to an increasing political risk
Link to full report Will hittistes and shabab atileen lead us to the next oil crisis? February 11th, 2011 § High (youth) unemployment combined with high (food) inflation is a poisonous combination § Contagion will only become a serious issue for markets if and when it hits populous oil-rich
countries or Europe § Situation shows that there is a reason for existence of emerging markets risk premium § Differentiation between emerging markets is key
Link to full report
15/02/2011 Allianz Investment Management SE
11/19
AIM Outlook
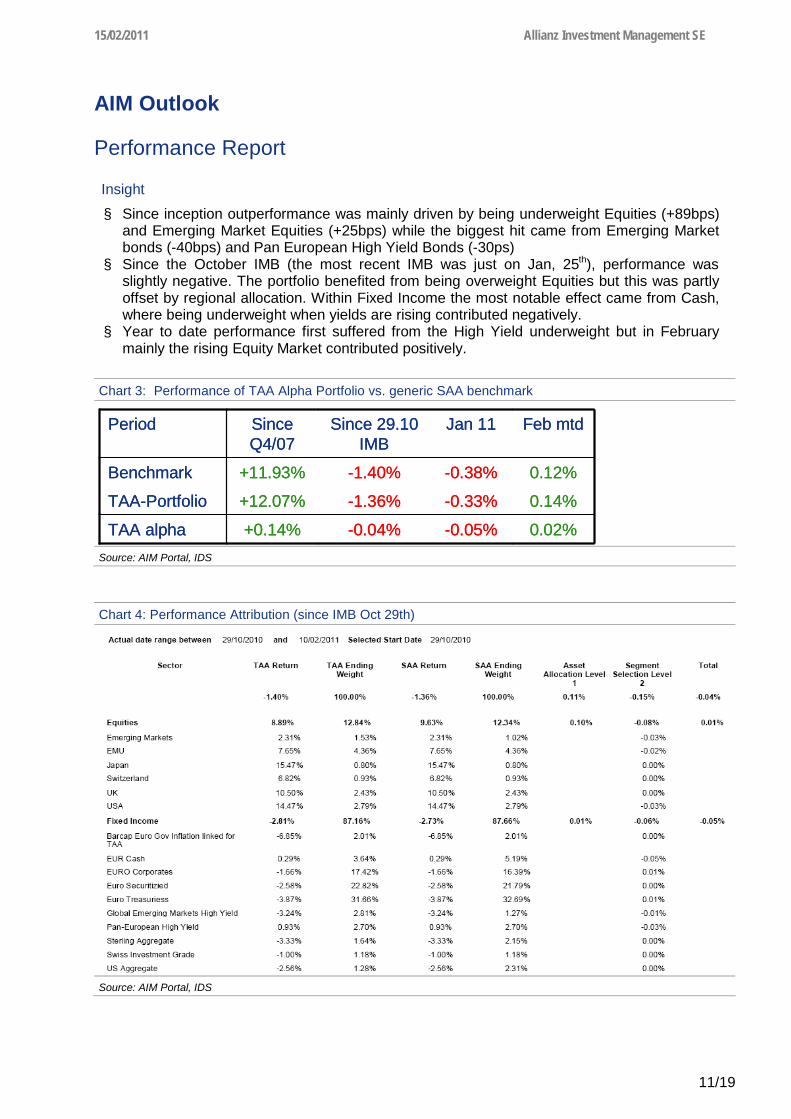
Performance Report Insight
§ Since inception outperformance was mainly driven by being underweight Equities (+89bps) and Emerging Market Equities (+25bps) while the biggest hit came from Emerging Market bonds (-40bps) and Pan European High Yield Bonds (-30ps)
§ Since the October IMB (the most recent IMB was just on Jan, 25th), performance was slightly negative. The portfolio benefited from being overweight Equities but this was partly offset by regional allocation. Within Fixed Income the most notable effect came from Cash, where being underweight when yields are rising contributed negatively.
§ Year to date performance first suffered from the High Yield underweight but in February mainly the rising Equity Market contributed positively.
Chart 3: Performance of TAA Alpha Portfolio vs. generic SAA benchmark
-0.05%
-0.33%
-0.38%
Jan 11
0.02%
0.14%
0.12%
Feb mtd
-1.40%+11.93%Benchmark
-1.36%+12.07%TAA-Portfolio
-0.04%+0.14%TAA alpha
Since 29.10 IMB
SinceQ4/07
Period
-0.05%
-0.33%
-0.38%
Jan 11
0.02%
0.14%
0.12%
Feb mtd
-1.40%+11.93%Benchmark
-1.36%+12.07%TAA-Portfolio
-0.04%+0.14%TAA alpha
Since 29.10 IMB
SinceQ4/07
Period
Source: AIM Portal, IDS
Chart 4: Performance Attribution (since IMB Oct 29th)
Source: AIM Portal, IDS
15/02/2011 Allianz Investment Management SE
12/19
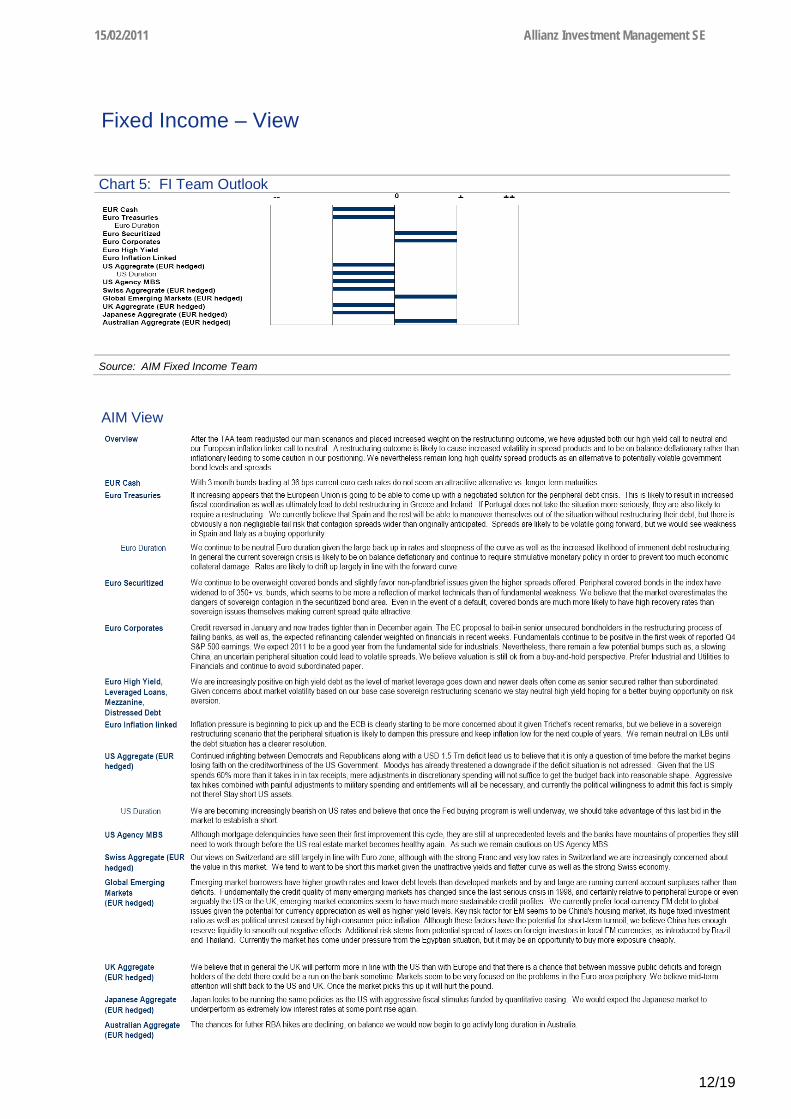
Fixed Income – View
AIM View
Chart 5: FI Team Outlook
Source: AIM Fixed Income Team

15/02/2011 Allianz Investment Management SE
13/19
Fixed Income – Chart of the month Bank Capital in Transition – From Pre-Lehman to Basel III
AIM View
§ The above graph shows the spread of subordinate financials in relation to senior unsecured financials. It is built by dividing each hybrid capital by the senior unsecured spread. In essence, the chart gives an indication how the market evaluates the relative riskiness of different parts of banks’ capital structure.
§ Back in 2005, Tier I capital offered roughly 5x more spread than senior unsecured bonds, which is less a reflection of higher risk of Tier I but more due to the anemic 15bp that senior bonds offered at the time. This relative advantage intensified until the Lehman crisis in Q3 2010. Post-Lehman, the market widened dramatically in absolute terms but also in relative terms, resulting in Tier I trading roughly 9x wider than seniors.
§ As banks’ core capital positions have been increasing through earnings retention and rights issuance, Tier I capital has tightened considerably. One could argue that this trend is a reflection of the belief that future Basel III regulation will decrease the Probability-of-Default (PD) for banks. As the Loss-Given-Default (LGD) for Tier I will always be close to 100% it seems logical that Tier I tightens relative to Senior paper.
§ The Lower Tier II paper in contrary has been fundamentally revaluated post-Lehman. The market now understands that there is a substantial risk of maturity extension through non exercise of call rights as well as the risk of haircuts (by the means of “voluntary conversions”). Lower Tier II is now trading 2x wider than Senior paper.
§ The bank restructuring plans published by the European Commission in October 2010 as well as the case of the Anglo-Irish restructuring have a further impact on the relative riskiness of different parts of the capital structure. We would argue that once Basel III is fully in place, PDs will decline, whereas the LGD of all non-secured debt is increasing. On the basis of this macro trend, one would expect overall spread multiples to decrease once Basel III is fully implemented or banks are fully compliant.
§ The new Basel III regulation will have a very different impact on each layer of hybrid capital. We expect most of the existing bank capital to lose its regulatory eligibility under Basel III, which will lead to issuance of new paper as a replacement. However, weaker banks or
Chart 6: spread of subordinate financials in relation to senior unsecured financials
1,0x
2,0x
3,0x
4,0x
5,0x
6,0x
7,0x
Dez.05
Mrz.06
Jun.06
Sep.06
Dez.06
Mrz.07
Jun.07
Sep.07
Dez.07
Mrz.08
Jun.08
Sep.08
Dez.08
Mrz.09
Jun.09
Sep.09
Dez.09
Mrz.10
Jun.10
Sep.10
Dez.10
Tier I / Senior MultipleUpper Tier II / Senior MultipleLower Tier II / Senior Multiple
Source: AIM Fixed Income Team, Bloomberg

15/02/2011 Allianz Investment Management SE
14/19
banks that are currently unable to issue senior unsecured, might elect to not call their ineligible bank capital as the step-up coupon could still be cheaper than current funding levels. Basel III states that banks from countries that already have a bank restructuring regime in place that allows for write-down or equity conversion (UK, Germany, Ireland, Denmark) might also elect to keep existing hybrids. A third factor might be different legal clauses in bond prospectuses that allow for changes in bond conditions in case of regulatory inadequacy. Some banks might enter into litigation with investors in order to convert their hybrids into eligible securities again.
§ As of 2Q10 European banks have a non-domestic exposure of USD 550bn to Greek, Irish and Portuguese sovereigns and banks. At first glance this exposure does not look excessive relative to a combined balance sheet of EUR 32trn and capital and reserves of EUR 2trn. Nevertheless we believe, an outright default would lead to turmoil, as exposure and capital are not evenly distributed across the sector. Knock-on effects of a failing banking institutions, might bring to light cross-boarder ties that are not fully captured in current statistics. We reiterate that the interconnectedness of the financial system should not be underestimated. While the system as a whole would be able to absorb the losses, the turbulence and uncertainty caused by such events would make subordinate paper particularly vulnerable. We therefore feel most comfortable owning senior secured exposures (either as secured bonds or via term securities lending) as well as covered bonds.

15/02/2011 Allianz Investment Management SE
15/19
Equities – View
AIM View
• EMU: (O -> N): We have reduced the EMU weight to neutral within the overweight equity segment. The main reason is that the run up to a Greek and possible Irish debt restructuring will lead to increased volatility and temporary setbacks. Although the restructuring itself will have a limited impact on the economic growth of the Eurozone, the fear and uncertainty coming with this restructuring will lead to setbacks in EMU Equities. We do not recommend to underweight EMU Equities because of the limited economic impact and, more important, the Euro weakness that will support exports and with that core Europe. In our view there will be good moments to enter the markets again once the restructuring has been announced, as this will increase visibility in the European situation
• US: (U -> N): We increased the weight of US Equities in the model portfolio to neutral. US
equities will be less affected by the EMU debt restructuring and US QE will act as a bottom under markets. As mentioned last month, the economic numbers in the US are strong and now we have seen promising labor market figures. This, plus the fact that the US housing market seems to have bottomed, have made us more positive on US Equities.
• Japan: (N -> N): Although we still see Japan cheap compared to history, we think that this is
for a reason. We have seen most of the appreciation of the Yen and therefore the currency-tailwind is gone. Obviously a weaker Yen might help Japanese exports, however we are more concerned about the domestic situation, as proven in recent weaker macro-economic releases
• Emerging Markets: (O -> N): We still believe in the long-term secular EM growth story.
Having said that valuations are higher than in history, which we deem appropriate given the structural change in this region, however there are some cyclical headwinds. Most important are the continuing rising inflation figures. Especially food inflation is running at high speed and is a concern to many central banks in the region, as seen in the recent tightening moves around the (emerging) world. Apart from the more economic headwinds, the most important argument is the technical argument that these markets are becoming overbought, as will be shown in the chart of the month on the next page.
Chart 7: Equity View as provided by Equity Expert Team
-- - 0 + ++ EMU US Japan Emerging Markets
Source: AIM Equity Team
15/02/2011 Allianz Investment Management SE
16/19
Equities – Chart of the month
AIM View
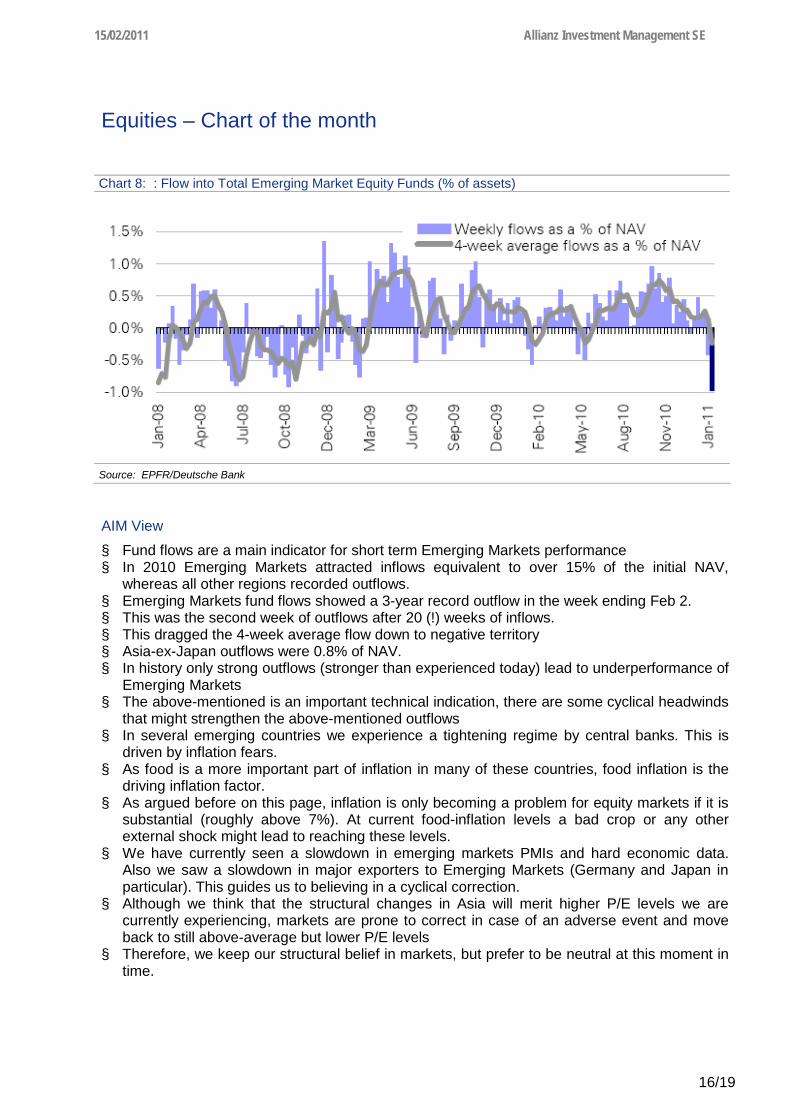
§ Fund flows are a main indicator for short term Emerging Markets performance § In 2010 Emerging Markets attracted inflows equivalent to over 15% of the initial NAV,
whereas all other regions recorded outflows. § Emerging Markets fund flows showed a 3-year record outflow in the week ending Feb 2. § This was the second week of outflows after 20 (!) weeks of inflows. § This dragged the 4-week average flow down to negative territory § Asia-ex-Japan outflows were 0.8% of NAV. § In history only strong outflows (stronger than experienced today) lead to underperformance of
Emerging Markets § The above-mentioned is an important technical indication, there are some cyclical headwinds
that might strengthen the above-mentioned outflows § In several emerging countries we experience a tightening regime by central banks. This is
driven by inflation fears. § As food is a more important part of inflation in many of these countries, food inflation is the
driving inflation factor. § As argued before on this page, inflation is only becoming a problem for equity markets if it is
substantial (roughly above 7%). At current food-inflation levels a bad crop or any other external shock might lead to reaching these levels.
§ We have currently seen a slowdown in emerging markets PMIs and hard economic data. Also we saw a slowdown in major exporters to Emerging Markets (Germany and Japan in particular). This guides us to believing in a cyclical correction.
§ Although we think that the structural changes in Asia will merit higher P/E levels we are currently experiencing, markets are prone to correct in case of an adverse event and move back to still above-average but lower P/E levels
§ Therefore, we keep our structural belief in markets, but prefer to be neutral at this moment in time.
Chart 8: : Flow into Total Emerging Market Equity Funds (% of assets)
Source: EPFR/Deutsche Bank
15/02/2011 Allianz Investment Management SE
17/19
Currencies – View
AIM View
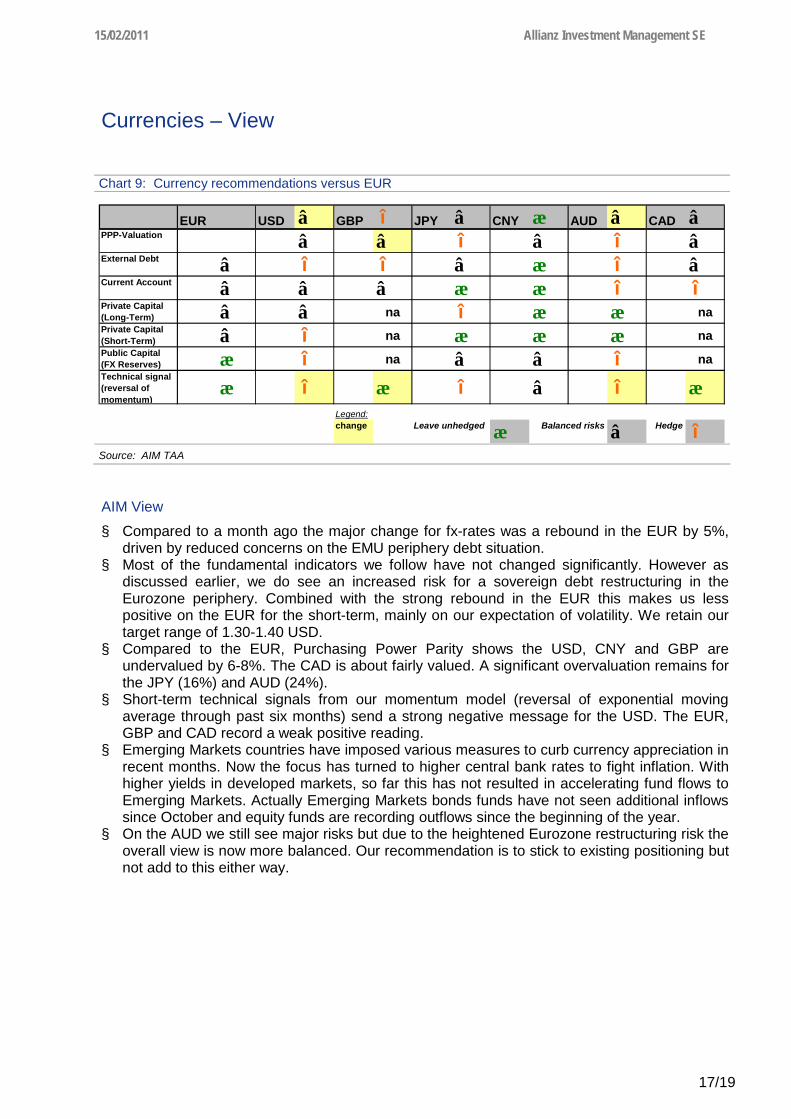
§ Compared to a month ago the major change for fx-rates was a rebound in the EUR by 5%, driven by reduced concerns on the EMU periphery debt situation.
§ Most of the fundamental indicators we follow have not changed significantly. However as discussed earlier, we do see an increased risk for a sovereign debt restructuring in the Eurozone periphery. Combined with the strong rebound in the EUR this makes us less positive on the EUR for the short-term, mainly on our expectation of volatility. We retain our target range of 1.30-1.40 USD.
§ Compared to the EUR, Purchasing Power Parity shows the USD, CNY and GBP are undervalued by 6-8%. The CAD is about fairly valued. A significant overvaluation remains for the JPY (16%) and AUD (24%).
§ Short-term technical signals from our momentum model (reversal of exponential moving average through past six months) send a strong negative message for the USD. The EUR, GBP and CAD record a weak positive reading.
§ Emerging Markets countries have imposed various measures to curb currency appreciation in recent months. Now the focus has turned to higher central bank rates to fight inflation. With higher yields in developed markets, so far this has not resulted in accelerating fund flows to Emerging Markets. Actually Emerging Markets bonds funds have not seen additional inflows since October and equity funds are recording outflows since the beginning of the year.
§ On the AUD we still see major risks but due to the heightened Eurozone restructuring risk the overall view is now more balanced. Our recommendation is to stick to existing positioning but not add to this either way.
Chart 9: Currency recommendations versus EUR
EUR USD â GBP î JPY â CNY æ AUD â CAD âPPP-Valuation â â î â î âExternal Debt â î î â æ î âCurrent Account â â â æ æ î îPrivate Capital (Long-Term) â â na î æ æ naPrivate Capital (Short-Term) â î na æ æ æ naPublic Capital(FX Reserves) æ î na â â î naTechnical signal (reversal of momentum)
æ î æ î â î æLegend:change æ â Hedge îBalanced risksLeave unhedged
Source: AIM TAA

15/02/2011 Allianz Investment Management SE
18/19
AIM quarterly return forecasts
AIM View
§ With our changed economic scenarios we have also incorporated new return estimates. Still, returns are linked to previous scenarios, in specific for the US Sovereign crisis scenario and the Bull Case, which are little changed.
Chart 10: Return forecast update
EMU Escalation Risk US Sovereign Crisis Peripheral Debt
restructuring China Slowdown BULLMean
Std-deviation of forecast
Skewness downside
risk/averagePROBABILITIES (t+12m) 25.0% 10.0% 40% 15% 10%
FIXED INCOME ASSUMPTIONS (t+12m)
US CB-rate 0.25% 0.00% 0.35% 0.25% 1.00% 0.34% 0.24% 0.29%EMU CB-rate 0.50% 0.50% 1.00% 1.00% 1.50% 0.88% 0.31% 0.19%
US 10yr-yield (Treasury, level) 3.40% 5.00% 3.70% 3.00% 5.50% 3.83% 0.76% 0.80%EMU 10yr-yield (Bund, level) 2.00% 3.00% 3.25% 3.00% 4.50% 3.00% 0.71% 0.45%
3.8%3.0%
US Corp IG-OAS 170.0 225.0 130.0 162.5 100.0 151.4 33.1 29.0EMU Corp IG-OAS 290.0 277.0 182.0 237.0 162.0 224.8 49.8 30.4EMU Securitized OAS 280.0 250.0 180.0 240.0 100.0 213.0 55.5 -42.3
151.4 224.8
Default Losses USA Corp 0.3% 0.6% 0.1% 0.3% 0.1% 0.2% 0.00 0.00Default Losses EMU Corp 0.5% 0.4% 0.1% 0.3% 0.1% 0.3% 0.00 0.00Default Losses EMU Securitized 0.0% 0.0% 0.0% 0.0% 0.0% 0.0% 0.00 0.00
MARKET INPUTS *=as of 10/02/2011
Govts* - US 10yr-yield (Treasury) 3.76% 3.76% 3.76% 3.76% 3.76% - EMU 10yr-yield (Bund) 3.28% 3.28% 3.28% 3.28% 3.28% - Duration US 10yr-yield (Treasury) 5.01 5.01 5.01 5.01 5.01 - Duration EMU 10yr-yield (Bund) 4.15 4.15 4.15 4.15 4.15
Credits* - US Corp IG-OAS 1.40 1.40 1.40 1.40 1.40 - EMU Corp IG-OAS 1.81 1.81 1.81 1.81 1.81 - Duration USA Corp IG 6.65 6.65 6.65 6.65 6.65 - Duration EMU Corp IG 6.03 6.03 6.03 6.03 6.03
Stock Indices* - S&P 500 1322 1322 1322 1322 1322 - Eurostoxx 50 3014 3014 3014 3014 3014 - Nikkei 225 10606 10606 10606 10606 10606 - MSCI Emerging Markets (USD) 1089 1089 1089 1089 1089
Currencies* - 1 EUR = X USD 1.36 1.36 1.36 1.36 1.36 - 1 EUR = X JPY 113.24 113.24 113.24 113.24 113.24 - 1 USD = X JPY 83.53 83.53 83.53 83.53 83.53 - 1 USD = X EUR 0.74 0.74 0.74 0.74 0.74 - 1 JPY = X EUR 0.009 0.009 0.009 0.009 0.009 - 1 EUR = X GBP 0.84 0.84 0.84 0.84 0.84
LOCAL CURRENCY RETURNS
US Bonds - return 5.9% -3.2% 4.1% 8.4% -5.9% 3.5% 4.3% -4.5%EMU Bonds - return 13.6% 5.5% 3.5% 5.5% -5.5% 5.6% 5.5% -2.4%US Credit - return 5.4% -10.3% 6.3% 9.3% -4.8% 3.7% 5.9% -6.8%EMU Credit - return 5.4% 1.8% 5.1% 3.6% 0.7% 4.2% 1.6% -1.7%EMU Securitized - return 6.3% -0.3% -0.6% 0.2% -3.7% 1.0% 3.2% 2.9%
US Equities -13.6% -18.4% 5.6% -13.6% 29.7% -2.0% 14.3% 13.2%EMU Equities -26.7% -17.6% 9.9% -22.1% 46.6% -3.1% 23.0% 20.4%JAP Equities -10.5% -10.5% 14.3% -30.4% 44.1% 1.9% 21.2% 13.7%EM Equities (USD) 0.0% -10.5% 31.6% -21.0% 68.5% 15.3% 26.7% 19.1%
FOREIGN EXCHANGE ASSUMPTIONS (t+12m)1 EUR = X USD 1.05 1.60 1.30 1.25 1.40 1.27 0.16 0.111 EUR = X JPY 99.75 112.00 117.00 125.00 133.00 114.99 10.39 -5.301 USD = X JPY 95.00 70.00 90.00 100.00 95.00 91.25 7.89 -9.44
CURRENCY RETURNS1 EUR = X USD (neg number if USD deprec) 25.5% -16.6% 4.2% 8.1% -3.2% 7.3% 12.5% 3.1%1 EUR = X JPY (neg number if JPY deprec) 12.7% 1.1% -3.3% -9.9% -16.1% -1.1% 9.2% 6.0%1 USD = X JPY (neg number if JPY deprec) -12.9% 17.7% -7.5% -18.0% -12.9% -8.4% 9.4% 11.7%
EUR RETURNS
US Bonds - return 33.0% -19.3% 8.5% 17.2% -8.9% 11.4% 18.4% -10.6%EMU Bonds (Bund) - return 13.6% 5.5% 3.5% 5.5% -5.5% 5.6% 7.7% -2.4%
US Credit - return 32.3% -25.2% 10.8% 18.1% -7.8% 11.8% 19.1% -15.4%EMU Credit - return 5.4% 1.8% 5.1% 3.6% 0.7% 4.2% 2.4% -1.7%EMU Securitized - return 6.3% -0.3% -0.6% 0.2% -3.7% 1.0% 3.7% 2.9%
US Equities 8.5% -31.9% 10.1% -6.6% 25.5% 4.5% 18.6% -15.9%EMU Equities -26.7% -17.6% 9.9% -22.1% 46.6% -3.1% 34.6% 20.4%JAP Equities 0.8% -9.6% 10.6% -37.3% 20.9% -0.0% 23.3% -18.6%EM Equities (USD) 25.6% -25.3% 37.2% -14.6% 63.1% 22.8% 35.4% -22.5%
US 10yr-yield (Treasury, level) - duration weightedEMU 10yr-yield (Bund, level) - duration weighted
US Corp IG-OAS - duration weightedEMU Corp IG-OAS - duration weighted
Source: Datastream, AIM

15/02/2011 Allianz Investment Management SE
19/19
AIM recommendations
AIM View
§ We make some minor adjustments to our tactical calls as the question is not if but when a restructuring in the EMU periphery will come.
§ Scale back on Equities by reducing EMU Equities to neutral. We still see valuation support for the European equity story.
§ Since Fixed Income Benchmarks have already been adjusted to exclude peripheral exposure there are no material changes warranted. As such we retain the Emerging Markets overweight for yield and solvency reasons and recommend not to increase peripheral bonds before a systemic solution is reached. We reduce the securitized overweight and continue to reduce financials, particularly in subordinated exposure. Yields provide no incentive to hold cash.
§ On duration we are neutral in Europe and short in ROW given inflation outlook. § Our key belief is that volatility will remain as risk-on / risk-off periods are likely to persist for
various months. Volatile markets provide portfolio managers with opportunities to trade, implement positions and earn spreads. Hence we allow asset managers a high degree of flexibility where possible and according to confidence.
§ We continue to look for opportunities in alternative investments (e.g. infrastructure, distressed opportunities, commodities, gold and volatility).
Chart 11: Recommendations implied trades (%)
-0.5-1.0
0.00.0
0.50.00.0
0.50.00.0
-0.50.0
1.50.0
-0.50.00.00.0
-1.50 -1.00 -0.50 0.00 0.50 1.00 1.50 2.00
Proposed new active weights (%)
0.00.00.00.00.0
0.5-0.5
-1.5-1.0
1.01.0
0.0-1.0
-0.50.0
1.50.00.0
0.00.0
0.5
-2.00 -1.50 -1.00 -0.50 - 0.50 1.00 1.50 2.00
Equities
EMU
UK
Switzerland
USA
Japan
Emerging Markets
Fixed Income
EUR Cash
EUR Treasuries
EUR Securitized
EUR Corporates
Pan-European High Yield
US Aggregate (EUR hedged)
UK Aggregate (EUR hedged)
Swiss Investment Grade
Global EM (EUR hedged)
EUR Inflation Linked
Alternatives
Real Estate
Private Equity
EQUITIES
FIXED INCOME
ALTERNATIVES
Source: AIM