february 2017 market watch - just released
TRANSCRIPT

Toronto EmploymentGrowthDecember 2016 (0.4%)
Month February 20171 Year3 Year5 Year
3.14%3.39%4.64%
February 20171 Year3 Year5 Year
------
Market Watch For All TREB Member Inquiries:
(416) 443-8158For All Media/Public Inquiries:
(416) 443-8152
Sales Up and Listings Down in FebruaryTORONTO, March 3, 2017 – Toronto Real Estate Board President Larry Cerqua announced thatGreater Toronto Area REALTORS® reported 8,014 residential sales through TREB’s MLS®System in February 2017. Despite the fact that February 2016 had one more day due to theleap year day, this result was up on a year-over-year basis by 5.7 per cent compared to 7,583sales reported last year.
“The February statistics tell me that many Greater Toronto Area households continue to viewhome ownership as a great long-term investment. The high demand for ownership housingwe’re seeing is broad-based, with strong sales growth for most low-rise home types andcondominium apartments. This makes sense given the results of a recent consumer surveyundertaken for TREB by Ipsos, which found an even split between intending first-time buyersand existing homeowners who indicated that they were planning on purchasing a home in2017,” said Cerqua.
While the demand for ownership housing grew over the past year, new listings entered intoTREB's MLS® System in February were down on a year-over-year basis by 12.5 per cent to9,834.
The MLS® HPI Composite Benchmark Price was up by 23.8 per cent compared to February2016. Similarly, the average selling price was up by 27.7 per cent year-over-year to $875,983.Annual rates of price growth continued to be strongest for low-rise home types, particularlydetached houses. Growth rates for condominium apartment prices were also in the doubledigits, likely a result of strong demand from first-time buyers.
"The listing supply crunch we are experiencing in the GTA has undoubtedly led to the double-digit home price increases we are now experiencing on a sustained basis, both in the low-riseand high-rise market segments. Until we see a marked increase in the number of homesavailable for sale, expect very strong annual rates of price growth to continue," said JasonMercer, TREB's Director of Market Analysis.
TREB MLS® Sales Activity
8,014 7,583
February 2017 February 2016
TREB MLS® Average Price
$875,983
$685,738
February 2017 February 2016
Year-Over-Year Summary2017 2016 % Chg.
SalesNew ListingsActive ListingsAverage PriceAverage DOM
8,014 7,583 5.7%9,834 11,234 -12.5%5,400 10,902 -50.5%
$875,983 $685,738 27.7%13 21 -38.1%
Sources and Notes:
i - Statistics Canada, Quarter-over-quartergrowth, annualized
ii - Statistics Canada, Year-over-yeargrowth for the most recently reportedmonth
iii - Bank of Canada, Rate from mostrecent Bank of Canada announcement
iv - Bank of Canada, Rates for mostrecently completed month
Real GDP GrowthQ3 2016 3.5%
Toronto UnemploymentRate December 2016 6.8%
Inflation Rate (Yr./Yr. CPIGrowth) January 2017 2.1%
Bank of Canada OvernightRate February 2017 -- 0.50%
Prime Rate February 2017 -- 2.70%
Economic Indicators
Metrics Sales Average Price416 905 Total 416 905 Total
2017DetachedSemi - DetachedTownhouseCondo Apartment
793 2,928 3,721 $1,573,622 $1,106,201 $1,205,815199 452 651 $1,085,484 $712,276 $826,359257 908 1,165 $671,243 $653,584 $657,480
1,632 728 2,360 $515,424 $404,460 $481,194
Sales & Average Price By Major Home TypeFebruary 2017
February 2017
i
ii
ii
iii
iv
DetachedSemi - DetachedTownhouseCondo Apartment
29.8% 35.4% 32.5%27.6% 33.2% 29.4%15.7% 32.4% 28.0%18.2% 23.6% 19.2%
DetachedSemi - DetachedTownhouseCondo Apartment
-6.8% 6.0% 3.0%-16.0% -6.2% -9.5%2.4% 7.7% 6.5%
14.0% 20.3% 15.9%
1,7
1,7
1,7
1,7
Year-Over-Year Per Cent Change
Mortgage Rates
Toronto Real Estate Board
Market Watch, February 2017
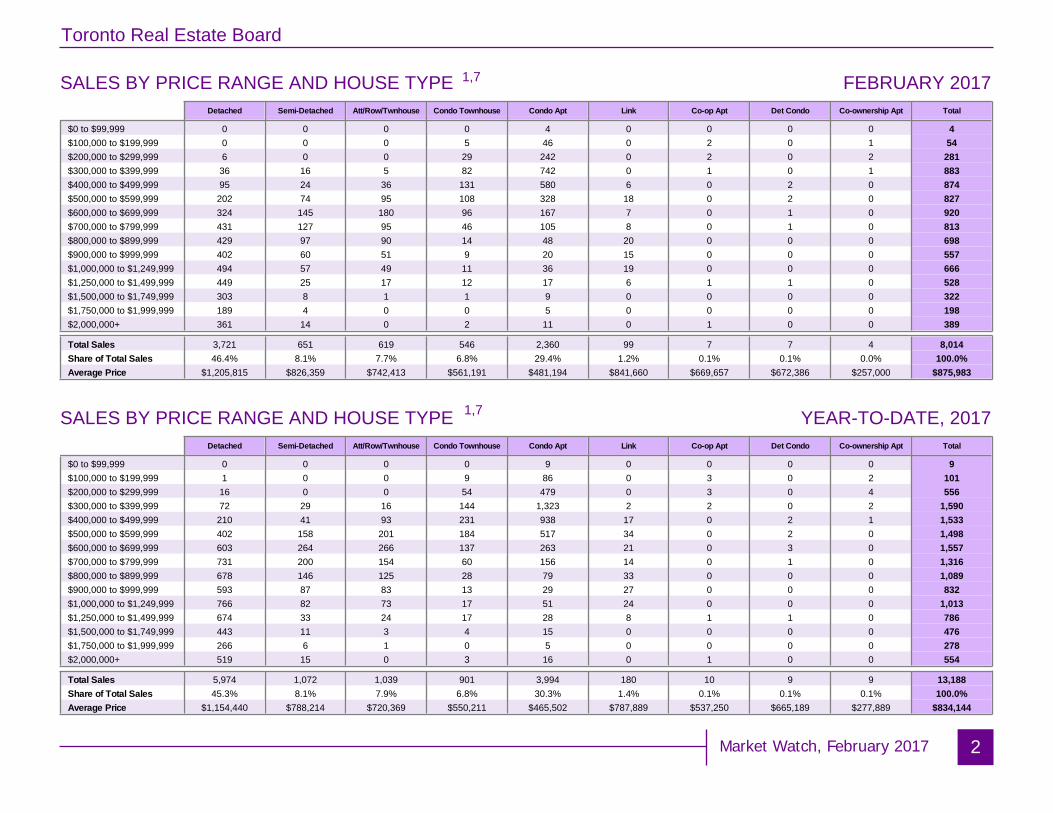
SALES BY PRICE RANGE AND HOUSE TYPE FEBRUARY 2017
2
Price Range Detached Semi-Detached Att/Row/Twnhouse Condo Townhouse Condo Apt Link Co-op Apt Det Condo Co-ownership Apt Total
$0 to $99,999$100,000 to $199,999$200,000 to $299,999$300,000 to $399,999$400,000 to $499,999$500,000 to $599,999$600,000 to $699,999$700,000 to $799,999$800,000 to $899,999$900,000 to $999,999$1,000,000 to $1,249,999$1,250,000 to $1,499,999$1,500,000 to $1,749,999$1,750,000 to $1,999,999$2,000,000+
0 0 0 0 4 0 0 0 0 40 0 0 5 46 0 2 0 1 546 0 0 29 242 0 2 0 2 281
36 16 5 82 742 0 1 0 1 88395 24 36 131 580 6 0 2 0 874202 74 95 108 328 18 0 2 0 827324 145 180 96 167 7 0 1 0 920431 127 95 46 105 8 0 1 0 813429 97 90 14 48 20 0 0 0 698402 60 51 9 20 15 0 0 0 557494 57 49 11 36 19 0 0 0 666449 25 17 12 17 6 1 1 0 528303 8 1 1 9 0 0 0 0 322189 4 0 0 5 0 0 0 0 198361 14 0 2 11 0 1 0 0 389
Price Range Detached Semi-Detached Att/Row/Twnhouse Condo Townhouse Condo Apt Link Co-op Apt Det Condo Co-ownership Apt Total
$0 to $99,999$100,000 to $199,999$200,000 to $299,999$300,000 to $399,999$400,000 to $499,999$500,000 to $599,999$600,000 to $699,999$700,000 to $799,999$800,000 to $899,999$900,000 to $999,999$1,000,000 to $1,249,999$1,250,000 to $1,499,999$1,500,000 to $1,749,999$1,750,000 to $1,999,999$2,000,000+
0 0 0 0 9 0 0 0 0 91 0 0 9 86 0 3 0 2 101
16 0 0 54 479 0 3 0 4 55672 29 16 144 1,323 2 2 0 2 1,590210 41 93 231 938 17 0 2 1 1,533402 158 201 184 517 34 0 2 0 1,498603 264 266 137 263 21 0 3 0 1,557731 200 154 60 156 14 0 1 0 1,316678 146 125 28 79 33 0 0 0 1,089593 87 83 13 29 27 0 0 0 832766 82 73 17 51 24 0 0 0 1,013674 33 24 17 28 8 1 1 0 786443 11 3 4 15 0 0 0 0 476266 6 1 0 5 0 0 0 0 278519 15 0 3 16 0 1 0 0 554
SALES BY PRICE RANGE AND HOUSE TYPE YEAR-TO-DATE, 2017
Total SalesShare of Total SalesAverage Price
3,721 651 619 546 2,360 99 7 7 4 8,01446.4% 8.1% 7.7% 6.8% 29.4% 1.2% 0.1% 0.1% 0.0% 100.0%
$1,205,815 $826,359 $742,413 $561,191 $481,194 $841,660 $669,657 $672,386 $257,000 $875,983
Total SalesShare of Total SalesAverage Price
5,974 1,072 1,039 901 3,994 180 10 9 9 13,18845.3% 8.1% 7.9% 6.8% 30.3% 1.4% 0.1% 0.1% 0.1% 100.0%
$1,154,440 $788,214 $720,369 $550,211 $465,502 $787,889 $537,250 $665,189 $277,889 $834,144
1,7
1,7

Toronto Real Estate Board
Market Watch, February 2017
Number of Sales Dollar Volume Average Price Median Price New Listings SNLR (Trend) Active Listings Mos. Inv. (Trend) Avg. SP / LP Avg. DOMTREB TotalHalton Region
BurlingtonHalton HillsMiltonOakville
Peel RegionBramptonCaledonMississauga
City of TorontoToronto WestToronto CentralToronto East
York RegionAuroraE. GwillimburyGeorginaKingMarkhamNewmarketRichmond HillVaughanWhitchurch-Stouffville
Durham RegionAjaxBrockClaringtonOshawaPickeringScugogUxbridgeWhitby
Dufferin CountyOrangeville
Simcoe CountyAdjala-TosorontioBradford WestGwillimburyEssaInnisfilNew Tecumseth
8,014 $7,020,127,896 875,983 $715,000 9,834 75.4% 5,400 1.0 108% 13788 $800,248,991 1,015,544 $853,750 962 80.8% 538 1.0 106% 13209 $169,162,280 809,389 $755,500 257 82.6% 140 1.0 104% 1571 $51,613,898 726,956 $720,000 117 81.0% 85 1.1 105% 17
162 $129,386,607 798,683 $778,000 183 84.6% 78 0.7 108% 8346 $450,086,206 1,300,827 $1,199,000 405 77.7% 235 1.1 106% 13
1,626 $1,193,157,591 733,799 $685,000 1,960 76.8% 897 0.9 107% 11788 $571,496,051 725,249 $690,000 929 76.7% 315 0.7 106% 959 $57,329,556 971,687 $875,000 88 71.5% 86 1.6 102% 17
779 $564,331,984 724,431 $660,000 943 77.4% 496 1.0 108% 122,900 $2,491,638,578 859,186 $608,500 3,586 72.8% 2,298 1.2 108% 15759 $537,363,457 707,989 $600,000 956 73.6% 656 1.3 108% 17
1,489 $1,469,053,018 986,604 $576,000 1,851 71.1% 1,260 1.4 107% 15652 $485,222,103 744,206 $730,000 779 75.6% 382 0.9 114% 12
1,568 $1,785,004,272 1,138,396 $1,019,000 2,018 72.2% 1,059 1.0 110% 12115 $128,168,682 1,114,510 $1,050,000 141 75.2% 72 0.8 112% 1137 $35,998,601 972,935 $942,000 56 75.1% 41 1.5 107% 2099 $66,457,308 671,286 $634,000 112 76.6% 57 1.1 109% 1450 $79,246,345 1,584,927 $1,374,000 62 62.7% 61 2.5 101% 24
372 $426,084,445 1,145,388 $1,021,500 500 70.9% 276 1.0 111% 13153 $162,191,774 1,060,077 $1,030,000 211 79.9% 78 0.6 114% 7314 $401,135,655 1,277,502 $1,320,444 397 70.0% 184 1.0 112% 10377 $426,527,068 1,131,372 $1,000,000 457 71.7% 237 1.1 109% 1151 $59,194,394 1,160,674 $960,000 82 74.0% 53 1.0 110% 15
833 $553,949,410 665,005 $630,000 976 82.1% 398 0.6 110% 10124 $86,827,298 700,220 $672,443 153 80.0% 59 0.5 112% 913 $5,786,990 445,153 $370,000 17 79.2% 14 2.2 99% 37
137 $80,196,191 585,374 $550,500 161 84.4% 77 0.7 111% 9233 $140,178,548 601,625 $580,000 278 83.3% 96 0.5 113% 796 $71,719,200 747,075 $706,500 112 80.6% 44 0.7 108% 1034 $22,553,320 663,333 $612,500 40 77.8% 23 1.3 101% 1821 $20,217,300 962,729 $942,500 20 78.3% 28 1.7 99% 55
175 $126,470,563 722,689 $725,000 195 83.2% 57 0.5 112% 848 $23,080,555 480,845 $485,000 57 90.5% 26 0.7 105% 1048 $23,080,555 480,845 $485,000 57 90.5% 26 0.7 105% 10
251 $173,048,499 689,436 $635,000 275 80.8% 184 1.2 103% 1712 $7,427,400 618,950 $552,500 16 81.5% 25 2.0 99% 2980 $69,795,300 872,441 $811,000 85 79.4% 37 0.9 105% 1331 $16,546,300 533,752 $477,000 34 79.7% 34 1.3 101% 1360 $35,622,999 593,717 $557,500 66 78.4% 42 1.3 102% 1868 $43,656,500 642,007 $593,000 74 85.8% 46 1.1 101% 22
SUMMARY OF EXISTING HOME TRANSACTIONS ALL HOME TYPES, FEBRUARY 2017ALL TREB AREAS
3
1 1 1 2 5498 3
Toronto Real Estate Board
Market Watch, February 2017
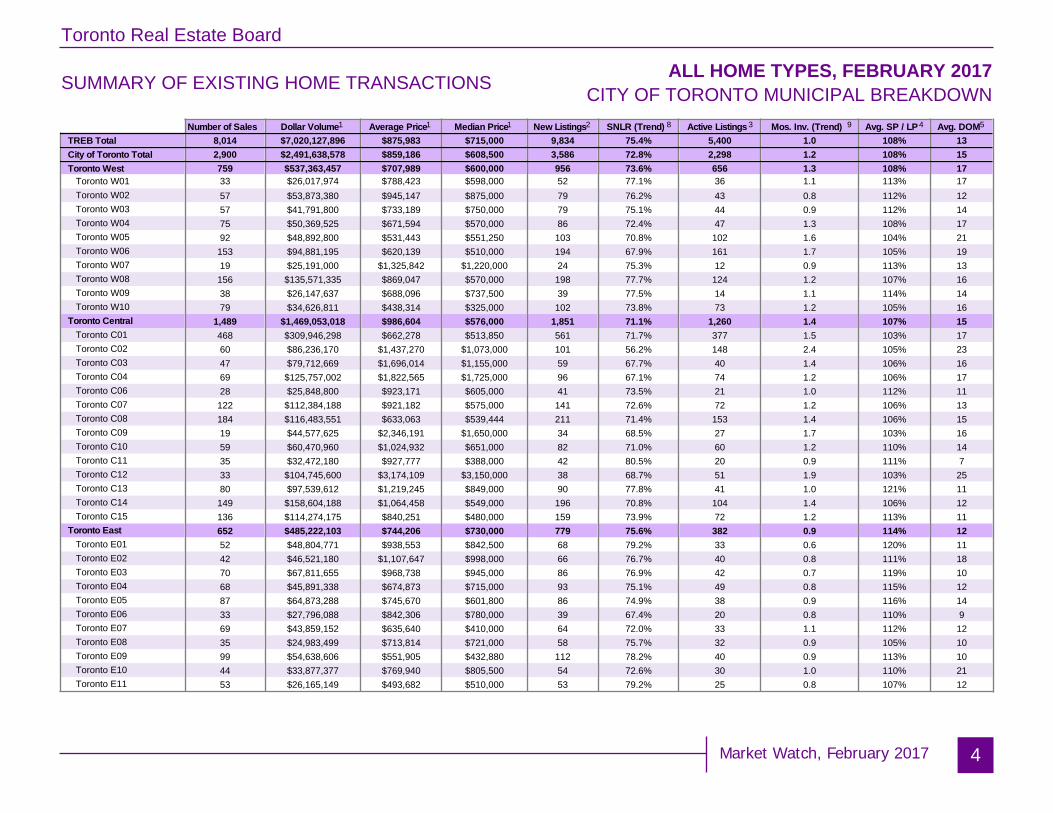
SUMMARY OF EXISTING HOME TRANSACTIONS ALL HOME TYPES, FEBRUARY 2017CITY OF TORONTO MUNICIPAL BREAKDOWN
4
Number of Sales Dollar Volume Average Price Median Price New Listings SNLR (Trend) Active Listings Mos. Inv. (Trend) Avg. SP / LP Avg. DOMTREB TotalCity of Toronto TotalToronto West
Toronto W01Toronto W02Toronto W03Toronto W04Toronto W05Toronto W06Toronto W07Toronto W08Toronto W09Toronto W10
Toronto CentralToronto C01Toronto C02Toronto C03Toronto C04Toronto C06Toronto C07Toronto C08Toronto C09Toronto C10Toronto C11Toronto C12Toronto C13Toronto C14Toronto C15
Toronto EastToronto E01Toronto E02Toronto E03Toronto E04Toronto E05Toronto E06Toronto E07Toronto E08Toronto E09Toronto E10Toronto E11
8,014 $7,020,127,896 $875,983 $715,000 9,834 75.4% 5,400 1.0 108% 132,900 $2,491,638,578 $859,186 $608,500 3,586 72.8% 2,298 1.2 108% 15759 $537,363,457 $707,989 $600,000 956 73.6% 656 1.3 108% 1733 $26,017,974 $788,423 $598,000 52 77.1% 36 1.1 113% 1757 $53,873,380 $945,147 $875,000 79 76.2% 43 0.8 112% 1257 $41,791,800 $733,189 $750,000 79 75.1% 44 0.9 112% 1475 $50,369,525 $671,594 $570,000 86 72.4% 47 1.3 108% 1792 $48,892,800 $531,443 $551,250 103 70.8% 102 1.6 104% 21
153 $94,881,195 $620,139 $510,000 194 67.9% 161 1.7 105% 1919 $25,191,000 $1,325,842 $1,220,000 24 75.3% 12 0.9 113% 13
156 $135,571,335 $869,047 $570,000 198 77.7% 124 1.2 107% 1638 $26,147,637 $688,096 $737,500 39 77.5% 14 1.1 114% 1479 $34,626,811 $438,314 $325,000 102 73.8% 73 1.2 105% 16
1,489 $1,469,053,018 $986,604 $576,000 1,851 71.1% 1,260 1.4 107% 15468 $309,946,298 $662,278 $513,850 561 71.7% 377 1.5 103% 1760 $86,236,170 $1,437,270 $1,073,000 101 56.2% 148 2.4 105% 2347 $79,712,669 $1,696,014 $1,155,000 59 67.7% 40 1.4 106% 1669 $125,757,002 $1,822,565 $1,725,000 96 67.1% 74 1.2 106% 1728 $25,848,800 $923,171 $605,000 41 73.5% 21 1.0 112% 11
122 $112,384,188 $921,182 $575,000 141 72.6% 72 1.2 106% 13184 $116,483,551 $633,063 $539,444 211 71.4% 153 1.4 106% 1519 $44,577,625 $2,346,191 $1,650,000 34 68.5% 27 1.7 103% 1659 $60,470,960 $1,024,932 $651,000 82 71.0% 60 1.2 110% 1435 $32,472,180 $927,777 $388,000 42 80.5% 20 0.9 111% 733 $104,745,600 $3,174,109 $3,150,000 38 68.7% 51 1.9 103% 2580 $97,539,612 $1,219,245 $849,000 90 77.8% 41 1.0 121% 11
149 $158,604,188 $1,064,458 $549,000 196 70.8% 104 1.4 106% 12136 $114,274,175 $840,251 $480,000 159 73.9% 72 1.2 113% 11652 $485,222,103 $744,206 $730,000 779 75.6% 382 0.9 114% 1252 $48,804,771 $938,553 $842,500 68 79.2% 33 0.6 120% 1142 $46,521,180 $1,107,647 $998,000 66 76.7% 40 0.8 111% 1870 $67,811,655 $968,738 $945,000 86 76.9% 42 0.7 119% 1068 $45,891,338 $674,873 $715,000 93 75.1% 49 0.8 115% 1287 $64,873,288 $745,670 $601,800 86 74.9% 38 0.9 116% 1433 $27,796,088 $842,306 $780,000 39 67.4% 20 0.8 110% 969 $43,859,152 $635,640 $410,000 64 72.0% 33 1.1 112% 1235 $24,983,499 $713,814 $721,000 58 75.7% 32 0.9 105% 1099 $54,638,606 $551,905 $432,880 112 78.2% 40 0.9 113% 1044 $33,877,377 $769,940 $805,500 54 72.6% 30 1.0 110% 2153 $26,165,149 $493,682 $510,000 53 79.2% 25 0.8 107% 12
1 1 1 2 8 3 9 4 5

Toronto Real Estate Board
Market Watch, February 2017
SUMMARY OF EXISTING HOME TRANSACTIONS ALL HOME TYPES, YEAR-TO-DATE 2017ALL TREB AREAS
5
Number of Sales Dollar Volume Average Price Median Price New Listings Avg. SP / LP Avg. DOMTREB TotalHalton Region
BurlingtonHalton HillsMiltonOakville
Peel RegionBramptonCaledonMississauga
City of TorontoToronto WestToronto CentralToronto East
York RegionAuroraE. GwillimburyGeorginaKingMarkhamNewmarketRichmond HillVaughanWhitchurch-Stouffville
Durham RegionAjaxBrockClaringtonOshawaPickeringScugogUxbridgeWhitby
Dufferin CountyOrangeville
Simcoe CountyAdjala-TosorontioBradford WestGwillimburyEssaInnisfilNew Tecumseth
13,188 $11,000,687,076 $834,144 $680,000 17,153 107% 151,252 $1,193,460,442 $953,243 $820,000 1,600 104% 16331 $262,182,910 $792,093 $727,500 397 103% 18128 $88,570,988 $691,961 $633,000 182 103% 19270 $205,412,896 $760,789 $723,300 325 106% 11523 $637,293,648 $1,218,535 $1,080,000 696 105% 15
2,701 $1,935,581,847 $716,617 $662,000 3,337 105% 131,313 $923,393,344 $703,270 $670,000 1,564 104% 12100 $91,358,656 $913,587 $830,000 154 101% 24
1,288 $920,829,847 $714,930 $628,000 1,619 106% 144,799 $3,874,256,134 $807,305 $580,000 6,469 107% 171,229 $838,043,219 $681,890 $576,000 1,707 106% 192,452 $2,250,956,258 $918,008 $550,000 3,385 106% 171,118 $785,256,657 $702,376 $685,000 1,377 111% 152,523 $2,774,805,140 $1,099,804 $980,000 3,435 108% 14168 $181,929,276 $1,082,912 $970,000 238 110% 1153 $49,636,389 $936,536 $897,000 86 106% 20
175 $111,465,035 $636,943 $590,000 198 105% 1784 $123,023,621 $1,464,567 $1,310,000 117 99% 28
612 $672,131,601 $1,098,254 $995,000 877 109% 14244 $243,003,580 $995,916 $987,500 316 112% 10514 $636,237,052 $1,237,815 $1,215,000 683 110% 13588 $658,846,304 $1,120,487 $1,000,000 797 107% 1385 $98,532,282 $1,159,203 $958,000 123 106% 21
1,427 $915,234,476 $641,370 $605,000 1,709 108% 12233 $158,400,783 $679,832 $660,000 272 109% 1118 $8,213,490 $456,305 $387,500 23 99% 45
240 $135,939,322 $566,414 $525,000 293 108% 12419 $237,884,624 $567,744 $542,000 495 111% 10164 $117,792,676 $718,248 $676,500 197 106% 1248 $32,949,620 $686,450 $602,450 65 101% 2335 $33,207,700 $948,791 $810,000 40 98% 51
270 $190,846,261 $706,838 $682,000 324 110% 1077 $37,923,174 $492,509 $485,000 96 103% 1577 $37,923,174 $492,509 $485,000 96 103% 15
409 $269,425,863 $658,743 $610,000 507 102% 2021 $13,513,400 $643,495 $525,000 27 97% 36
133 $107,320,163 $806,919 $750,000 154 104% 1652 $25,991,600 $499,838 $462,500 77 100% 1296 $57,115,399 $594,952 $548,750 117 101% 22
107 $65,485,301 $612,012 $561,000 132 100% 22
1 1 1 2 4 5

Toronto Real Estate Board
Market Watch, February 2017
SUMMARY OF EXISTING HOME TRANSACTIONS ALL HOME TYPES, YEAR-TO-DATE 2017CITY OF TORONTO MUNICIPAL BREAKDOWN
6
Number of Sales Dollar Volume Average Price Median Price New Listings Avg. SP / LP Avg. DOMTREB TotalCity of Toronto TotalToronto West
Toronto W01Toronto W02Toronto W03Toronto W04Toronto W05Toronto W06Toronto W07Toronto W08Toronto W09Toronto W10
Toronto CentralToronto C01Toronto C02Toronto C03Toronto C04Toronto C06Toronto C07Toronto C08Toronto C09Toronto C10Toronto C11Toronto C12Toronto C13Toronto C14Toronto C15
Toronto EastToronto E01Toronto E02Toronto E03Toronto E04Toronto E05Toronto E06Toronto E07Toronto E08Toronto E09Toronto E10Toronto E11
13,188 $11,000,687,076 $834,144 $680,000 17,153 107% 154,799 $3,874,256,134 $807,305 $580,000 6,469 107% 171,229 $838,043,219 $681,890 $576,000 1,707 106% 19
61 $49,351,673 $809,044 $575,000 87 108% 2193 $85,677,333 $921,262 $909,999 132 110% 1486 $61,325,617 $713,089 $707,500 126 110% 15
114 $72,751,213 $638,169 $533,500 146 105% 20160 $81,710,525 $510,691 $517,500 206 103% 24229 $136,895,025 $597,795 $495,000 360 104% 2235 $44,540,700 $1,272,591 $1,200,000 44 111% 15
245 $198,116,394 $808,638 $516,000 345 106% 1669 $46,857,848 $679,099 $750,000 75 110% 17
137 $60,816,891 $443,919 $344,500 186 103% 182,452 $2,250,956,258 $918,008 $550,000 3,385 106% 17800 $500,673,276 $625,842 $495,500 1,056 103% 1998 $134,128,741 $1,368,661 $1,043,000 211 105% 2565 $97,226,049 $1,495,785 $1,024,990 109 106% 16
100 $170,690,720 $1,706,907 $1,662,500 160 105% 2046 $40,693,500 $884,641 $552,500 65 111% 13
212 $188,473,019 $889,024 $567,500 251 104% 16276 $167,785,989 $607,920 $530,000 392 105% 1825 $53,436,625 $2,137,465 $1,650,000 48 103% 1597 $93,984,410 $968,911 $645,000 149 108% 1658 $49,120,280 $846,901 $384,000 68 110% 1357 $171,726,400 $3,012,744 $3,050,000 92 103% 21
115 $141,632,238 $1,231,585 $785,000 156 117% 14260 $251,774,438 $968,363 $505,000 337 105% 15243 $189,610,573 $780,290 $470,000 291 108% 14
1,118 $785,256,657 $702,376 $685,000 1,377 111% 1585 $79,487,491 $935,147 $829,000 112 118% 1360 $62,973,623 $1,049,560 $940,500 92 111% 17
104 $96,366,022 $926,596 $907,500 146 116% 13130 $82,540,326 $634,926 $693,500 160 111% 15147 $103,905,728 $706,842 $551,000 162 112% 1752 $42,470,102 $816,733 $750,000 65 108% 12
111 $62,434,740 $562,475 $360,000 139 110% 1372 $55,430,098 $769,862 $729,500 103 104% 12
168 $87,640,691 $521,671 $404,750 193 109% 1385 $61,986,577 $729,254 $751,000 101 107% 22
104 $50,021,259 $480,974 $468,450 104 105% 16
1 1 1 2 4 5
Toronto Real Estate Board
Market Watch, February 2017
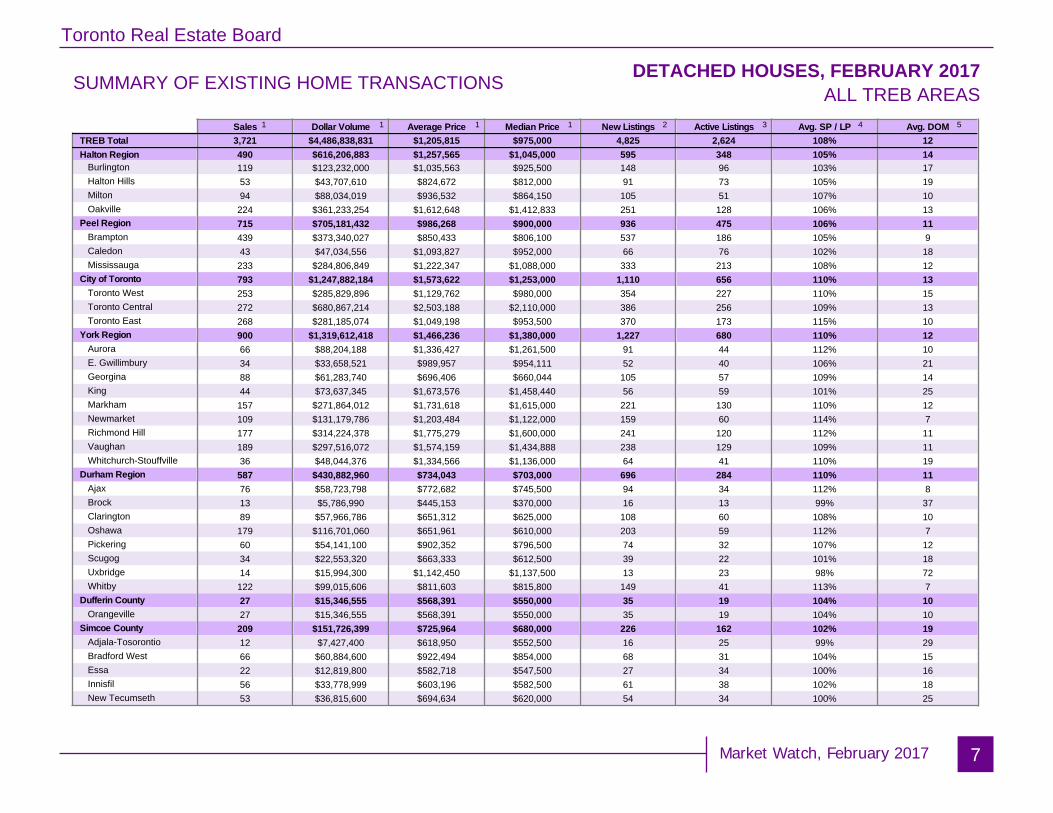
SUMMARY OF EXISTING HOME TRANSACTIONS DETACHED HOUSES, FEBRUARY 2017ALL TREB AREAS
7
Sales Dollar Volume Average Price Median Price New Listings Active Listings Avg. SP / LP Avg. DOMTREB TotalHalton Region
BurlingtonHalton HillsMiltonOakville
Peel RegionBramptonCaledonMississauga
City of TorontoToronto WestToronto CentralToronto East
York RegionAuroraE. GwillimburyGeorginaKingMarkhamNewmarketRichmond HillVaughanWhitchurch-Stouffville
Durham RegionAjaxBrockClaringtonOshawaPickeringScugogUxbridgeWhitby
Dufferin CountyOrangeville
Simcoe CountyAdjala-TosorontioBradford WestGwillimburyEssaInnisfilNew Tecumseth
3,721 $4,486,838,831 $1,205,815 $975,000 4,825 2,624 108% 12490 $616,206,883 $1,257,565 $1,045,000 595 348 105% 14119 $123,232,000 $1,035,563 $925,500 148 96 103% 1753 $43,707,610 $824,672 $812,000 91 73 105% 1994 $88,034,019 $936,532 $864,150 105 51 107% 10
224 $361,233,254 $1,612,648 $1,412,833 251 128 106% 13715 $705,181,432 $986,268 $900,000 936 475 106% 11439 $373,340,027 $850,433 $806,100 537 186 105% 943 $47,034,556 $1,093,827 $952,000 66 76 102% 18
233 $284,806,849 $1,222,347 $1,088,000 333 213 108% 12793 $1,247,882,184 $1,573,622 $1,253,000 1,110 656 110% 13253 $285,829,896 $1,129,762 $980,000 354 227 110% 15272 $680,867,214 $2,503,188 $2,110,000 386 256 109% 13268 $281,185,074 $1,049,198 $953,500 370 173 115% 10900 $1,319,612,418 $1,466,236 $1,380,000 1,227 680 110% 1266 $88,204,188 $1,336,427 $1,261,500 91 44 112% 1034 $33,658,521 $989,957 $954,111 52 40 106% 2188 $61,283,740 $696,406 $660,044 105 57 109% 1444 $73,637,345 $1,673,576 $1,458,440 56 59 101% 25
157 $271,864,012 $1,731,618 $1,615,000 221 130 110% 12109 $131,179,786 $1,203,484 $1,122,000 159 60 114% 7177 $314,224,378 $1,775,279 $1,600,000 241 120 112% 11189 $297,516,072 $1,574,159 $1,434,888 238 129 109% 1136 $48,044,376 $1,334,566 $1,136,000 64 41 110% 19
587 $430,882,960 $734,043 $703,000 696 284 110% 1176 $58,723,798 $772,682 $745,500 94 34 112% 813 $5,786,990 $445,153 $370,000 16 13 99% 3789 $57,966,786 $651,312 $625,000 108 60 108% 10
179 $116,701,060 $651,961 $610,000 203 59 112% 760 $54,141,100 $902,352 $796,500 74 32 107% 1234 $22,553,320 $663,333 $612,500 39 22 101% 1814 $15,994,300 $1,142,450 $1,137,500 13 23 98% 72
122 $99,015,606 $811,603 $815,800 149 41 113% 727 $15,346,555 $568,391 $550,000 35 19 104% 1027 $15,346,555 $568,391 $550,000 35 19 104% 10
209 $151,726,399 $725,964 $680,000 226 162 102% 1912 $7,427,400 $618,950 $552,500 16 25 99% 2966 $60,884,600 $922,494 $854,000 68 31 104% 1522 $12,819,800 $582,718 $547,500 27 34 100% 1656 $33,778,999 $603,196 $582,500 61 38 102% 1853 $36,815,600 $694,634 $620,000 54 34 100% 25
1 2 3 4 51 1 1
Toronto Real Estate Board
Market Watch, February 2017
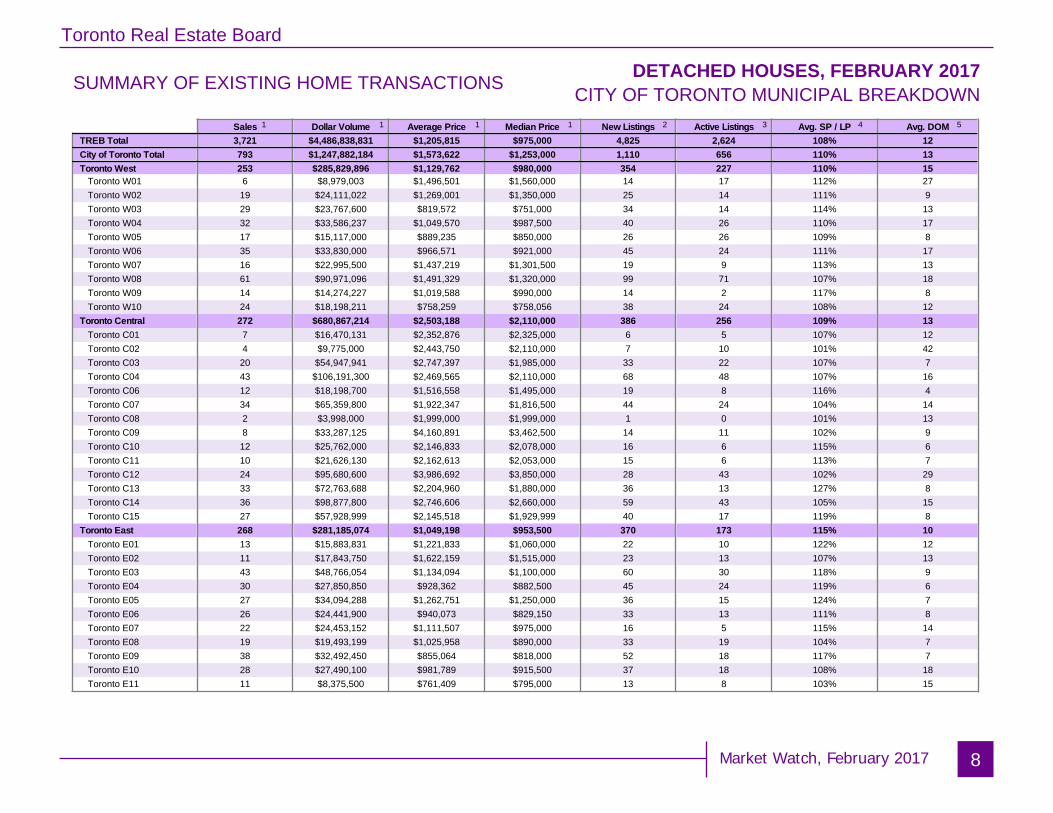
SUMMARY OF EXISTING HOME TRANSACTIONS DETACHED HOUSES, FEBRUARY 2017CITY OF TORONTO MUNICIPAL BREAKDOWN
8
Sales Dollar Volume Average Price Median Price New Listings Active Listings Avg. SP / LP Avg. DOMTREB TotalCity of Toronto TotalToronto West
Toronto W01Toronto W02Toronto W03Toronto W04Toronto W05Toronto W06Toronto W07Toronto W08Toronto W09Toronto W10
Toronto CentralToronto C01Toronto C02Toronto C03Toronto C04Toronto C06Toronto C07Toronto C08Toronto C09Toronto C10Toronto C11Toronto C12Toronto C13Toronto C14Toronto C15
Toronto EastToronto E01Toronto E02Toronto E03Toronto E04Toronto E05Toronto E06Toronto E07Toronto E08Toronto E09Toronto E10Toronto E11
3,721 $4,486,838,831 $1,205,815 $975,000 4,825 2,624 108% 12793 $1,247,882,184 $1,573,622 $1,253,000 1,110 656 110% 13253 $285,829,896 $1,129,762 $980,000 354 227 110% 156 $8,979,003 $1,496,501 $1,560,000 14 17 112% 2719 $24,111,022 $1,269,001 $1,350,000 25 14 111% 929 $23,767,600 $819,572 $751,000 34 14 114% 1332 $33,586,237 $1,049,570 $987,500 40 26 110% 1717 $15,117,000 $889,235 $850,000 26 26 109% 835 $33,830,000 $966,571 $921,000 45 24 111% 1716 $22,995,500 $1,437,219 $1,301,500 19 9 113% 1361 $90,971,096 $1,491,329 $1,320,000 99 71 107% 1814 $14,274,227 $1,019,588 $990,000 14 2 117% 824 $18,198,211 $758,259 $758,056 38 24 108% 12
272 $680,867,214 $2,503,188 $2,110,000 386 256 109% 137 $16,470,131 $2,352,876 $2,325,000 6 5 107% 124 $9,775,000 $2,443,750 $2,110,000 7 10 101% 4220 $54,947,941 $2,747,397 $1,985,000 33 22 107% 743 $106,191,300 $2,469,565 $2,110,000 68 48 107% 1612 $18,198,700 $1,516,558 $1,495,000 19 8 116% 434 $65,359,800 $1,922,347 $1,816,500 44 24 104% 142 $3,998,000 $1,999,000 $1,999,000 1 0 101% 138 $33,287,125 $4,160,891 $3,462,500 14 11 102% 912 $25,762,000 $2,146,833 $2,078,000 16 6 115% 610 $21,626,130 $2,162,613 $2,053,000 15 6 113% 724 $95,680,600 $3,986,692 $3,850,000 28 43 102% 2933 $72,763,688 $2,204,960 $1,880,000 36 13 127% 836 $98,877,800 $2,746,606 $2,660,000 59 43 105% 1527 $57,928,999 $2,145,518 $1,929,999 40 17 119% 8
268 $281,185,074 $1,049,198 $953,500 370 173 115% 1013 $15,883,831 $1,221,833 $1,060,000 22 10 122% 1211 $17,843,750 $1,622,159 $1,515,000 23 13 107% 1343 $48,766,054 $1,134,094 $1,100,000 60 30 118% 930 $27,850,850 $928,362 $882,500 45 24 119% 627 $34,094,288 $1,262,751 $1,250,000 36 15 124% 726 $24,441,900 $940,073 $829,150 33 13 111% 822 $24,453,152 $1,111,507 $975,000 16 5 115% 1419 $19,493,199 $1,025,958 $890,000 33 19 104% 738 $32,492,450 $855,064 $818,000 52 18 117% 728 $27,490,100 $981,789 $915,500 37 18 108% 1811 $8,375,500 $761,409 $795,000 13 8 103% 15
1 1 1 1 2 3 4 5

Toronto Real Estate Board
Market Watch, February 2017
SUMMARY OF EXISTING HOME TRANSACTIONS SEMI-DETACHED HOUSES, FEBRUARY 2017ALL TREB AREAS
9
Sales Dollar Volume Average Price Median Price New Listings Active Listings Avg. SP / LP Avg. DOMTREB TotalHalton Region
BurlingtonHalton HillsMiltonOakville
Peel RegionBramptonCaledonMississauga
City of TorontoToronto WestToronto CentralToronto East
York RegionAuroraE. GwillimburyGeorginaKingMarkhamNewmarketRichmond HillVaughanWhitchurch-Stouffville
Durham RegionAjaxBrockClaringtonOshawaPickeringScugogUxbridgeWhitby
Dufferin CountyOrangeville
Simcoe CountyAdjala-TosorontioBradford WestGwillimburyEssaInnisfilNew Tecumseth
651 $537,959,973 $826,359 $750,000 776 268 113% 735 $25,113,600 $717,531 $721,000 44 14 110% 65 $3,421,500 $684,300 $696,000 5 2 108% 62 $1,161,000 $580,500 $580,500 7 4 107% 516 $10,756,600 $672,288 $701,000 20 5 112% 512 $9,774,500 $814,542 $787,650 12 3 108% 9
244 $170,988,832 $700,774 $691,000 288 81 109% 6130 $84,494,389 $649,957 $650,000 147 39 108% 58 $5,058,000 $632,250 $635,000 9 2 104% 23
106 $81,436,443 $768,268 $765,250 132 40 111% 7199 $216,011,241 $1,085,484 $912,500 254 123 115% 959 $47,076,835 $797,912 $777,500 78 45 113% 1473 $106,025,544 $1,452,405 $1,200,000 89 44 113% 867 $62,908,862 $938,938 $875,000 87 34 121% 795 $85,539,550 $900,416 $908,000 109 29 117% 69 $8,006,700 $889,633 $920,000 8 1 114% 140 - - - 0 0 - -3 $1,857,000 $619,000 $570,000 2 0 104% 101 $930,000 $930,000 $930,000 0 0 99% 3229 $28,315,244 $976,388 $943,888 42 14 121% 616 $11,993,988 $749,624 $749,844 18 5 117% 48 $7,688,800 $961,100 $910,000 8 2 118% 326 $24,274,000 $933,615 $950,000 28 6 116% 43 $2,473,818 $824,606 $820,000 3 1 116% 360 $31,331,550 $522,193 $512,750 61 17 114% 1014 $8,735,600 $623,971 $637,500 13 5 109% 150 - - - 0 0 - -9 $4,289,650 $476,628 $500,000 7 0 114% 629 $13,597,800 $468,890 $450,000 31 8 119% 92 $1,175,000 $587,500 $587,500 4 2 100% 80 - - - 0 0 - -1 $495,000 $495,000 $495,000 0 0 99% 325 $3,038,500 $607,700 $590,500 6 2 120% 57 $2,752,500 $393,214 $390,000 7 1 107% 87 $2,752,500 $393,214 $390,000 7 1 107% 811 $6,222,700 $565,700 $678,500 13 3 112% 40 - - - 0 0 - -6 $4,307,700 $717,950 $712,000 5 0 116% 40 - - - 0 0 - -0 - - - 0 0 - -5 $1,915,000 $383,000 $385,000 8 3 105% 4
1 1 1 1 2 3 4 5

Toronto Real Estate Board
Market Watch, February 2017
SUMMARY OF EXISTING HOME TRANSACTIONS SEMI-DETACHED HOUSES, FEBRUARY 2017CITY OF TORONTO MUNICIPAL BREAKDOWN
10
Sales Dollar Volume Average Price Median Price New Listings Active Listings Avg. SP / LP Avg. DOMTREB TotalCity of Toronto TotalToronto West
Toronto W01Toronto W02Toronto W03Toronto W04Toronto W05Toronto W06Toronto W07Toronto W08Toronto W09Toronto W10
Toronto CentralToronto C01Toronto C02Toronto C03Toronto C04Toronto C06Toronto C07Toronto C08Toronto C09Toronto C10Toronto C11Toronto C12Toronto C13Toronto C14Toronto C15
Toronto EastToronto E01Toronto E02Toronto E03Toronto E04Toronto E05Toronto E06Toronto E07Toronto E08Toronto E09Toronto E10Toronto E11
651 $537,959,973 $826,359 $750,000 776 268 113% 7199 $216,011,241 $1,085,484 $912,500 254 123 115% 959 $47,076,835 $797,912 $777,500 78 45 113% 142 $2,479,000 $1,239,500 $1,239,500 3 2 134% 412 $11,738,958 $978,247 $931,250 23 15 123% 912 $9,632,400 $802,700 $800,500 22 14 113% 141 $560,500 $560,500 $560,500 2 2 100% 323 $15,626,200 $679,400 $645,000 14 6 103% 202 $1,605,000 $802,500 $802,500 5 4 107% 170 - - - 0 0 - -2 $1,808,777 $904,389 $904,389 3 1 129% 52 $1,725,000 $862,500 $862,500 3 1 124% 73 $1,901,000 $633,667 $651,000 3 0 104% 573 $106,025,544 $1,452,405 $1,200,000 89 44 113% 813 $18,742,616 $1,441,740 $1,283,791 13 8 111% 814 $28,832,000 $2,059,429 $1,851,500 18 15 116% 95 $7,935,018 $1,587,004 $1,300,000 3 0 107% 134 $5,429,000 $1,357,250 $1,400,500 4 2 118% 60 - - - 0 0 - -4 $4,175,000 $1,043,750 $990,000 6 3 125% 58 $11,656,788 $1,457,099 $1,528,444 8 0 111% 71 $1,332,500 $1,332,500 $1,332,500 4 2 95% 27 $11,490,122 $1,641,446 $1,200,000 10 7 109% 102 $2,471,000 $1,235,500 $1,235,500 2 1 105% 110 - - - 0 0 - -6 $5,025,700 $837,617 $849,000 6 2 120% 60 - - - 0 0 - -9 $8,935,800 $992,867 $995,000 15 4 116% 767 $62,908,862 $938,938 $875,000 87 34 121% 714 $16,008,974 $1,143,498 $1,180,444 20 9 129% 819 $19,418,100 $1,022,005 $990,000 27 12 117% 711 $11,012,600 $1,001,145 $903,000 12 5 129% 511 $7,777,000 $707,000 $700,000 13 3 114% 72 $1,688,000 $844,000 $844,000 3 1 106% 141 $691,088 $691,088 $691,088 2 1 99% 91 $830,000 $830,000 $830,000 3 2 119% 70 - - - 0 0 - -2 $1,335,100 $667,550 $667,550 1 0 118% 71 $850,000 $850,000 $850,000 1 0 160% 65 $3,298,000 $659,600 $615,000 5 1 117% 7
1 1 1 1 2 3 4 5

Toronto Real Estate Board
Market Watch, February 2017
SUMMARY OF EXISTING HOME TRANSACTIONS CONDOMINIUM TOWNHOUSES, FEBRUARY 2017ALL TREB AREAS
11
Sales Dollar Volume Average Price Median Price New Listings Active Listings Avg. SP / LP Avg. DOMTREB TotalHalton Region
BurlingtonHalton HillsMiltonOakville
Peel RegionBramptonCaledonMississauga
City of TorontoToronto WestToronto CentralToronto East
York RegionAuroraE. GwillimburyGeorginaKingMarkhamNewmarketRichmond HillVaughanWhitchurch-Stouffville
Durham RegionAjaxBrockClaringtonOshawaPickeringScugogUxbridgeWhitby
Dufferin CountyOrangeville
Simcoe CountyAdjala-TosorontioBradford WestGwillimburyEssaInnisfilNew Tecumseth
546 $306,410,441 $561,191 $527,500 636 316 110% 1275 $41,735,488 $556,473 $500,000 77 26 108% 1027 $15,400,400 $570,385 $570,000 31 9 107% 1210 $4,000,400 $400,040 $407,500 10 3 109% 115 $2,257,600 $451,520 $465,000 3 1 111% 533 $20,077,088 $608,397 $535,000 33 13 107% 9
173 $91,305,987 $527,780 $525,000 205 81 111% 1152 $23,559,200 $453,062 $450,000 63 28 107% 170 - - - 0 0 - -
121 $67,746,787 $559,891 $565,000 142 53 112% 9189 $112,783,071 $596,736 $561,000 217 142 109% 1570 $36,113,477 $515,907 $463,000 77 52 107% 1653 $41,566,767 $784,279 $650,000 75 58 109% 1366 $35,102,827 $531,861 $549,250 65 32 110% 1458 $39,749,595 $685,338 $646,500 78 40 110% 914 $10,767,500 $769,107 $655,500 10 4 103% 110 - - - 0 0 - -1 $359,900 $359,900 $359,900 0 0 100% 410 - - - 0 0 - -17 $11,660,388 $685,905 $630,000 26 16 117% 87 $5,396,000 $770,857 $740,000 12 7 113% 96 $3,830,000 $638,333 $715,000 10 5 111% 912 $7,315,807 $609,651 $625,000 19 8 108% 41 $420,000 $420,000 $420,000 1 0 105% 1548 $19,749,300 $411,444 $421,000 57 27 114% 86 $2,997,500 $499,583 $495,000 10 7 111% 90 - - - 1 1 - -4 $1,544,000 $386,000 $392,500 5 1 128% 412 $3,766,100 $313,842 $308,050 18 9 120% 417 $7,715,200 $453,835 $450,000 15 3 113% 50 - - - 0 0 - -0 - - - 2 3 - -9 $3,726,500 $414,056 $395,000 6 3 109% 172 $587,000 $293,500 $293,500 1 0 106% 82 $587,000 $293,500 $293,500 1 0 106% 81 $500,000 $500,000 $500,000 1 0 111% 50 - - - 0 0 - -1 $500,000 $500,000 $500,000 1 0 111% 50 - - - 0 0 - -0 - - - 0 0 - -0 - - - 0 0 - -
1 1 1 1 2 3 4 5

Toronto Real Estate Board
Market Watch, February 2017
SUMMARY OF EXISTING HOME TRANSACTIONS CONDOMINIUM TOWNHOUSES, FEBRUARY 2017CITY OF TORONTO MUNICIPAL BREAKDOWN
12
Sales Dollar Volume Average Price Median Price New Listings Active Listings Avg. SP / LP Avg. DOMTREB TotalCity of Toronto TotalToronto West
Toronto W01Toronto W02Toronto W03Toronto W04Toronto W05Toronto W06Toronto W07Toronto W08Toronto W09Toronto W10
Toronto CentralToronto C01Toronto C02Toronto C03Toronto C04Toronto C06Toronto C07Toronto C08Toronto C09Toronto C10Toronto C11Toronto C12Toronto C13Toronto C14Toronto C15
Toronto EastToronto E01Toronto E02Toronto E03Toronto E04Toronto E05Toronto E06Toronto E07Toronto E08Toronto E09Toronto E10Toronto E11
546 $306,410,441 $561,191 $527,500 636 316 110% 12189 $112,783,071 $596,736 $561,000 217 142 109% 1570 $36,113,477 $515,907 $463,000 77 52 107% 163 $1,581,000 $527,000 $580,000 5 2 109% 510 $8,282,000 $828,200 $747,500 7 2 105% 242 $701,000 $350,500 $350,500 1 0 102% 269 $3,600,000 $400,000 $431,000 10 4 105% 818 $7,191,200 $399,511 $412,500 24 31 104% 255 $3,793,000 $758,600 $700,000 6 3 110% 70 - - - 0 0 - -5 $2,969,777 $593,955 $645,000 5 1 115% 88 $5,211,000 $651,375 $569,000 7 2 116% 1710 $2,784,500 $278,450 $245,000 12 7 103% 953 $41,566,767 $784,279 $650,000 75 58 109% 1316 $12,166,001 $760,375 $701,300 25 20 112% 93 $5,141,990 $1,713,997 $2,150,990 1 3 102% 500 - - - 0 1 - -3 $1,505,000 $501,667 $475,000 3 2 100% 90 - - - 0 0 - -2 $931,000 $465,500 $465,500 3 6 102% 114 $3,616,888 $904,222 $828,444 8 5 118% 70 - - - 0 0 - -1 $899,000 $899,000 $899,000 3 2 100% 52 $933,000 $466,500 $466,500 2 3 107% 123 $3,398,000 $1,132,667 $988,000 5 3 109% 152 $1,579,000 $789,500 $789,500 1 1 100% 93 $2,536,000 $845,333 $595,000 8 5 127% 514 $8,860,888 $632,921 $611,244 16 7 110% 1466 $35,102,827 $531,861 $549,250 65 32 110% 145 $3,733,000 $746,600 $648,000 6 6 104% 111 $1,160,000 $1,160,000 $1,160,000 2 2 101% 62 $1,530,000 $765,000 $765,000 2 0 103% 116 $3,072,800 $512,133 $560,650 5 2 108% 1717 $9,785,800 $575,635 $585,000 10 4 111% 190 - - - 0 0 - -6 $3,762,900 $627,150 $630,000 7 2 121% 43 $1,407,000 $469,000 $375,000 8 3 122% 79 $3,393,400 $377,044 $319,000 7 2 113% 234 $1,515,777 $378,944 $440,000 6 6 114% 1813 $5,742,150 $441,704 $430,000 12 5 105% 7
1 1 1 1 2 3 4 5

Toronto Real Estate Board
Market Watch, February 2017
SUMMARY OF EXISTING HOME TRANSACTIONS CONDOMINIUM APARTMENT, FEBRUARY 2017ALL TREB AREAS
13
Sales Dollar Volume Average Price Median Price New Listings Active Listings Avg. SP / LP Avg. DOMTREB TotalHalton Region
BurlingtonHalton HillsMiltonOakville
Peel RegionBramptonCaledonMississauga
City of TorontoToronto WestToronto CentralToronto East
York RegionAuroraE. GwillimburyGeorginaKingMarkhamNewmarketRichmond HillVaughanWhitchurch-Stouffville
Durham RegionAjaxBrockClaringtonOshawaPickeringScugogUxbridgeWhitby
Dufferin CountyOrangeville
Simcoe CountyAdjala-TosorontioBradford WestGwillimburyEssaInnisfilNew Tecumseth
2,360 $1,135,618,639 $481,194 $420,900 2,638 1,791 103% 1678 $35,161,156 $450,784 $392,000 100 94 101% 1638 $14,197,380 $373,615 $331,000 48 25 102% 144 $1,539,000 $384,750 $404,000 3 1 105% 1110 $4,189,500 $418,950 $436,000 10 6 104% 1026 $15,235,276 $585,972 $407,500 39 62 99% 23
325 $116,369,667 $358,061 $340,100 335 198 103% 1642 $13,575,300 $323,221 $311,000 41 25 103% 181 $675,000 $675,000 $675,000 1 1 100% 15
282 $102,119,367 $362,125 $345,000 293 172 103% 151,632 $841,171,803 $515,424 $449,950 1,878 1,301 103% 17351 $146,935,249 $418,619 $390,000 417 316 103% 19
1,066 $615,944,614 $577,809 $485,000 1,247 863 103% 16215 $78,291,940 $364,149 $340,000 214 122 105% 17285 $128,983,298 $452,573 $417,000 277 161 103% 177 $4,017,000 $573,857 $583,000 5 8 103% 100 - - - 1 1 - -3 $740,500 $246,833 $247,500 1 0 97% 381 $628,000 $628,000 $628,000 1 2 100% 4497 $44,911,753 $463,008 $419,888 92 55 104% 206 $2,247,500 $374,583 $349,250 5 2 103% 1280 $33,216,377 $415,205 $388,400 76 30 103% 1391 $43,222,168 $474,969 $430,000 96 57 102% 170 - - - 0 6 - -36 $13,257,715 $368,270 $356,245 39 28 104% 183 $884,000 $294,667 $291,500 8 7 107% 130 - - - 0 0 - -4 $1,184,855 $296,214 $291,000 7 9 100% 405 $1,490,500 $298,100 $275,000 5 6 102% 308 $3,177,500 $397,188 $399,250 11 4 109% 80 - - - 0 0 - -2 $753,000 $376,500 $376,500 1 1 100% 814 $5,767,860 $411,990 $404,745 7 1 103% 154 $675,000 $168,750 $165,000 6 4 99% 244 $675,000 $168,750 $165,000 6 4 99% 240 - - - 3 5 - -0 - - - 0 0 - -0 - - - 2 2 - -0 - - - 0 0 - -0 - - - 1 2 - -0 - - - 0 1 - -
1 1 1 1 2 3 4 5

Toronto Real Estate Board
Market Watch, February 2017
SUMMARY OF EXISTING HOME TRANSACTIONS CONDOMINIUM APARTMENT, FEBRUARY 2017CITY OF TORONTO MUNICIPAL BREAKDOWN
14
Sales Dollar Volume Average Price Median Price New Listings Active Listings Avg. SP / LP Avg. DOMTREB TotalCity of Toronto TotalToronto West
Toronto W01Toronto W02Toronto W03Toronto W04Toronto W05Toronto W06Toronto W07Toronto W08Toronto W09Toronto W10
Toronto CentralToronto C01Toronto C02Toronto C03Toronto C04Toronto C06Toronto C07Toronto C08Toronto C09Toronto C10Toronto C11Toronto C12Toronto C13Toronto C14Toronto C15
Toronto EastToronto E01Toronto E02Toronto E03Toronto E04Toronto E05Toronto E06Toronto E07Toronto E08Toronto E09Toronto E10Toronto E11
2,360 $1,135,618,639 $481,194 $420,900 2,638 1,791 103% 161,632 $841,171,803 $515,424 $449,950 1,878 1,301 103% 17351 $146,935,249 $418,619 $390,000 417 316 103% 1920 $10,743,971 $537,199 $517,550 26 13 109% 1712 $6,172,400 $514,367 $511,000 17 8 112% 99 $3,795,800 $421,756 $479,900 20 16 106% 1429 $9,807,788 $338,200 $299,900 30 15 102% 2130 $8,302,400 $276,747 $257,500 36 37 101% 27
109 $54,210,695 $497,346 $454,600 134 126 101% 201 $320,000 $320,000 $320,000 2 2 94% 2686 $37,751,685 $438,973 $400,750 90 51 104% 1513 $4,087,410 $314,416 $301,000 15 9 101% 2142 $11,743,100 $279,598 $291,000 47 39 100% 20
1,066 $615,944,614 $577,809 $485,000 1,247 863 103% 16423 $253,081,971 $598,303 $485,000 503 336 102% 1738 $42,191,180 $1,110,294 $737,500 70 115 100% 2522 $16,829,710 $764,987 $584,000 22 13 105% 2518 $12,476,702 $693,150 $584,000 20 20 102% 2516 $7,650,100 $478,131 $489,250 22 13 104% 1781 $40,518,388 $500,227 $480,800 84 36 106% 13
166 $93,699,375 $564,454 $519,400 182 139 105% 168 $6,445,000 $805,625 $573,950 11 11 101% 2439 $22,319,838 $572,304 $500,000 51 43 105% 1721 $7,442,050 $354,383 $346,000 23 10 105% 76 $5,667,000 $944,500 $865,000 5 5 109% 1135 $15,921,224 $454,892 $409,500 42 23 102% 15
109 $55,620,388 $510,279 $469,000 126 55 107% 1184 $36,081,688 $429,544 $399,000 86 44 104% 12
215 $78,291,940 $364,149 $340,000 214 122 105% 1716 $9,148,966 $571,810 $523,444 15 5 113% 78 $5,058,330 $632,291 $588,000 7 8 103% 5511 $3,947,001 $358,818 $268,500 10 6 106% 1718 $5,852,788 $325,155 $329,000 25 15 105% 2033 $12,354,200 $374,370 $375,000 30 18 102% 196 $2,663,100 $443,850 $348,850 4 6 103% 1438 $13,256,100 $348,845 $346,500 36 21 104% 1313 $4,083,300 $314,100 $285,900 17 10 106% 1449 $16,756,656 $341,973 $335,000 50 20 105% 106 $1,180,000 $196,667 $179,000 5 4 99% 5017 $3,991,499 $234,794 $210,000 15 9 104% 19
1 1 1 1 2 3 4 5

Toronto Real Estate Board
Market Watch, February 2017
SUMMARY OF EXISTING HOME TRANSACTIONS LINK, FEBRUARY 2017ALL TREB AREAS
15
Sales Dollar Volume Average Price Median Price New Listings Active Listings Avg. SP / LP Avg. DOMTREB TotalHalton Region
BurlingtonHalton HillsMiltonOakville
Peel RegionBramptonCaledonMississauga
City of TorontoToronto WestToronto CentralToronto East
York RegionAuroraE. GwillimburyGeorginaKingMarkhamNewmarketRichmond HillVaughanWhitchurch-Stouffville
Durham RegionAjaxBrockClaringtonOshawaPickeringScugogUxbridgeWhitby
Dufferin CountyOrangeville
Simcoe CountyAdjala-TosorontioBradford WestGwillimburyEssaInnisfilNew Tecumseth
99 $83,324,300 $841,660 $845,800 129 46 113% 79 $7,413,700 $823,744 $845,800 9 1 110% 121 $565,000 $565,000 $565,000 1 0 113% 20 - - - 1 1 - -3 $2,265,700 $755,233 $825,000 3 0 103% 65 $4,583,000 $916,600 $898,000 4 0 113% 179 $6,726,500 $747,389 $760,000 10 3 111% 74 $2,706,000 $676,500 $677,500 4 0 116% 50 - - - 0 0 - -5 $4,020,500 $804,100 $833,500 6 3 108% 99 $8,510,800 $945,644 $975,000 10 4 118% 50 - - - 0 1 - -3 $3,441,800 $1,147,267 $1,088,000 3 0 114% 56 $5,069,000 $844,833 $765,500 7 3 121% 646 $46,518,700 $1,011,276 $980,000 61 20 113% 64 $4,182,800 $1,045,700 $1,040,900 6 2 122% 40 - - - 0 0 - -0 - - - 0 0 - -0 - - - 0 0 - -28 $28,744,800 $1,026,600 $980,000 36 12 110% 81 $700,000 $700,000 $700,000 1 0 122% 59 $9,460,300 $1,051,144 $1,038,000 11 3 114% 43 $2,580,800 $860,267 $830,000 4 2 115% 41 $850,000 $850,000 $850,000 3 1 122% 321 $11,788,600 $561,362 $523,000 30 13 117% 51 $590,000 $590,000 $590,000 1 0 108% 50 - - - 0 0 - -12 $6,041,500 $503,458 $510,500 16 5 120% 41 $565,000 $565,000 $565,000 3 2 113% 12 $1,292,000 $646,000 $646,000 2 1 124% 40 - - - 1 1 - -0 - - - 1 1 - -5 $3,300,100 $660,020 $662,000 6 3 111% 90 - - - 0 0 - -0 - - - 0 0 - -5 $2,366,000 $473,200 $475,000 9 5 103% 70 - - - 0 0 - -1 $580,000 $580,000 $580,000 4 3 102% 74 $1,786,000 $446,500 $450,000 3 0 104% 70 - - - 1 1 - -0 - - - 1 1 - -
1 1 1 1 2 3 4 5

Toronto Real Estate Board
Market Watch, February 2017
SUMMARY OF EXISTING HOME TRANSACTIONS LINK, FEBRUARY 2017CITY OF TORONTO MUNICIPAL BREAKDOWN
16
Sales Dollar Volume Average Price Median Price New Listings Active Listings Avg. SP / LP Avg. DOMTREB TotalCity of Toronto TotalToronto West
Toronto W01Toronto W02Toronto W03Toronto W04Toronto W05Toronto W06Toronto W07Toronto W08Toronto W09Toronto W10
Toronto CentralToronto C01Toronto C02Toronto C03Toronto C04Toronto C06Toronto C07Toronto C08Toronto C09Toronto C10Toronto C11Toronto C12Toronto C13Toronto C14Toronto C15
Toronto EastToronto E01Toronto E02Toronto E03Toronto E04Toronto E05Toronto E06Toronto E07Toronto E08Toronto E09Toronto E10Toronto E11
99 $83,324,300 $841,660 $845,800 129 46 113% 79 $8,510,800 $945,644 $975,000 10 4 118% 50 - - - 0 1 - -0 - - - 0 0 - -0 - - - 0 0 - -0 - - - 0 0 - -0 - - - 0 0 - -0 - - - 0 1 - -0 - - - 0 0 - -0 - - - 0 0 - -0 - - - 0 0 - -0 - - - 0 0 - -0 - - - 0 0 - -3 $3,441,800 $1,147,267 $1,088,000 3 0 114% 50 - - - 0 0 - -0 - - - 0 0 - -0 - - - 0 0 - -0 - - - 0 0 - -0 - - - 0 0 - -0 - - - 0 0 - -0 - - - 0 0 - -0 - - - 0 0 - -0 - - - 0 0 - -0 - - - 0 0 - -0 - - - 0 0 - -1 $975,000 $975,000 $975,000 1 0 130% 60 - - - 0 0 - -2 $2,466,800 $1,233,400 $1,233,400 2 0 109% 56 $5,069,000 $844,833 $765,500 7 3 121% 60 - - - 0 0 - -0 - - - 0 0 - -0 - - - 0 0 - -0 - - - 0 0 - -3 $3,060,000 $1,020,000 $990,000 3 0 123% 70 - - - 0 0 - -0 - - - 2 3 - -0 - - - 0 0 - -0 - - - 0 0 - -1 $686,000 $686,000 $686,000 0 0 137% 62 $1,323,000 $661,500 $661,500 2 0 110% 4
1 1 1 1 2 3 4 5

Toronto Real Estate Board
Market Watch, February 2017
SUMMARY OF EXISTING HOME TRANSACTIONS ATTACHED/ROW/TOWNHOUSE, FEBRUARY 2017ALL TREB AREAS
17
Sales Dollar Volume Average Price Median Price New Listings Active Listings Avg. SP / LP Avg. DOMTREB TotalHalton Region
BurlingtonHalton HillsMiltonOakville
Peel RegionBramptonCaledonMississauga
City of TorontoToronto WestToronto CentralToronto East
York RegionAuroraE. GwillimburyGeorginaKingMarkhamNewmarketRichmond HillVaughanWhitchurch-Stouffville
Durham RegionAjaxBrockClaringtonOshawaPickeringScugogUxbridgeWhitby
Dufferin CountyOrangeville
Simcoe CountyAdjala-TosorontioBradford WestGwillimburyEssaInnisfilNew Tecumseth
619 $459,553,412 $742,413 $690,000 810 332 111% 899 $73,736,864 $744,817 $690,000 136 55 109% 518 $12,183,500 $676,861 $677,500 24 8 112% 52 $1,205,888 $602,944 $602,944 5 3 115% 534 $21,883,188 $643,623 $658,500 42 15 111% 445 $38,464,288 $854,762 $820,000 65 29 107% 6
160 $102,585,173 $641,157 $635,000 182 56 108% 7121 $73,821,135 $610,092 $616,000 137 37 107% 77 $4,562,000 $651,714 $647,000 11 6 107% 432 $24,202,038 $756,314 $736,500 34 13 110% 568 $59,726,379 $878,329 $847,500 106 57 112% 1126 $21,408,000 $823,385 $837,500 30 12 108% 1315 $16,370,079 $1,091,339 $1,050,000 40 28 110% 1327 $21,948,300 $812,900 $748,800 36 17 117% 8
184 $164,600,711 $894,569 $875,000 266 128 112% 815 $12,990,494 $866,033 $900,000 21 13 115% 113 $2,340,080 $780,027 $780,000 3 0 110% 74 $2,216,168 $554,042 $555,000 4 0 112% 24 $4,051,000 $1,012,750 $1,018,000 5 0 101% 844 $40,588,248 $922,460 $884,995 83 48 113% 1114 $10,674,500 $762,464 $775,000 16 4 113% 534 $32,715,800 $962,229 $946,000 51 24 118% 756 $51,618,221 $921,754 $879,000 72 35 109% 910 $7,406,200 $740,620 $744,500 11 4 110% 980 $45,649,285 $570,616 $572,500 93 29 114% 724 $14,896,400 $620,683 $616,500 27 6 114% 70 - - - 0 0 - -19 $9,169,400 $482,600 $480,000 18 2 119% 67 $4,058,088 $579,727 $580,000 18 12 111% 77 $4,218,400 $602,629 $590,000 6 2 110% 140 - - - 0 0 - -3 $1,685,000 $561,667 $570,000 3 0 110% 720 $11,621,997 $581,100 $573,500 21 7 114% 58 $3,719,500 $464,938 $459,000 8 2 109% 98 $3,719,500 $464,938 $459,000 8 2 109% 920 $9,535,500 $476,775 $455,000 19 5 107% 70 - - - 0 0 - -6 $3,523,000 $587,167 $592,250 5 1 108% 85 $1,940,500 $388,100 $390,000 4 0 105% 34 $1,844,000 $461,000 $449,500 3 1 108% 195 $2,228,000 $445,600 $445,000 7 3 106% 2
1 1 1 1 2 3 4 5
Toronto Real Estate Board
Market Watch, February 2017
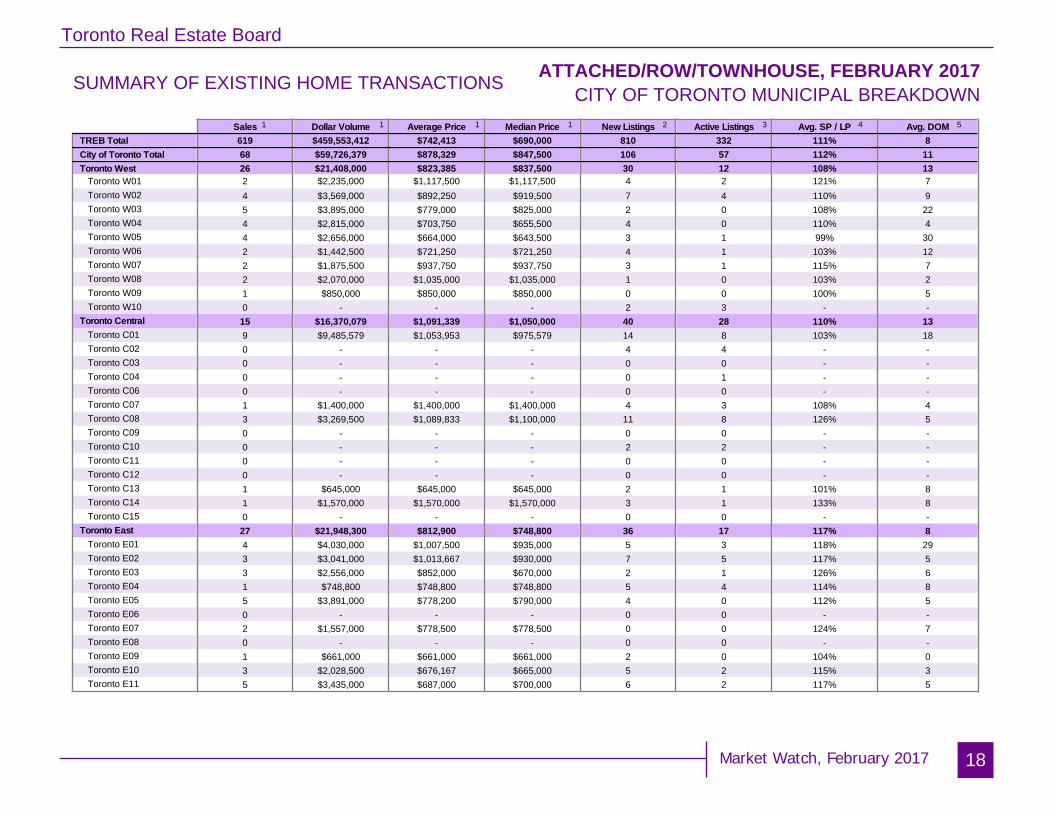
SUMMARY OF EXISTING HOME TRANSACTIONS ATTACHED/ROW/TOWNHOUSE, FEBRUARY 2017CITY OF TORONTO MUNICIPAL BREAKDOWN
18
Sales Dollar Volume Average Price Median Price New Listings Active Listings Avg. SP / LP Avg. DOMTREB TotalCity of Toronto TotalToronto West
Toronto W01Toronto W02Toronto W03Toronto W04Toronto W05Toronto W06Toronto W07Toronto W08Toronto W09Toronto W10
Toronto CentralToronto C01Toronto C02Toronto C03Toronto C04Toronto C06Toronto C07Toronto C08Toronto C09Toronto C10Toronto C11Toronto C12Toronto C13Toronto C14Toronto C15
Toronto EastToronto E01Toronto E02Toronto E03Toronto E04Toronto E05Toronto E06Toronto E07Toronto E08Toronto E09Toronto E10Toronto E11
619 $459,553,412 $742,413 $690,000 810 332 111% 868 $59,726,379 $878,329 $847,500 106 57 112% 1126 $21,408,000 $823,385 $837,500 30 12 108% 132 $2,235,000 $1,117,500 $1,117,500 4 2 121% 74 $3,569,000 $892,250 $919,500 7 4 110% 95 $3,895,000 $779,000 $825,000 2 0 108% 224 $2,815,000 $703,750 $655,500 4 0 110% 44 $2,656,000 $664,000 $643,500 3 1 99% 302 $1,442,500 $721,250 $721,250 4 1 103% 122 $1,875,500 $937,750 $937,750 3 1 115% 72 $2,070,000 $1,035,000 $1,035,000 1 0 103% 21 $850,000 $850,000 $850,000 0 0 100% 50 - - - 2 3 - -15 $16,370,079 $1,091,339 $1,050,000 40 28 110% 139 $9,485,579 $1,053,953 $975,579 14 8 103% 180 - - - 4 4 - -0 - - - 0 0 - -0 - - - 0 1 - -0 - - - 0 0 - -1 $1,400,000 $1,400,000 $1,400,000 4 3 108% 43 $3,269,500 $1,089,833 $1,100,000 11 8 126% 50 - - - 0 0 - -0 - - - 2 2 - -0 - - - 0 0 - -0 - - - 0 0 - -1 $645,000 $645,000 $645,000 2 1 101% 81 $1,570,000 $1,570,000 $1,570,000 3 1 133% 80 - - - 0 0 - -27 $21,948,300 $812,900 $748,800 36 17 117% 84 $4,030,000 $1,007,500 $935,000 5 3 118% 293 $3,041,000 $1,013,667 $930,000 7 5 117% 53 $2,556,000 $852,000 $670,000 2 1 126% 61 $748,800 $748,800 $748,800 5 4 114% 85 $3,891,000 $778,200 $790,000 4 0 112% 50 - - - 0 0 - -2 $1,557,000 $778,500 $778,500 0 0 124% 70 - - - 0 0 - -1 $661,000 $661,000 $661,000 2 0 104% 03 $2,028,500 $676,167 $665,000 5 2 115% 35 $3,435,000 $687,000 $700,000 6 2 117% 5
1 1 1 1 2 3 4 5

Toronto Real Estate Board
Market Watch, February 2017
SUMMARY OF EXISTING HOME TRANSACTIONS CO-OP APARTMENT, FEBRUARY 2017ALL TREB AREAS
19
Sales Dollar Volume Average Price Median Price New Listings Active Listings Avg. SP / LP Average DOMTREB TotalHalton Region
BurlingtonHalton HillsMiltonOakville
Peel RegionBramptonCaledonMississauga
City of TorontoToronto WestToronto CentralToronto East
York RegionAuroraE. GwillimburyGeorginaKingMarkhamNewmarketRichmond HillVaughanWhitchurch-Stouffville
Durham RegionAjaxBrockClaringtonOshawaPickeringScugogUxbridgeWhitby
Dufferin CountyOrangeville
Simcoe CountyAdjala-TosorontioBradford WestGwillimburyEssaInnisfilNew Tecumseth
7 $4,687,600 $669,657 $296,000 7 10 113% 331 $162,500 $162,500 $162,500 0 0 99% 1191 $162,500 $162,500 $162,500 0 0 99% 1190 - - - 0 0 - -0 - - - 0 0 - -0 - - - 0 0 - -0 - - - 2 1 - -0 - - - 0 0 - -0 - - - 0 0 - -0 - - - 2 1 - -6 $4,525,100 $754,183 $332,500 5 9 114% 190 - - - 0 3 - -3 $3,809,000 $1,269,667 $1,313,000 5 5 117% 93 $716,100 $238,700 $220,100 0 1 101% 290 - - - 0 0 - -0 - - - 0 0 - -0 - - - 0 0 - -0 - - - 0 0 - -0 - - - 0 0 - -0 - - - 0 0 - -0 - - - 0 0 - -0 - - - 0 0 - -0 - - - 0 0 - -0 - - - 0 0 - -0 - - - 0 0 - -0 - - - 0 0 - -0 - - - 0 0 - -0 - - - 0 0 - -0 - - - 0 0 - -0 - - - 0 0 - -0 - - - 0 0 - -0 - - - 0 0 - -0 - - - 0 0 - -0 - - - 0 0 - -0 - - - 0 0 - -0 - - - 0 0 - -0 - - - 0 0 - -0 - - - 0 0 - -0 - - - 0 0 - -0 - - - 0 0 - -0 - - - 0 0 - -
1 1 1 1 2 3 4 5

Toronto Real Estate Board
Market Watch, February 2017
SUMMARY OF EXISTING HOME TRANSACTIONS CO-OP APARTMENT, FEBRUARY 2017CITY OF TORONTO MUNICIPAL BREAKDOWN
20
Sales Dollar Volume Average Price Median Price New Listings Active Listings Avg. SP / LP Avg. DOMTREB TotalCity of Toronto TotalToronto West
Toronto W01Toronto W02Toronto W03Toronto W04Toronto W05Toronto W06Toronto W07Toronto W08Toronto W09Toronto W10
Toronto CentralToronto C01Toronto C02Toronto C03Toronto C04Toronto C06Toronto C07Toronto C08Toronto C09Toronto C10Toronto C11Toronto C12Toronto C13Toronto C14Toronto C15
Toronto EastToronto E01Toronto E02Toronto E03Toronto E04Toronto E05Toronto E06Toronto E07Toronto E08Toronto E09Toronto E10Toronto E11
7 $4,687,600 $669,657 $296,000 7 10 113% 336 $4,525,100 $754,183 $332,500 5 9 114% 190 - - - 0 3 - -0 - - - 0 0 - -0 - - - 0 0 - -0 - - - 0 0 - -0 - - - 0 0 - -0 - - - 0 0 - -0 - - - 0 3 - -0 - - - 0 0 - -0 - - - 0 0 - -0 - - - 0 0 - -0 - - - 0 0 - -3 $3,809,000 $1,269,667 $1,313,000 5 5 117% 90 - - - 0 0 - -1 $296,000 $296,000 $296,000 0 0 100% 30 - - - 0 1 - -0 - - - 0 1 - -0 - - - 0 0 - -0 - - - 0 0 - -0 - - - 0 0 - -2 $3,513,000 $1,756,500 $1,756,500 5 3 119% 130 - - - 0 0 - -0 - - - 0 0 - -0 - - - 0 0 - -0 - - - 0 0 - -0 - - - 0 0 - -0 - - - 0 0 - -3 $716,100 $238,700 $220,100 0 1 101% 290 - - - 0 0 - -0 - - - 0 0 - -0 - - - 0 0 - -2 $589,100 $294,550 $294,550 0 1 102% 200 - - - 0 0 - -0 - - - 0 0 - -0 - - - 0 0 - -0 - - - 0 0 - -0 - - - 0 0 - -1 $127,000 $127,000 $127,000 0 0 98% 480 - - - 0 0 - -
1 1 1 1 2 3 4 5

Toronto Real Estate Board
Market Watch, February 2017
SUMMARY OF EXISTING HOME TRANSACTIONS DETACHED CONDOMINIUM, FEBRUARY 2017ALL TREB AREAS
21
Sales Dollar Volume Average Price Median Price New Listings Active Listings Avg. SP / LP Avg. DOMTREB TotalHalton Region
BurlingtonHalton HillsMiltonOakville
Peel RegionBramptonCaledonMississauga
City of TorontoToronto WestToronto CentralToronto East
York RegionAuroraE. GwillimburyGeorginaKingMarkhamNewmarketRichmond HillVaughanWhitchurch-Stouffville
Durham RegionAjaxBrockClaringtonOshawaPickeringScugogUxbridgeWhitby
Dufferin CountyOrangeville
Simcoe CountyAdjala-TosorontioBradford WestGwillimburyEssaInnisfilNew Tecumseth
7 $4,706,700 $672,386 $583,000 7 7 101% 321 $718,800 $718,800 $718,800 1 0 126% 40 - - - 0 0 - -0 - - - 0 0 - -0 - - - 0 0 - -1 $718,800 $718,800 $718,800 1 0 126% 40 - - - 2 2 - -0 - - - 0 0 - -0 - - - 1 1 - -0 - - - 1 1 - -0 - - - 0 0 - -0 - - - 0 0 - -0 - - - 0 0 - -0 - - - 0 0 - -0 - - - 0 1 - -0 - - - 0 0 - -0 - - - 0 0 - -0 - - - 0 0 - -0 - - - 0 0 - -0 - - - 0 1 - -0 - - - 0 0 - -0 - - - 0 0 - -0 - - - 0 0 - -0 - - - 0 0 - -1 $1,290,000 $1,290,000 $1,290,000 0 0 92% 830 - - - 0 0 - -0 - - - 0 0 - -0 - - - 0 0 - -0 - - - 0 0 - -0 - - - 0 0 - -0 - - - 0 0 - -1 $1,290,000 $1,290,000 $1,290,000 0 0 92% 830 - - - 0 0 - -0 - - - 0 0 - -0 - - - 0 0 - -5 $2,697,900 $539,580 $558,900 4 4 101% 270 - - - 0 0 - -0 - - - 0 0 - -0 - - - 0 0 - -0 - - - 0 0 - -5 $2,697,900 $539,580 $558,900 4 4 101% 27
1 1 1 1 2 3 4 5

Toronto Real Estate Board
Market Watch, February 2017
SUMMARY OF EXISTING HOME TRANSACTIONS DETACHED CONDOMINIUM, FEBRUARY 2017CITY OF TORONTO MUNICIPAL BREAKDOWN
22
Sales Dollar Volume Average Price Median Price New Listings Active Listings Avg. SP / LP Avg. DOMTREB TotalCity of Toronto TotalToronto West
Toronto W01Toronto W02Toronto W03Toronto W04Toronto W05Toronto W06Toronto W07Toronto W08Toronto W09Toronto W10
Toronto CentralToronto C01Toronto C02Toronto C03Toronto C04Toronto C06Toronto C07Toronto C08Toronto C09Toronto C10Toronto C11Toronto C12Toronto C13Toronto C14Toronto C15
Toronto EastToronto E01Toronto E02Toronto E03Toronto E04Toronto E05Toronto E06Toronto E07Toronto E08Toronto E09Toronto E10Toronto E11
7 $4,706,700 $672,386 $583,000 7 7 101% 320 - - - 0 0 - -0 - - - 0 0 - -0 - - - 0 0 - -0 - - - 0 0 - -0 - - - 0 0 - -0 - - - 0 0 - -0 - - - 0 0 - -0 - - - 0 0 - -0 - - - 0 0 - -0 - - - 0 0 - -0 - - - 0 0 - -0 - - - 0 0 - -0 - - - 0 0 - -0 - - - 0 0 - -0 - - - 0 0 - -0 - - - 0 0 - -0 - - - 0 0 - -0 - - - 0 0 - -0 - - - 0 0 - -0 - - - 0 0 - -0 - - - 0 0 - -0 - - - 0 0 - -0 - - - 0 0 - -0 - - - 0 0 - -0 - - - 0 0 - -0 - - - 0 0 - -0 - - - 0 0 - -0 - - - 0 0 - -0 - - - 0 0 - -0 - - - 0 0 - -0 - - - 0 0 - -0 - - - 0 0 - -0 - - - 0 0 - -0 - - - 0 0 - -0 - - - 0 0 - -0 - - - 0 0 - -0 - - - 0 0 - -0 - - - 0 0 - -0 - - - 0 0 - -
1 1 1 1 2 3 4 5

Toronto Real Estate Board
Market Watch, February 2017
SUMMARY OF EXISTING HOME TRANSACTIONS CO-OWNERSHIP APARTMENT, FEBRUARY 2017ALL TREB AREAS
23
Sales Dollar Volume Average Price Median Price New Listings Active Listings Avg. SP / LP Avg. DOMTREB TotalHalton Region
BurlingtonHalton HillsMiltonOakville
Peel RegionBramptonCaledonMississauga
City of TorontoToronto WestToronto CentralToronto East
York RegionAuroraE. GwillimburyGeorginaKingMarkhamNewmarketRichmond HillVaughanWhitchurch-Stouffville
Durham RegionAjaxBrockClaringtonOshawaPickeringScugogUxbridgeWhitby
Dufferin CountyOrangeville
Simcoe CountyAdjala-TosorontioBradford WestGwillimburyEssaInnisfilNew Tecumseth
4 $1,028,000 $257,000 $259,000 6 6 99% 220 - - - 0 0 - -0 - - - 0 0 - -0 - - - 0 0 - -0 - - - 0 0 - -0 - - - 0 0 - -0 - - - 0 0 - -0 - - - 0 0 - -0 - - - 0 0 - -0 - - - 0 0 - -4 $1,028,000 $257,000 $259,000 6 6 99% 220 - - - 0 0 - -4 $1,028,000 $257,000 $259,000 6 6 99% 220 - - - 0 0 - -0 - - - 0 0 - -0 - - - 0 0 - -0 - - - 0 0 - -0 - - - 0 0 - -0 - - - 0 0 - -0 - - - 0 0 - -0 - - - 0 0 - -0 - - - 0 0 - -0 - - - 0 0 - -0 - - - 0 0 - -0 - - - 0 0 - -0 - - - 0 0 - -0 - - - 0 0 - -0 - - - 0 0 - -0 - - - 0 0 - -0 - - - 0 0 - -0 - - - 0 0 - -0 - - - 0 0 - -0 - - - 0 0 - -0 - - - 0 0 - -0 - - - 0 0 - -0 - - - 0 0 - -0 - - - 0 0 - -0 - - - 0 0 - -0 - - - 0 0 - -0 - - - 0 0 - -0 - - - 0 0 - -
1 1 1 1 2 3 4 5

Toronto Real Estate Board
Market Watch, February 2017
SUMMARY OF EXISTING HOME TRANSACTIONS CO-OWNERSHIP APARTMENT, FEBRUARY 2017CITY OF TORONTO MUNICIPAL BREAKDOWN
24
Sales Dollar Volume Average Price Median Price New Listings Active Listings Avg. SP / LP Avg. DOMTREB TotalCity of Toronto TotalToronto West
Toronto W01Toronto W02Toronto W03Toronto W04Toronto W05Toronto W06Toronto W07Toronto W08Toronto W09Toronto W10
Toronto CentralToronto C01Toronto C02Toronto C03Toronto C04Toronto C06Toronto C07Toronto C08Toronto C09Toronto C10Toronto C11Toronto C12Toronto C13Toronto C14Toronto C15
Toronto EastToronto E01Toronto E02Toronto E03Toronto E04Toronto E05Toronto E06Toronto E07Toronto E08Toronto E09Toronto E10Toronto E11
4 $1,028,000 $257,000 $259,000 6 6 99% 224 $1,028,000 $257,000 $259,000 6 6 99% 220 - - - 0 0 - -0 - - - 0 0 - -0 - - - 0 0 - -0 - - - 0 0 - -0 - - - 0 0 - -0 - - - 0 0 - -0 - - - 0 0 - -0 - - - 0 0 - -0 - - - 0 0 - -0 - - - 0 0 - -0 - - - 0 0 - -4 $1,028,000 $257,000 $259,000 6 6 99% 220 - - - 0 0 - -0 - - - 1 1 - -0 - - - 1 3 - -1 $155,000 $155,000 $155,000 1 0 100% 30 - - - 0 0 - -0 - - - 0 0 - -1 $243,000 $243,000 $243,000 1 1 99% 580 - - - 0 0 - -0 - - - 0 0 - -0 - - - 0 0 - -0 - - - 0 0 - -2 $630,000 $315,000 $315,000 2 1 98% 130 - - - 0 0 - -0 - - - 0 0 - -0 - - - 0 0 - -0 - - - 0 0 - -0 - - - 0 0 - -0 - - - 0 0 - -0 - - - 0 0 - -0 - - - 0 0 - -0 - - - 0 0 - -0 - - - 0 0 - -0 - - - 0 0 - -0 - - - 0 0 - -0 - - - 0 0 - -0 - - - 0 0 - -
1 1 1 1 2 3 4 5

Toronto Real Estate Board
Market Watch, February 2017
FOCUS ON THE MLS HOME PRICE INDEX INDEX AND BENCHMARK PRICE, FEBRUARY 2017ALL TREB AREAS
25
Composite Single-Family Detached Single-Family Attached Townhouse ApartmentIndex Benchmark Yr./Yr. % Chg. Index Benchmark Yr./Yr. % Chg. Index Benchmark Yr./Yr. % Chg. Index Benchmark Yr./Yr. % Chg. Index Benchmark Yr./Yr. % Chg.
TREB TotalHalton RegionBurlingtonHalton HillsMiltonOakvillePeel RegionBramptonCaledonMississaugaCity of TorontoYork RegionAuroraEast GwillimburyGeorginaKingMarkhamNewmarketRichmond HillVaughanWhitchurch-StouffvilleDurham RegionAjaxBrockClaringtonOshawaPickeringScugogUxbridgeWhitbyDufferin CountyOrangevilleSimcoe CountyAdjala-TosorontioBradford WestGwillimburyEssaInnisfilNew Tecumseth
238.0 $727,300 23.83% 250.5 $936,600 26.32% 250.7 $707,000 23.32% 226.0 $506,600 23.23% 200.5 $402,600 18.92%253.3 $867,900 25.71% 254.4 $969,900 25.51% 255.2 $678,600 26.27% 248.8 $504,100 27.07% - - -244.9 $744,500 24.13% 244.4 $873,400 23.50% 241.9 $602,900 23.10% 249.2 $512,000 27.01% - - -238.6 $738,600 25.58% 235.3 $788,900 25.36% 244.7 $613,000 26.85% 252.7 $449,600 27.37% - - -241.0 $723,300 25.46% 239.9 $839,700 25.60% 249.4 $629,500 26.60% 228.0 $400,000 26.11% - - -267.2 $1,022,000 25.74% 268.2 $1,137,100 25.33% 270.4 $755,300 26.71% 251.6 $599,500 26.62% - - -229.6 $651,400 24.31% 235.6 $829,500 25.12% 236.6 $605,800 24.59% 225.7 $485,000 25.53% 195.0 $337,100 18.33%228.5 $580,400 26.17% 228.0 $665,000 26.25% 230.9 $541,700 25.28% 221.8 $407,200 29.78% 162.5 $254,400 13.88%202.9 $724,300 22.01% 203.4 $747,400 22.16% 227.8 $562,800 23.74% - - - - - -232.5 $690,100 23.02% 250.8 $1,001,700 24.22% 244.7 $674,900 23.96% 227.0 $510,200 24.38% 200.3 $352,600 18.87%227.0 $737,400 19.92% 252.1 $1,105,700 23.28% 250.3 $834,200 18.63% 221.3 $542,900 18.60% 202.2 $416,600 19.36%270.3 $924,400 26.37% 281.1 $1,095,300 29.00% 275.8 $798,300 25.02% 218.2 $559,700 14.12% 195.7 $430,500 15.32%263.9 $847,000 27.86% 269.3 $1,001,000 30.10% 263.5 $681,300 24.00% 197.1 $500,600 17.11% 202.4 $419,100 16.32%231.2 $740,800 25.86% 232.5 $765,000 25.34% 203.5 $468,000 19.01% - - - - - -238.1 $494,400 31.77% 249.5 $516,300 30.97% 240.8 $474,700 24.12% - - - - - -239.2 $1,001,300 26.96% 239.8 $997,500 26.61% 247.0 $578,500 22.52% - - - - - -280.3 $971,700 25.53% 305.1 $1,255,200 30.78% 283.2 $847,000 23.72% 217.9 $553,900 11.46% 197.4 $478,100 16.25%252.6 $744,800 29.21% 258.8 $872,300 30.64% 258.6 $609,100 27.45% 223.9 $455,300 13.31% 206.6 $348,500 16.99%293.0 $1,059,700 29.25% 322.6 $1,370,900 31.89% 296.5 $901,100 28.30% 205.3 $568,200 12.37% 188.4 $391,200 15.87%257.0 $928,300 23.32% 254.0 $1,055,900 25.56% 270.7 $820,000 24.12% 245.1 $667,100 23.04% 199.1 $443,400 13.71%271.9 $955,600 25.24% 271.3 $976,900 25.43% 240.8 $661,400 22.92% - - - - - -227.8 $533,300 27.69% 225.9 $587,300 27.56% 235.8 $471,000 25.76% 208.4 $338,500 25.85% 203.0 $364,500 28.24%236.3 $583,000 24.96% 234.7 $629,100 24.97% 244.9 $526,600 23.19% 218.1 $398,600 23.22% 191.0 $324,000 27.59%173.5 $315,600 19.57% 174.5 $318,500 19.60% - - - - - - - - -222.3 $469,200 25.03% 216.5 $521,400 25.43% 220.7 $421,600 18.34% 208.8 $326,800 20.69% 209.8 $296,900 33.89%229.5 $439,100 30.69% 227.4 $484,500 29.72% 242.1 $406,600 31.65% 197.7 $266,600 34.67% 189.8 $231,000 23.01%229.9 $619,000 27.02% 230.5 $721,500 27.70% 236.7 $551,500 27.60% 223.2 $398,500 22.70% 217.1 $428,200 30.00%200.6 $523,800 24.21% 206.4 $534,700 24.34% 197.9 $414,200 26.13% - - - - - -203.9 $623,200 18.41% 202.5 $625,300 18.21% 198.9 $488,100 22.70% - - - - - -232.4 $605,800 31.15% 235.5 $677,300 31.71% 234.0 $515,500 27.73% 195.4 $355,800 19.95% 192.5 $370,400 25.24%226.1 $518,300 24.44% 236.2 $538,300 24.45% 221.9 $415,800 25.23% - - - - - -226.1 $518,300 24.44% 236.2 $538,300 24.45% 221.9 $415,800 25.23% - - - - - -227.8 $488,000 29.43% 219.1 $488,300 29.64% 233.1 $443,300 25.80% - - - - - -189.5 $672,500 29.71% 189.5 $672,500 29.71% - - - - - - - - -254.0 $627,800 24.75% 229.8 $701,000 23.75% 254.8 $529,700 22.68% - - - - - -223.9 $511,800 31.63% 217.1 $533,700 30.78% 222.1 $378,400 30.34% - - - - - -221.3 $406,900 32.51% 220.9 $406,600 32.35% 234.4 $364,600 27.32% - - - - - -207.9 $481,300 30.92% 203.2 $523,800 31.78% 209.5 $400,100 25.90% - - - - - -
Toronto Real Estate Board
Market Watch, February 2017
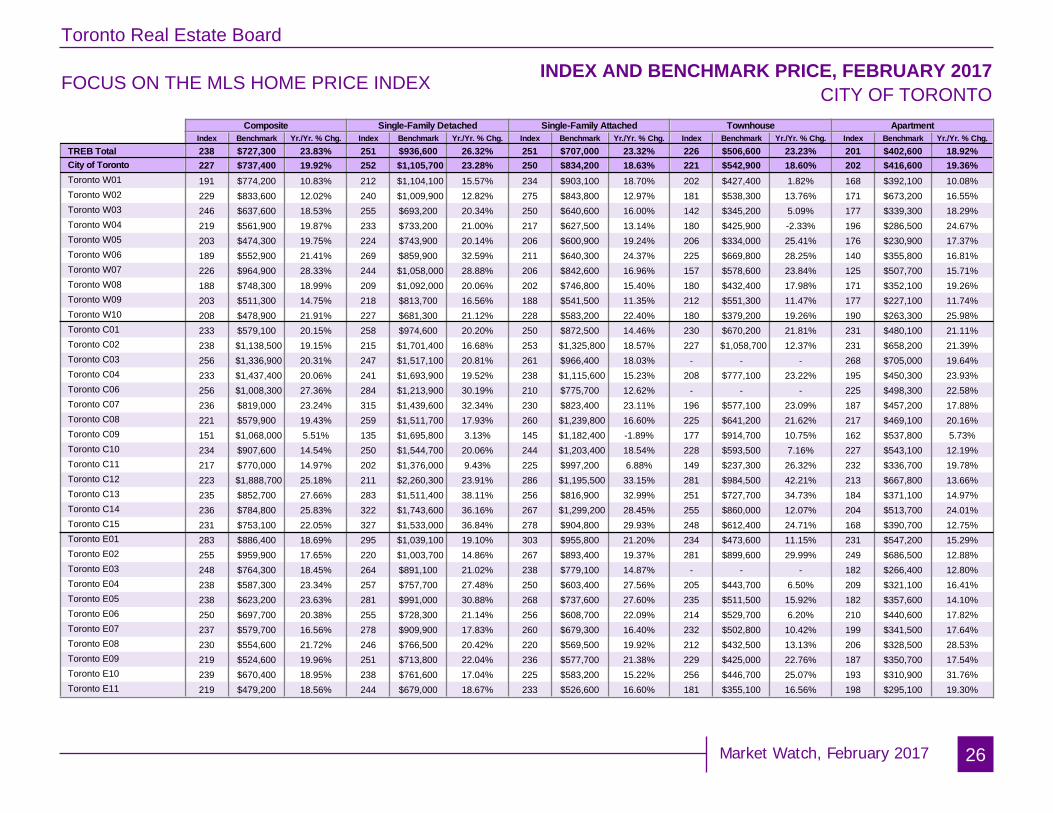
FOCUS ON THE MLS HOME PRICE INDEX INDEX AND BENCHMARK PRICE, FEBRUARY 2017CITY OF TORONTO
26
Composite Single-Family Detached Single-Family Attached Townhouse ApartmentIndex Benchmark Yr./Yr. % Chg. Index Benchmark Yr./Yr. % Chg. Index Benchmark Yr./Yr. % Chg. Index Benchmark Yr./Yr. % Chg. Index Benchmark Yr./Yr. % Chg.
TREB TotalCity of TorontoToronto W01Toronto W02Toronto W03Toronto W04Toronto W05Toronto W06Toronto W07Toronto W08Toronto W09Toronto W10Toronto C01Toronto C02Toronto C03Toronto C04Toronto C06Toronto C07Toronto C08Toronto C09Toronto C10Toronto C11Toronto C12Toronto C13Toronto C14Toronto C15Toronto E01Toronto E02Toronto E03Toronto E04Toronto E05Toronto E06Toronto E07Toronto E08Toronto E09Toronto E10Toronto E11
238 $727,300 23.83% 251 $936,600 26.32% 251 $707,000 23.32% 226 $506,600 23.23% 201 $402,600 18.92%227 $737,400 19.92% 252 $1,105,700 23.28% 250 $834,200 18.63% 221 $542,900 18.60% 202 $416,600 19.36%191 $774,200 10.83% 212 $1,104,100 15.57% 234 $903,100 18.70% 202 $427,400 1.82% 168 $392,100 10.08%229 $833,600 12.02% 240 $1,009,900 12.82% 275 $843,800 12.97% 181 $538,300 13.76% 171 $673,200 16.55%246 $637,600 18.53% 255 $693,200 20.34% 250 $640,600 16.00% 142 $345,200 5.09% 177 $339,300 18.29%219 $561,900 19.87% 233 $733,200 21.00% 217 $627,500 13.14% 180 $425,900 -2.33% 196 $286,500 24.67%203 $474,300 19.75% 224 $743,900 20.14% 206 $600,900 19.24% 206 $334,000 25.41% 176 $230,900 17.37%189 $552,900 21.41% 269 $859,900 32.59% 211 $640,300 24.37% 225 $669,800 28.25% 140 $355,800 16.81%226 $964,900 28.33% 244 $1,058,000 28.88% 206 $842,600 16.96% 157 $578,600 23.84% 125 $507,700 15.71%188 $748,300 18.99% 209 $1,092,000 20.06% 202 $746,800 15.40% 180 $432,400 17.98% 171 $352,100 19.26%203 $511,300 14.75% 218 $813,700 16.56% 188 $541,500 11.35% 212 $551,300 11.47% 177 $227,100 11.74%208 $478,900 21.91% 227 $681,300 21.12% 228 $583,200 22.40% 180 $379,200 19.26% 190 $263,300 25.98%233 $579,100 20.15% 258 $974,600 20.20% 250 $872,500 14.46% 230 $670,200 21.81% 231 $480,100 21.11%238 $1,138,500 19.15% 215 $1,701,400 16.68% 253 $1,325,800 18.57% 227 $1,058,700 12.37% 231 $658,200 21.39%256 $1,336,900 20.31% 247 $1,517,100 20.81% 261 $966,400 18.03% - - - 268 $705,000 19.64%233 $1,437,400 20.06% 241 $1,693,900 19.52% 238 $1,115,600 15.23% 208 $777,100 23.22% 195 $450,300 23.93%256 $1,008,300 27.36% 284 $1,213,900 30.19% 210 $775,700 12.62% - - - 225 $498,300 22.58%236 $819,000 23.24% 315 $1,439,600 32.34% 230 $823,400 23.11% 196 $577,100 23.09% 187 $457,200 17.88%221 $579,900 19.43% 259 $1,511,700 17.93% 260 $1,239,800 16.60% 225 $641,200 21.62% 217 $469,100 20.16%151 $1,068,000 5.51% 135 $1,695,800 3.13% 145 $1,182,400 -1.89% 177 $914,700 10.75% 162 $537,800 5.73%234 $907,600 14.54% 250 $1,544,700 20.06% 244 $1,203,400 18.54% 228 $593,500 7.16% 227 $543,100 12.19%217 $770,000 14.97% 202 $1,376,000 9.43% 225 $997,200 6.88% 149 $237,300 26.32% 232 $336,700 19.78%223 $1,888,700 25.18% 211 $2,260,300 23.91% 286 $1,195,500 33.15% 281 $984,500 42.21% 213 $667,800 13.66%235 $852,700 27.66% 283 $1,511,400 38.11% 256 $816,900 32.99% 251 $727,700 34.73% 184 $371,100 14.97%236 $784,800 25.83% 322 $1,743,600 36.16% 267 $1,299,200 28.45% 255 $860,000 12.07% 204 $513,700 24.01%231 $753,100 22.05% 327 $1,533,000 36.84% 278 $904,800 29.93% 248 $612,400 24.71% 168 $390,700 12.75%283 $886,400 18.69% 295 $1,039,100 19.10% 303 $955,800 21.20% 234 $473,600 11.15% 231 $547,200 15.29%255 $959,900 17.65% 220 $1,003,700 14.86% 267 $893,400 19.37% 281 $899,600 29.99% 249 $686,500 12.88%248 $764,300 18.45% 264 $891,100 21.02% 238 $779,100 14.87% - - - 182 $266,400 12.80%238 $587,300 23.34% 257 $757,700 27.48% 250 $603,400 27.56% 205 $443,700 6.50% 209 $321,100 16.41%238 $623,200 23.63% 281 $991,000 30.88% 268 $737,600 27.60% 235 $511,500 15.92% 182 $357,600 14.10%250 $697,700 20.38% 255 $728,300 21.14% 256 $608,700 22.09% 214 $529,700 6.20% 210 $440,600 17.82%237 $579,700 16.56% 278 $909,900 17.83% 260 $679,300 16.40% 232 $502,800 10.42% 199 $341,500 17.64%230 $554,600 21.72% 246 $766,500 20.42% 220 $569,500 19.92% 212 $432,500 13.13% 206 $328,500 28.53%219 $524,600 19.96% 251 $713,800 22.04% 236 $577,700 21.38% 229 $425,000 22.76% 187 $350,700 17.54%239 $670,400 18.95% 238 $761,600 17.04% 225 $583,200 15.22% 256 $446,700 25.07% 193 $310,900 31.76%219 $479,200 18.56% 244 $679,000 18.67% 233 $526,600 16.60% 181 $355,100 16.56% 198 $295,100 19.30%

Toronto Real Estate Board
Market Watch, February 2017
HISTORIC ANNUAL STATISTICS
27
Year Sales Average Price20052006200720082009201020112012201320142015
84,145 $335,90783,084 $351,94193,193 $376,23674,552 $379,34787,308 $395,46085,545 $431,27689,096 $465,01485,496 $497,13087,049 $522,95892,782 $566,624101,213 $622,121
2016 MONTHLY STATISTICS
NOTES1 - Sales, dollar volume, average sale prices and median sale prices are based on firm transactions entered into the TREB MLS® system between thefirst and last day of the month/period being reported.2 - New listings entered into the TREB MLS® system between the first and last day of the month/period being reported.3 - Active listings at the end of the last day of the month/period being reported.4 - Ratio of the average selling price to the average listing price for firm transactions entered into the TREB MLS® system between the first and last dayof the month/period being reported.5 - Average number of days on the market for firm transactions entered into the TREB MLS® system between the first and last day of the month/periodbeing reported.6 - Due to past changes to TREB's service area, caution should be exercised when making historical comparisons.7 - Past monthly and year-to-date figures are revised on a monthly basis.8 - SNLR = Sales-to-New Listings Ratio. Calculated using a 12-month moving average (sales/new listings).9 - Mos. Inv. = Months of Inventory. Calculated using a 12-month moving average (active listings/sales).
2017 MONTHLY STATISTICS
*For historic annual sales and average price data over a longer time frame go to:
JanuaryFebruary
MarchAprilMayJuneJuly
AugustSeptember
OctoberNovemberDecember
Year to Date
5,174 $769,3398,014 $875,983
- -- -- -- -- -- -- -- -- -- -
13,188 $822,661
JanuaryFebruaryMarchAprilMayJuneJuly
AugustSeptember
OctoberNovemberDecemberAnnual
4,640 $630,1937,583 $685,73810,260 $688,01112,017 $739,76712,791 $752,26612,727 $746,9569,932 $710,5569,750 $711,0019,831 $756,1179,720 $762,7678,507 $777,3015,313 $730,559
113,071 $729,918
1,6,7
1,7
1,7
http://www.torontorealestateboard.com/market_news/market_watch/historic_stats/pdf/TREB_historic_statistics.pdf
Copyright® 2017 Toronto Real Estate Board
$834,14413,188