february 2020 sustainable energy & fuels
TRANSCRIPT

SustainableEnergy & FuelsInterdisciplinary research for the development of sustainable energy technologies
rsc.li/sustainable-energy
Volume 4Number 2February 2020Pages 423–954
ISSN 2398-4902
PAPERHasan Baig et al.Increasing effi ciency of perovskite solar cells using low concentrating photovoltaic systems

SustainableEnergy & Fuels
PAPER
Ope
n A
cces
s A
rtic
le. P
ublis
hed
on 1
8 N
ovem
ber
2019
. Dow
nloa
ded
on 1
2/11
/202
1 12
:47:
22 A
M.
Thi
s ar
ticle
is li
cens
ed u
nder
a C
reat
ive
Com
mon
s A
ttrib
utio
n 3.
0 U
npor
ted
Lic
ence
.
View Article OnlineView Journal | View Issue
Increasing efficie
aUniversity of Exeter, Environment and Sus
Penryn, TR10 9FE, UK. E-mail: h.baig@exetbGroup for Molecular Engineering of Func
Sciences and Engineering, Ecole Polytechniq
CH-1951 Sion, SwitzerlandcCenter of Excellence for Advanced Mater
University, P.O. Box 80203, 21589 Jeddah,
† Electronic supplementary informa10.1039/c9se00550a
Cite this: Sustainable Energy Fuels,2020, 4, 528
Received 22nd July 2019Accepted 17th September 2019
DOI: 10.1039/c9se00550a
rsc.li/sustainable-energy
528 | Sustainable Energy Fuels, 2020, 4
ncy of perovskite solar cells usinglow concentrating photovoltaic systems†
Hasan Baig, *a Hiroyuki Kanda,b Abdullah M. Asiri,c
Mohammad Khaja Nazeeruddin b and Tapas Mallicka
Perovskite solar cell (PSC) technology is the flag bearer for the future of photovoltaics allowing unlimited
possibilities for its application. This technology is currently limited by issues related to its scale-up,
stability and the composition of the materials used in its preparation. Using small sized solar cells with
higher efficiency under solar concentration is gaining traction as a methodology for scaling up this
technology and broadening its applications. However, this has only been reported in devices with size <1
mm2 neglecting the series resistance of the device. Here, we report the performance of a 9 mm2 PSC at
varying solar concentration levels and correlate it with the series resistance of the solar cell. The n–i–p
structured device using a triple cation perovskite absorber with a mesoporous titanium oxide/SnO2 layer
as the electron transporting layer and Spiro-OMeTAD as the hole transporting material achieved a peak
efficiency of 21.6% under 1.78 Suns as compared to the 21% obtained under 1 Sun (1000W m�2) and
AM1.5G. We further boosted the power output up to 15.88 mW under 10.7 Suns compared to the 1.88
mW obtained under 1 Sun; however this results in an actual efficiency drop of the PSC owing to the
device series resistance. Further, we investigated the impact of the increasing solar cell temperature at
higher concentration levels and identified the influence of series resistance on the performance of the
PSC. Our work identifies the potential of concentrating photovoltaics and highlights the challenges and
makes recommendations for future development.
Introduction
Photovoltaic (PV) technology has continued to progress rapidlythrough its growing deployment and the innovation of newmaterials. While the global progress of silicon PVs continues todominate the industry,1 advanced materials such as perovskitesolar cells (PSCs) are reaching new levels of efficiency makingthem a potential alternative.2 The growth in PSC research isprimarily due to its excellent material properties and ease ofmanufacture. The idea of directly printing a high-efficiency PSCon any given substrate in a variety of shapes and sizes at lowercosts opens opportunities for many new PV products andmarkets that were previously not possible.3
The theoretical Shockley–Queisser limit imposed by thematerial band-gap dictates the electrical efficiency4 of singlejunction solar cells. Multi-junction solar cells overcome these
tainability Institute, University of Exeter,
er.ac.uk
tional Materials, Institute of Chemical
ue Federale de Lausanne, Valais Wallis,
ials Research (CEAMR), King Abdulaziz
Saudi Arabia
tion (ESI) available. See DOI:
, 528–537
limits by using a group of materials stacked together utilisingdifferent parts of the solar spectrum and accumulating theextracted power.5 Operating solar cells under concentratedsunlight results in an improvement in their efficiency.6 This isparticularly due to the high photon density incident on the solarcell which drives larger quasi-Fermi-level splitting in the semi-conductor absorber material delivering a higher output voltageand photovoltaic efficiency of the solar cells.7
By varying the ratio between I and Br in MAPb(IxBr1�x),8 thebandgap (Eg) of the perovskite material can be tuned fromaround 1.6 to 2.3 eV and this can be further reduced to �1.2 eVusing Sn compositions making them a very good candidate forfabricating multi-junction solar cells.9 The other advantage ofthese materials is the high absorption coefficient10 and longcharge carrier diffusion length.11–13 Whilst higher efficiencies(>21%) for single junction PSCs have been reported, these arepredominantly found in smaller sized PSCs (<1 mm2). The use ofconcentrator photovoltaics (CPVs) with a 0.81 mm2 sized PSC14
further increased the efficiency levels up to 23.1% opening upa new line of research combining PSCs with low concentratingphotovoltaic (LCPV) technologies. However, the tasks of identi-fying the effectiveness of this methodology and overcoming thepractical challenges remain. In the present study we investigatethe performance of a 9 mm2 PSC at low levels of solar concen-tration and create a new approach that can be realised for
This journal is © The Royal Society of Chemistry 2020
Paper Sustainable Energy & Fuels
Ope
n A
cces
s A
rtic
le. P
ublis
hed
on 1
8 N
ovem
ber
2019
. Dow
nloa
ded
on 1
2/11
/202
1 12
:47:
22 A
M.
Thi
s ar
ticle
is li
cens
ed u
nder
a C
reat
ive
Com
mon
s A
ttrib
utio
n 3.
0 U
npor
ted
Lic
ence
.View Article Online
designing PSCs for LCPV systems. Here, we experimentally eval-uate the performance of PSCs both on their own and whencoupled with an optical concentrator at different incident illu-mination levels and varying solar cell temperatures. The opticalconcentrator used in this study is a kaleidoscope with a breaking-symmetry top (12 mm � 12 mm) and a truncated pyramidgeometry and square exit aperture (3 mm � 3 mm). The PSCused in this study is a triple cation based n–i–p structuredperovskite solar cell.15,16 We observe that the electrical power ismagnied under concentrated sunlight. However, the internalseries resistance of the solar cell tends to decrease the ll factorsubstantially. While varying the illumination intensity levels weobserve that there exists an optimum solar concentration level forthe solar cell which is a function of its series resistance. There-fore, it will be possible to design a solar cell for low concentrationlevels through the reduction of the series resistance.
PSCs under solar concentration
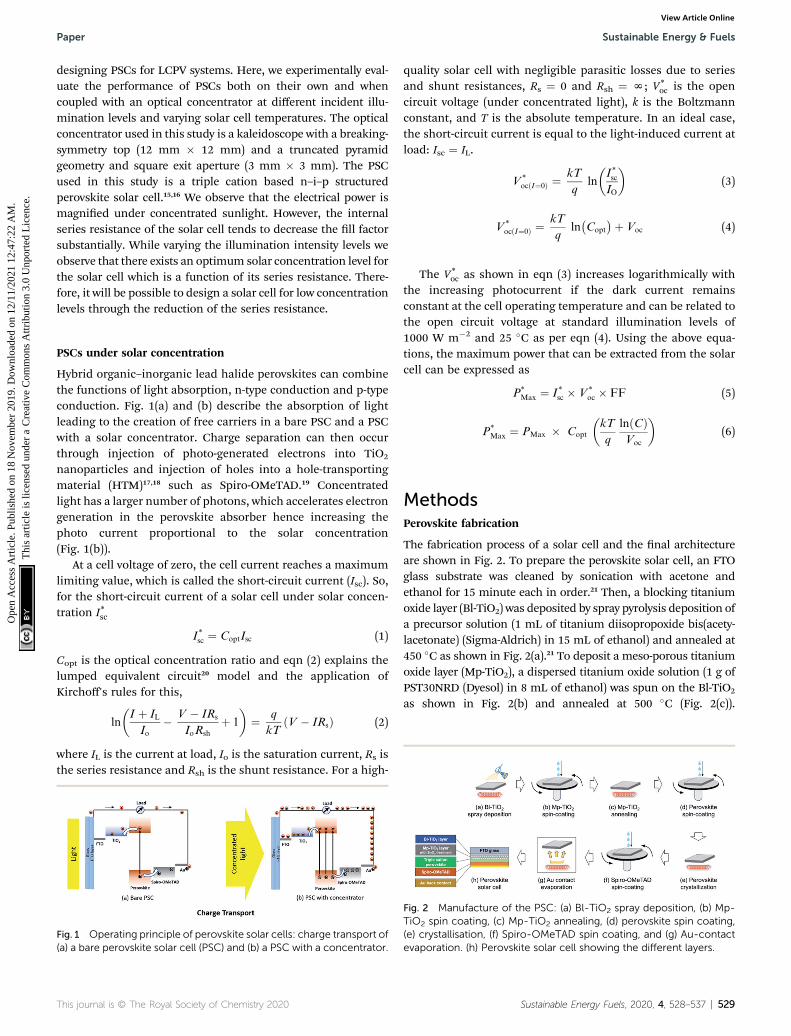
Hybrid organic–inorganic lead halide perovskites can combinethe functions of light absorption, n-type conduction and p-typeconduction. Fig. 1(a) and (b) describe the absorption of lightleading to the creation of free carriers in a bare PSC and a PSCwith a solar concentrator. Charge separation can then occurthrough injection of photo-generated electrons into TiO2
nanoparticles and injection of holes into a hole-transportingmaterial (HTM)17,18 such as Spiro-OMeTAD.19 Concentratedlight has a larger number of photons, which accelerates electrongeneration in the perovskite absorber hence increasing thephoto current proportional to the solar concentration(Fig. 1(b)).
At a cell voltage of zero, the cell current reaches a maximumlimiting value, which is called the short-circuit current (Isc). So,for the short-circuit current of a solar cell under solar concen-tration I*sc
I*sc ¼ CoptIsc (1)
Copt is the optical concentration ratio and eqn (2) explains thelumped equivalent circuit20 model and the application ofKirchoff's rules for this,
ln
�I þ IL
Io� V � IRs
IoRsh
þ 1
�¼ q
kTðV � IRsÞ (2)
where IL is the current at load, Io is the saturation current, Rs isthe series resistance and Rsh is the shunt resistance. For a high-
Fig. 1 Operating principle of perovskite solar cells: charge transport of(a) a bare perovskite solar cell (PSC) and (b) a PSC with a concentrator.
This journal is © The Royal Society of Chemistry 2020
quality solar cell with negligible parasitic losses due to seriesand shunt resistances, Rs ¼ 0 and Rsh ¼ N; V*
oc is the opencircuit voltage (under concentrated light), k is the Boltzmannconstant, and T is the absolute temperature. In an ideal case,the short-circuit current is equal to the light-induced current atload: Isc ¼ IL.
V*ocðI¼0Þ ¼
kT
qln
�I*scIO
�(3)
V*ocðI¼0Þ ¼
kT
qln�Copt
�þ Voc (4)
The V*oc as shown in eqn (3) increases logarithmically with
the increasing photocurrent if the dark current remainsconstant at the cell operating temperature and can be related tothe open circuit voltage at standard illumination levels of1000 W m�2 and 25 �C as per eqn (4). Using the above equa-tions, the maximum power that can be extracted from the solarcell can be expressed as
P*Max ¼ I*sc � V*
oc � FF (5)
P*Max ¼ PMax � Copt
�kT
q
lnðCÞVoc
�(6)
MethodsPerovskite fabrication
The fabrication process of a solar cell and the nal architectureare shown in Fig. 2. To prepare the perovskite solar cell, an FTOglass substrate was cleaned by sonication with acetone andethanol for 15 minute each in order.21 Then, a blocking titaniumoxide layer (Bl-TiO2) was deposited by spray pyrolysis deposition ofa precursor solution (1 mL of titanium diisopropoxide bis(acety-lacetonate) (Sigma-Aldrich) in 15 mL of ethanol) and annealed at450 �C as shown in Fig. 2(a).21 To deposit a meso-porous titaniumoxide layer (Mp-TiO2), a dispersed titanium oxide solution (1 g ofPST30NRD (Dyesol) in 8 mL of ethanol) was spun on the Bl-TiO2
as shown in Fig. 2(b) and annealed at 500 �C (Fig. 2(c)).
Fig. 2 Manufacture of the PSC: (a) Bl-TiO2 spray deposition, (b) Mp-TiO2 spin coating, (c) Mp-TiO2 annealing, (d) perovskite spin coating,(e) crystallisation, (f) Spiro-OMeTAD spin coating, and (g) Au-contactevaporation. (h) Perovskite solar cell showing the different layers.
Sustainable Energy Fuels, 2020, 4, 528–537 | 529

Sustainable Energy & Fuels Paper
Ope
n A
cces
s A
rtic
le. P
ublis
hed
on 1
8 N
ovem
ber
2019
. Dow
nloa
ded
on 1
2/11
/202
1 12
:47:
22 A
M.
Thi
s ar
ticle
is li
cens
ed u
nder
a C
reat
ive
Com
mon
s A
ttrib
utio
n 3.
0 U
npor
ted
Lic
ence
.View Article Online
Subsequently, a tin-oxide layer was deposited by spin-coating ofa precursor solution (0.1M tin chloride(IV) in deionized water) andannealed at 100 �C for 10 min and 190 �C for 1 h in air, and thenUV/O3 treatment was performed for 15 min. Aer that, theperovskite layer was formed by the spin-coating method(Fig. 2(d)). The perovskite solution was prepared with excess lead((FAPbI3)0.875(MAPbBr3)0.125(CsPbI3)0.1) by mixing lead iodide(1.2 M), lead bromide (0.15 M), formamidinium iodide (1.0 M),methylammonium bromide (0.15 M), and cesium iodide (0.13 M)in DMF/DMSO (4 : 1 v/v%). The spin-coating process was set asa two-step program with 2000 and 5000 rpm for 10 and 30seconds, respectively. 100 mL of chlorobenzene was dropped onthe substrate 10 seconds before spin-coating was complete.22 Aerthat, the perovskite layer was crystalized by annealing at 100 �C for1 hour (Fig. 2(e)). To deposit Spiro-OMeTAD as the hole-transportmaterial (HTM), an HTM solution was spun on the perovskitelayer at 4000 rpm for 30 seconds (Fig. 2(f)). The HTM solutionconsists of 80 mg of Spiro-OMeTAD diluted in 1023 mL of CB, 23mL of a Li-TFSI solution (196 mg of Li-TFSI in 379 mL of acetoni-trile), and 18 mL of a Co-complex solution (99mg of Co-complex in263 mL of acetonitrile).23 Finally, a 70 nm Au back-contact layerwas evaporated on the Spiro-OMeTAD layer (Fig. 2(g)) to completethe perovskite solar cell (Fig. 2(h)).
CPV assembly
The concentrator unit was fabricated by incorporating anoptical element on top of the solar cell and bonding it usinga UV curable optical adhesive. Enough adhesive is applied onthe base of the concentrator unit and then it is immediatelyplaced on the solar cell surface. The alignment of the opticalelement above the solar cell is very crucial and special precau-tions are taken while bonding it with the PSC. Once aligned, thebond is cured using a low power UV lamp. The bond sets withina few minutes of UV exposure. Room temperature curing wascarried out to avoid any misalignment of the concentrator andthe cell. The top surface of the solar cell is then completelymasked to prevent any excessive light reaching areas other thanthe active area of the solar cell under study.
Experimental
The performance of the PSC and the CPV unit was analysedusing a Newport Class-A solar simulator at EPFL. The solarsimulator consisted of a xenon lamp and a lter to provide anAM1.5G solar spectrum. The simulator was calibrated usinga silicon reference cell (LCE-50, Centronics) with a KG3 lter.This solar simulator had a maximum illumination area of 100�100 mm for a nominal working distance of 200 mm. It hada uniformity of irradiation higher than 96%. In the I–Vmeasurement, the PSC was illuminated via the solar simulatorand was connected to a continuously changing external appliedvoltage. The CPV unit was characterised at different angles ofincidence using a special setup at a constant illumination levelto achieve variable intensities of light on the PSC. A digitalprotractor was used to adjust the different slope angles of thedevice under test. The IV curve measurement of the CPV unitand the PSC was then carried out at 1000 W m�2 and was also
530 | Sustainable Energy Fuels, 2020, 4, 528–537
carried out by varying the intensity levels of the incoming solarradiation to generate a few other sets of illumination levels onthe PSC. Further, we investigated the stability of the PSC under 1Sun and a high irradiance of 1.78 Suns and the full AM1.5Gspectrum for a duration of 50 hours. A T-type thermocouple wasattached to the PSC device. The thermocouple conformed to theIEC 584 Class 1 standard and was capable of measuringtemperatures ranging from �75 �C to +260 �C. Two thermo-couples were used in this study to monitor the ambient and thePSC temperature simultaneously. The measurements were log-ged using an OMEGA RDXL2SD temperature recorder in equaltime intervals of 30 seconds. The CPV unit was exposed toa constant source of light with an intensity of 1000 W m�2 andthe I–V characteristics were recorded at different devicetemperatures. An ORIEL IQE 200B based at EPFL was used tocarry out the EQE experiments. The IQE 200B incorporateda patented detector geometry using a beam splitter, allowing forsimultaneous measurement of the EQE and the reective lossesto quantify the IQE. This measurement was performed byshining a monochromatic probe beam onto the sample andrecording the photocurrent generated as a function of wave-length. EQE analysis of the bare PSC and the CPV unit wasundertaken using IPCE adhering to the IEC 60904-8:2014standard to understand the changes in spectral response of thePSC when coupled with the optical element.
Results and discussionDevice performance
The devices shown in Fig. 3(a) and (b) were characterised undera standard AM1.5G spectrum and different illumination levelsof 1000 Wm�2, 530 Wm�2, 390 Wm�2 and 160 Wm�2. The I–Vcharacteristics are shown in Fig. 3(c) and (d). At 1000 Wm�2 themaximum power of the CPV unit was found to be 15.88 mW,which is very high compared to the 1.88 mW obtained via thePSC (8.4 times higher). The short-circuit current density wasfound to be 263.5 mA cm�2, which is 10.73 times higher thanthat of the non-concentrating counterpart. The reason for thelower power ratio compared to the short-circuit current ratio isdue to the reduction in ll factor of the CPV unit compared tothe non-concentrating counterpart. While the ll factor remainsconstant for the PSC (0.81), it is found to vary considerably forthe CPV unit dropping to 0.57 at 1000 Wm�2. It is interesting tonote that the ll factor of the CPV unit increases from 0.57 to0.79 as the illumination levels are reduced on the CPV unitindicating that the cell's performance depends on the intensitylevels more than on its distribution which remained constant inall the previous scenarios. The drop in FF also reduces themaximum power of the CPV unit.
The PSC and the CPV unit were characterised at differentangles of incidence at a constant illumination level. Since theincident angle of irradiation from the solar simulator could notbe changed, different incident angles were realised by changingthe inclination of the CPV unit and the PSC using a specialsetup. The results of this experiment are shown in Fig. 3(e) and(f). The impact of the reduced illumination at different angles ofincidence can clearly be seen on the CPV unit. Both the Isc and
This journal is © The Royal Society of Chemistry 2020
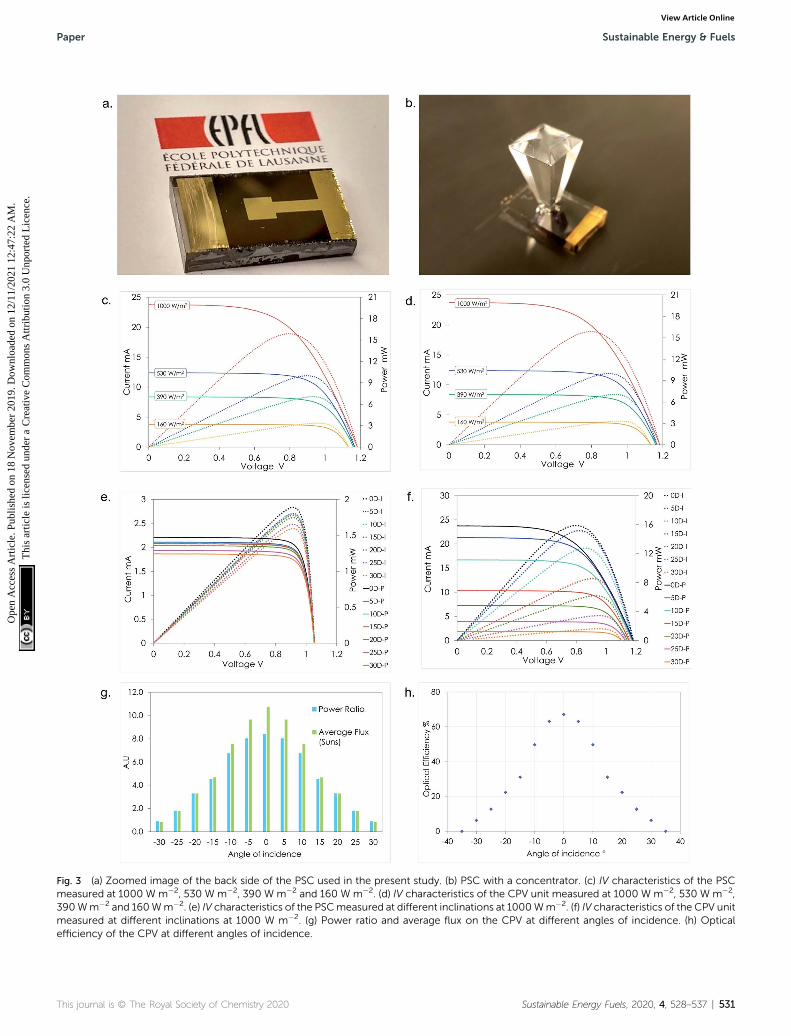
Fig. 3 (a) Zoomed image of the back side of the PSC used in the present study. (b) PSC with a concentrator. (c) IV characteristics of the PSCmeasured at 1000 W m�2, 530 W m�2, 390 W m�2 and 160 W m�2. (d) IV characteristics of the CPV unit measured at 1000 W m�2, 530 W m�2,390Wm�2 and 160Wm�2. (e) IV characteristics of the PSCmeasured at different inclinations at 1000Wm�2. (f) IV characteristics of the CPV unitmeasured at different inclinations at 1000 W m�2. (g) Power ratio and average flux on the CPV at different angles of incidence. (h) Opticalefficiency of the CPV at different angles of incidence.
This journal is © The Royal Society of Chemistry 2020 Sustainable Energy Fuels, 2020, 4, 528–537 | 531
Paper Sustainable Energy & Fuels
Ope
n A
cces
s A
rtic
le. P
ublis
hed
on 1
8 N
ovem
ber
2019
. Dow
nloa
ded
on 1
2/11
/202
1 12
:47:
22 A
M.
Thi
s ar
ticle
is li
cens
ed u
nder
a C
reat
ive
Com
mon
s A
ttrib
utio
n 3.
0 U
npor
ted
Lic
ence
.View Article Online

Sustainable Energy & Fuels Paper
Ope
n A
cces
s A
rtic
le. P
ublis
hed
on 1
8 N
ovem
ber
2019
. Dow
nloa
ded
on 1
2/11
/202
1 12
:47:
22 A
M.
Thi
s ar
ticle
is li
cens
ed u
nder
a C
reat
ive
Com
mon
s A
ttrib
utio
n 3.
0 U
npor
ted
Lic
ence
.View Article Online
the Voc drop with the increasing angle of incidence. Using theabove equations, the maximum power that can be extractedfrom the solar cell can be expressed as
PR ¼ P*Max
PMax
(7)
The power ratio (PR) is the ratio of the maximum poweroutput of the CPV unit when compared to the PSC under similaroperating conditions. Unlike the optical concentration ratio,the power ratio considers the change in ll factor and opencircuit voltage in a CPV unit compared to the PSC counterpartwhile exposed to similar conditions. The power ratio reveals theperformance of the concentrator in a CPV module in terms ofthe increase in the total power output. Fig. 3(g) shows the powerratio and the optical concentration ratio (average intensity) atdifferent angles of incidence.
The power ratio of the CPV unit is found to vary between 1and 10.7 for different incidence angles. A maximum power ratioof 8.4 is found to occur at a 0� incidence angle and the lowest isrecorded for 1000 W m�2 at a 30� inclination. Beyond the 30�
inclination, the performance drops sharply and decreases toa nil value. The optical efficiency estimates the fraction ofincident energy on the aperture that reaches the solar cellconsidering all the possible losses. The light rays incident onthe aperture of the CPV unit will enter the optical element witha surface reection component at the air–glass interface;further they are refracted within the optical element and reachthe solar cell surface due to total internal reection. The opticalefficiency hopt is calculated in terms of the Isc of the PSC andCPV unit using eqn (8) and is shown in Fig. 3(h)
hopt ¼IConcsc
IPSCsc
1
CG
(8)
where IConcsc is the short-circuit current of the CPV unit, IPSCsc isthe short-circuit current of the PSC and CG is the geometricalconcentration ratio.
Fig. 4 J–V curves of the PSC under 1.78 Suns and the correspondingefficiency over time.
Impact of temperature
The key challenge for unlocking the potential of PSCs is thedevelopment of perovskite-based PVs combining high PCE andoperational stability.24 The temperature-induced performancelosses caused due to the incoming solar radiation impact thecharge extraction and decrease the overall performance of thesystem. Previous studies highlighted that the mismatch inthermal expansion coefficients25 and low fracture energy oflayers in perovskite solar cells can impact the mechanicalintegrity of perovskite solar cells. Solar concentration increasesthe number of photons incident on the solar cell, but at thesame time it accelerates the temperature rise within the PSC.The generated current of a solar cell is a function of the numberof photons hitting the photovoltaic surface. The higher illumi-nation in CPV devices amplies the photo-generated currentwhich converts the incident radiation to electrical power.Simultaneously, the dark current being dissipative in naturetries to reduce the solar cell efficiency. The dark current which is
532 | Sustainable Energy Fuels, 2020, 4, 528–537
a function of the solar cell operating temperature reduces theVoc and thereby reduces the power output from the system. Thetemperature sensitivity of open-circuit voltage is highly criticalas it accounts for 80–90% of the temperature coefficient ofefficiency.26 For the rst time, we investigate the impact oftemperature on a PSC coupled to a solar concentrator as shownin Fig. 5(a) and (b).
The short-circuit current depends on the number of photonsthat can create an electron–hole pair. With solar concentration,the number of photons incident on the solar cells is ampliedas is the short-circuit current when examined at 25 �C. However,being exposed continuously to concentrated illumination tendsto raise the temperature of the device. It is very well known thatthe short-circuit current density increases slightly withtemperature solar cell/device. This occurs fundamentallybecause of the decrease in bandgaps with temperature for mostsemiconductors; however this is not true for PSCs. For perov-skites, the bandgap (Eg) increases with temperature and hencethe temperature dependence of Isc,ideal is negative. The short-circuit current can be expressed as the product of an idealnumber of photons incident on the solar cell per unit area of thesolar cell known as Photon Flux Density (PFD).
Isc ¼ Isc,ideal � fcIsc (9)
Isc;ideal ¼ qA
ðNEgðTcÞ
PFD ðEÞdE (10)
Under concentrated light this can be further represented as
Isc ¼ Copt � Isc,ideal � fc (11)
This journal is © The Royal Society of Chemistry 2020

Fig. 5 Electrical characteristics of the PSCwith a concentrator at different temperatures: (a) I–V characteristics at varying temperatures; both theIsc and Voc can be seen to decrease with the increasing temperature. (b) P–V characteristics at varying temperatures; both the MPP and FF can beseen to decrease with the increasing temperature. (c) Variation of short-circuit current with the temperature differential. (d) Variation of opencircuit voltage with the temperature differential.
Paper Sustainable Energy & Fuels
Ope
n A
cces
s A
rtic
le. P
ublis
hed
on 1
8 N
ovem
ber
2019
. Dow
nloa
ded
on 1
2/11
/202
1 12
:47:
22 A
M.
Thi
s ar
ticle
is li
cens
ed u
nder
a C
reat
ive
Com
mon
s A
ttrib
utio
n 3.
0 U
npor
ted
Lic
ence
.View Article Online
The temperature dependence of Isc,ideal is related to on thetemperature dependence of the bandgap. It is important to notethat minor changes in Eg can inuence the output current,measured with a solar simulator, if the bandgap is near a peakof the spectrum. The temperature coefficient26 of the short-circuit current can then be described as follows:
bIsc ¼1
Isc;ideal
dIsc
dT¼ 1
Isc;ideal
Isc;ideal
dEg
dEg
dTþ 1
fc
dfc
dT(12)
Fig. 5(c) shows the variation of the short-circuit current withrespect to the temperature. It can be clearly noted that the Iscdecreases with the increasing temperature linearly. We observethat the Isc drops by 0.16 mA with every degree rise in temper-ature. The average bIsc estimated under concentration (10.7x) isfound to be�6513 ppm �C�1. The temperature coefficient of theopen circuit voltage27 can then be described as shown in eqn(13).
bVoc¼ 106
Voc;ideal
dVoc
dT¼ 106
Voc;25C
VocðTÞ � Vocð25 CÞT � 25
(13)
The average bVocestimated under concentration (10.7x) is
found to be �9402 ppm �C�1. Fig. 5(d) shows the variation of
This journal is © The Royal Society of Chemistry 2020
the Voc with respect to the temperature dropping by 9.8 mV withevery degree rise in temperature.
Device stability
Although PSC devices are progressing towards excellent effi-ciencies, their lack of stability under prolonged solar irradiationremains unresolved and seriously undermines their commer-cialization. Further, a lack of standard reporting procedures forPSCs oen makes it difficult to understand the differentmechanisms responsible for the degradation. A previous study14
used liquid nitrogen to cool the PSC and maintain its temper-ature while performing the stability tests, which cannot beregarded as a true representative of the real-time operatingperformance assessment of the device. In order to assess thestability of the PSC under solar concentration, we measure theJV characteristics by placing the device under concentratedsunlight (1.78 Suns applying forced convection using a coolingfan) and present the results in Fig. 4. We observed that theperformance sharply drops during the initial 10 min period dueto the non-recoverable permanent degradation of the device28
occurring at the beginning of its operation also referred to asthe device burn-in. We observed good stability under 1.78 Sunirradiance for 5 hours, with the cell maintaining 81% of itsefficiency aer the burn-in period. Further, we measured the
Sustainable Energy Fuels, 2020, 4, 528–537 | 533

Fig. 6 Comparison of (a) Isc, (b) Voc, and (c) FF. (e) Electrical efficiency of perovskite solar cell devices measured under various solar concen-trations (up to 10.8 Suns). (d) EQE of the PSC and the CPV unit. (f) Impact of series resistance on the electrical efficiency of the PSC under differentsolar concentrations.
Sustainable Energy & Fuels Paper
Ope
n A
cces
s A
rtic
le. P
ublis
hed
on 1
8 N
ovem
ber
2019
. Dow
nloa
ded
on 1
2/11
/202
1 12
:47:
22 A
M.
Thi
s ar
ticle
is li
cens
ed u
nder
a C
reat
ive
Com
mon
s A
ttrib
utio
n 3.
0 U
npor
ted
Lic
ence
.View Article Online
device aer resting in the dark and observed an average 0.75%gain in the device efficiency. A more serious degradation of thedevice is seen aer this, further leading to the end of its life.
Interpretation, validity and practical relevance of the results
The short-circuit current varies linearly with the increasing illumi-nation levels on the PSC in accordancewith eqn (1). The variation ofthe short-circuit current and the open circuit voltage as a functionof the number of Suns incident on the PSC is shown in Fig. 6(a) and(b), respectively. The Isc varies linearly with the increasing levels ofsolar concentration and the open circuit voltage increases
534 | Sustainable Energy Fuels, 2020, 4, 528–537
exponentially with increasing solar concentration. The rate ofincrease of the Voc can be observed to bemaximumbetween 1 and 2Suns and further stabilises at higher concentration levels reachinga maximum value of 1.18 V at 10.8 Suns.
The ll factor is a good measure of the PSC's electricalperformance; however, it is important to note that the ll factordrops under solar concentration as shown in Fig. 6(c). This isprimarily due to the increased current being drawn from thePSC along with the internal series resistance of the cell. It mustalso be noted that the PSC used in the current study was notoptimised for use under higher solar concentration and the llfactor drop originates from the resistance from the charge
This journal is © The Royal Society of Chemistry 2020

Paper Sustainable Energy & Fuels
Ope
n A
cces
s A
rtic
le. P
ublis
hed
on 1
8 N
ovem
ber
2019
. Dow
nloa
ded
on 1
2/11
/202
1 12
:47:
22 A
M.
Thi
s ar
ticle
is li
cens
ed u
nder
a C
reat
ive
Com
mon
s A
ttrib
utio
n 3.
0 U
npor
ted
Lic
ence
.View Article Online
extraction layers, contact resistance between the internal layersof the solar cell and parasitic resistance in the uorine-dopedtin oxide (FTO) transparent conducting electrodes.
The quantum efficiency is the ratio of the number of carrierscollected by the solar cell to the number of photons of a givenenergy incident on the solar cell. It is usually expressed asa function of either wavelength or energy. If all photons ofa certain wavelength are absorbed and the resulting minoritycarriers are collected, then the quantum efficiency at thatwavelength is unity. The external quantum efficiency (EQE)/internal photon conversion efficiency (IPCE) includes theeffect of optical losses such as transmission and reection. Dueto the absorption of light by the material of the optical element,the EQE of the CPVmodule drops in the range of 300–400 nm asshown in Fig. 6(d). The decrease in EQE of the CPV unit over therange of 400 nm to 1100 nm is due to the optical losses in theconcentrator which are negligible. The absorption of lightbelow 400 nm reduces the performance of the systemsubstantially. On integrating the EQE for both the bare PSC andthe PSC with the optical element it was found that the EQEdrops by 8.1% due to the absorption by the glass material ofwhich a 7% drop occurs in the spectral range below 400 nm.
The electrical efficiency is dened as the ratio of maximumcell power output to the incoming irradiance on the solar cellsurface. For the PSC under solar concentration, the electricalefficiency may be expressed as h*elec where G* is the incomingconcentrated solar radiation.
h*elec ¼ P*
Max
�G* (14)
h*elec ¼ helec
�1þ kT
q
lnðCÞVoc
�(15)
Efficiency increases between 1 and 2 Suns and then drops asshown in Fig. 6(e). This indicates that the PSC under study wouldperform optimally at 1.78 Suns. The efficiency at 1 Sun for thechampion device was 21%; the same cell was attached to anoptical element and the efficiency was found to increase to 21.6%at 1.78 Suns. Ideally, the electrical efficiency of the cell shouldincrease with solar concentration, but losses caused due tointernal resistances tend to decrease the power output substan-tially, which means there is an optimum level of solar concen-tration that a specic design of solar cell would be able to achieve.
Impact of series resistance
Theoretically, the efficiency of a solar cell increases slightlyunder concentrated light as shown in eqn (10) because bothoutput and input energies increase due to solar concentration.However, this is not the case as losses occur within the solar celldue to the cell series resistance (Rs). The higher the seriesresistance, the greater the power losses. The power lost throughthe PSC can be expressed as
Ploss ¼�I*sc�2 � Rs (16)
Under solar concentration the amount of current producedis magnied as is the I2R loss experienced by the solar cell.
This journal is © The Royal Society of Chemistry 2020
Under solar concentration the effect of series resistance iscorrelated linearly with the collection efficiency of the concen-trator, meaning increased resistive losses with increasingconcentration. The power loss increases with the increasingsolar concentration, and hence there is a drop in the ll factoras seen earlier with increasing solar concentration. We haveused the measured parameters in the present study obtained at1 Sun to evaluate the impact of series resistance on the electricalefficiency of the PSC.
In Fig. 6(e) it can clearly be seen that the electrical efficiencyimproves with increasing solar concentration and decreasingseries resistance. The PSC can have different optimumconcentration ratios of operation depending on its seriesresistance. The lower the series resistance the higher theoptimum solar concentration under which the device canoperate. An important point to note however is that the seriesresistance of the PSC may change at different concentrationlevels as it can be a function of the operating solar celltemperature which changes signicantly when exposed to solarconcentration. A detailed study on these aspects needs to becarried out in the future.
The performance of the perovskite solar cells under solarconcentration becomes limited due to the series resistance ofthe device. One of the major contributors to the series resis-tance is the transparent conductive oxide layer of the FTO glasswhich has an electrical conductivity of 1 � 10�4 to 1 � 10�3
U cm. The resistive losses tend to decrease the ll factor of thePSC, hence limiting its overall performance. In perovskite solarcells the conductivity of the FTO lm can, in principle, beenhanced by increasing the thickness, but this will decrease itstransparency and can again impact the PSC performance.Varying the light intensity incident on a solar cell changes allthe solar cell parameters and the impact of series and shuntresistances. Fig. 6(f) shows the variation of the series resistancewith illumination intensity. Increasing the light intensity on thePSC tends to vary the series resistance of the cell between 4.37and 12.5 U. The electrical efficiency of the PSC is also plottedwith the increasing illumination levels. It was observed that theseries resistance linearly increased with solar concentration.
Future directionsSolar cell design
In the PSC the current ows across its active area; the resistivelosses are simply calculated by multiplying current, sheetresistance and distance from the active area to the metal elec-trode. An effective method to decrease the impact of the seriesresistance could be to form a bass bar and nger on the FTOglass to decrease the distance as an advanced design architec-ture for perovskite solar cells with a concentrator. Further,depositing conductive grids and/or constructing interconnectedunit cells can be used to reduce resistance.
Stability and reliability
Although using established methods from the silicon PVindustry in reporting the performance indices of PSCs might
Sustainable Energy Fuels, 2020, 4, 528–537 | 535

Sustainable Energy & Fuels Paper
Ope
n A
cces
s A
rtic
le. P
ublis
hed
on 1
8 N
ovem
ber
2019
. Dow
nloa
ded
on 1
2/11
/202
1 12
:47:
22 A
M.
Thi
s ar
ticle
is li
cens
ed u
nder
a C
reat
ive
Com
mon
s A
ttrib
utio
n 3.
0 U
npor
ted
Lic
ence
.View Article Online
seem like a good idea, it is important to note that the degra-dation mechanisms and their impact are very different in PSCdevices compared to those of silicon. Understanding the keydifferences and their potential is crucial for the success of thePSC industry. The PV module qualication tests (e.g., IEC 61215and IEC 61646) have an element of UV Preconditioning thatrequires 15 kW h m�2 of total UVA + UVB exposure (280–400nm) and at least 5 kW h m�2 of UVB exposure (280–320 nm).This equates to exposure to a standard AM 1.5G light sourceover several months. This might have a limited impact on thesilicon PV panels but can prove to be signicantly detrimentalfor PSC devices.
The TiO2-based electron transport layer widely used in high-performance PSCs causes photocatalytic degradation under UVillumination. Optical materials with UV-stabilisers that restrictthe UV part of solar spectrum (<400 nm) from reaching the solarcell can be employed to construct solar concentrators. Thismethod can partially reduce the power output from the cell dueto the change in its transparency levels but can potentiallyimprove the stability of the device under outdoor conditions.Further studies need to be carried out to explore these impacts.
Upscaling
Smaller sized PSCs have been shown to have higher efficienciesand it would be sensible to assemble systems comprising severalsmaller sized solar cells. Further, coupling them with otherapplications such as building integration may open new marketsfor this technology whilst solving its issues of scalability. LCPVshave a very huge advantage in terms of their application inclimates with lower DNI and diffuse radiation whichmakes themcapable of being widely adopted. The broader applications notonly mean a larger market but LCPVs using PSCs also takeadvantage of lower material costs and signicantly lower energypayback time. Further, employing this technique with addedadvantages of an aesthetically pleasing architecture may prove tond wider adoption in the market.
Conclusions
This paper discussed the performance of a PSC under differentsets of illumination conditions and solar cell temperatures. Theshort-circuit current density of the PSC tends to linearly increasewith the incoming solar radiation levels. The open circuit voltageof the solar cell also changes logarithmically with increasingillumination levels. However, the ll factor of the device wasfound to drop substantially which reduces the efficiency of thesolar cell and the maximum power that could be extracted fromthe device. The temperature dependences of both the short-circuit current and the open circuit voltage were also investi-gated under low concentration levels. It is suggested that modi-cations to the device series resistance would be the pathwayneeded for further development of the PSC for LCPV systems.
Conflicts of interest
There are no conicts to declare.
536 | Sustainable Energy Fuels, 2020, 4, 528–537
Acknowledgements
H. B. acknowledges the support of the EPSRC IAA (EP/K022156/1) and is thankful to the Group for Molecular Engineering ofFunctional Materials at EPFL for hosting him. The projectleading to this application has received funding from theEuropean Union's Horizon 2020 research and innovation pro-gramme under grant agreement No. 763989 of the APOLOproject.
References
1 Fraunhofer Institute for Solar and Systems, PhotovoltaicsReport, Germany, 2018.
2 H. J. Snaith, Nat. Mater., 2018, 17, 372–376.3 C. Ballif, L.-E. Perret-Aebi, S. Luin and E. Rey, Nat. Energy,2018, 3, 438–442.
4 W. Shockley and H. J. Queisser, J. Appl. Phys., 1961, 32, 510–519.
5 P. Loper, S.-J. Moon, S. Martın de Nicolas, B. Niesen,M. Ledinsky, S. Nicolay, J. Bailat, J.-H. Yum, S. De Wolf andC. Ballif, Phys. Chem. Chem. Phys., 2015, 17, 1619–1629.
6 H. Baig, K. C. Heasman and T. K. Mallick, RenewableSustainable Energy Rev., 2012, 16, 5890–5909.
7 H. Cotal, C. Fetzer, J. Boisvert, G. Kinsey, R. King, P. Hebert,H. Yoon and N. Karam, Energy Environ. Sci., 2009, 2, 174–192.
8 M. I. H. Ansari, A. Qurashi and M. K. Nazeeruddin, J.Photochem. Photobiol., C, 2018, 35, 1–24.
9 T. C.-J. Yang, P. Fiala, Q. Jeangros and C. Ballif, Joule, 2018, 2,1421–1436.
10 S. De Wolf, J. Holovsky, S. J. Moon, P. Loper, B. Niesen,M. Ledinsky, F. J. Haug, J. H. Yum and C. Ballif, J. Phys.Chem. Lett., 2014, 5, 1035–1039.
11 A. Mei, X. Li, L. Liu, Z. Ku, T. Liu, Y. Rong, M. Xu, M. Hu,J. Chen, Y. Yang, M. Gratzel and H. Han, Science, 2014,345, 295–298.
12 D. B. Mitzi, S. Wang, C. A. Feild, C. A. Chess, A. M. Guloy,M. K. Nazeeruddin, E. W. Diau, C. Y. Yeh,S. M. Zakeeruddin and M. Gratzel, Science, 1995, 267,1473–1476.
13 S. D. Stranks, G. E. Eperon, G. Grancini, C. Menelaou,M. J. P. Alcocer, T. Leijtens, L. M. Herz, A. Petrozza andH. J. Snaith, Science, 2013, 342, 341–344.
14 Z. Wang, Q. Lin, B. Wenger, M. G. Christoforo, Y.-H. Lin,M. T. Klug, M. B. Johnston, L. M. Herz and H. J. Snaith,Nat. Energy, 2018, 3, 855–861.
15 K. T. Cho, G. Grancini, Y. Lee, E. Oveisi, J. Ryu, O. Almora,M. Tschumi, P. A. Schouwink, G. Seo, S. Heo, J. Park,J. Jang, S. Paek, G. Garcia-Belmonte andM. K. Nazeeruddin, Energy Environ. Sci., 2018, 11, 952–959.
16 M. Saliba, T. Matsui, J.-Y. Seo, K. Domanski, J.-P. Correa-Baena, M. K. Nazeeruddin, S. M. Zakeeruddin, W. Tress,A. Abate, A. Hagfeldt and M. Gratzel, Energy Environ. Sci.,2016, 9, 1989–1997.
17 J. C. Brauer, Y. H. Lee, M. K. Nazeeruddin and N. Banerji, J.Phys. Chem. Lett., 2015, 6, 3675–3681.
This journal is © The Royal Society of Chemistry 2020
Paper Sustainable Energy & Fuels
Ope
n A
cces
s A
rtic
le. P
ublis
hed
on 1
8 N
ovem
ber
2019
. Dow
nloa
ded
on 1
2/11
/202
1 12
:47:
22 A
M.
Thi
s ar
ticle
is li
cens
ed u
nder
a C
reat
ive
Com
mon
s A
ttrib
utio
n 3.
0 U
npor
ted
Lic
ence
.View Article Online
18 S. Ameen, M. A. Rub, S. A. Kosa, K. A. Alamry, M. S. Akhtar,H.-S. Shin, H.-K. Seo, A. M. Asiri and M. K. Nazeeruddin,ChemSusChem, 2016, 9, 10–27.
19 S. Fantacci, F. De Angelis, M. K. Nazeeruddin andM. Gratzel,J. Phys. Chem. C, 2011, 115, 23126–23133.
20 H. Baig, N. Sarmah, K. C. Heasman and T. K. Mallick, Sol.Energy Mater. Sol. Cells, 2013, 113, 201–219.
21 H. Kanda, A. Uzum, H. Nishino, T. Umeyama, H. Imahori,Y. Ishikawa, Y. Uraoka and S. Ito, ACS Appl. Mater.Interfaces, 2016, 8, 33553–33561.
22 K. T. Cho, S. Paek, G. Grancini, C. Roldan-Carmona, P. Gao,Y. Lee and M. K. Nazeeruddin, Energy Environ. Sci., 2017, 10,621–627.
23 J. Burschka, N. Pellet, S.-J. Moon, R. Humphry-Baker, P. Gao,M. K. Nazeeruddin and M. Gratzel, Nature, 2013, 499, 316–320.
This journal is © The Royal Society of Chemistry 2020
24 G. Grancini, C. Roldan-Carmona, I. Zimmermann,E. Mosconi, X. Lee, D. Martineau, S. Narbey, F. Oswald,F. De Angelis, M. Graetzel and M. K. Nazeeruddin, Nat.Commun., 2017, 8, 15684.
25 R. Cheacharoen, N. Rolston, D. Harwood, K. A. Bush,R. H. Dauskardt and M. D. McGehee, Energy Environ. Sci.,2018, 11, 144–150.
26 M. A. Green, Prog. Photovoltaics, 2003, 11, 333–340.27 J. A. Schwenzer, L. Rakocevic, R. Gehlhaar, T. Abzieher,
S. Gharibzadeh, S. Moghadamzadeh, A. Quintilla,B. S. Richards, U. Lemmer and U. W. Paetzold, ACS Appl.Mater. Interfaces, 2018, 10, 16390–16399.
28 Q. Wang, N. Phung, D. Di Girolamo, P. Vivo and A. Abate,Energy Environ. Sci., 2019, 12, 865–886.
Sustainable Energy Fuels, 2020, 4, 528–537 | 537