federal aviation administration gbas integrity and …laas.tc.faa.gov/documents/caac/caac 3 gbas...
TRANSCRIPT

Federal AviationAdministration
GBAS Integrity and GBAS Integrity and GBAS Key Risk AreasGBAS Key Risk Areas
Presented by: Presented by:
John Warburton John Warburton --
Manager, Engineering Manager, Engineering Development Services Navigation Team Development Services Navigation Team Manager (AJPManager (AJP--652)652)
Date:Date:
October 19, 2010October 19, 2010
Key Integrity Risks 2Federal AviationAdministrationOctober 19, 2010
Overview
•
GBAS Integrity Method•
Key Risk Area/Algorithm Description Document Link
•
Risk Area Details•
Summary
Thanks to Zeta Associates, Ohio University, Illinois Institute of Technology who provided data and/or analysis included in this briefing
Key Integrity Risks 3Federal AviationAdministrationOctober 19, 2010
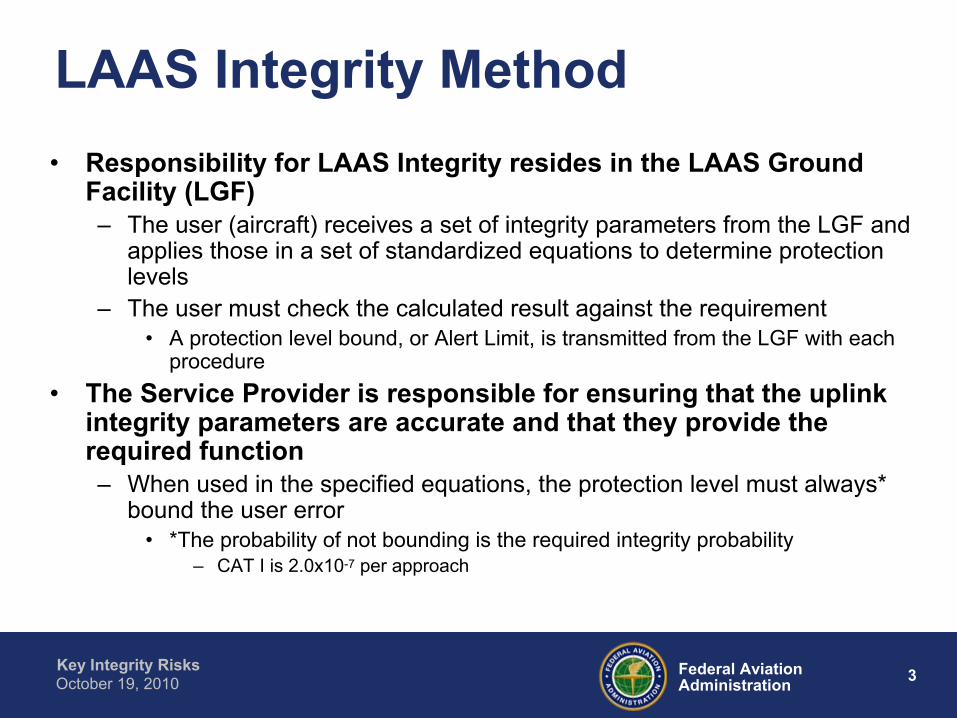
LAAS Integrity Method•
Responsibility for LAAS Integrity resides in the LAAS Ground Facility (LGF)–
The user (aircraft) receives a set of integrity parameters from the LGF and applies those in a set of standardized equations to determine protection levels
–
The user must check the calculated result against the requirement•
A protection level bound, or Alert Limit, is transmitted from the LGF with each procedure
•
The Service Provider is responsible for ensuring that the uplink
integrity parameters are accurate and that they provide the required function–
When used in the specified equations, the protection level must always* bound the user error
•
*The probability of not bounding is the required integrity probability–
CAT I is 2.0x10⁻⁷
per approach

Key Integrity Risks 4Federal AviationAdministrationOctober 19, 2010
FAA LAAS Flight Test @ ACYNavigational Sensor Error (NSE)
Vertical NSE
VPL
nVPL
VPLI
nVPLI
TSP
I vs
LTP
NS
E(m
)
NMI from TDZN39 / RWY31 FAATC / 01-Apr-03 B / Appr#003
-1.00
-2.00
-3.00
-4.00
-5.00
0.00
1.00
2.00
3.00
4.00
5.00
-1.0
0
-2.0
0
-3.0
0
-4.0
0
-5.0
0
-6.0
0
-7.0
0
-8.0
0
-9.0
0
-10.
00
-11.
00
-12.
00
-13.
00
-14.
00
-15.
00
-16.
00
-17.
00
-18.
00
-19.
00
-20.
00
0.00
1.00
Integrity Performance Protection Level Bounding
Single Approach example of protection level bounding
Vertical NSE and vertical protectionLevel
Vertical NSE isalways less thanthe calculated protection level
Navigation Flags aredisplayed when VPLexceeds VAL, 10M at 200 ft HAT
Key Integrity Risks 5Federal AviationAdministrationOctober 19, 2010
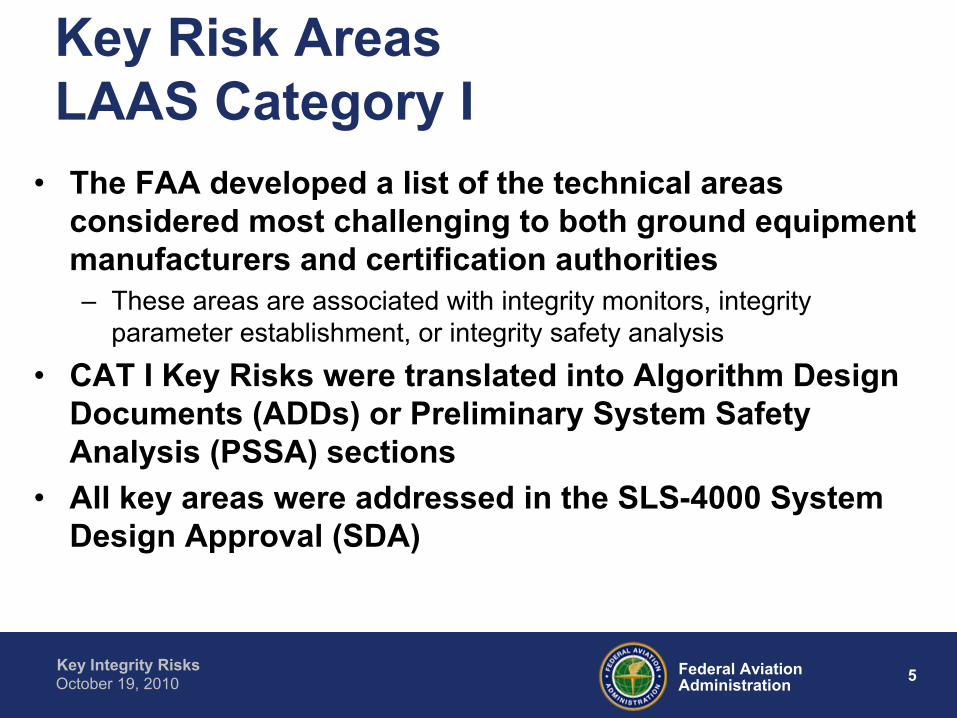
Key Risk Areas LAAS Category I
•
The FAA developed a list of the technical areas considered most challenging to both ground equipment manufacturers and certification authorities–
These areas are associated with integrity monitors, integrity parameter establishment, or integrity safety analysis
•
CAT I Key Risks were translated into Algorithm Design Documents (ADDs) or Preliminary System Safety Analysis (PSSA) sections
•
All key areas were addressed in the SLS-4000 System Design Approval (SDA)

Key Integrity Risks 6Federal AviationAdministrationOctober 19, 2010
Key Risk AreasKRA ADD Priority Description
1 PSSA Position Domain to Range Domain Transformation
2 PSSA Per Approach Integrity (Re-scoped and renamed)
3 (1) 1 Correct PR Distribution (
pr_gnd)–
Temporal Variation Effects3 (2) 1 Corrected PR Distribution (
pr_gnd)–
Site Variation Effects3 (3) 1 Corrected PR Distribution (
pr_gnd)–
Time Correlation Effects (e.g., measurement sampling rate effects)
3 (4) 1 Corrected PR Distribution (
pr_gnd)–
AZ/EL Correlation

Key Integrity Risks 7Federal AviationAdministrationOctober 19, 2010
Key Risk Areas (Continued)KRA ADD Priority Description3(5) 1 RR Independence (
pr_gnd)
3(6) 1 Iono Divergence (
pr_gnd)
4 2 Non-Zero Mean
5 14, PSSA
RFI
6 3 Sigma Monitoring
7 4 Sigma Iono Characterization and Monitoring
8 5 Sigma Tropo
Characterization and Monitoring
9 6 Ephemeris (Type B) Characterization and Monitoring
Key Integrity Risks 8Federal AviationAdministrationOctober 19, 2010
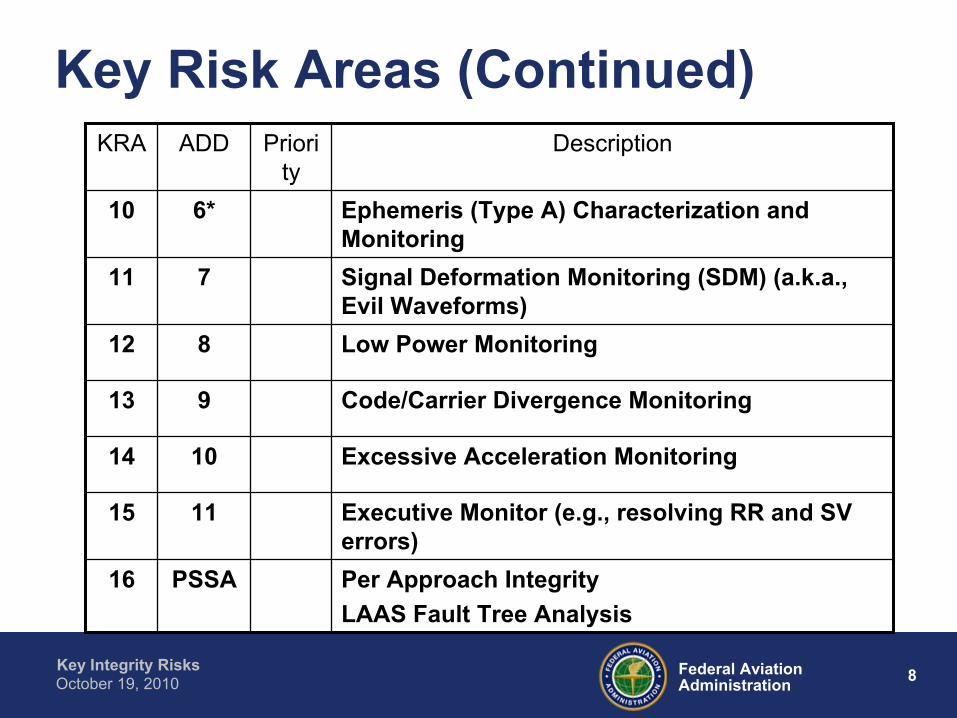
Key Risk Areas (Continued)KRA ADD Priori
ty
Description
10 6* Ephemeris (Type A) Characterization and Monitoring
11 7 Signal Deformation Monitoring (SDM) (a.k.a., Evil Waveforms)
12 8 Low Power Monitoring
13 9 Code/Carrier Divergence Monitoring
14 10 Excessive Acceleration Monitoring
15 11 Executive Monitor (e.g., resolving RR and SV errors)
16 PSSA Per Approach IntegrityLAAS Fault Tree Analysis
Key Integrity Risks 9Federal AviationAdministrationOctober 19, 2010
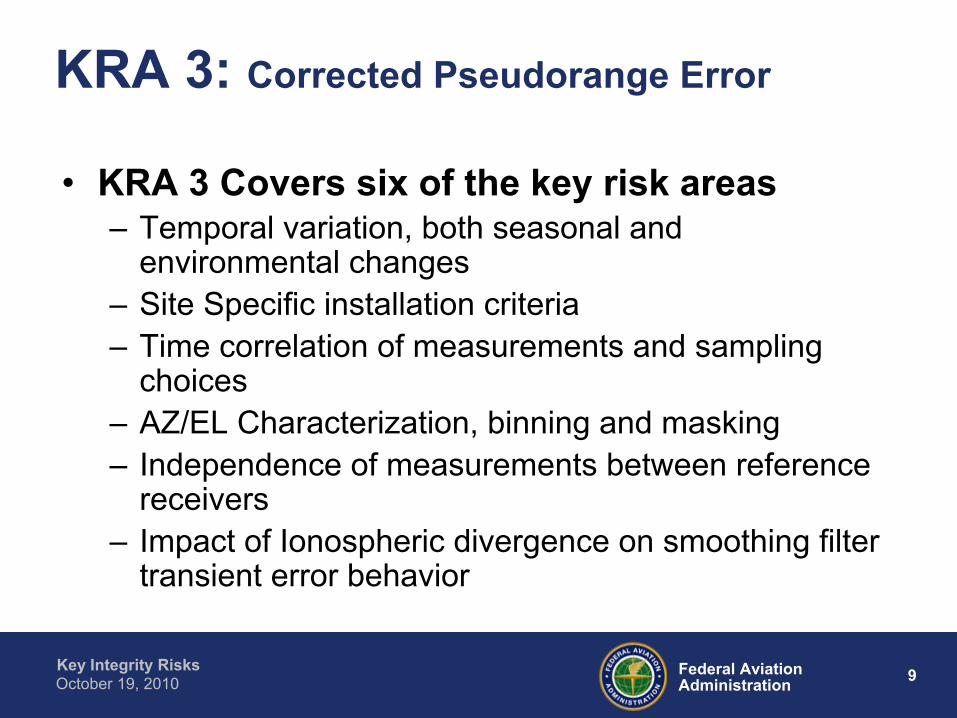
KRA 3: Corrected Pseudorange Error
•
KRA 3 Covers six of the key risk areas–
Temporal variation, both seasonal and environmental changes
–
Site Specific installation criteria–
Time correlation of measurements and sampling choices
–
AZ/EL Characterization, binning and masking–
Independence of measurements between reference receivers
–
Impact of Ionospheric divergence on smoothing filter transient error behavior

Key Integrity Risks 10Federal AviationAdministrationOctober 19, 2010
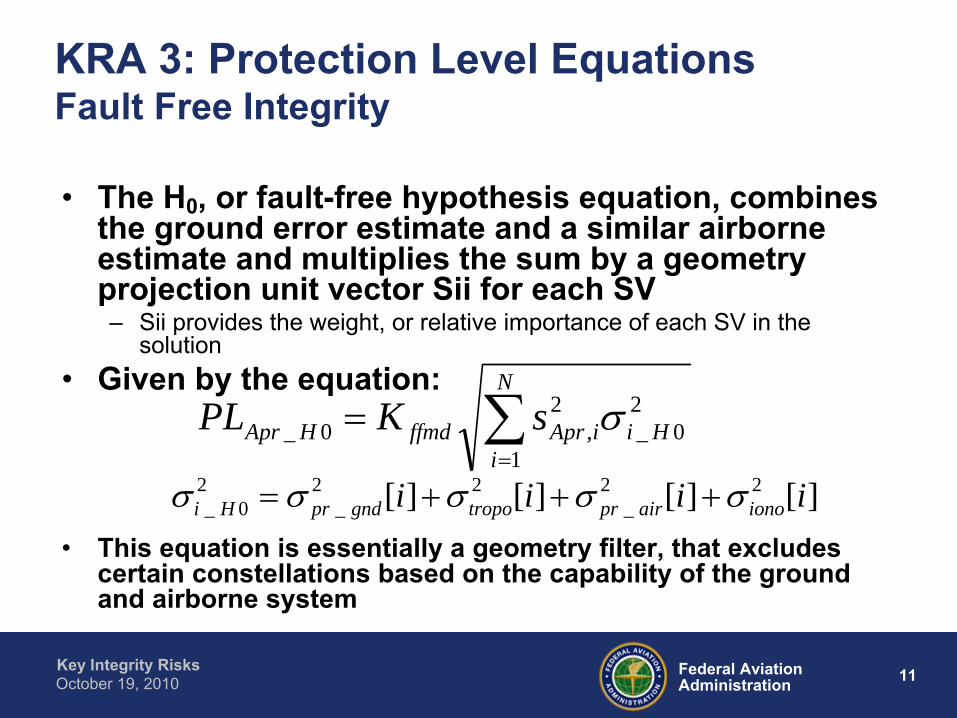
KRA 3: Protection Level Equations Fault Free Integrity
•
Primary LAAS integrity come from the measured statistical performance of the LGF–
Error in the calculation of pseudorange corrections–
The uplink parameter is pr_gnd
, a one sigma estimate of the correction error
–
This parameter is set at installation using a service provider approved procedure
•
Proving the procedure is correct is the responsibility of the manufacturer
•
The LGF must continuously monitor the correction performance to ensure the broadcast pr_gnd
is still accurate
•
Method relies on range domain error analysis to represent position domain error
Key Integrity Risks 11Federal AviationAdministrationOctober 19, 2010
KRA 3: Protection Level Equations Fault Free Integrity
•
The H0
, or fault-free hypothesis equation, combines the ground error estimate and a similar airborne estimate and multiplies the sum by a geometry projection unit vector Sii
for each SV
–
Sii
provides the weight, or relative importance of each SV in the solution
•
Given by the equation:
•
This equation is essentially a geometry filter, that excludes certain constellations based on the capability of the ground and airborne system
N
iHiiAprffmdHApr sKPL
1
20_
2,0_
][][][][ 22_
22_
20_ iiii ionoairprtropogndprHi

Key Integrity Risks 12Federal AviationAdministrationOctober 19, 2010
KRA 3: Corrected Pseudorange Error
•
Data and analysis must show that the value selected for pr_gnd
is appropriate for any user–
Must include non-Gaussian characteristic present in the observed or expected distributions
–
Must include consideration of seasonal changes, environmental changes
•
May be characterized by long-term data collection with test systems•
A methodology must be established to approve installations in a reasonable period of time
•
Sigma Monitor required (KRA 6) to protect against sudden changes–
Must take into account changes in the orbital tracks of the ranging sources
•
A GPS signal model capable of producing predicted errors based on the installed environment is required to augment collected performance data where no SV measurements are available
Key Integrity Risks 13Federal AviationAdministrationOctober 19, 2010
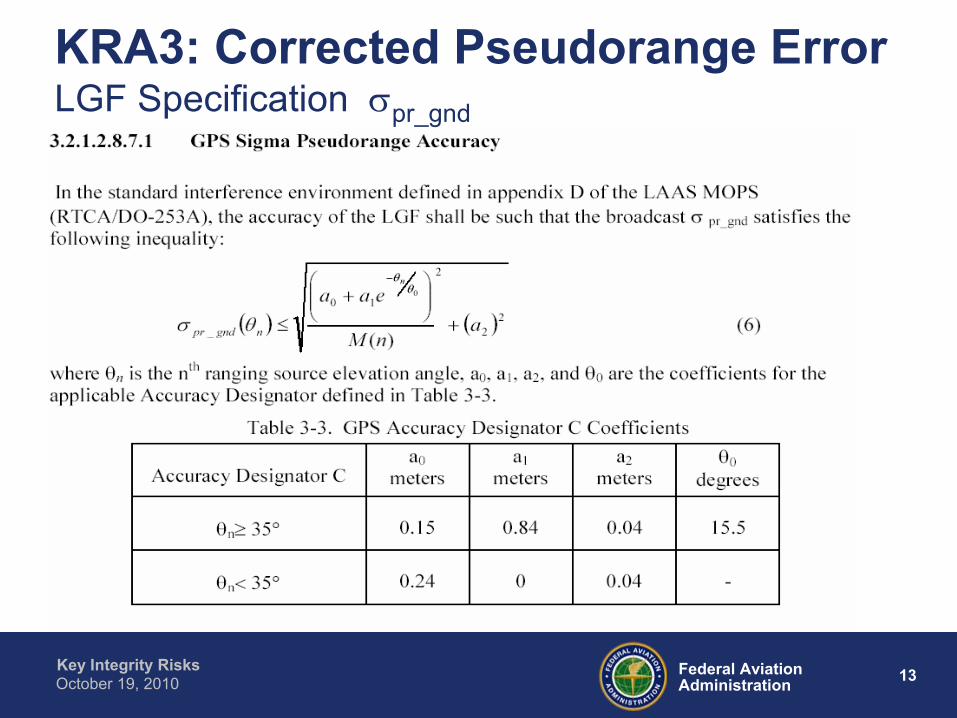
KRA3: Corrected Pseudorange Error LGF Specification
pr_gnd
Key Integrity Risks 14Federal AviationAdministrationOctober 19, 2010
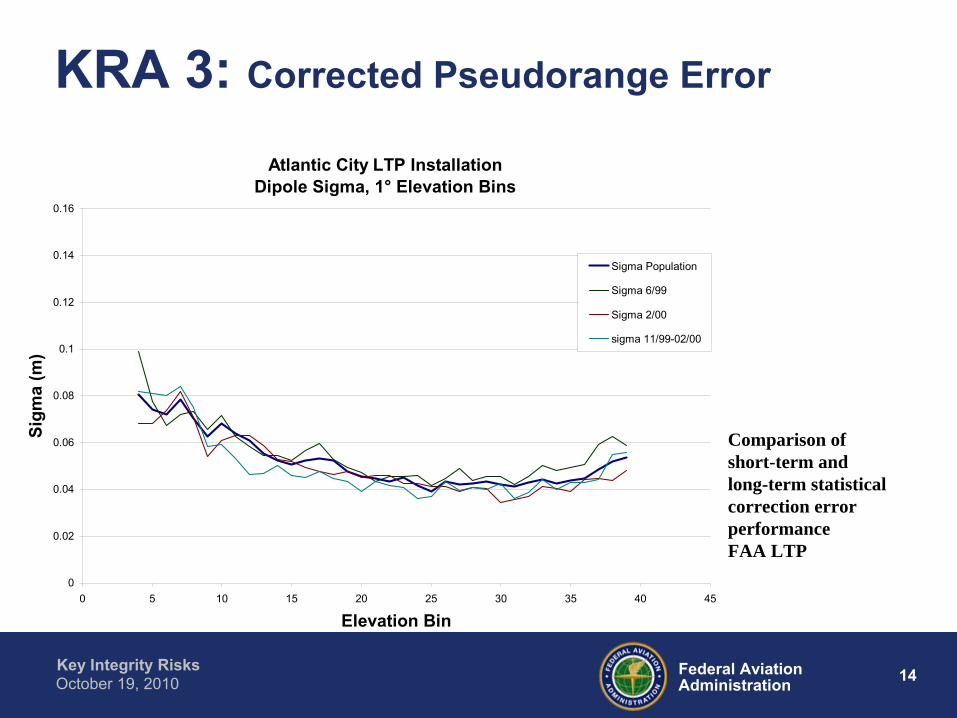
KRA 3: Corrected Pseudorange Error
Atlantic City LTP InstallationDipole Sigma, 1° Elevation Bins
0
0.02
0.04
0.06
0.08
0.1
0.12
0.14
0.16
0 5 10 15 20 25 30 35 40 45
Elevation Bin
Sigm
a (m
)
Sigma Population
Sigma 6/99
Sigma 2/00
sigma 11/99-02/00
Comparison ofshort-term andlong-term statistical correction error performanceFAA LTP
Key Integrity Risks 15Federal AviationAdministrationOctober 19, 2010
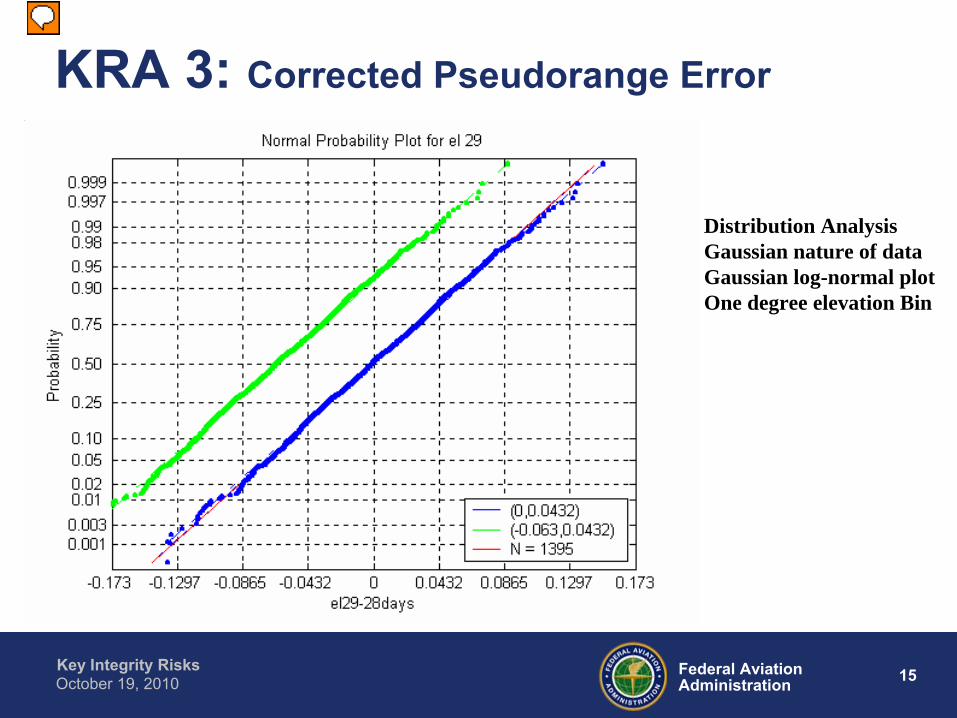
KRA 3: Corrected Pseudorange Error
Distribution AnalysisGaussian nature of dataGaussian log-normal plotOne degree elevation Bin

Key Integrity Risks 16Federal AviationAdministrationOctober 19, 2010
KRA 3: Corrected Pseudorange Error
Distribution AnalysisNon-Gaussian dataGaussian log-normal plotOne degree elevation Bin

Key Integrity Risks 17Federal AviationAdministrationOctober 19, 2010
KRA 4: Non-Zero Mean Errors
•
LAAS integrity parameters represent pseudorange correction errors as zero-mean Gaussian distributions
•
Error sources that may cause non-zero mean errors must be calibrated or proven insignificant–
Common-mode ground reflection mitigated by siting
•
Multipath limiting antenna (MLA) technology is used to mitigate ground multipath –
MLA code and carrier phase center biases have proven difficult to calibrate
Key Integrity Risks 18Federal AviationAdministrationOctober 19, 2010
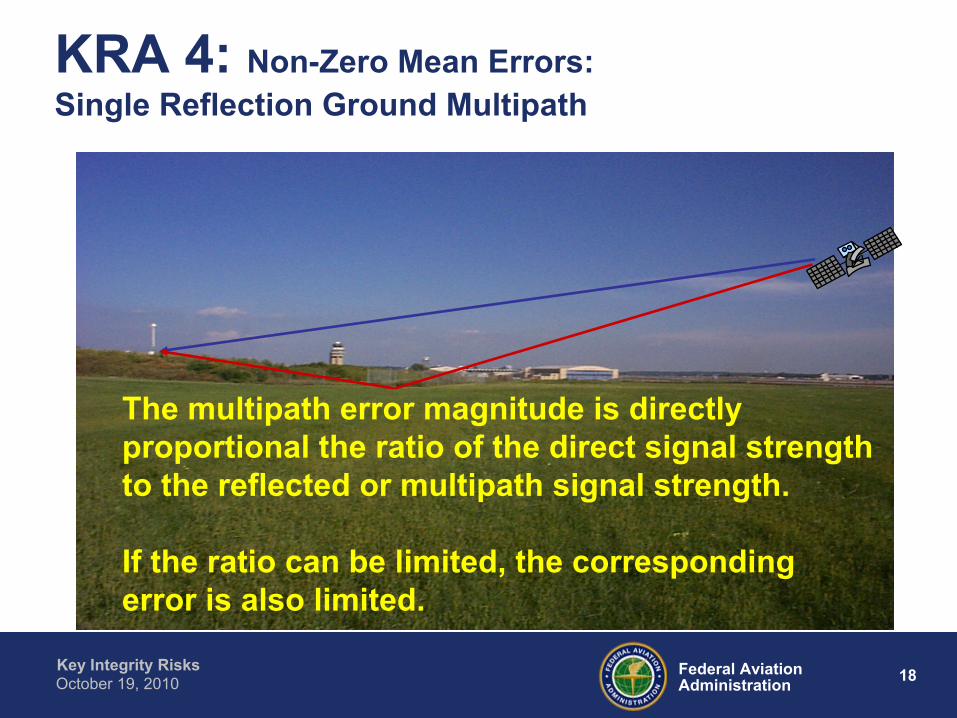
KRA 4: Non-Zero Mean Errors: Single Reflection Ground Multipath
The multipath error magnitude is directly proportional the ratio of the direct signal strength to the reflected or multipath signal strength.
If the ratio can be limited, the corresponding error is also limited.
Key Integrity Risks 19Federal AviationAdministrationOctober 19, 2010
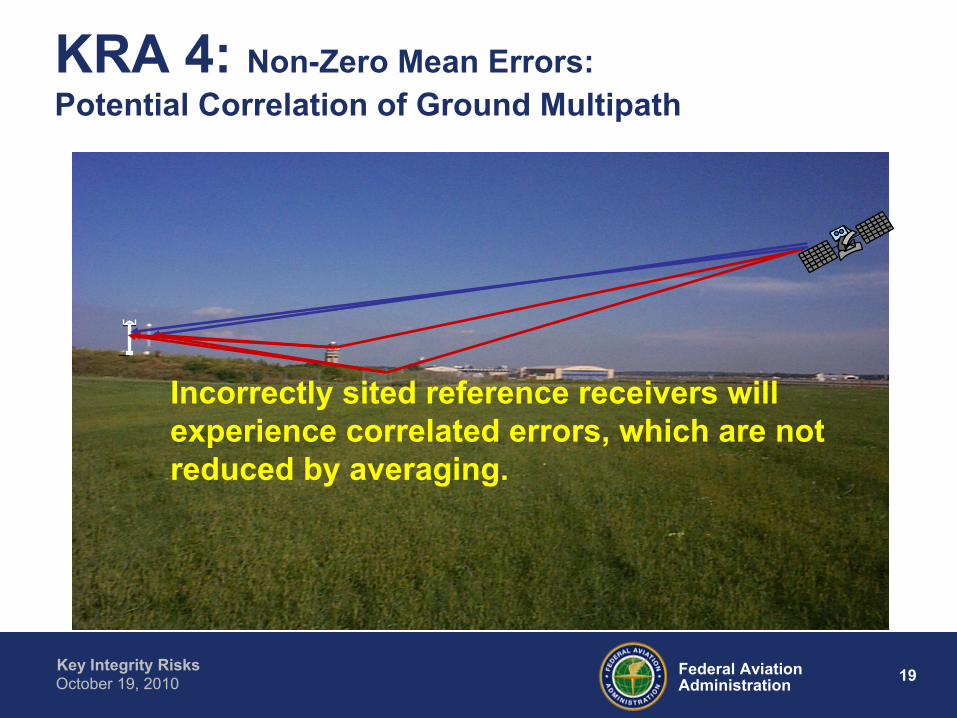
KRA 4: Non-Zero Mean Errors: Potential Correlation of Ground Multipath
19
Incorrectly sited reference receivers will experience correlated errors, which are not reduced by averaging.

Key Integrity Risks 20Federal AviationAdministrationOctober 19, 2010
20

Key Integrity Risks 21Federal AviationAdministrationOctober 19, 2010
KRA 4: Non-Zero Mean Errors Az/El Characterization
Sky Plot view of LTP observedErrorsSingle Reference02/26/01
Typical Variation of observed errors

Draft/2005Page 22ZETA ASSOCIATES
025/049 on LT-3
Key Integrity Risks 23Federal AviationAdministrationOctober 19, 2010
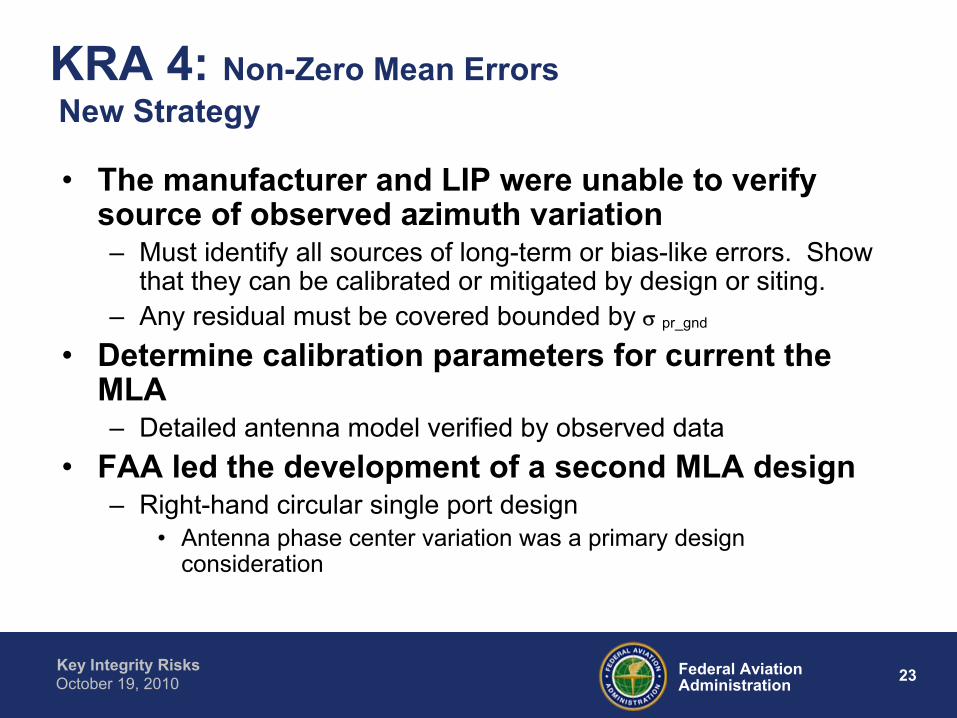
KRA 4: Non-Zero Mean Errors New Strategy
•
The manufacturer and LIP were unable to verify source of observed azimuth variation–
Must identify all sources of long-term or bias-like errors. Show that they can be calibrated or mitigated by design or siting.
–
Any residual must be covered bounded by
pr_gnd
•
Determine calibration parameters for current the MLA–
Detailed antenna model verified by observed data•
FAA led the development of a second MLA design–
Right-hand circular single port design•
Antenna phase center variation was a primary design consideration
Key Integrity Risks 24Federal AviationAdministrationOctober 19, 2010
KRA 4: BAE Antenna Results
•
BAE prototype antenna delivered on 12/15/2006
•
L1/L2/L5 single port design MLA •
Right-hand circular element design–
Potential siting advantages
•
Results of field testing with the LTP look very good
Key Integrity Risks 25Federal AviationAdministrationOctober 19, 2010
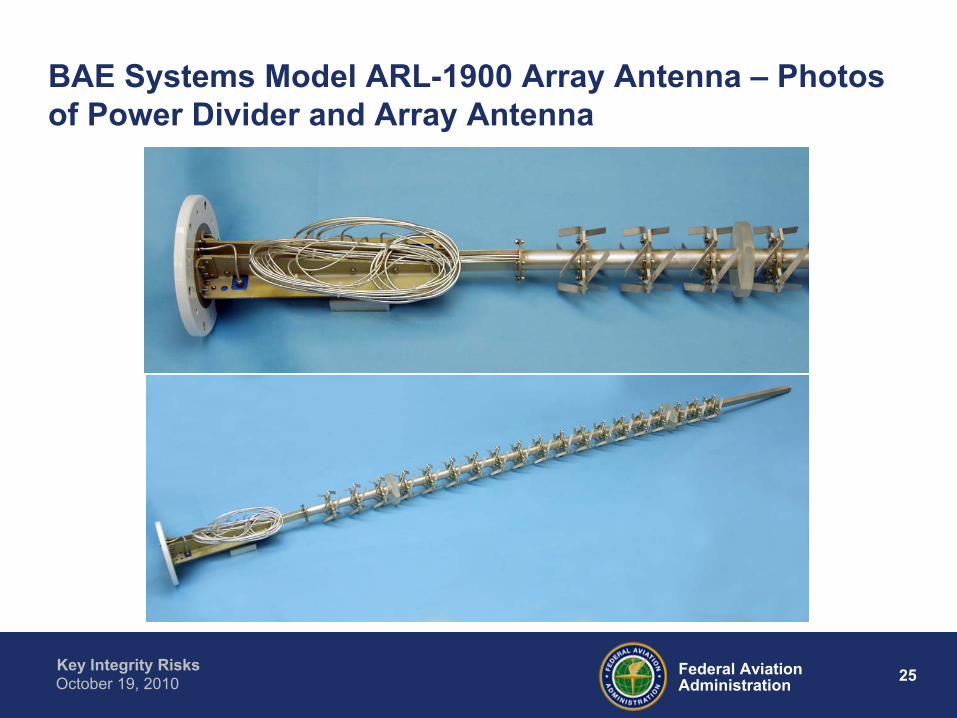
BAE Systems Model ARL-1900 Array Antenna –
Photos of Power Divider and Array Antenna

Key Integrity Risks 26Federal AviationAdministrationOctober 19, 2010

Key Integrity Risks 27Federal AviationAdministrationOctober 19, 2010
KRA 4: BAE Antenna Results C-Curve Performance
Key Integrity Risks 28Federal AviationAdministrationOctober 19, 2010
KRA 6: Sigma Monitor
•
Protection level bounding requires that the broadcast σpr_gnd
represent the current pseudorange correction noise and error statistics
•
Monitoring must be capable of maintaining and confirming the prior probability of 10-5
of latent Reference Receiver faults
Key Integrity Risks 29Federal AviationAdministrationOctober 19, 2010
KRA 6: Sigma Monitor Requirements
•
FAA Non-Fed Specification –
FAA-E-3017 September 29, 2009
•
3.2.1.2.8.7.3 Condition for Valid Sigma Pseudorange Ground
The LGF shall detect conditions relating to the broadcast Sigma Pseudorange Ground that result in noncompliance with the results in Sections 3.1.2.1 and 3.1.2.2. When the increase in system risk associated with degraded performance is minimal (is no greater than one order of magnitude), but exceeds design tolerances, the LGF shall initiate a service alert. The threshold shall be adjustable, with a default value set to achieve a nominal false alert rate of 1x 10⁻⁶ per 15-second interval.

Key Integrity Risks 30Federal AviationAdministrationOctober 19, 2010
KRA 6: Sigma Monitor Requirements
•
3.2.1.2.8.7.3 Condition for Valid Sigma Pseudorange Ground (Continued)When the increase in system risk is not minimal,
the LGF shall exclude the offending RR or generate an alarm, as appropriate, and the alarm threshold shall be adjustable. A service alert shall be issued when a RR is excluded except when a single RR remains, at which time an alarm shall be issued. Self-recovery shall not be applied in either case. Automatic restart shall not be attempted when an alarm condition exists when system risk is not minimal. The rate of false RR exclusion or alarm shall be less than 1 x 10⁻⁷ per 15-second interval.
Key Integrity Risks 31Federal AviationAdministrationOctober 19, 2010
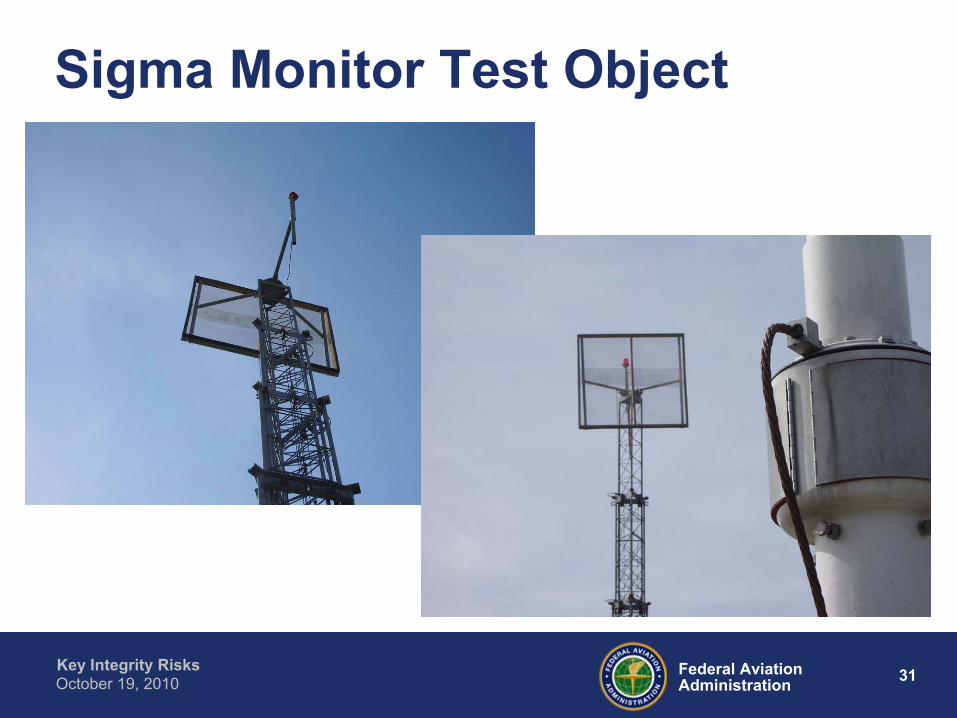
Sigma Monitor Test Object
Key Integrity Risks 32Federal AviationAdministrationOctober 19, 2010
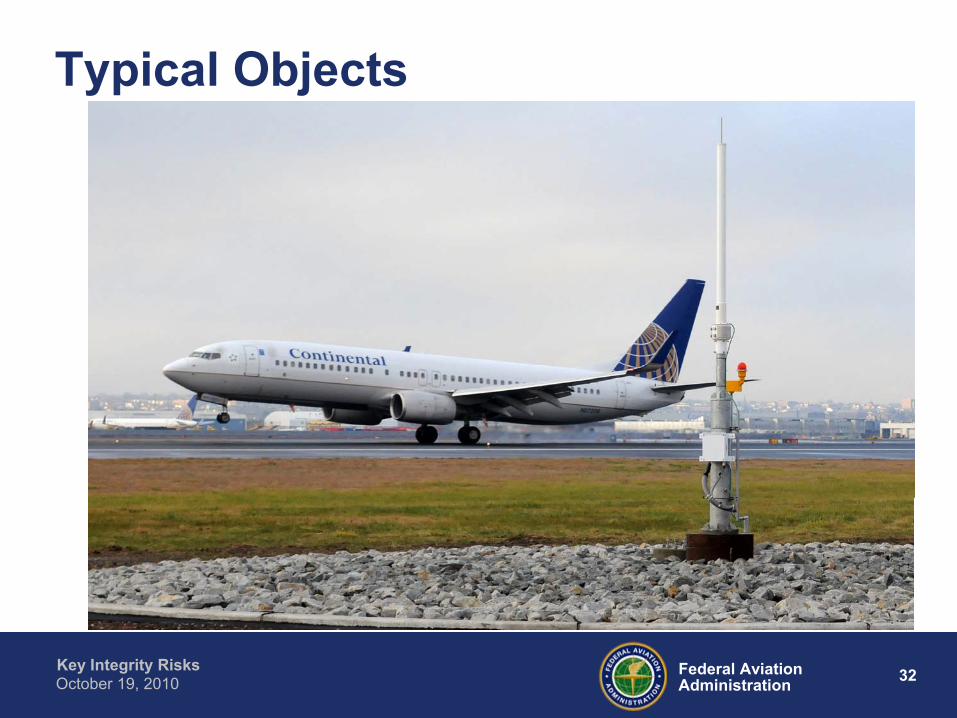
Typical Objects
Key Integrity Risks 33Federal AviationAdministrationOctober 19, 2010
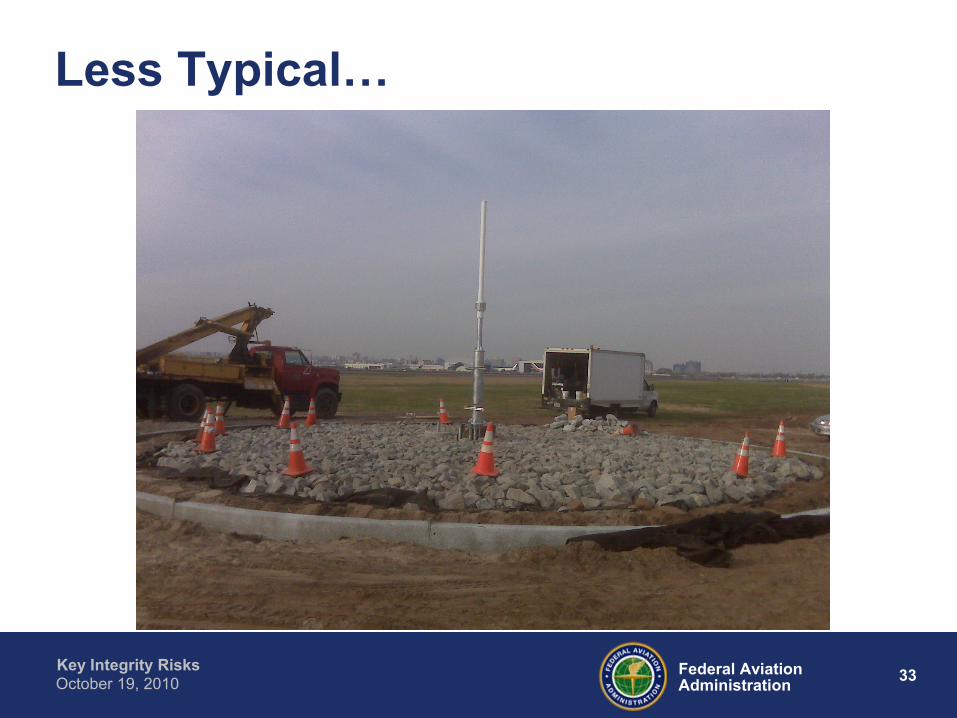
Less Typical…
Key Integrity Risks 34Federal AviationAdministrationOctober 19, 2010
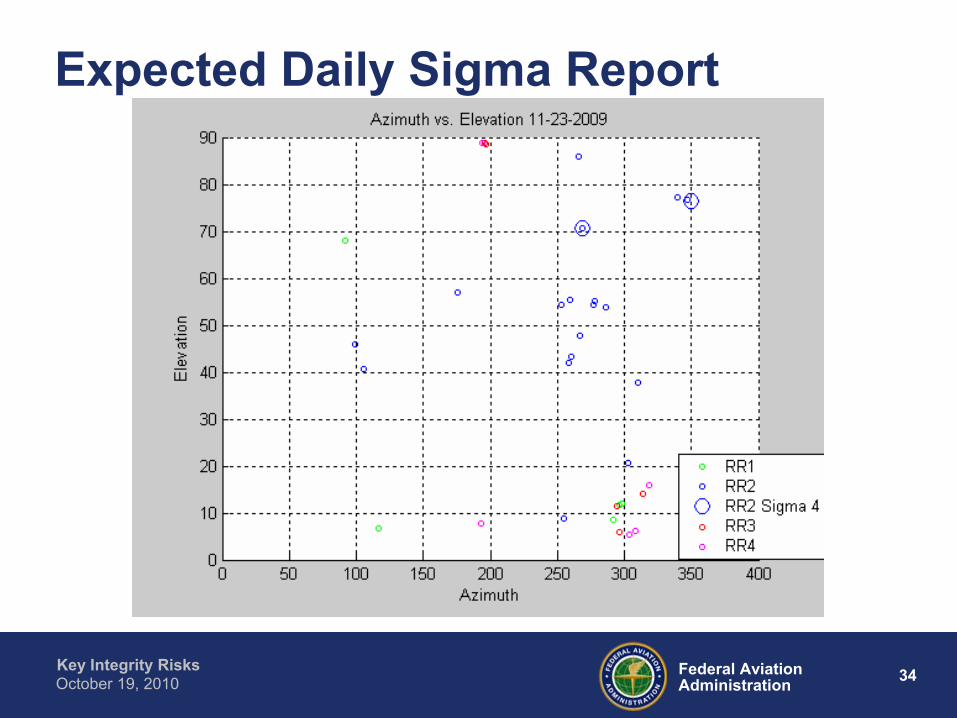
Expected Daily Sigma Report

Key Integrity Risks 35Federal AviationAdministrationOctober 19, 2010
KRA 6: Sigma Monitor Challenges
•
The sigma monitor is a statistical monitor–
The system must collect enough data to accurately characterize the noise, and changes to the noise
–
Trade off areas include sample independence, AZ/EL binning, and required confidence
•
Some expected number of events should occur if the monitors thresholds are designed correctly
•
Activities near the GPS antennas may increase activity
Key Integrity Risks 36Federal AviationAdministrationOctober 19, 2010
KRA 7: Sigma Ionosphere
•
Significant work area for approval–
Ionosphere activity is variable depending on location
•
Ionospheric model and mitigation will be covered in detail in a later briefing
•
Parameters and requirements for KRA 7 are covered in this briefing

Key Integrity Risks 37Federal AviationAdministrationOctober 19, 2010
KRA 7: Integrity Parameters RTCA LAAS CAT I ICD
vert_iono_gradient
2.4.4.2 Message Type 2 Parametersvert_iono_gradient : is the standard deviation of a normal distribution associated with the residual ionospheric uncertainty due to spatial decorrelation such that the uncertainty in the differential ionosphere delay correction is:
where:
FPP = the vertical-to-slant obliquity factor for the given satellite and
Fpp =
Re = radius of the earth = 6378.1363 kmhI = ionospheric shell height = 350 km
= the elevation angle of satellitevert_iono_gradient = parameter provided by the ground subsystem in Message Type 2xair = slant range distance in meters between the current aircraft location and the reference point
= 100 seconds, the time constant of the smoothing filterair = the horizontal speed of the aircraft in meters/sec
21
2cos
1
Ie
e
hRR
airairgradientionovertPPiono xF 2__
Key Integrity Risks 38Federal AviationAdministrationOctober 19, 2010
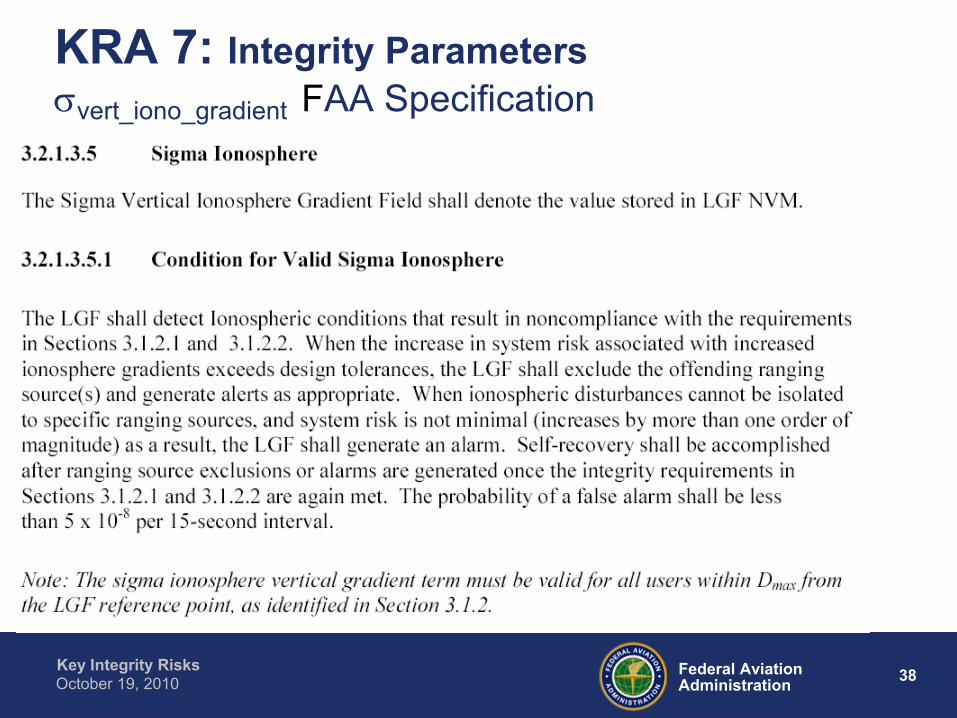
KRA 7: Integrity Parameters vert_iono_gradient
FAA Specification

Key Integrity Risks 39Federal AviationAdministrationOctober 19, 2010
KRA 7: CONUS Ionospheric Anomaly November 20, 2003

Key Integrity Risks 40Federal AviationAdministrationOctober 19, 2010
KRA 7: Ionospheric Anomaly 11/20/2003 LTP Pseudorange Correction
Key Integrity Risks 41Federal AviationAdministrationOctober 19, 2010
KRA 7: Sigma Ionosphere
•
Determine nominal values for vert_iono_gradient
•
Validate bounding performance–
Simulation
•
Develop the treat model for Anomalous Ionospheric events–
Determine what parts of the threat space can be detected or mitigated by existing ground monitors
–
Determine the maximum error that a user may experience during an ionospheric event
–
Develop mitigation methods to provide integrity during ionospheric events

Key Integrity Risks 42Federal AviationAdministrationOctober 19, 2010
KRA 7: Ionospheric Storm Integrity
•
Ionospheric storm activity unobservable to a GBAS station can not be mitigated by detection
•
The GBAS airborne user can be impacted by a storm before the ground facility can see it, and integrity could be compromised–
These cases must be shown to be sufficiently rare, or mitigated•
A solution for the CAT I system was determined–
The results are based on ionospheric storm threat model created from data collected within CONUS and assumptions about how a user will be threatened
–
Other implementers must evaluate their ionospheric environment to ensure that the CONUS threat model contains potential threats in their regions of interest
Key Integrity Risks 43Federal AviationAdministrationOctober 19, 2010
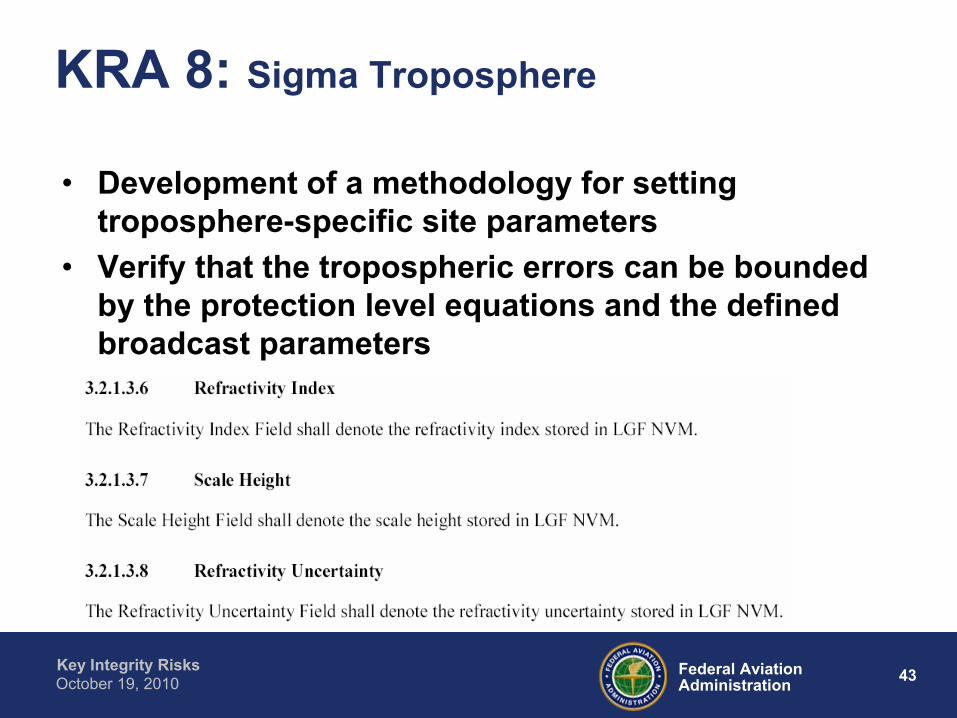
KRA 8: Sigma Troposphere
•
Development of a methodology for setting troposphere-specific site parameters
•
Verify that the tropospheric errors can be bounded by the protection level equations and the defined broadcast parameters

Key Integrity Risks 44Federal AviationAdministrationOctober 19, 2010
KRA 8: Sigma Troposphere
•
Design and Approval Items–
Determine nominal and maximum observed variation of temperature and humidity at selected locations
•
Use the model to simulate maximum expected LAAS errors
–
Determine values for tropospheric parameters which provide integrity for all users
•
Verify with data collection and simulation
–
Gather additional verification data from available public sources

LAAS Tropo Equations
01
)(sin002.010
2
6
0h
h
R ehNTC
01
)(sin002.010
2
6
0h
h
Ntropo eh
Tropospheric Correction (TC)
LAAS TC reduces to zero as h approaches zero
Model only accounts for vertical tropo gradients (h)
Tropospheric Residual Uncertainty (tropo )

Determining The LAAS Tropo Vertical “Threat”
Values
Documentation
RTCA DO-253A + A.J. Van Dierendonck papers
A method for determining the broadcast LAAS Tropo Parameters was
developed
Skidmore, T. and F. van Graas, “An Investigation of Tropospheric Errors on Differential GNSS Accuracy and Integrity,”
ION GNSS 2004, Long Beach, California, September 21-24, 2004
(NR
, h0
) are a function of the following:
Temperature, Pressure, and Relative Humidity
Aircraft and Ground Station Altitudes
(N
) is the 1-sigma error residual of NR
Values determined by actual weather data
Ex. Ohio U. Scalia Laboratory for Atmospheric Analysis

47
Computing The Scale Heights (h0
)
242700
0s
dryhh
213000
0s
wethh
drywetRwetdryR
drywetR
hNhNhhN
h00
000
hs
is the surface height (meters) above Sea Level
NR
is the total refractivity index
NRdry is the refractivity index of the dry component
NRwet is the refractivity index of the wet component

48
Computing Refractivity Indices
wetRdryRR NNN
3.38)273(4475.7
24 10102777.26.77 s
sT
T
s
s
s
sR T
RHxT
PN
Which is now related to surface measurements
(Ts, Ps, RHs) = (To, Po, RHo)

49
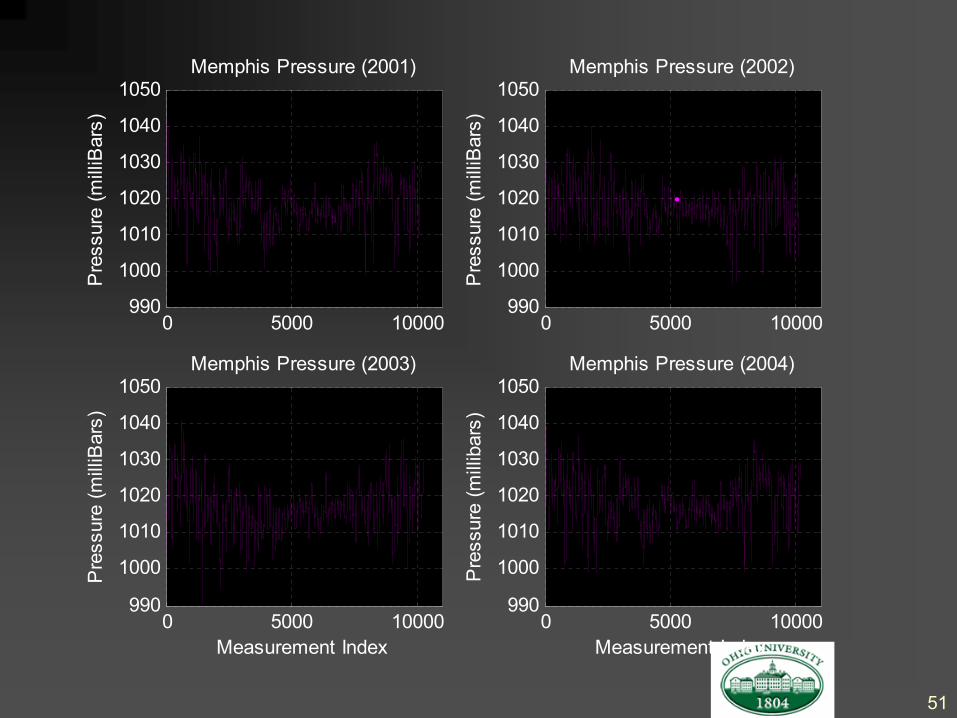
Memphis, Tennessee Weather Data
Source: National Climatic Data Center
NCDC Web Page
http://www.ncdc.noaa.gov/oa/ncdc.html
Integrated Surface Hourly Data
Assume that all data is valid
Not edited for bad measurements and/or outliers
Use Temperature, Dew Point, and Pressure
Relative Humidity computed from Temperature and Dew Point by standard formula(s)

50
0 5000 100000
20
40
60
80
100Memphis Temperature (2001)
Tem
pera
ture
(Deg
rees
F)
0 5000 100000
20
40
60
80
100Memphis Temperature (2002)
Tem
pera
ture
(Deg
rees
F)
0 5000 100000
20
40
60
80
100Memphis Temperature (2003)
Measurement Index
Tem
pera
ture
(Deg
rees
F)
0 5000 100000
20
40
60
80
100Memphis Temperature (2004)
Measurement Index
Tem
pera
ture
(Deg
rees
F)
51
0 5000 10000990
1000
1010
1020
1030
1040
1050Memphis Pressure (2001)
Pre
ssur
e (m
illiB
ars)
0 5000 10000990
1000
1010
1020
1030
1040
1050Memphis Pressure (2002)
Pre
ssur
e (m
illiB
ars)
0 5000 10000990
1000
1010
1020
1030
1040
1050Memphis Pressure (2003)
Measurement Index
Pre
ssur
e (m
illiB
ars)
0 5000 10000990
1000
1010
1020
1030
1040
1050Memphis Pressure (2004)
Measurement Index
Pre
ssur
e (m
illib
ars)

52
0 5000 100000
20
40
60
80
100Memphis Relative Humidity (2001)
Rel
. Hum
. (%
)
Mean = 66.3 %0 5000 10000
0
20
40
60
80
100Memphis Relative Humidity (2002)
Rel
. Hum
. (%
)
Mean = 69.4 %
0 5000 100000
20
40
60
80
100Memphis Relative Humidity (2003)
Measurement Index
Rel
. Hum
. (%
)
Mean = 69.1 %0 5000 10000
0
20
40
60
80
100Memphis Relative Humidity (2004)
Measurement Index
Rel
. Hum
. (%
)
Mean = 66.1 %
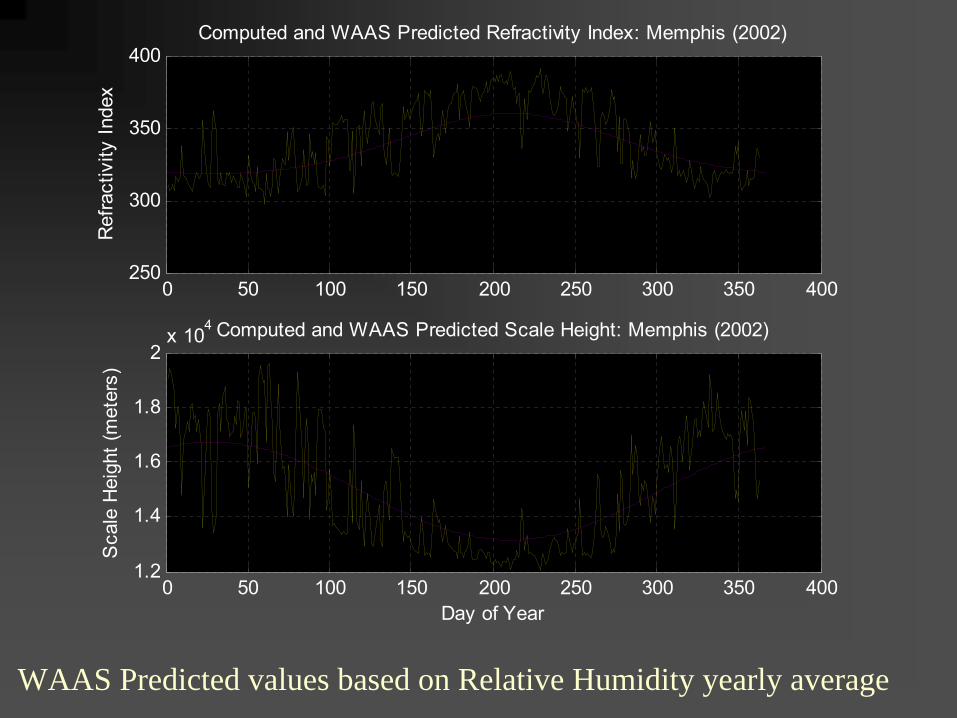
WAAS Predicted values based on Relative Humidity yearly average
0 50 100 150 200 250 300 350 400250
300
350
400Computed and WAAS Predicted Refractivity Index: Memphis (2002)
Ref
ract
ivity
Inde
x
0 50 100 150 200 250 300 350 4001.2
1.4
1.6
1.8
2x 10⁴ Computed and WAAS Predicted Scale Height: Memphis (2002)
Day of Year
Sca
le H
eigh
t (m
eter
s)

Key Integrity Risks 54Federal AviationAdministrationOctober 19, 2010
KRA 8: Design Recommendation
•
TC and tropo
(vertical) are fairly insensitive to seasonal variations in Refractivity Index and Scale Height–
Worst Case (based on Refractivity Index)
•
5 degree Elevation Satellite•
6 cm at a Refractivity Index Delta Extreme of 100
•
Recommendation–
Use single Year of Weather Data to compute Refractivity Index, RI Uncertainty, & Scale Height
–
Set these as constant values in LAAS•
Values fit in ICD data fields

Key Integrity Risks 55Federal AviationAdministrationOctober 19, 2010
KRAs 9 and 10: Ephemeris Errors: Types B, A1,
and A2
•
KRA 9: Type B ephemeris failure defined as an anomalous broadcast ephemeris not proceeded by a SV maneuver
•
KRA 10: Type A1 ephemeris failure defined as an anomalous broadcast ephemeris proceeded by a scheduled SV maneuver
•
Challenge is detecting SV position errors with relatively short LAAS baselines–
On-airport installations

Key Integrity Risks 56Federal AviationAdministrationOctober 19, 2010
KRAs 9 and 10:
Integrity Parameters Ephemeris Decorrelation Parameter
Key Integrity Risks 57Federal AviationAdministrationOctober 19, 2010
KRAs 9 and 10: LAAS Integrity Protection Level Equations VPLE
•
LAAS integrity for SV position errors comes from the estimate of the ephemeris error and its projection into the position solution–
Ephemeris error source is the GPS navigation data transmitted from the SV, or from a maneuver.
–
The uplink parameters are the p-values–
These are measures of the uncertainty remaining after an ephemeris test has been performed
•
Almanac/Ephemeris tests provide little proof•
Yesterday’s and Today’s (YE-TE) tests provide good confidence•
WAAS broadcast ephemeris errors greatly reduce required p-
value
•
A protection level for each satellite is calculated

Key Integrity Risks 58Federal AviationAdministrationOctober 19, 2010
VPLE Equation
LGF broadcasts “P-value” for each approved GPS satellite.
SV index
N
kkkmd
j
ejj SK
RMDExSVPLe
e1
22,3,3
From weighted p-inverse of user geometry matrix
Differential ranging error variance
Missed-detection multiplier
LGF-User Distance
•The lower the MDE, the larger the LGF-User distance can be without availability impact.
Key Integrity Risks 59Federal AviationAdministrationOctober 19, 2010
KRAs 9 and 10 Ephemeris Monitoring
•
Ephemeris A2 failures were considered sufficiently improbable to disregard for CAT I GBAS–
An A2 failure is an un-annunciated movement of a satellite
•
On April 10, 2007, PRN 18 was repositioned by the GPS space segment without indicating bad health status–
The movement was properly annunciated by a NANU
•
Complete details were published in the GPS PAN report, Aug 2007–
www.nstb.gps.tc.faa.gov

Key Integrity Risks 60Federal AviationAdministrationOctober 19, 2010
Notice Advisory to NAVSTAR Users (NANU)

Key Integrity Risks 61Federal AviationAdministrationOctober 19, 2010
Observed GPS SPS Errors April 10, 2007

Key Integrity Risks 62Federal AviationAdministrationOctober 19, 2010
KRAs 9 and 10: Ephemeris Monitoring Mitigation
•
Several new tests were added to the design that can be used to detect satellite displacement errors–
The tests address the observed case without relying on monitoring NANUs
–
Also addresses problematic corner cases of the ephemeris B and A1 mitigations that were uncovered in the HMI analysis
–
Final simulations were performed to show that all data failures following a maneuver were detected
•
Including maneuvers out of view of the GBAS

Key Integrity Risks 63Federal AviationAdministrationOctober 19, 2010
KRA 11: Signal Deformation Monitor
•
Signal deformation was shown to cause non-
differentially correctable errors when user and reference GPS reception techniques differed
•
Although there is a well-developed, internationally coordinated threat model, several implementation issues remained–
Proof of acceptable false alarm and missed detection performance
•
Characterize the performance in the presence of multipath•
Develop the IF filter model to incorporate variation over the range of expected nominal receiver production
–
Demonstration and analysis to prove that all transient modes are
protected within the existing threat space
–
Demonstrate the implementation can be adequately tested

Key Integrity Risks 64Federal AviationAdministrationOctober 19, 2010
KRA 11: Signal Deformation Monitor
0 1 2 3 4 5 6 7 8 9 10
-2
-1
0
1
2
chips
Threat Model ANominal C/A
-2 -1.5 -1 -0.5 0 0.5 1 1.5 2
0
0.5
1
chips
Nor
mal
ized
Am
plitu
de Threat Model ANominal C/A
0 1 2 3 4 5 6 7 8 9 10
-2
-1
0
1
2
chips
-2 -1.5 -1 -0.5 0 0.5 1 1.5 2
0
0.5
1
chips
Nor
mal
ized
Am
plitu
de Threat Model BNominal C/A
0 1 2 3 4 5 6 7 8 9 10
-2
-1
0
1
2
chips-2 -1.5 -1 -0.5 0 0.5 1 1.5 2
0
0.5
1
chips
Nor
mal
ized
Am
plitu
de Threat Model CNominal C/A

Key Integrity Risks 65Federal AviationAdministrationOctober 19, 2010
KRA 11: Signal Deformation Monitoring Natural Biases
• Satellite signals can be distorted by failures such that differential corrections will have errors for some set of users
• Natural (nominal, non-faulted) deformations exist–
The airborne user design space is limited, any difference between the ground receiver and the user receiver implementation will cause errors that must be bounded
–
Natural bias errors must be bounded by σpr_gnd

Key Integrity Risks 66Federal AviationAdministrationOctober 19, 2010
3.2 7.2 11.2 15.2 19.2 23.2 27.2 31.2 35.2 39.2 43.2 47.2 51.2 55.2 59.2 63.2 67.2 71.2 75.2
0.5
1
1.5
2
2.5
3
3.5
4
4.5
5
5.5
Block II Block IIA Block IIR
02 19 17 15 23 25 27 01 22 31 09 03 13 11 20 28 14 18 16
Estim
ated
(n
s)
PRN (In chronological order of launch date, within each group, oldest to newest)
Nominal Signal Deformation (Digital Only) -
DataEstimates of C/A code
Sorted by SV Block Type (II, IIA, IIR)
Current ranging codes may have up to ±10ns of modeled digital distortion.
~4.5ns on PRN14
Courtesy: A. Mitelman
Key Integrity Risks 67Federal AviationAdministrationOctober 19, 2010
KRA 11: SDM Natural Bias Mitigation
•
Satellites introduced into the constellation must be evaluated against the natural bias level protected by σpr_gnd–
Relationship between SDM test statistic biases and user errors is being more precisely simulated
•
Satellites with excessive natural bias must be additionally inflated or excluded–
An additional test was added to the design to monitor the natural bias levels and perform this exclusion
•
Details of a bias-monitoring test statistic and implementation are design-specific
Key Integrity Risks 68Federal AviationAdministrationOctober 19, 2010
KRA 12: Low Power
•
The LGF must detect if the broadcast power of any ranging source is transmitting less that the specified minimum power
•
While it may be able possible to adequately track this signal, it is an indication the SV has other failures
•
Impact on other monitors must be determined–
Low SV power is difficult to distinguish from other potential threats
•
RFI•
Signal fading due to multipath
•
LGF monitors for cross-correlation errors that may result from large relative power differences only
Key Integrity Risks 69Federal AviationAdministrationOctober 19, 2010
KRA 13: Code/Carrier Divergence
•
The LGF must detect if the code and carrier signals broadcast signal from the ranging source are incoherent–
While the ground pseudorange smoothing filter is specified, the airborne is not
–
Filter and timing differences will produce non correctable errors in the presence of divergence
–
Nominal divergence is specified and must be bounded in σpr_gnd

70
Example 1st
Order Filter Responses
0 200 400 600 800 10000
0.5
1
1.5
2
2.5
tim e (sec)
dive
rgen
ce tr
acki
ng e
rror
(m)
100 sec 108.8 sec
70 sec
30 sec
0 sec
130 sec
input div. rate = 0.018 m/s
1st
Order Time Invariant (TI) Filter Response
Key Integrity Risks 71Federal AviationAdministrationOctober 19, 2010
KRA 14: Excessive Acceleration
•
The LGF must detect if the acceleration calculated from the range measurements from each SV is less than the maximum expected
•
Selective Availability (SA) maximum specified rate•
Appropriate non-SA rate if appropriate
–
Excessive acceleration is difficult to distinguish from other potential threats
•
Scintillation•
Ionospheric activity
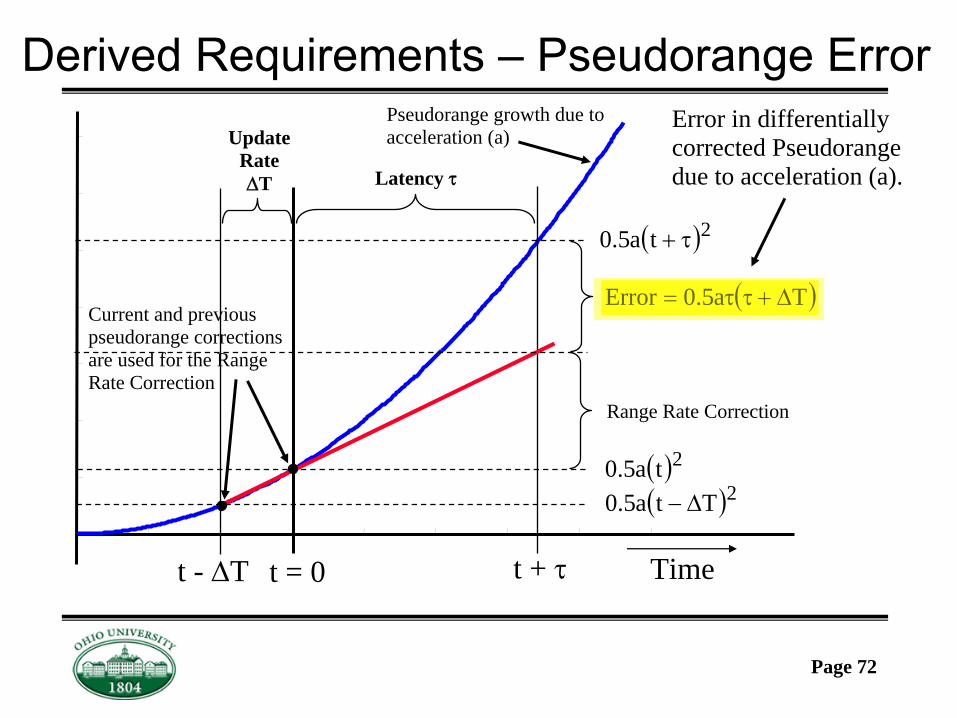
Page 72
Derived Requirements –
Pseudorange Error
2ta5.0
Latency
Update Rate T
t = 0 t + t - T
2ta5.0 2Tta5.0
Time
Ta5.0Error
Error in differentially corrected Pseudorange due to acceleration (a).
Range Rate Correction
Current and previous pseudorange corrections are used for the Range Rate Correction
Pseudorange growth due to acceleration (a)

Key Integrity Risks 73Federal AviationAdministrationOctober 19, 2010
KRA 15: Executive Monitor
•
The executive monitor must be capable of distinguishing between reference receiver failures and ranging source failures–
The execution and priority of the fault monitors must be determined such that erroneous data is not passed into additional monitor streams
Key Integrity Risks 74Federal AviationAdministrationOctober 19, 2010
Summary
•
LAAS uses a number of protection level equations that include statistical and instantaneous measures of system performance–
The LAAS Ground Facility is required to monitor the validity of the statistical parameters it broadcasts
•
The integrity proof must examine the details of the integrity parameters used in these protection levels and the combined coverage of the multiple protection levels
•
The complete details of the integrity proof are provided in the SLS-4000 HMI Document–
Separate presentation